
Effects of Psychosocial Characteristics of Middle School Students on High School Grades and On-Time Graduation
ACT WORKING PAPER 2015-07
Joann L. Moore, PhD Jason D. Way, PhD Alex Casillas, PhD Jeremy Burrus, PhD Jeff Allen, PhD Mary Ann Hanson, PhD July, 2015
ACT Working Paper Series ACT working papers document preliminary research. The papers are intended to promote discussion and feedback before formal publication. The research does not necessarily reflect the views of ACT.
This form of the manuscript is under review at European Journal of Personality Assessment. It has not yet been accepted for publication.

Joann Moore is a research scientist in Statistical and Applied Research specializing in prediction of secondary and postsecondary outcomes from academic and non-cognitive factors.
Jason Way is a research psychologist in Career Transitions Research. He researches behavioral and psychosocial skills, including their relevance to important academic and work outcomes.
Alex Casillas is a senior research psychologist in Research for Assessment and Learning specializing in assessment design and behavioral predictors of performance and persistence.
Jeremy Burrus is a principal research scientist in the Career Transitions Research department working on the assessment of noncognitive skills.
Jeff Allen is a statistician in the Research division at ACT. He specializes in longitudinal research linking test scores to educational outcomes and student growth models.
Mary Ann Hanson is director of Career Transitions Research. She is involved in research and development for a wide variety of career- and behavior-related solutions across education and work.

Abstract
Research has shown that psychosocial factors (PSFs) have a positive impact on high school
outcomes, including grades and persistence (e.g., Farrington et al., 2012). However, few
longitudinal studies have examined the nature of these relationships. We report on a longitudinal
study of middle school students followed through high school completion. We found that high
school GPA mediates the effects of prior academic achievement, demographics, and most PSFs
on on-time high school graduation. A measure of self-regulation had a significant direct effect
on on-time graduation. The results underscore the importance of PSFs in predicting academic
outcomes, even after accounting for prior achievement and demographics. Implications of
examining PSFs early in students’ academic progression are discussed.

Effects of psychosocial characteristics of middle school students on high school grades and on-time graduation
Although the situation has improved in recent years, on-time high school graduation
remains of major concern in the U.S., with over 20% of entering public high school students
failing to earn a high school diploma in four years (Aud et al., 2013). In some states and
communities, these rates exceed 50% of all entering 9th grade students. In the discussion that
follows, we use the term “dropout” to refer to the situation where a student’s enrollment in high
school is suspended before they earn a diploma. While on-time graduation is not the direct
opposite of dropout, the two outcomes are closely related and the dropout literature is relevant
for understanding on-time graduation.
Over the past decade, research has shown that measuring critical psychosocial factors
(PSFs; e.g., motivation, social engagement, self-regulation) can increase schools’ abilities to
identify and intervene with students at risk of dropout or delayed graduation (e.g., Farrington et
al., 2012; Zins, Bloodworth, Weissberg, & Walberg, 2004). As the dropout process begins well
before students actually decide to leave high school (e.g., Rumberger & Lim, 2008), research
into early indicators of dropout or delayed graduation is needed. Further, research should focus
not only on academic indicators, but psychosocial indicators as well.
Early Warning for Dropout
Research has demonstrated that high school dropout can be predicted well before students
enter high school. For example, in public schools in the Northeastern U.S., an early warning
system to identify 6th grade students at risk to drop out in high school was created (Balfanz,
Herzog, & Mac Iver, 2007; Neild, Balfanz, & Herzog, 2007). Indicators included grades,
attendance, and disciplinary records. Together these indicators identified 60% of the students

who did not graduate within one year of expected graduation. Further, several large-scale
longitudinal studies have found that at ages 2, 6, 12, and 14, future high school dropouts were
much more likely than graduates to have: parents who were divorced or separated; lower
achievement test scores; and, higher scores on measures of behavioral problems (see Heckman,
Humphries, & Kautz, 2014 for a review). This research clearly shows that academic
performance and behavioral indicators measured during middle school can be effective
predictors of on-time high school graduation. Many of these indicators (e.g., attendance,
discipline, behavior problems) are related to PSFs.
Psychosocial Factors (PSFs)
Research has examined the effects of PSFs on academic performance and persistence,
highlighting a range of constructs, including self-efficacy, motivation, locus of control, attitude
toward learning, and persistence (e.g., Grigorenko et al., 2009; Poropat, 2009; Robbins et al.,
2004). Other studies have found that PSFs provide incremental validity over traditional
predictors of academic performance such as achievement tests and demographics (e.g., Casillas
et al, 2012; Zins et al. 2004). Analogous results have been obtained in the postsecondary realm
(e.g., Robbins, Allen, Casillas, Peterson, & Le, 2006), as well as for work outcomes such as job
performance and retention (e.g., Barrick & Mount, 1991; Judge & Ilies, 2002).
One assessment of PSFs is ACT Engage, a low-stakes, self-report instrument designed to
measure ten PSFs related to academic performance and persistence (Casillas et al., 2011), which
can be grouped into three broad behavioral domains: motivation, social engagement, and self-
regulation (see Table 1). Motivation refers to the mechanism by which individuals act on
prescribed behaviors and implement learning activities and/or pursue goals, social engagement
refers to an individual’s skills in engaging the social environment in ways that support and

reinforce his or her learning activities, and self-regulation refers to the ability to manage or
regulate attitudes, behaviors, and feelings that affect students’ receptiveness to, and
implementation of, learning activities (Robbins et al., 2009).
Casillas et al. (2012) conducted a longitudinal study to validate the ACT Engage
instrument for middle school students, using a large (N~5,000), longitudinal dataset of students
followed from middle school through the first year of high school. They found that PSFs
measured by Engage provided incremental validity above achievement tests and prior grades
when predicting early high school grade point average (HSGPA) and that the variance accounted
for was comparable to that of prior grades.
Current Study
This study builds on the Casillas et al. (2012) study, following the same sample after
additional years of data collection to examine effects of PSFs on HSGPA and on-time
graduation. A path model to examine direct and indirect effects of PSFs on intermediate (grades)
and more distal (graduation) outcomes is proposed, with grades serving as a potential mediator
of the relationship between PSFs and on-time graduation (see Figure 1). This allows for the
examination of differential effects of the PSFs and other predictors on both outcomes.
Specifically, the research questions addressed are:
RQ1: Is there evidence of effects of PSFs on HSGPA, after controlling for prior academic
achievement and student and school demographics?
RQ2: Is there evidence of effects of PSFs on on-time high school graduation, after
controlling for prior academic achievement, student and school demographics, and HSGPA?
This question examines whether PSFs have direct effects on on-time graduation and whether
the relationship is mediated by HSGPA.

RQ3: How do effects on on-time high school graduation vary by PSF? This question
examines which PSFs have the largest effects on on-time graduation.
Method
A prospective sample of 4,660 middle-school students from 24 schools in 13 districts
throughout the U.S. completed PSF and standardized achievement tests during the fall of 2006
when most students were in 8th grade. The 24 schools varied with respect to percentage of
students eligible for free or reduced lunch (mean=53%, minimum=29%, maximum=97%) and
percentage of students in underrepresented minority groups (mean=27%, minimum=1%,
maximum=97%). Follow-up data were collected each fall (2007-2011), with districts providing
data annually on GPA, absences, and enrollment status. The last wave of data was collected
after most students would have graduated from high school on time.
Measures
Academic achievement in middle school was measured using ACT Explore, a
standardized achievement test typically taken in 8th or 9th grade, which includes measures of
English, mathematics, reading, and science (ACT, 2013). Subject area scores range from 1-25
and the Composite score is calculated as the mean of the four subject area scores. Explore is
intended for all students in grades 8 and 9 and focuses on the knowledge and skills that are
usually attained by grade 8.
PSFs were measured using ACT Engage Grades 6–9. The instrument contains 97 items
scored using a 6-point Likert-type scale ranging from strongly disagree to strongly agree and
nine yes/no items; the 106 items form 10 scales corresponding to each PSF (see Table 1 for scale
names, definitions, and example items). The ten scales demonstrate moderate to high internal
consistency reliabilities (range α=.81–.90; Mdn α=.87; Casillas et al., 2011).

School demographic information included percent of students eligible for free or reduced
lunches (FRL), percent minority (African American, Hispanic, and American Indian), and size
(defined as the average cohort size across grade levels served by the school). School
demographics were obtained from the Common Core of Data (nces.ed.gov/ccd). Student
demographic variables included gender and indicators for race/ethnicity categorized as white,
African American, Hispanic, and other (American Indian, Asian, two or more races, and other
were combined due to small sample sizes).
Outcomes. Mid-point HSGPA was defined as students’ end-of-10th grade cumulative
GPA. If a student’s 10th grade cumulative GPA was missing, then his/her end-of-9th grade
cumulative GPA was used instead. Students were classified as having graduated high school on
time if they had graduated within four years of starting high school and were classified as
unsuccessful if they had dropped out, were expelled, had earned a General Educational
Development (GED) high school equivalency certificate, or were still enrolled after four years of
starting high school. Only students for whom on-time graduation could be determined were
included in the analyses. Two schools were excluded from the analyses (n=192) because the
final wave of data collection was unavailable. A small number of students (approximately 1%)
were in 7th grade in fall of 2006, and therefore may have been in 12th grade in the fall of 2011
during the last wave of data collection; if such a student was enrolled in fall 2011, they were
excluded from the analysis. Students who were classified as deceased (n=4), home schooled
(n=84), not enrolled–unknown (n=382), or transferred (n=709), were excluded from the analyses
because on-time graduation was undefined or unknown. Overall, 87% of students in the analysis
sample were classified as graduated on time.
Data Cleaning

Records were also excluded if a student did not complete any of the Engage scales (n=9)
or did not take the ACT Explore test (n=557), yielding a total sample size of 2,764 from 21
schools. The analysis sample appears similar to the original sample; average demographic
characteristics (school percent FRL, school and student percent minority, percent male) were
within 5 percentage points of the original sample. In the analysis sample, mean Explore
Composite score was .11 SD units higher, and means for each of the Engage scales were higher
by .02 to .08 SD units compared to the original sample.
Approximately 30% of the sample completed an early form of the Engage assessment
that did not include one of the scales, Relationships with School Personnel. All other predictors
had a missing rate of 10% or less, and missing values were imputed for all predictors. Because
the multiple imputation procedure borrows information from other variables used in the
imputation process, a larger set of predictors than those of interest were included in the
imputation procedure.
Analyses
To address the first research question (RQ1), a multilevel linear model was used to relate
the predictors to HSGPA. To account for variation in grades across schools not explained by the
student and school predictors, a random intercept model was used. The effects of each student-
level predictor were assumed to be the same across schools, thus random slopes were not used.
To address RQ2, multilevel logistic regression was used to relate the predictors to on-time
graduation. Again, to account for school effects, random intercepts were used, but not random
slopes.
The results from the models for HSGPA and on-time graduation can be used to determine
the extent that HSGPA mediates effects on on-time graduation, using Baron and Kenny’s (1986)

approach to testing for mediation. Indirect effects were estimated by the product of the
coefficients (e.g., α×β in Figure 1B; Wright, 1934) and significance was tested using Sobel’s
(1982) approach. Total effects of each predictor were estimated by fitting the model for on-time
graduation without the mediator (HSGPA) (e.g., τ in Figure 1A). RQ3 is addressed by
examining differences in total effects across the ten PSF measures. To facilitate comparisons of
effect size, all predictors except for the student demographics (gender and race/ethnicity
indicators) were standardized prior to modeling.
Results
Table 2 contains descriptive statistics for all variables in the model prior to imputation
and standardization. Mean Explore Composite score was 15.2 (standard deviation 3.2), which is
similar to the U.S. national fall grade 8 mean (15.5) and standard deviation (3.3) (ACT, 2013).
Fifty-one percent of students were female, 67% white, 9% African American, 12% Hispanic, and
89% spoke English as their primary language.
Table 2 also contains correlations between all study variables after imputing missing
data. All predictors were significantly correlated with both HSGPA and on-time high school
graduation, and HSGPA and on-time high school graduation were correlated with one another
(r=.53). Explore Composite and the Engage scales were more highly correlated with HSGPA
than with on-time graduation. Explore Composite was positively correlated with each of the
Engage scales, and the Engage scales were all positively intercorrelated. The largest
intercorrelation among predictors was observed for two of the PSF scales within the self-
regulation domain (Orderly Conduct and Managing Feelings, r=.64), suggesting that there does
not appear to be serious redundancy in the predictors.

Table 3 presents the results of the regression models and the indirect, direct, and total
effects of all predictors on on-time graduation. Because all but on-time high school graduation
and the student demographic variables were standardized, the beta coefficients can be interpreted
as the increase in HSGPA in standard deviation units–or increase in the log-odds of on-time high
school graduation–corresponding to an increase of one standard deviation in the predictor,
controlling for the other predictors in the model. For the student demographic indicators, the
betas correspond to the increase in the outcome corresponding to demographic group
membership.
To address RQ1, the first set of coefficients corresponds to the model predicting HSGPA.
Higher school percent minority and male status predicted lower HSGPA. Higher Explore
Composite score, Academic Discipline, and Orderly Conduct predict higher HSGPA. A small
but significant negative relationship was found between Commitment and HSGPA. Because the
bivariate relationship between Commitment and HSGPA was positive (r=.28), this is likely an
artifact of multicollinearity, also known as suppression.
To address RQ2, the direct effects on on-time graduation were examined. The only
significant predictors in the full model (p < 0.05) were Orderly Conduct and HSGPA. HSGPA
fully mediated the relationships between school percent minority, male status, Explore
Composite, Academic Discipline, and Commitment on on-time graduation. Orderly Conduct
remained a significant predictor of on-time graduation, but the coefficient was reduced in
magnitude, indicating partial mediation. Optimism and School Climate were marginally
significant (p < 0.1), with the coefficient for School Climate suggesting a negative effect.
Indirect effects were obtained by multiplying the coefficients from the model predicting
HSGPA with the HSGPA-on-time graduation coefficient in the full (direct effects) model.

Significant indirect effects were found for school percent minority and male status, Explore
Composite score, Academic Discipline, Commitment, and Orderly Conduct. This was expected
because the same variables were significant predictors of HSGPA.
The final set of coefficients in Table 3 corresponds to the total effects, or the effects of
the predictors on the outcome without the presence of the mediator (GPA) in the model.
Because multilevel linear and logistic models were used, the indirect and direct effects do not
sum to the total effects. The indirect effects of school percent minority, male status, and
Commitment were significant, but the total effects were not. The total effects of Optimism and
Thinking Before Acting were significant, but the indirect effects were not. Both the indirect and
total effects of Family Attitude and School Climate were marginally significant (p < 0.1).
Interestingly, the total effect of Thinking Before Acting was negative, despite a positive bivariate
relationship with the outcome.
To address RQ3, we compared the total effects across the different PSF measures. The
largest effects were observed for Orderly Conduct (0.372), Academic Discipline (0.340),
Optimism (0.175), and Thinking Before Acting (-0.176). For the other six PSFs, there was no
evidence of additional effects on on-time graduation. Thus, among the constructs measured by
the Engage assessment, there is evidence of effects from the motivation and self-regulation
domains, but no additional effects from the social engagement domain. The negative estimate
for Thinking Before Acting was not expected and, as mentioned earlier, may be the product of
multicollinearity. In a model for on-time graduation that excluded all other PSFs but included
mid-point GPA, the coefficient for Thinking Before Acting was positive and not significant. The
predictors with significant effects on on-time graduation are summarized in Figure 2
(Commitment and Thinking Before Acting are not included because their effects were smaller and
negative, contrary to theory).
Discussion
This study showed that PSFs measured in middle school predict both high school grades
and on-time high school graduation. While observational longitudinal studies do not bear
evidence of causality, the results suggest that PSFs measured in middle school are related to
academic performance and persistence in high school. They also highlight the value of using
PSFs to supplement traditional predictors of academic outcomes. Identifying students’ strengths
and needs in terms of their PSFs allows teachers and administrators to approach student success
from a more nuanced perspective, rather than solely focusing on academic performance. Given
that student risk factors can be identified at an early age, it may be possible to avert future
negative outcomes. Further, schools can connect students to targeted resources and interventions
that can help them improve in areas needing development and thus be less likely to drop out or
delay graduation.
RQ1 examined which PSFs predicted mid-point HSGPA, and thus had indirect effects on
on-time graduation. Academic Discipline and Orderly Conduct were important predictors of
HSGPA. These results show that, for middle school students, being motivated to complete
school work and behaving appropriately are precursors to later success in high school. Male
status was negatively related to HSGPA, and as expected, grade 8 academic achievement
(Explore Composite) was positively related.
RQ2 examined which PSFs have direct effects on on-time graduation. Mid-point GPA
fully mediated the relationships found between on-time high school graduation and
demographics, prior academic achievement, and most of the prior PSFs, and partially mediated

the relationship between high school graduation and Orderly Conduct. The impact of
demographics, prior academic performance, and most PSFs on high school graduation can be
explained by their effects on HSGPA, suggesting that lowering risk for poor academic
performance may also lower risk for dropout or delayed graduation. Orderly Conduct was the
only PSF to retain a direct effect on graduation after accounting for the mediating effect of
HSGPA. This is in line with previous research showing that poor grades and poor conduct are
two pathways that lead students to drop out of school (e.g., Rumberger & Lim, 2008). The direct
effect of Optimism was positive and nearly statistically significant, suggesting that a hopeful
outlook on the future helps students persist in high school.
RQ3 examined differences in total effects on on-time graduation, across the ten PSF
scales. Five of the ten PSFs had significant direct, indirect, or total effects on at least one of the
outcomes. Ordering by the magnitude of their total effect on graduation, the most important
PSFs were Orderly Conduct, Academic Discipline, Optimism, and Family Attitude.
Limitations
One limitation of this study is that the participating schools were located mainly in the
Midwestern and Southern United States, and were not nationally representative. However, the
students included represented a wide range of individual differences. Additionally, some error
may have been introduced to the model due to the imputation of missing values. On-time
graduation status was unknown for students who transferred out of the study districts or who
were no longer enrolled for reasons unknown, and were thus excluded from analysis. Also, the
study relied on self-reports of the PSFs. The effects of PSFs on high school outcomes may have
been stronger if the self-report measures were supplemented by observer ratings (e.g., teacher
behavioral ratings), or if effect estimates were corrected for measurement error.

While the study included a diverse set of predictors of HSGPA and graduation, the results
do not prove that the predictors caused the outcomes. This limitation is important because it
calls into question whether interventions can affect the outcome (on-time graduation) by
improving PSFs (e.g., Orderly Conduct).
Future Research
Additional research would benefit from incorporating other measures not included in this
study, such as absenteeism and other academic behaviors (e.g., homework completion, failed
classes, disciplinary actions). Future studies also could use alternative measurement methods
(e.g., other reports, behavior diaries) to help validate the types of behaviors that are predictive of
high school outcomes.
Future research also could incorporate measures of PSFs at later points in time into a
similar research design, and examine the extent to which students’ PSFs change between middle
school and high school and whether the mediating relationship between these factors and
HSGPA holds steady throughout high school. In addition, it would be useful to systematically
explore how interventions implemented based on prior assessment of PSFs can impact student
outcomes.
Conclusion
In a paper cited in the introduction of this study, Neild, Balfanz, and Herzog (2007)
report that they could predict a 6th grade student’s future chance of dropping out of high school
with 75% accuracy using just a few indicators. Consistent with the current study, one of these
indicators had to do with behavioral conduct. In their paper, Neil and colleagues state that,
“These students are metaphorically waving their hands and asking for help” (p. 28). Measures of
PSFs that predict on-time graduation, such as ACT Engage, can, as such, serve as a mode
through which students can “ask for help” and can be used by educators as part of early warning
systems designed to identify students who may be at risk. Although we are unsure whether
intervening directly on the PSFs measured by ACT Engage will lead to lower dropout (see the
limitation about causality discussed above), at minimum such a tool can signal which students
might require some kind of additional supports (psychosocial or otherwise) to complete high
school successfully. That alone, we believe, makes early assessment of PSFs valuable in applied
settings.

References
ACT. (2013). ACT Explore technical manual. Iowa City: Author. Retrieved from
http://www.act.org/explore/pdf/TechManual.pdf
Aud, S., Wilkinson-Flicker, S., Kristapovich, P., Rathbun, A., Wang, X., & Zhang, J. (2013). The
Condition of Education 2013 (NCES 2013-037). U.S. Department of Education, National
Center for Education Statistics. Washington, DC. Retrieved from
http://nces.ed.gov/pubs2013/2013037.pdf.
Balfanz, R., Herzog, L., & Mac Iver, D.J. (2007). Preventing student disengagement and keeping
students on the graduation path in urban middle-grades schools: Early identification and
effective interventions. Educational Psychologist, 42, 223–235.
Baron, R.M., & Kenny, D.A. (1986). The moderator-mediator variable distinction in social
psychological research: Conceptual, strategic, and statistical considerations. Journal of
Personality and Social Psychology, 51(6), 1173-1182. Retrieved from
http://www.public.asu.edu/~davidpm/classes/psy536/Baron.pdf
Barrick, M.R. & Mount M.K. (1991). The big five personality dimensions and job performance:
A meta-analysis. Personnel Psychology, 44, 1-26.
Casillas, A., Allen, J., Kuo, Y.-L., Pappas, S., Hanson, M.A., & Robbins, S.B. (2011).
Development and validation of ENGAGE Grades 6–9. Iowa City: ACT Research
Reports, ACT, Inc.
Casillas, A., Robbins, S., Allen, J., Kuo, Y., Hanson, M.A., & Schmeiser, C. (2012). Predicting
early academic failure in high school from prior academic achievement, psychosocial
characteristics, and behavior. Journal of Educational Psychology, 104, 407-420.

Farrington, C.A., Roderick, M., Allensworth, E., Nagaoka, J., Keyes, T.S., Johnson, D.W., &
Beechum, N.O. (2012). Teaching adolescents to become learners. The role of
noncognitive factors in shaping school performance: A critical literature review.
Chicago: University of Chicago Consortium on Chicago School Research.
Grigorenko, E.L., Jarvin, L., Diffley III, R., Goodyear, J., Shanahan, E.J., & Sternberg, R.J.
(2009). Are SSATs and GPA enough? A theory-based approach to predicting academic
success in secondary school. Journal of Educational Psychology, 101, 964-981.
Heckman, J.J., Humphries, J.E., & Kautz, T. (2014). The Myth of Achievement Tests. Chicago,
IL: The University of Chicago Press.
Judge, T.A. & Ilies, R. (2002). Relationship of personality to performance motivation: A meta-
analytic review. Journal of Applied Psychology, 87, 797-807.
Neild, R.C., Balfanz, R., & Herzog, L. (2007). An early warning system. Educational
Leadership, 65, 28-33.
Poropat, A.E. (2009). A meta-analysis of the five-factor model of personality and academic
performance. Psychological Bulletin, 135, 322-338.
Robbins, S.B., Allen, J., Casillas, A., Peterson, C., & Le, H. (2006). Unraveling the differential
effects of motivational and skills, social, and self-management measures from traditional
predictors of college outcomes. Journal of Educational Psychology, 98, 598–616.
Robbins, S.B., Lauver, K., Le, H., Davis, D., Langley, R., & Carlstrom, A. (2004). Do
psychosocial and study skill factors predict college outcomes? A meta-analysis.
Psychological Bulletin, 130, 261–288.
Robbins, S.B., Oh, I., Le, H., & Button, C. (2009). Intervention effects on college performance
and retention as mediated by motivational, emotional, and social control factors:

Integrated meta-analytic path analyses. Journal of Applied Psychology, 94, 1163-1184.
Rumberger, R.W., & Lim, S.A. (2008). Why students drop out of school: A review of 25 years of
research. Santa Barbara, CA: California Dropout Research Project. Retrieved from
http://cdrp.ucsb.edu/dropouts/ pubs_reports.htm#15
Sobel, M.E. (1982). Asymptotic confidence intervals for indirect effects in structural equation
models. Sociological Methodology, 13, 290-312.
Wright, S. (1934). The method of path coefficients. The Annals of Mathematical Statistics, 5(3),
161-215.
Zins, J.E., Bloodworth, M.R., Weissberg, R.P., & Walberg, H.J. (2004). The scientific base
linking emotional learning to student success and academic outcomes. In J.E. Zins, R.P.
Weissberg, M.C. Wang, & H.J. Walberg (Eds.), Building academic success on social and
emotional learning: What does the research say? (pp. 3-22). New York, NY: Teachers
College Press.

Figure 1. Relationships tested among PSFs, academic achievement, demographics, and high school outcomes.

Figure 2. Effects of predictors on on-time graduation.
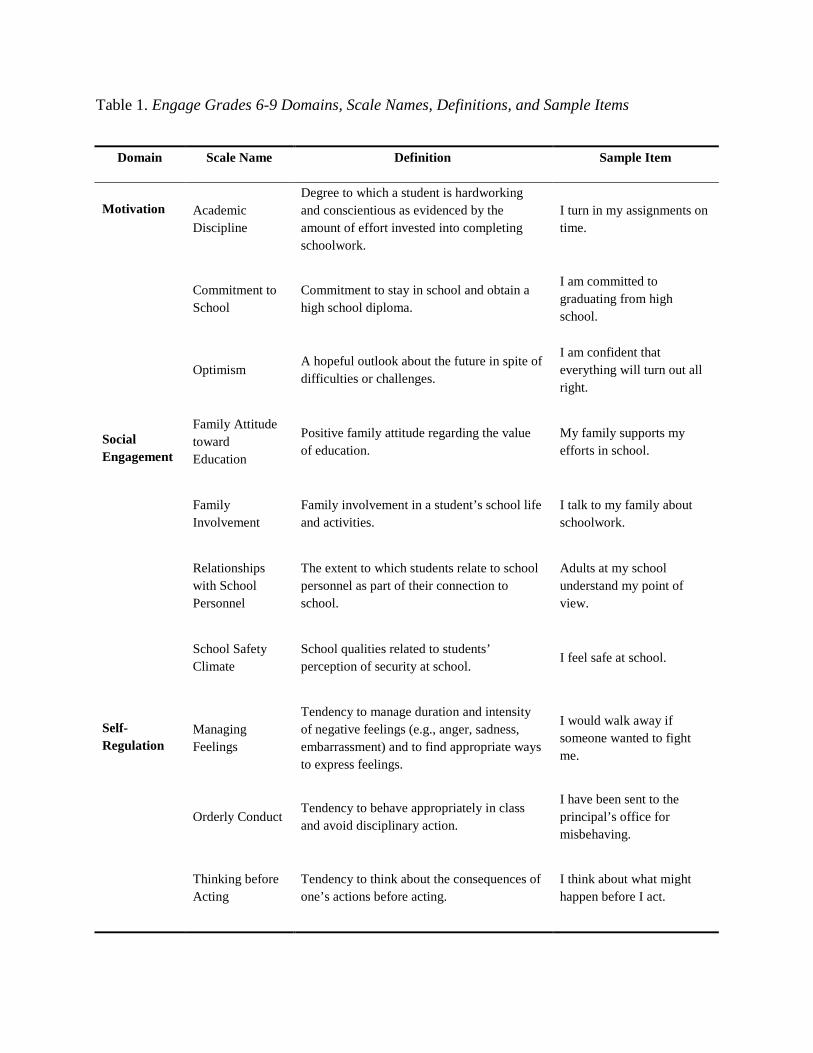
Table 1. Engage Grades 6-9 Domains, Scale Names, Definitions, and Sample Items
Domain Scale Name Definition Sample Item
Motivation Academic Discipline
Degree to which a student is hardworking and conscientious as evidenced by the amount of effort invested into completing schoolwork.
I turn in my assignments on time.
Commitment to School
Commitment to stay in school and obtain a high school diploma.
I am committed to graduating from high school.
Optimism A hopeful outlook about the future in spite of difficulties or challenges.
I am confident that everything will turn out all right.
Social Engagement
Family Attitude toward Education
Positive family attitude regarding the value of education.
My family supports my efforts in school.
Family Involvement
Family involvement in a student’s school life and activities.
I talk to my family about schoolwork.
Relationships with School Personnel
The extent to which students relate to school personnel as part of their connection to school.
Adults at my school understand my point of view.
School Safety Climate
School qualities related to students’ perception of security at school.
I feel safe at school.
Self-Regulation
Managing Feelings
Tendency to manage duration and intensity of negative feelings (e.g., anger, sadness, embarrassment) and to find appropriate ways to express feelings.
I would walk away if someone wanted to fight me.
Orderly Conduct Tendency to behave appropriately in class and avoid disciplinary action.
I have been sent to the principal’s office for misbehaving.
Thinking before Acting
Tendency to think about the consequences of one’s actions before acting.
I think about what might happen before I act.

Table 2. Correlations and Descriptive Statistics.
Variable 1 2 3 4 5 6 7 8 9 10 11 12 13 14 15 16 17 18 19 20 21
1) School % FRL —
2) School % Minority .44 —
3) School Size -.65 .11 —
4) Male -.01 -.02 .01 —
5) White -.22 -.43 -.04 -.02 —
6) Black .27 .31 -.16 .02 -.45 —
7) Hispanic .02 .21 .15 -.01 -.54 -.12 —
8) Other Race/Ethnicity .05 .11 .03 .03 -.46 -.10 -.12 —
9) Explore Composite -.23 -.11 .18 -.06 .24 -.22 -.09 -.05 —
10) Academic Discipline -.13 -.11 .07 -.17 .13 -.03 -.10 -.06 .26 .90
11) Commitment to Sch. -.12 -.07 .07 -.18 .08 .04 -.09 -.06 .23 .52 .84
12) Family Attitude -.09 -.02 .07 -.07 .06 .01 -.06 -.03 .21 .45 .61 .85
13) Family Involvement -.12 -.10 .04 -.06 .11 .02 -.10 -.07 .14 .52 .47 .57 .86
14) Managing Feelings -.13 -.07 .11 -.23 .15 -.11 -.05 -.07 .20 .52 .28 .23 .39 .90
15) Optimism -.08 -.06 .04 -.09 .05 .06 -.06 -.07 .15 .52 .50 .43 .55 .39 .89
16) Orderly Conduct -.20 -.15 .13 -.23 .20 -.12 -.10 -.07 .28 .56 .30 .24 .34 .64 .31 .82
17) Relat. w/ Sch. Pers. -.19 -.15 .07 -.10 .18 -.06 -.11 -.09 .14 .51 .41 .36 .59 .46 .56 .39 .89
18) School Climate -.18 -.22 .02 -.06 .14 -.06 -.07 -.07 .08 .35 .31 .28 .37 .37 .43 .36 .59 .82
19) Think. Bef. Acting -.06 .03 .06 -.10 .03 .02 -.01 -.04 .15 .50 .27 .25 .39 .57 .42 .49 .41 .31 .86
20) 10th Grade GPA -.14 -.21 .04 -.18 .26 -.15 -.18 -.05 .58 .45 .28 .27 .27 .32 .26 .42 .28 .18 .24 — 21) On-time HS Grad. -.15 -.10 .12 -.10 .13 -.10 -.08 -.03 .29 .27 .23 .21 .19 .18 .19 .26 .17 .10 .12 .53 —
N 2764 2764 2764 2758 2761 2761 2761 2761 2751 2762 2763 2761 2762 2761 2762 2463 1940 2759 2759 2725 2764
Min 0.3 0 39 0 0 0 0 0 5.0 10.0 16.0 10.0 10.0 10.0 10.0 10.0 10.0 10.0 10.0 0 0
Max 1.0 1.0 425 1.0 1.0 1.0 1.0 1.0 25.0 60.0 60.0 60.0 60.0 60.0 60.0 60.0 60.0 60.0 60.0 4.3 1.0
Mean 0.5 0.3 246 0.5 0.7 0.1 0.1 0.0 15.2 48.7 56.7 55.8 47.3 39.1 48.5 44.9 40.2 42.2 39.4 2.7 .87
SD 0.1 0.2 96 0.5 0.5 0.3 0.3 0.3 3.2 8.8 5.5 6.3 10.1 11.8 9.1 14.7 10.0 9.3 10.4 0.9 .30 Note. Correlations >.04 are significant at p < .05. Correlations > .20 are in bold. Cronbach’s alphas for Engage scales are on the diagonal.

Table 3. Indirect, Direct, and Total Effects for the Model.
10th Grade GPA On-time High School Graduation Indirect Effects Direct Effects Total Effects Effect Beta SE P-value Beta SE P-value Beta SE P-value Beta SE P-value Intercept 0.027 0.108 0.805 3.904* 0.574 <.0001 2.784* 0.491 <.0001 School demographics School % FRL 0.075 0.064 0.244 0.158 0.136 0.245 -0.222 0.272 0.413 0.154 0.279 0.582 School % Minority -0.101* 0.045 0.024 -0.214* 0.095 0.025 0.089 0.188 0.634 -0.189 0.191 0.324 School Size -0.011 0.055 0.836 -0.024 0.117 0.836 0.120 0.241 0.619 0.285 0.246 0.247 Student demographics Male -0.170* 0.029 <.0001 -0.360* 0.064 <.0001 0.052 0.161 0.747 -0.251 0.137 0.066 White 0.110 0.104 0.290 0.232 0.220 0.291 -0.385 0.549 0.484 0.048 0.470 0.919 Black 0.000 0.112 0.998 -0.001 0.238 0.998 -0.407 0.576 0.480 -0.123 0.493 0.803 Hispanic -0.114 0.108 0.294 -0.241 0.230 0.295 -0.290 0.568 0.610 -0.340 0.486 0.485 Other Race/Ethnicity 0.079 0.110 0.473 0.167 0.233 0.473 -0.106 0.584 0.856 0.046 0.498 0.926 Prior academic achievement Explore Composite 0.468* 0.015 <.0001 0.990* 0.067 <.0001 0.130 0.107 0.228 0.764* 0.085 <.0001 Psychosocial factors Academic Discipline 0.232* 0.021 <.0001 0.491* 0.052 <.0001 0.034 0.101 0.737 0.340* 0.087 <.0001 Commitment -0.042* 0.019 0.028 -0.089* 0.041 0.029 0.074 0.084 0.381 -0.020 0.070 0.773 Family Attitude 0.036 0.019 0.062 0.075 0.041 0.064 0.078 0.085 0.361 0.136 0.073 0.061 Family Involvement 0.019 0.020 0.348 0.040 0.043 0.348 0.040 0.103 0.697 0.082 0.087 0.347 Managing Feelings -0.003 0.020 0.892 -0.006 0.043 0.892 0.064 0.104 0.537 0.017 0.092 0.852 Optimism 0.016 0.019 0.407 0.033 0.040 0.408 0.184 0.098 0.060 0.175* 0.082 0.033 Orderly Conduct 0.121* 0.020 <.0001 0.257* 0.045 <.0001 0.217* 0.101 0.032 0.372* 0.087 <.0001 Relat. w/ Sch. Pers. 0.033 0.021 0.107 0.071 0.044 0.109 -0.014 0.114 0.902 0.040 0.098 0.685 School Climate -0.033 0.018 0.067 -0.070 0.038 0.069 -0.166 0.096 0.084 -0.160 0.082 0.052 Think. Bef. Acting -0.024 0.018 0.186 -0.051 0.039 0.188 -0.101 0.095 0.287 -0.176* 0.083 0.035 10th grade GPA 2.117* 0.126 <.0001 Note. * Significant at p < 0.05


