
www.quics.eu
Effect of surcharge on gully and manhole flow
Md Nazmul Azim Beg1,2, Rita F. Carvalho1, Jorge Leandro1,3
1MARE - Marine and Environmental Research Centre
Department of Civil Engineering, University of Coimbra,
Coimbra, Portugal
2Early Stage Researcher, Marie Curie Actions ITN (QUICS)
3Chair of Hydrology and River Basin Management, Technical University of Munich, Munich, Germany
2º FOAM @ PT / 1º FOAM IBÉRICO –
COIMBRA, 2/06/2017

Introduction
Pluvial flooding at City centre of Coimbra on May 2006Photo Source: http://www.raingain.eu/en/actualite/flood-solutions-north-south-europe
One of the busiest city in Dhaka, due to 46mm of rainfall in one and a half hour; on afternoon of September 1, 2015. Photo Credit: The Daily Star on September 2, 2015.
Chertsey, UK on February 11, 2014Photo source: The Guardian on 11 February, 2014
2nd FOAM@PT, 02 June 2017

Introduction
• Flooding is one the of biggest threats for a busy urban city
• Drainage system efficiency is dependent on the individual efficiency of each element
• State-of-the-art flood routing models in urban areas are Dual Drainage (DD) models that simulate both surface flow and flow in buried pipes simultaneously
• These models use discharge coefficients to connect the two systems through linking elements
• However, they also have weaknesses in considering linking elements as very few existing models are available to calibrate these coefficients (Djordjević et al., 2005)
• The effect of manhole surcharge on manhole head loss coefficients and manhole-gully discharge coefficients have been studied
2nd FOAM@PT, 02 June 2017

Objective
• To validate CFD model with experimental measurement at the laboratory
• To analyse the different flow behaviour inside a gully-manhole drainage system for different manhole surcharge
2nd FOAM@PT, 02 June 2017

Manhole
0.3m
• 1m diameter manholes• Connected by a Ø300 sewer pipe• 0.5m wide and 1% slopped surface
channel • 0.6 × 0.24 × 0.32 [m] (L × W × D)
gully
Gully
MethodologyPhysical Model set up
The physical model facility is installed at the Department of Civil Engineering, University of Coimbra.
Surface Drain
Drain Outlet
2nd FOAM@PT, 02 June 2017

Methodology
• Experimental Scenario: combination of two different experimental studies:
• Scenario 1:
– Constant flow through the drain and manhole inlet
– Measurement of point velocity at three vertical planes of the gully using ADV
Tests performed
Drain inlet Q (l/s) Manhole inlet Q (l/s) Manhole surcharge level (m) Remarks
19.8 43.7 0.67Experimental case
scenario
2nd FOAM@PT, 02 June 2017

Methodology
• Scenario 2:
– Different inflows and surcharge combinations at the manhole
– 18 different combinations
– Both free surface and pressure flow in the pipe
– Measurement of pressure at the manhole using pressure sensors and discharge at the inlet
Tests performed
2nd FOAM@PT, 02 June 2017

MethodologyNumerical Model set up
• cfMesh• Mesh size 2cm
• 1 cm at the boundaries• 821,500 computational with 1.01 million nodes
2nd FOAM@PT, 02 June 2017

Methodology
• OpenFOAM v. 2.3.0
• interFOAM solver: considering isothermal, incompressible and immiscible two-phase flow (air and water for this case)
• Standard k-ε for (gully flow) and RNG k-ε turbulent model (for manhole flow) was used
• PISO algorithm is used
OpenFOAM simulation
2nd FOAM@PT, 02 June 2017
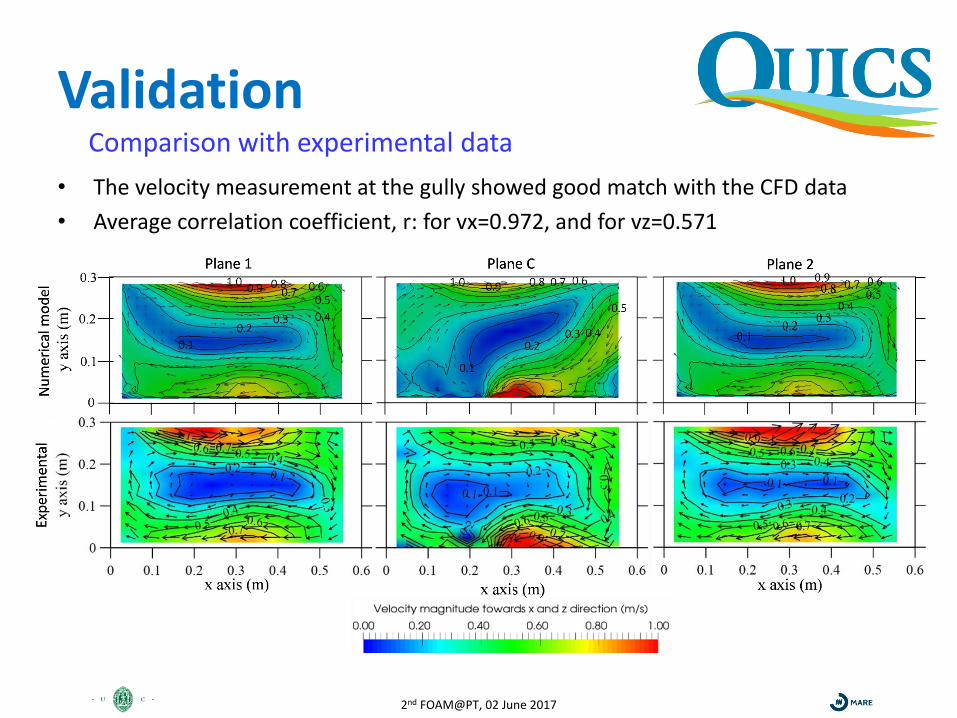
Validation
• The velocity measurement at the gully showed good match with the CFD data
• Average correlation coefficient, r: for vx=0.972, and for vz=0.571
Comparison with experimental data
2nd FOAM@PT, 02 June 2017

Validation
• The velocity measurement at the gully showed good match with the CFD data
Comparison with experimental data
2nd FOAM@PT, 02 June 2017

Validation
• The velocity measurement at the gully showed good match with the CFD data
Comparison with experimental data
2nd FOAM@PT, 02 June 2017
-8.00%
-6.00%
-4.00%
-2.00%
0.00%
2.00%
4.00%
6.00%
8.00%
Sim
1_
1
Sim
1_
2
Sim
1_
3
Sim
2_
1
Sim
2_
2
Sim
2_
3
Sim
2_
4
Sim
2_
5
Sim
2_
6
Sim
3_
1
Sim
3_
3
Sim
3_
4
Sim
3_
5
Sim
3_
6
Sim
3_
7
Sim
3_
8
Sim
3_
9
Sim
3_
10
%o
f E
rro
r in
th
e p
ress
ure
SImulation Name
Comparison with experimental model
Comparison at P23 Comparison at P22 Comparison at P18

ResultsCoefficient of head loss
2nd FOAM@PT, 02 June 2017
• The spread of the jet is different at different inflow and surcharge

Results
• Head loss coefficient, 𝑘 =Δ𝐻
𝑣22𝑔
– Δ𝐻 is the head loss in meters
– 𝑣 is the average velocity at the inlet
• It has two distinctive characteristics at two different surcharge conditions– Below threshold zone
– Over threshold zone
• According to some literatures– Threshold surcharge = 20% surcharge
– height of manhole diameter
Coefficient of head loss
2nd FOAM@PT, 02 June 2017

Results
• Coefficient of head loss (k) vs surcharge ratios (s/Φp) were drawn
• At higher surcharge, the coefficient stays fairly around 0.3
• The coefficient is very high at below threshold surcharge
Coefficient of head loss
• For below threshold zones, head losses did not follow any particular trend
• No justification could be drawn for these variations
2nd FOAM@PT, 02 June 2017

Results
• Considering orifice flow equation
• Coefficient of discharge at the gully pipe Cd, where Q = CdAo 2gho
Coefficient of discharge
• Q = discharge from the gully, variable at different manhole surcharge
• Ao = Cross sectional area of the orifice,.
• ho = Head difference from the surface drain to the gully outlet.
• Here, at zone 1, ho is constant, which is equal to (h+Z-Zo=) 0.786 m. At zone 2 and 3, ho is a variable and can be calculated as the difference between (Z+h) and H.
2nd FOAM@PT, 02 June 2017

Results
• Three different zones considering the gully outlet flow
– Zone 1: Free outlet
– Zone 2: Outlet as a submerged jet
– Zone 3: Reverse flow
Coefficient of discharge
2nd FOAM@PT, 02 June 2017

ResultsCoefficient of discharge
Cd Remarks
Zone 1 0.677 Free outfall to the atmosphere, like a plunging jet to the manhole
Zone 2 0.755 Submerged jet condition
Zone 3 0.820 Reverse flow from manhole to the gully
: Three different discharge coefficients were identified for the gully outlet at different surcharge conditions
2nd FOAM@PT, 02 June 2017
Conclusion
• The work presented shows the numerical assessment of flow behaviour inside a gully-manhole drainage system
• OpenFOAM® v. 2.3.0 with solver interFOAM was used with RANS k-ɛ turbulence model
• Numerical model shows good agreement with measured velocity at the gully
• Flow streamline show different characteristics with change in surcharge level in the manhole.
2nd FOAM@PT, 02 June 2017

Future Work
• The model will be validated with flow measurement inside the manhole using PIV
• The influence of different gully outlet pipes on the discharge coefficient will be checked
2nd FOAM@PT, 02 June 2017


Partners and Acknowledgements
This project has received funding from the European Union’s Seventh Framework Programme forresearch, technological development and demonstration under grant agreement no 607000.
Authors would also like to thank FCT (Portuguese Foundation for Science and Technology) for their support through the Project UID/MAR/04292/2013 financed by MEC (Portuguese Ministry of Education and Science) and FSE
(European Social Fund), under the program POCH (Human Capital Operational Programme).
www.quics.eu


