
1
Effect of GIC and GIC Capability of EHV Power Transformers – A Case Study on an AEP 765 kV Power Transformer Design
Qun Qiu, David R Ball and Jeffrey A Fleeman
American Electric Power
Gahanna, Ohio USA
Ramsis Girgis and Kiran Vedante
ABB Power Transformers
St. Louis, MO, USA
CIGRE US National Committee
2013 Grid of the Future Symposium
Boston, MA
October 22, 2013
This presentation has been prepared by, and is the property of, American Electric Power Company, Inc., is intended for AEP use only.

10/24/2013 2
Outline
GMD Impacts on Transformers
GIC Profile for the Evaluation of the GIC Impacts on Power Transformers
Impact of GIC on a 750 MVA, 765/345/34.5 KV, 1-phase, Auto-transformer Design
GIC Capability of the 765 KV, 1-Phase Transformer Design
Conclusion and Future Studies

10/24/2013 3
Geomagnetic Disturbance Impacts on Power Systems
The solar storm impacts on power systems depend on many factors, including:
Intensity of solar storm activity
Whether and where the mass of particles ejected during a solar storm strikes Earth
The facilities’ geography (proximity to Earth’s poles) and local geology
Length and orientation of lines and the winding connection of connected transformers
The design of connected transformers and their power loading during the GMD

10/24/2013 4
GMD Impacts on Transformers
GMD Impacts on Transformers Depend on
Transformer design, including core type
Magnitude and duration of the GIC pulse
Effects of GIC on a transformer
If sufficient in intensity and duration, these quasi-DC currents may cause transformer part-cycle core saturation and overheating
Unidirectional core flux density shift
A short duration high peak magnetizing current pulse one per cycle
Significant increases in core loss, core noise, and load loss
Hot spot temperature rises of the windings and structural parts
In the extreme, it can lead to transformer damage or failure
Failure of a GSU transformer in Salem nuclear plant on 3/13/1989

10/24/2013 5
GMD Impacts on Transformers

10/24/2013 6
AEP Approach on Transformer GMD Impact Assessment
Working with transformer vendors:
To evaluate the GIC impacts on selected in-service and new EHV transformers
To determine the GIC capability of representative EHV transformers is to identify potential transformer vulnerabilities
These studies provide necessary technical support in developing/refining GMD operating procedures and GMD mitigation plans.
The results of these studies, such as reactive power demands, and current harmonics, due to GIC flow can be incorporated into AEP’s GIC system impact studies such as voltage stability and protection & control impact studies.

10/24/2013 7
Scope of Transformer GMD Impact Assessment
Calculations of the transformer performance parameters subjected to a range of GIC levels
Calculate magnitude and wave-shape of the resulting magnetizing current pulse, and the associated additional VAR demand and harmonics
Calculate the increase in core losses, load losses, and core noise level
Calculate the increase in the hot spot temperatures of windings and structural parts
Evaluation of transformer GIC capability study
Estimate the combinations of load current and magnitude of GIC that the transformer would operate at without exceeding loss of life of the transformer insulation beyond what is allowed by Industry Standards

10/24/2013 8
GIC Profile for the Evaluation of the GIC Capability
AEP design and performance requirements of new EHV 765 kV single phase transformers
GIC profile of six 5-minute on/5-minute off cycles of 120 A/phase DC in the common and series windings, the transformer would not exceed the dissolved gas values listed in the AEP Specification
For the GIC Capability evaluation of 765 kV transformers
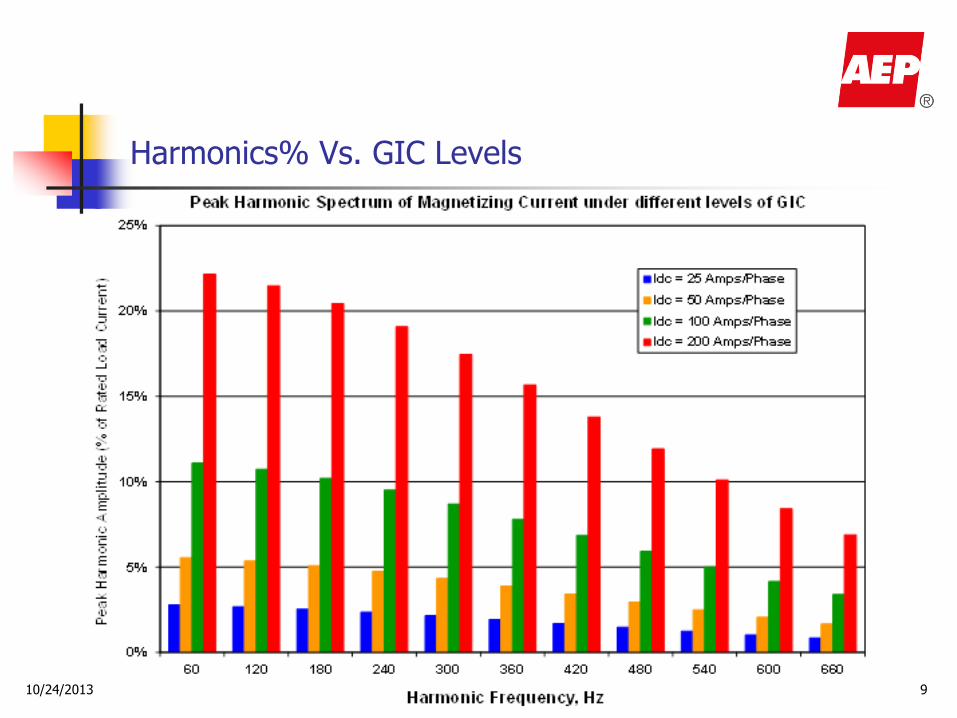
AEP specifies that the magnitudes of GIC used are 50, 100, and 200 A/phase for a 5-minute duration
10/24/2013 9
Harmonics% Vs. GIC Levels

10/24/2013 10
Fundamental MVAR% Vs. GIC Levels
0
2
4
6
8
10
12
14
16
18
0 25 50 75 100 125 150 175 200
% F
un
dam
enta
l MV
AR
GIC, Amps/Phase
Fundamental Inductive MVAR Drawn by Transformer vs GIC

10/24/2013 11
Calculated Increases of Core Loss & Core Noise
GIC (A/Phase) Core Loss Increase Core Noise level Increase (dB)
15 29.0% 29.6
20 31.5% 31.2
30 35.3% 33.7
40 38.1% 35.4
50 40.4% 36.9
100 48.2% 41.6
200 56.9% 46.7

10/24/2013 12
Calculated Increases of Load Loss vs. Levels of GIC
GIC
(A/Ph)
Loss Increase In Windings Loss Increase in
Structural Parts
Increase in Total
Load Losses Ohmic Eddy Current Windings
15 0.05% 0.9 % 0.2% 0.1% 0.2%
20 0.1% 1.6% 0.4% 0.2% 0.33%
30 0.2% 3.7% 0.8% 0.5% 0.76%
40 0.3% 6.6% 1.4% 0.8% 1.35%
50 0.5% 10.3% 2.2% 1.4% 2.13%
100 2.1% 41.7% 9.1% 5.3% 8.55%
200 8.4% 169.5% 36.7% 21.4% 34.7%

10/24/2013 13
Calculated Hot Spot Temperatures Vs. Time for Various GIC Levels
Calculated temperatures of the windings and structural
The transformer is fully loaded
Subjected to 5 different levels of GIC currents for a 60-minute period

10/24/2013 14
GIC Capability of the Transformer Design

10/24/2013 15
Conclusion and Future Studies
Effect of GIC on transformers
Significant increases in core loss, core noise, and load loss
Generation of high current harmonics
Significant VAR demand during a severe GMD storm
GIC capability curves confirm that transformers of this design can be subjected up to 155 amps/phase of GIC for a duration of 30-minute without the need for reducing their load.
To validate the calculations based on the measurements from fiber temperature probes at the winding and tie-plate hot spots, as well as the reactive power loss measurements during a storm

10/24/2013 16
Questions?


