Economic Analysis of Housing Policy in Hong Kong
Michael Fung, Michael Leung and Fred Ku
Program for Economic Education
CUHK

Problems and Solutions
• Homeless Problem
• Affordable Housing Problem
• Poverty Problem

Outline
• Real Estate Market and Economics: Macro + Micro
• Facts: Policy History + Data
• Economic Model
• Policy Analysis and Evaluation

Real Estate Market and Economics
Macroeconomics
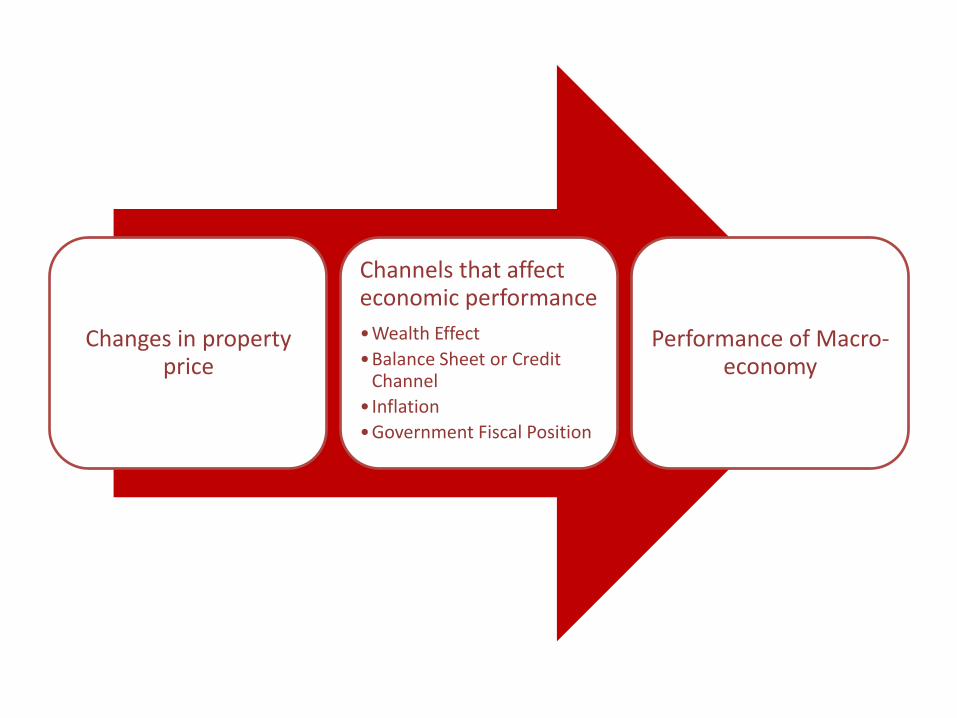
Changes in property price
Channels that affect economic performance
•Wealth Effect
•Balance Sheet or Credit Channel
• Inflation
•Government Fiscal Position
Performance of Macro-economy
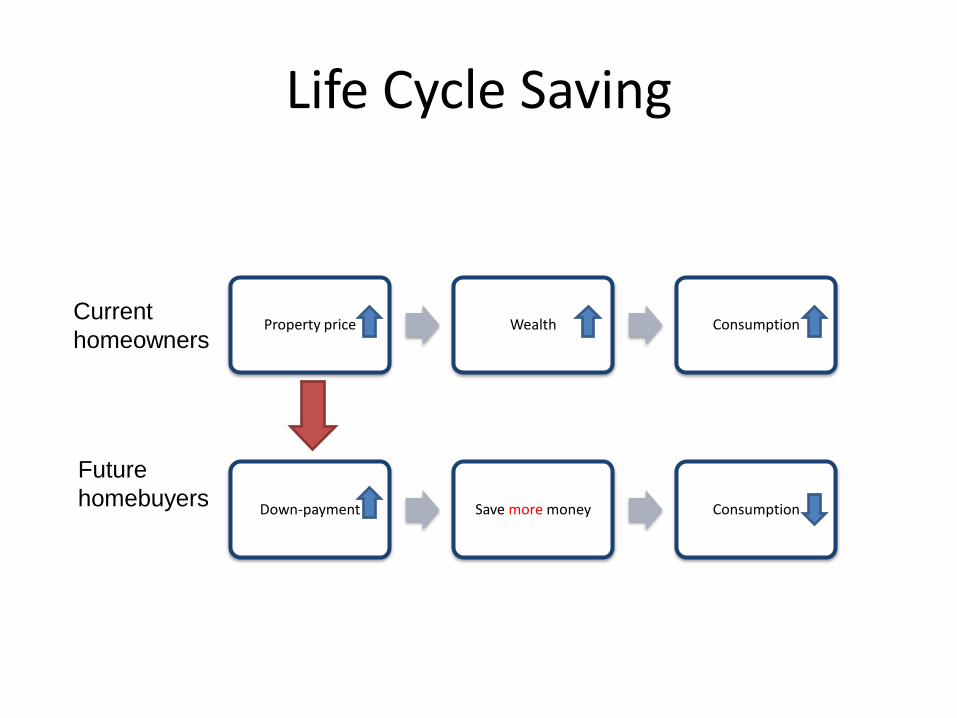
Current
homeowners
Future
homebuyers
Property price Wealth Consumption
Down-payment Save more money Consumption
Life Cycle Saving

Factors Affecting Wealth Effect
Property price changes
• Well-developed and liquid secondary market
• Well-developed financial sector
Wealth Effect

Well-Developed Financial Market
• It allows owners to obtain extra finance when they are in need
• Mortgage for properties
• Second mortgage and Refinancing
*Source:http://www.hkma.gov.hk/eng/key-information/guidelines-
and-circulars/guidelines/guide_581b.shtml

Advertisement from Financial Institutions
• http://www.youtube.com/watch?v=J9m9yMhJjaM (Konew Financial Express)
• http://www.youtube.com/watch?v=TPr3PD1bghA (UA Finance)

Values of New Loans Approved During the Month by Sectors from 2007 Q1 to 2012 Q4
0
5000
10000
15000
20000
25000
30000
35000
40000
45000
50000
2007 2008 2009 2010 2011 2012
Valu
es o
f M
ort
gage
in H
K$ M
illi
on
Values for Refinancing
(HK$ million)
Values for Secondary
market (HK$ million)
Values for Primary
market (HK$ million)
Source: Hong Kong Monetary Authority , Residential
Mortgage Survey

Property Price and Banking Sector
• Mortgage loans and SMEs’ loans have assets as collaterals
• Banks can reduce risks of lending money as the net worth of collaterals increase (balance sheet improves)
• Potential borrowers can increase their borrowing ability by offering collaterals
• Improve information asymmetry

Percentage of Secured Advances in Advances to Customers by Industry Sectors (2012)
Bank* % of Secured Advances in Industrial, Commercial and Financial1
% of Secured Advances in Individuals Loans2
% of Secured Advances in Total Loans for Use in Hong Kong
The Bank of East Asia
72.25 83.12 75.80
Hang Seng Bank 67.1 82.2 74.0
Bank of China (Hong Kong)
50.29 91.69 69.91
HSBC 52.16 83.00 66.59
2 Including loans for the purchase of flats in the Home Ownership Scheme, Private Sector
Participation Scheme and Tenants Purchase Scheme, loans for the purchase of other
residential properties, credit card advances and others
1 Including Property Development, Property investment, Financial concerns,
Stockbrokers, Wholesale and retail trade, Manufacturing, Transport and transport
equipment, Recreational activities, Information technology and others
3 This includes loans for the purchase of flats in
Home Ownership Scheme, Private Sector
Participation Scheme and Tenants Purchase
Scheme, loans for purchase of other residential
properties.
Source: 2012 annual reports of The Bank of East Asia, Hang Seng Bank, Bank of China (Hong
Kong) and HSBC

Property Price
Net worth of assets increases
Improves balance sheets of banks and
firms
Encourages banks to increase
credit to the business sector
Property Price and Investment

Property Price and Inflation
Fluctuations in property
prices
Changes in consumption
and investment
Changes in aggregate demand
Prices of other goods may change
Channel 2
Channel 3 Changes in CPI today
Changes of inflationary
expectations today
Changes of wage and
rental contracts
Changes of future CPI
Channel 1 Fluctuations in property prices
Changes in housing cost
component of CPI
Changes in inflation rate
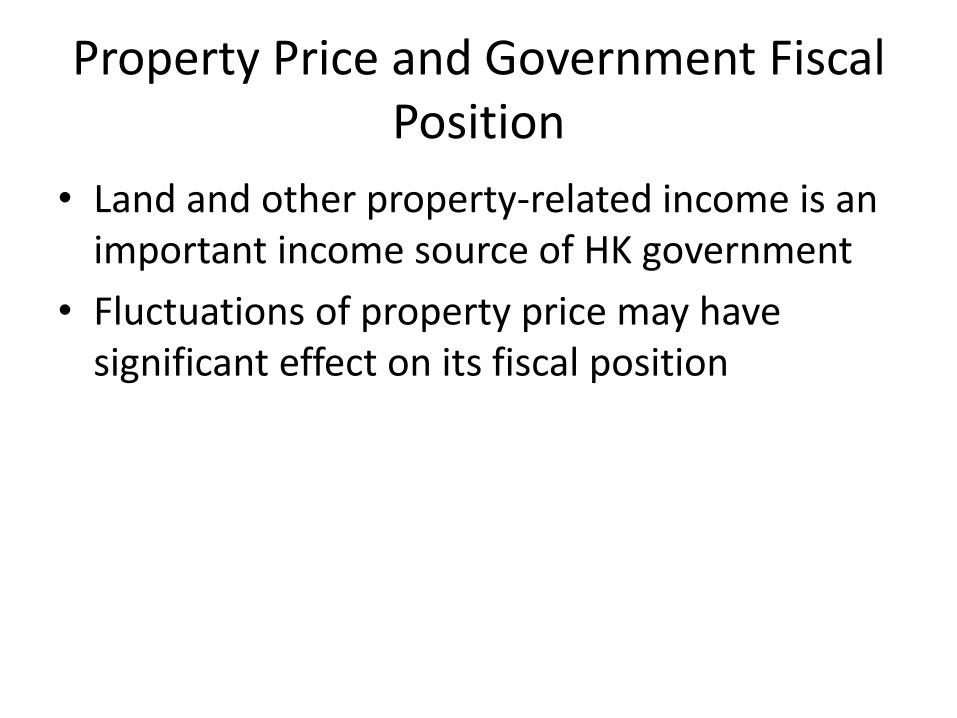
Property Price and Government Fiscal Position
• Land and other property-related income is an important income source of HK government
• Fluctuations of property price may have significant effect on its fiscal position
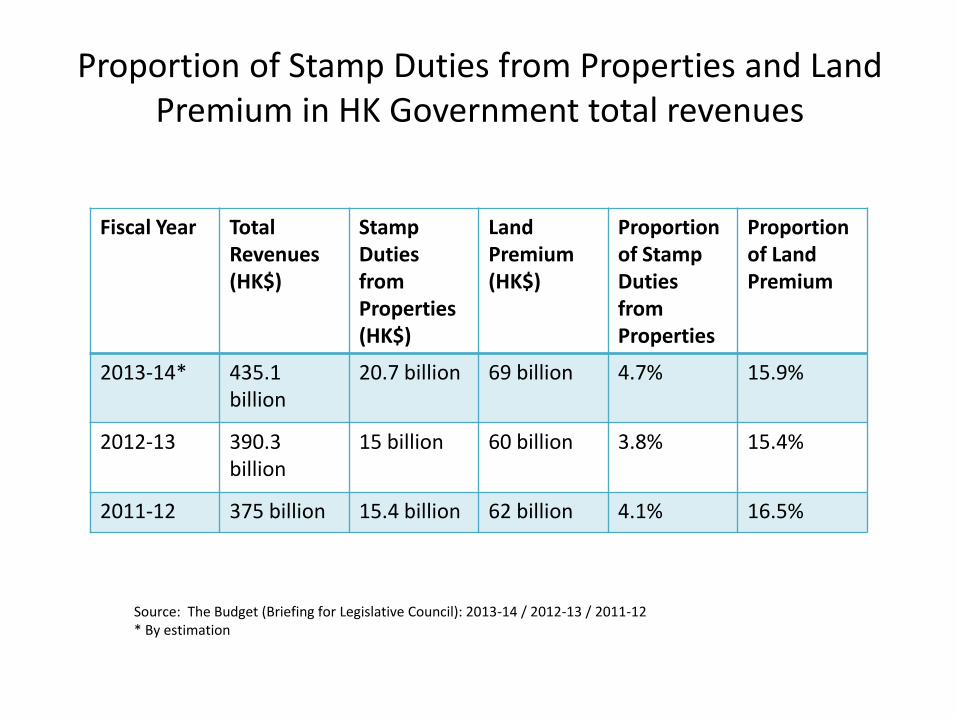
Proportion of Stamp Duties from Properties and Land Premium in HK Government total revenues
Fiscal Year Total Revenues (HK$)
Stamp Duties from Properties (HK$)
Land Premium (HK$)
Proportion of Stamp Duties from Properties
Proportion of Land Premium
2013-14* 435.1 billion
20.7 billion 69 billion 4.7% 15.9%
2012-13 390.3 billion
15 billion 60 billion 3.8% 15.4%
2011-12 375 billion 15.4 billion 62 billion 4.1% 16.5%
Source: The Budget (Briefing for Legislative Council): 2013-14 / 2012-13 / 2011-12 * By estimation

Real Estate Market and Economics
Microeconomics

Market Participants
Real Estate Market
Owners, owner-users,
speculators, renters Facilitators
Workers in
construction sector Developers

Market Cycles
• Time to Build
• Buildings are long-lasting and impossible to be relocated
• Implies inelastic supply in short run
• Changes of demand is faster than changes of supply
• Time lags of building would cause under-supply or over-supply in the market

Business Cycle and Real Estate Cycle
Expansion Recession
Demand
increases Price
increases
Supply
increases
Business cycle
Real estate cycle
Price
decreases
Time
Time lag due to construction
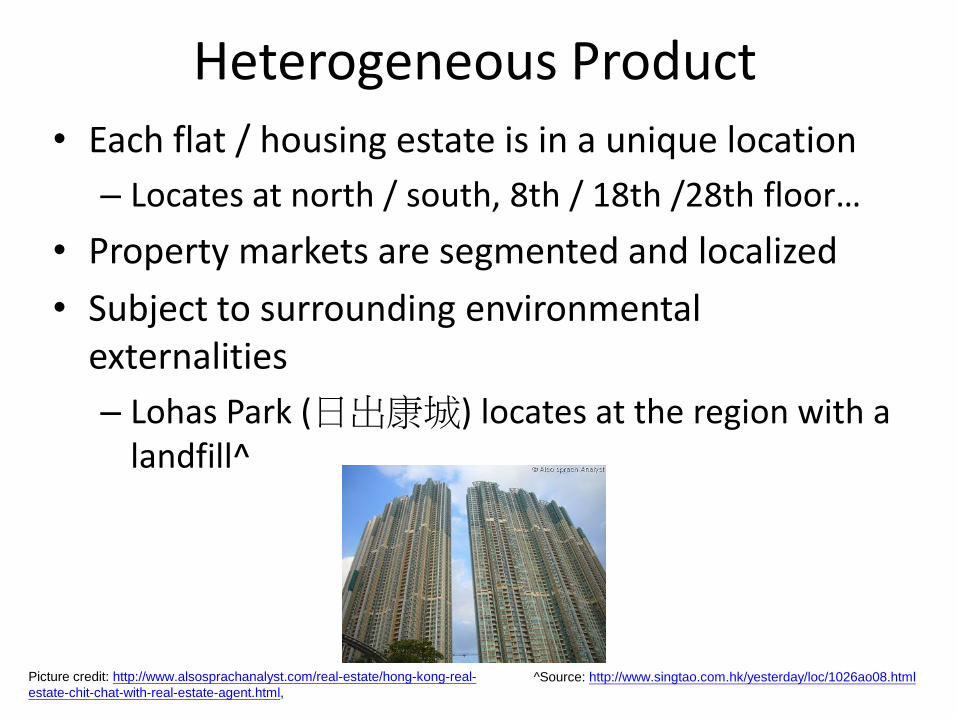
Heterogeneous Product • Each flat / housing estate is in a unique location
– Locates at north / south, 8th / 18th /28th floor…
• Property markets are segmented and localized
• Subject to surrounding environmental externalities
– Lohas Park (日出康城) locates at the region with a landfill^
^Source: http://www.singtao.com.hk/yesterday/loc/1026ao08.html
Picture credit: http://www.alsosprachanalyst.com/real-estate/hong-kong-real-
estate-chit-chat-with-real-estate-agent.html,

Highly Regulated by Governments
Regulations
Supply
Zoning or environmental
laws
Town Planning Ordinance
Building laws
The Building Ordinance
Consumer protection
The Residential Properties (First-
hand Sales) Ordinance
Demand
Stamp Duties
Ad Valorem Stamp Duty, Special Stamp
Duty, Buyer’s Stamp Duty

Comparison to Perfect Market
Perfect Market Real Estate Market
Number of buyers and sellers
Many participants Fewer participants, seller controls during a seller’s market* while buyer controls during a buyer’s market*
Product knowledge and ease of exchange
Buyers and sellers know well about the product; exchanges take place with ease
Buyers and sellers will not know well about the product; the exchange is legalistic, complex and expensive
Standardized products Products are homogeneous Each flat is unique and heterogeneous
Prices Buyers and sellers are price takers
The price of each flat is varied
Source: Essentials of Real Estate Economics (6th). DJ McKenzie, RM Betts and CA Jensen.

Demand and Supply Curves
Price or rent
Quantity or space
Pe
Demand
Short Run Supply
Long Run Supply

• Demographic factors
size of population, sex ratio, age structure, birth rate, marriage rate, life expectancy, …
Determinants of Demand

Population Pyramid of Hong Kong in Population Census 2011
Source: http://www.census2011.gov.hk/flash/dashboards/population-pyramid-db-102-
en/population-pyramid-db-102-en.html

Some Figures About HK Population
Number of Single Parents* in 1996, 2001, 2006, 2011
1996 2001 2006 2011
Number 42,316 61,341 76,423 81,705
Source: HK Census and Statistics Department, Women and Men in HK Key Statistics 2012
*Single parents: This refers to persons who are never married, widowed,
divorced or separated, and living with child(ren) aged under 18 in the same
household

Determinants of Demand
• Income
• When income increases, the demand for housing increases, vice versa.
• Income inequality and quality of housing
– HK example: Subdivided units vs. private residential units
Picture credit: http://the-sun.on.cc/cnt/news/20110617/00407_020.html , Wikipedia
Determinants of Demand
• Financing
– Availability of credit (Loan-to-value ratio)
– Interest rate (Prime rate)
HK Examples:
– When Hong Kong Monetary Authority reduced the loan-to-value ratio in February 2013^, the demand for housing decreased.
– When prime rate increases, demand for housing decreases, vice versa.
^ Source: http://www.hkma.gov.hk/media/eng/doc/key-information/guidelines-and-circular/2013/20130222e2.pdf
Determinants of Demand
• Changes in preferences
HK example:
– More people prefer to live by their own. This will increase the demand for houses.
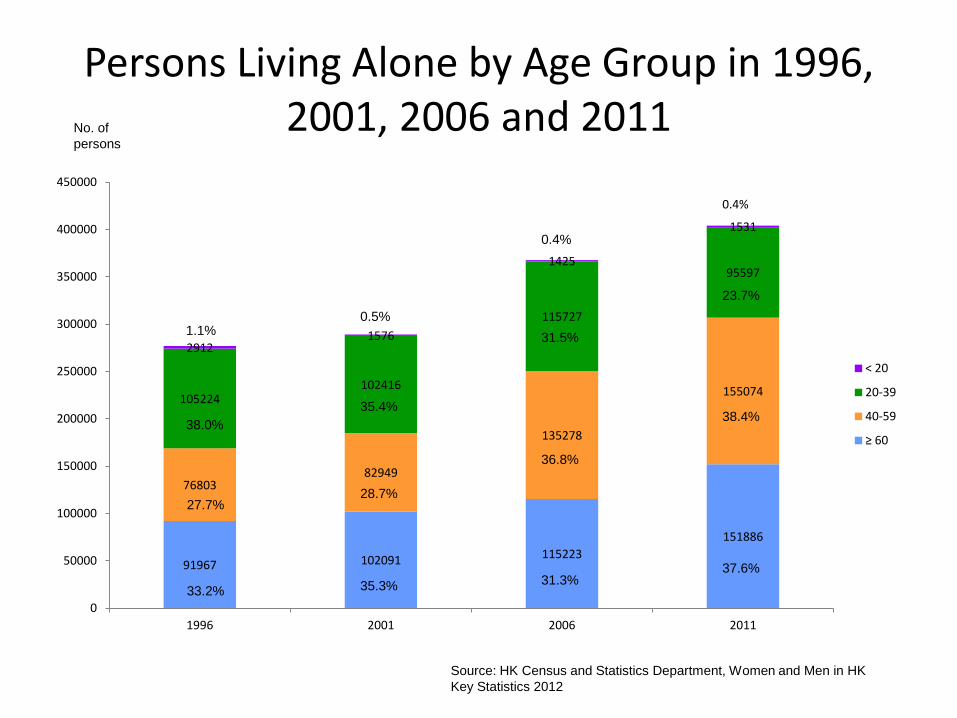
Persons Living Alone by Age Group in 1996, 2001, 2006 and 2011
91967 102091 115223
151886
76803 82949
135278
155074 105224
102416
115727
95597
2912 1576
1425
1531
0
50000
100000
150000
200000
250000
300000
350000
400000
450000
1996 2001 2006 2011
< 20
20-39
40-59
≥ 60
1.1%
35.3%
28.7%
35.4%
0.5%
31.3%
36.8%
31.5%
0.4%
37.6%
38.4%
23.7%
0.4%
33.2%
27.7%
38.0%
Source: HK Census and Statistics Department, Women and Men in HK
Key Statistics 2012
No. of
persons

Determinants of Supply
• Availability and costs of factors of production
• Factors of production
– Capital, land, labour, raw materials…
• Technology of building

Determinants of Supply
• Government legislations or regulations
• Policy Risk

Determinants of Supply
• Inelastic supply in short run
– Price is largely determined by demand
• New supplies follow this price, R as initial price
• More elastic supply in long run
– Value, V as discounting cash flows of rents will be compared to construction costs C
Rent
Stock of housing
D R
SH Value
Housing starts,
Hs
V
C

Policy History

Early History of Public Housing
1950s
•Large Influx of refugees
•Poor hill side shelter
Turning point
• On 25 December 1953, a major fire destroyed the Shek Kip Mei squatter areas.
1950-60
•Emergence public shelters
•Provisional Resettlement units

Objectives of public housing policy
50s-60s
•Emergency Housing
•Basic Living environment
•PRH by HK housing Authority
70s and 80s
•Permanent Housing
•Quality Housing
•Ten years housing proramme: New towns, HOS, Private Sector Participation Scheme (PSPS)
•Promotion of Home ownership
1997-2000
•Target of 85,000 flats per year (50,000 public flats)
•Asian Financial Crisis
• Increasing role of the private market
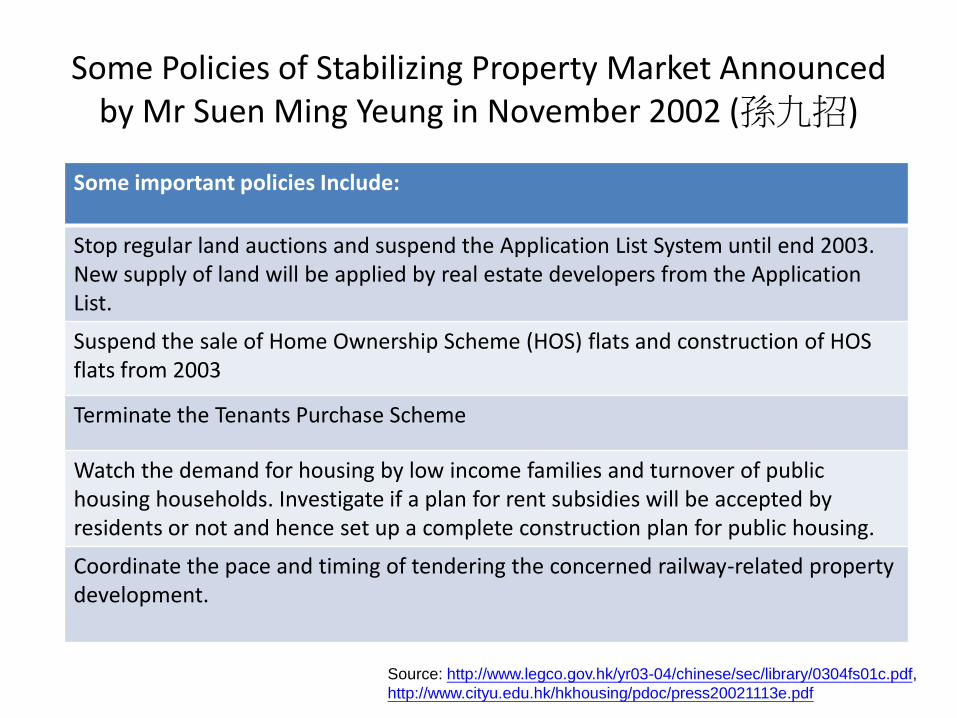
Some Policies of Stabilizing Property Market Announced by Mr Suen Ming Yeung in November 2002 (孫九招)
Some important policies Include:
Stop regular land auctions and suspend the Application List System until end 2003. New supply of land will be applied by real estate developers from the Application List.
Suspend the sale of Home Ownership Scheme (HOS) flats and construction of HOS flats from 2003
Terminate the Tenants Purchase Scheme
Watch the demand for housing by low income families and turnover of public housing households. Investigate if a plan for rent subsidies will be accepted by residents or not and hence set up a complete construction plan for public housing.
Coordinate the pace and timing of tendering the concerned railway-related property development.
Source: http://www.legco.gov.hk/yr03-04/chinese/sec/library/0304fs01c.pdf,
http://www.cityu.edu.hk/hkhousing/pdoc/press20021113e.pdf

Date Ad Valorem Stamp Duty
Special Stamp Duty Buyer’s Stamp Duty
1 April 2010 Increased from the old rates
20 November 2010 – 26 October 2012
Started to levy (Stage 1)
27 October 2012 Adjusted to Stage 2 Started to levy
23 February 2013 Announced for a further adjustment
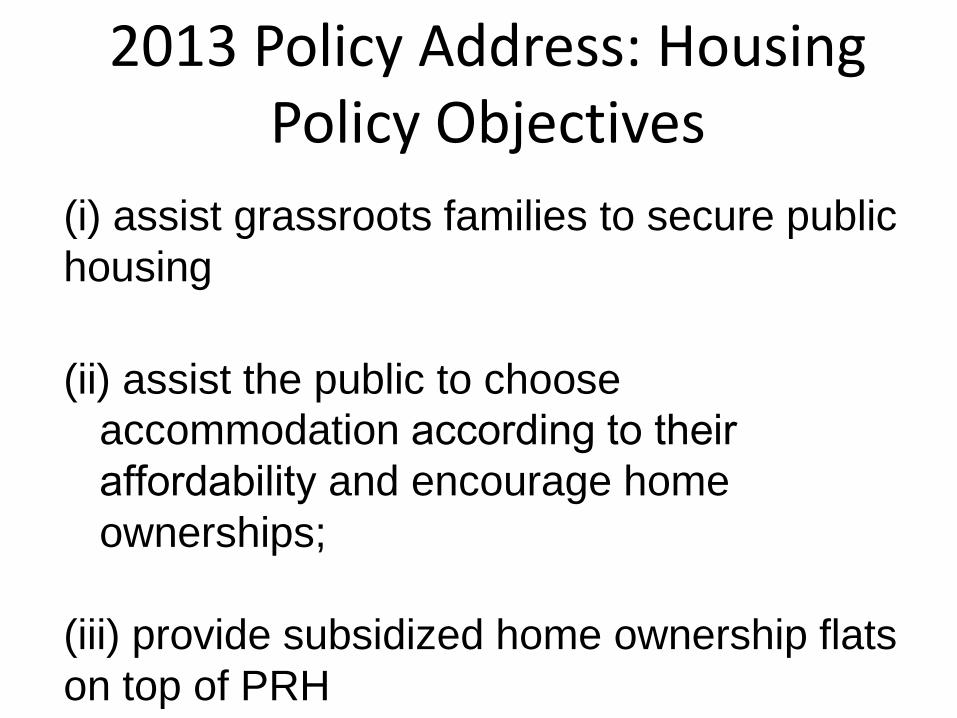
2013 Policy Address: Housing Policy Objectives
(i) assist grassroots families to secure public
housing
(ii) assist the public to choose
accommodation according to their
affordability and encourage home
ownerships;
(iii) provide subsidized home ownership flats
on top of PRH

Data
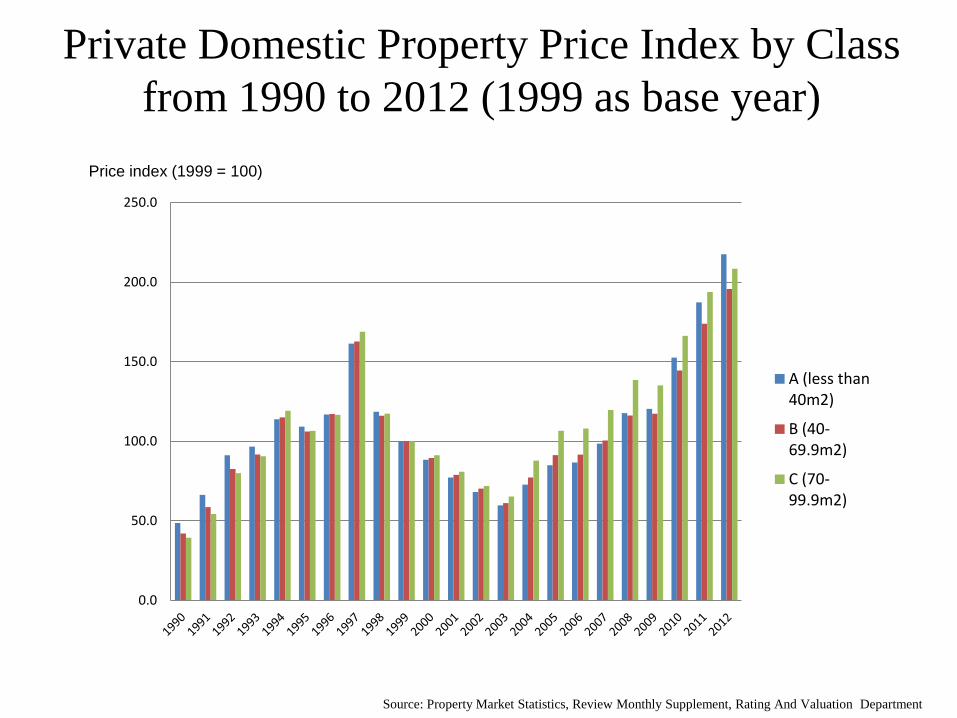
Private Domestic Property Price Index by Class
from 1990 to 2012 (1999 as base year)
0.0
50.0
100.0
150.0
200.0
250.0
A (less than 40m2)
B (40-69.9m2)
C (70-99.9m2)
Source: Property Market Statistics, Review Monthly Supplement, Rating And Valuation Department
Price index (1999 = 100)
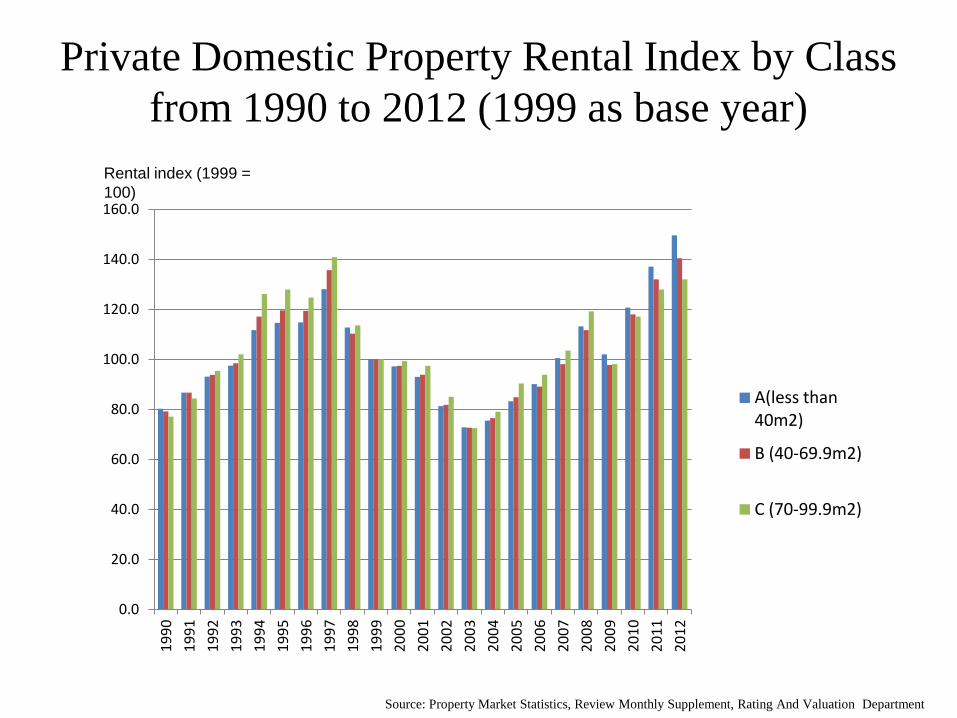
Private Domestic Property Rental Index by Class
from 1990 to 2012 (1999 as base year)
0.0
20.0
40.0
60.0
80.0
100.0
120.0
140.0
160.0
19
90
19
91
19
92
19
93
19
94
19
95
19
96
19
97
19
98
19
99
20
00
20
01
20
02
20
03
20
04
20
05
20
06
20
07
20
08
20
09
20
10
20
11
20
12
A(less than 40m2)
B (40-69.9m2)
C (70-99.9m2)
Rental index (1999 =
100)
Source: Property Market Statistics, Review Monthly Supplement, Rating And Valuation Department

Private Domestic Property Rental Index by Class
and CPI (A) from 2003 to 2012 (1999 as base year)
0.0
20.0
40.0
60.0
80.0
100.0
120.0
140.0
160.0
1999 2000 2001 2002 2003 2004 2005 2006 2007 2008 2009 2010 2011 2012
A(less than 40m2)
B (40-69.9m2)
C (70-99.9m2)
CPI (A) (1999=100)
Rental index (1999 =
100)
Source: HK Census and Statistics Department, Property Market Statistics, Review Monthly Supplement, Rating And
Valuation Department

Private Domestic Property Stock by Class
from 1985 to 2012
Source: Property market statistics, Review Monthly supplement, Rating and Valuation Department
(‘000)
0
100
200
300
400
500
600
700
19
85
19
86
19
87
19
88
19
89
19
90
19
91
19
92
19
93
19
94
19
95
19
96
19
97
19
98
19
99
20
00
20
01
20
02
20
03
20
04
20
05
20
06
20
07
20
08
20
09
20
10
20
11
20
12
Type A (Less than 40 m2)
Type B (40 m2 to 69.9m2)
Type C (70 m2 to 99.9 m2)
*The figures from
2003-2012 have been
adjusted as the original
figures of this period
of time exclude village
houses in the source.

Index of Private Domestic Property Stock by
Class from 2003 to 2012 (2003 as base year)
Source: Property market statistics, Review Monthly supplement, Rating and Valuation Department
2003 = 100
90
95
100
105
110
115
120
2003 2004 2005 2006 2007 2008 2009 2010 2011 2012
Type A (Less than 40 m2)
Type B (40 m2 to 69.9 m2)
Type C (70 m2 to 99.9 m2)
*The figures from 2003-
2012 have been adjusted
as the original figures of
this period of time
exclude village houses in
the source.

Cumulative Number of Home Ownership Scheme Flats
from 1980 to 2002
(Use year of completion as standard)
0
50000
100000
150000
200000
250000
300000
1980 1981 1982 1983 1984 1985 1986 1987 1988 1989 1990 1991 1992 1993 1994 1995 1996 1997 1998 1999 2000 2001 2002
Source: http://www.housingauthority.gov.hk/tc/common/pdf/home-ownership/surplus-hos-flats/list-of-hos-courts/hos_flats-b5-250811.pdf
No. of
flats

Source: http://www.housingauthority.gov.hk/tc/common/pdf/home-ownership/surplus-hos-flats/list-of-hos-courts/hos_flats-b5-
250811.pdf
Total Number of Completion of Home Ownership
Scheme Flats from 1980 to 2002
(Use year of completion as standard)
0
5000
10000
15000
20000
25000
30000
35000
40000
1980 1981 1982 1983 1984 1985 1986 1987 1988 1989 1990 1991 1992 1993 1994 1995 1996 1997 1998 1999 2000 2001 2002
No. of
flats

Stock of Public Rental Flats
in 2002, 2007 and 2012
640
660
680
700
720
740
760
780
2002 2007 2012
(‘000)
Source: Hong Kong Housing
Authority

Actual Public Rental Housing Production
from 2002/03 to 2011/12
0
5000
10000
15000
20000
25000
30000
2002/03 2003/04 2004/05 2005/06 2006/07 2007/08 2008/09 2009/10 2010/11 2011/12
Source: Hong Kong Housing Authority
No. of
flats
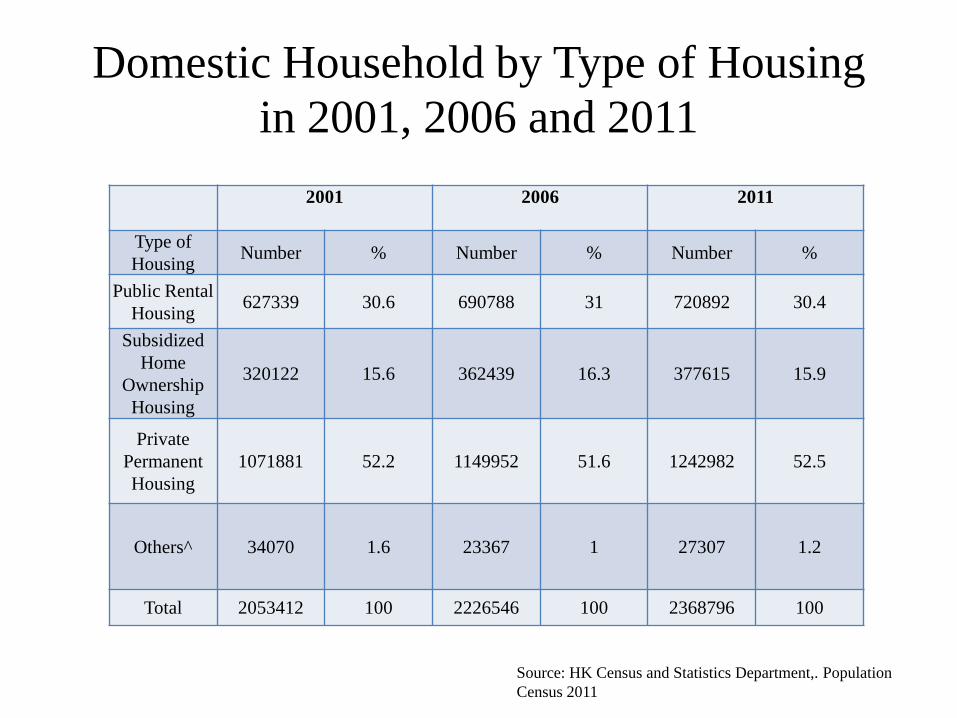
Domestic Household by Type of Housing
in 2001, 2006 and 2011
2001
2006
2011
Type of
Housing Number % Number % Number %
Public Rental
Housing 627339 30.6 690788 31 720892 30.4
Subsidized
Home
Ownership
Housing
320122 15.6 362439 16.3 377615 15.9
Private
Permanent
Housing
1071881 52.2 1149952 51.6 1242982 52.5
Others^ 34070 1.6 23367 1 27307 1.2
Total 2053412 100 2226546 100 2368796 100
Source: HK Census and Statistics Department,. Population
Census 2011

Distribution of Domestic Households by Tenure of
Accommodation (2011)
Source: HK Census and Statistics Department, Population
Census 2011 Table E102 and E103
30.40%
15.90% 36.20%
16.30%
1.20%
Public Rental Housing
Home Ownership Scheme Flats
Pirvate Permanent Housing (Owner-occupiers)
Private Permanent Housing (Renting)
Others
*The calculations of Private Permanent Housing (Owner-occupiers) and
Private Permanent Housing (Renting) are based on an assumption and the
data from HK Census and Statistics Department.

Median Monthly Domestic Household Rent and
Median Rent To Income Ratios By Type Of
Quarters in 2001,2006 and 2011
Median Monthly Domestic
Household Rent (HK$)
Median Household Income
(HK$)
Median Rent to Income
Ratio(%)
Type of
quarters /
Year
2001 2006 2011 2001 2006 2011 2001 2006 2011
Public
Rental
Housing
Units
1300 1390 1210 12500 10296 11415 10.4 13.5 10.6
Private
Permanent
Housing
5300 5100 7500 19413 20238 29182 27.3 25.2 25.7
Source: HK Census and Statistics Department,. Population
Census 2011

Economic Model
54
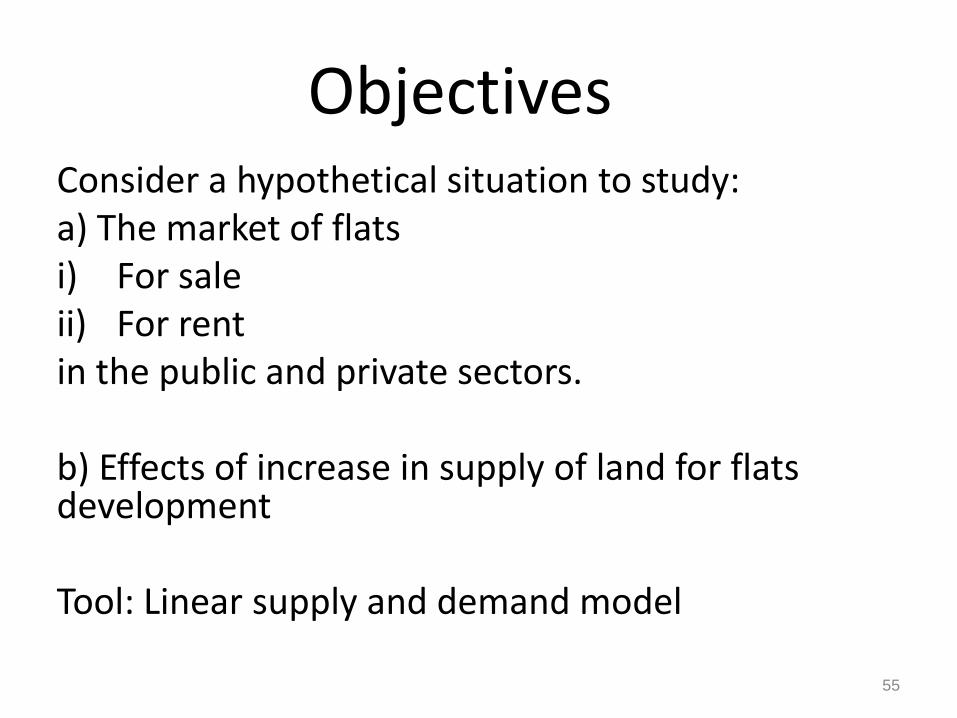
Objectives Consider a hypothetical situation to study: a) The market of flats i) For sale ii) For rent in the public and private sectors. b) Effects of increase in supply of land for flats development Tool: Linear supply and demand model
55

A flat for accommodation and/or for investment
The value of a flat is made up of :
a) The value of housing services yielded
b) The rate of monetary return of the flat (i.e. rents) as an investment asset
The willingness to pay to buy and willingness to accept to sell depend on the perceived value of the flat.
56

Key Assumption An individual user, who needs a flat, demands only ONE unit of flat.
57

Overview of Housing Market Analysis
Residual Demand
Private
Primary
Market
Residual Demand
Private Secondary
Market
Unmet Demand
Private Rental Market
Residual Demand
Public HOS
Market
Residual Demand
Public PHR
Market
Unmet
Demand
Private Rental Market
Means Tests
Total 2000
demanders for
private flats at zero
price
Among them,
1000 eligible
applicants for
HOS flats at
zero price (600
eligible PRH
applicants)
+
58

Private Primary Flats Market
Quantity demand at zero price = 2000
Demand:
Buyers are willing to pay a first hand flat at different prices
Supply:
Fixed quantity
Quantity Traded:
200 buyers of first hand flats
Quantity of flats
Supply of first hand flats
from developers
Demand
for first
hand flats
Price per flat (in million dollars)
200 2000 0
4.5
Residual demand
59

Private Secondary Flats Market
Quantity demanded at zero price = 2000-200 = 1800
Demand:
Buyers are willing to pay a second hand flat at different prices.
Supply:
Suppliers are willing to accept to sell their flats at different prices
Quantity Traded:
200 buyers of second hand flats.
Quantity of flats
Supply of second hand private flats
Demand for
private
second
hand flats
Price per flat (in million dollars)
200 1800 0
4
2
Residual demand
60
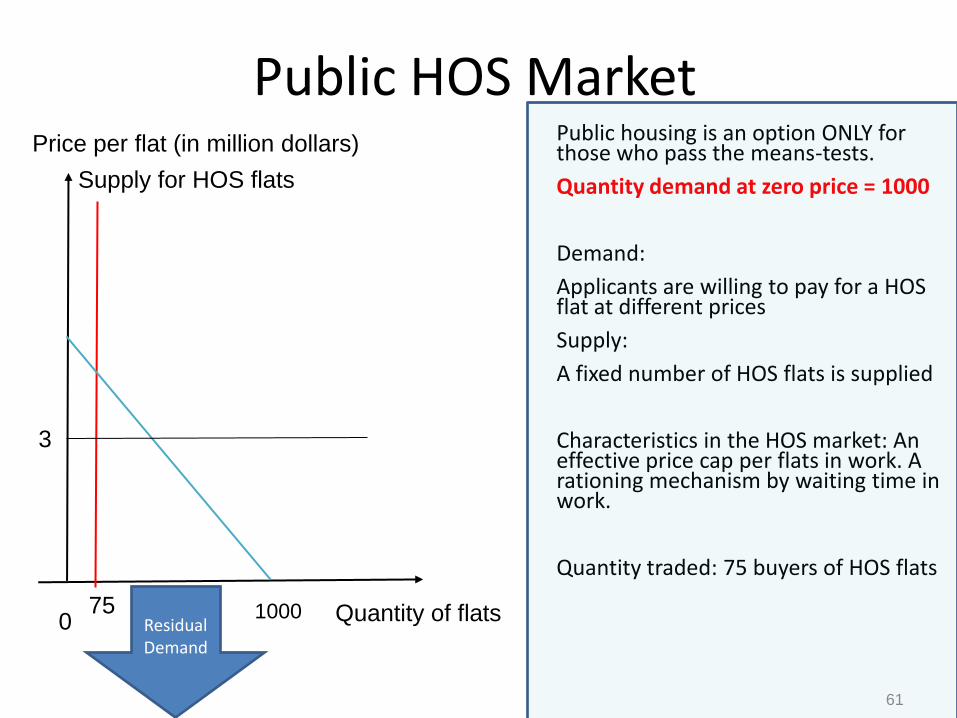
Public HOS Market Public housing is an option ONLY for those who pass the means-tests.
Quantity demand at zero price = 1000
Demand:
Applicants are willing to pay for a HOS flat at different prices
Supply:
A fixed number of HOS flats is supplied
Characteristics in the HOS market: An effective price cap per flats in work. A rationing mechanism by waiting time in work.
Quantity traded: 75 buyers of HOS flats
Supply for HOS flats
3
Quantity of flats
Price per flat (in million dollars)
75 1000 0 Residual Demand
61
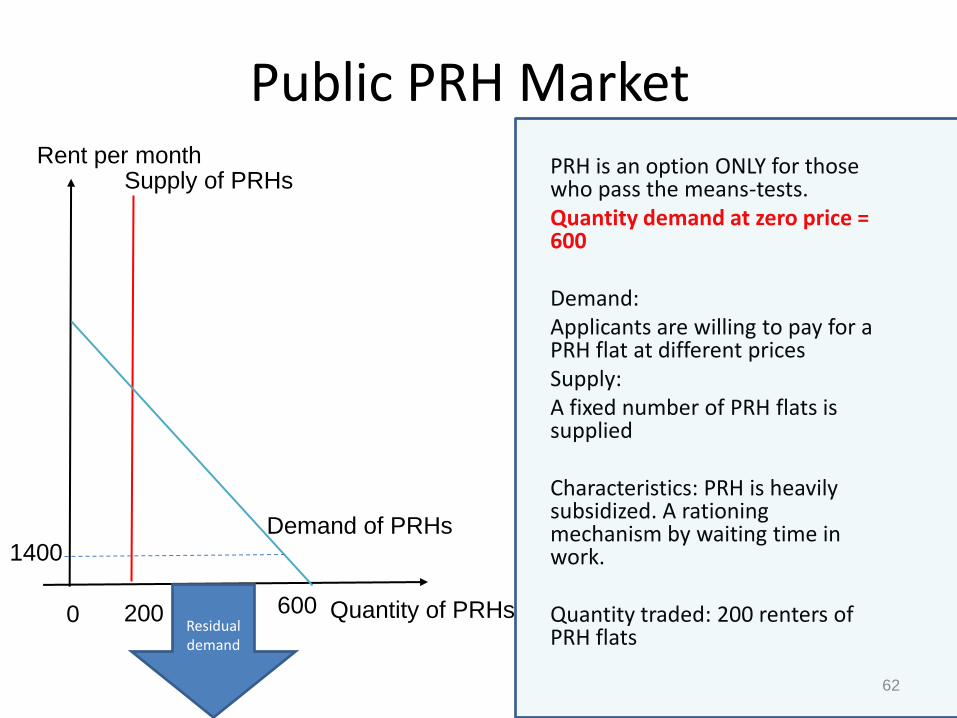
Public PRH Market PRH is an option ONLY for those who pass the means-tests. Quantity demand at zero price = 600 Demand: Applicants are willing to pay for a PRH flat at different prices Supply: A fixed number of PRH flats is supplied Characteristics: PRH is heavily subsidized. A rationing mechanism by waiting time in work. Quantity traded: 200 renters of PRH flats
Supply of PRHs
1400
Quantity of PRHs
Rent per month
Demand of PRHs
200 600 0 Residual demand
62

Private Rental Flats Market
Demand: a) Mix of potential renters of flats = people who
cannot afford the down payment + people who can afford down payment but fail to buy private flats
b) The rents per year at which renters are willing to pay are different.
Supply: Flat owners ask for different levels of rent to lease their flats. 63
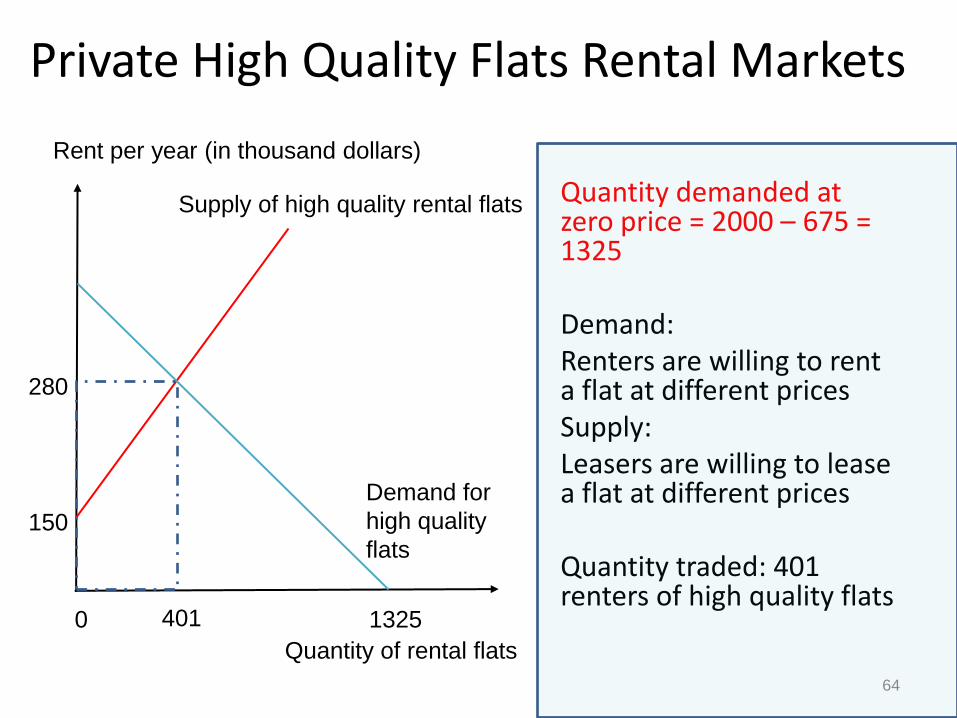
Private High Quality Flats Rental Markets
Supply of high quality rental flats
Demand for
high quality
flats
Quantity of rental flats
Rent per year (in thousand dollars)
401 1325 0
280
150
Quantity demanded at zero price = 2000 – 675 = 1325 Demand: Renters are willing to rent a flat at different prices Supply: Leasers are willing to lease a flat at different prices Quantity traded: 401 renters of high quality flats
64

Private Middle Quality Flats Rental Markets
Supply of middle quality rental flats
Demand for
middle
quality flats
Rent per year (in thousand dollars)
350 924 0
180
Quantity of rental flats
Unmet demand: some left unsatisfied, some
search for low quality rental options
100
Quantity demanded at zero price = 1325-401 = 924 Demand: Renters are willing to rent a flat at different prices Supply: Leasers are willing to lease a flat at different prices Quantity traded: 350 renters of middle quality flats 65

Private Subdivided Units Rental Market
Quantity demanded at price zero = 924-350=574 The rise of the subdivided units in the flats in the private market is to house the residual demanders in other market: a) who cannot find anything
in both the normal private selling and rental market, and
b) who are not yet housed by the public market.
Quantity traded: 170 renters of subdivided units
Supply of subdivided units
3000
Quantity of
subdivided
units
Rent per month
Demand of subdivided units
170 574 0
1000
Unmet demand becomes homeless, or stay
where they live currently 66

Summary
• The private market will not fully cover the need of housing demand.
• There will be excess demand in the subsidized public flats market.
• Private rental market provides tiers of rental flats to meet the demand, including subdivided rental units.
67

Policy Analysis and Evaluation
68

Increasing Land Supply in Private Market
69
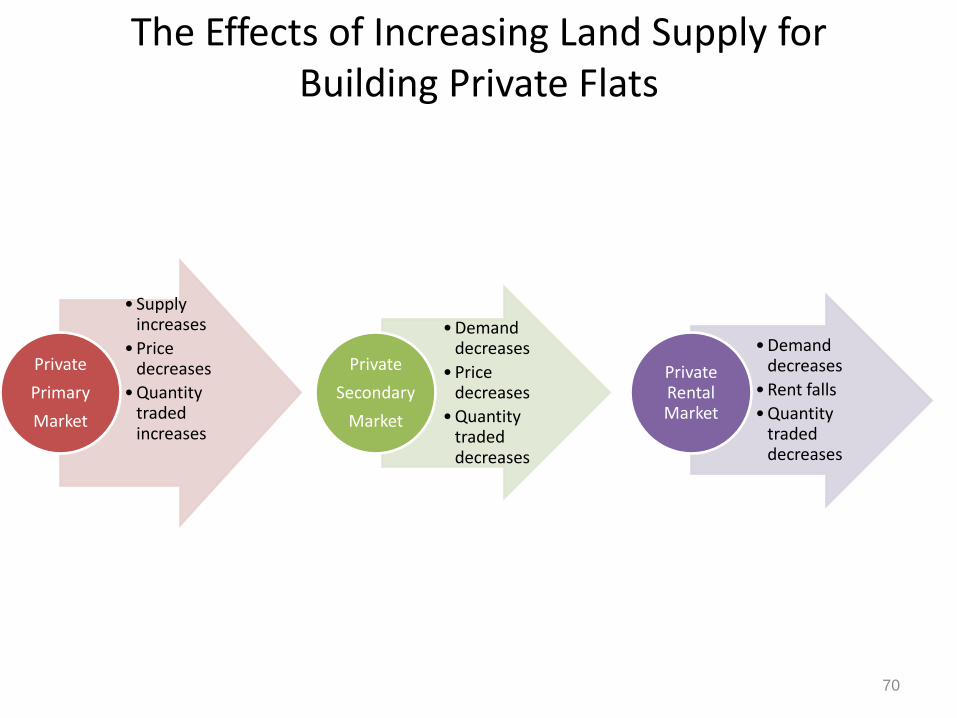
The Effects of Increasing Land Supply for Building Private Flats
• Supply increases
• Price decreases
• Quantity traded increases
Private
Primary
Market
• Demand decreases
• Price decreases
• Quantity traded decreases
Private
Secondary
Market
• Demand decreases
• Rent falls
• Quantity traded decreases
Private Rental Market
70

Private Primary Flats Market
Quantity of flats
Supply of first hand flats
from developers
Demand
for first
hand flats
Price per flat (in million dollars)
200 2000 0
4.5
Residual Demand
5
400
4
2000 potential buyers of first hand flats
Supply increases
Demand unchanged
Price decreases
Quantity traded decreases
400 buyers of first hand flats
71

Private Secondary Flats Market
Quantity demanded at zero price = 1600 = 2000 - 400
Supply unchanged
Demand decreases
Price decreases
Quantity traded decreases
180 buyers of second hand flats
Quantity of flats
Supply of second hand private flats
Demand
for private
second
hand flats
Price per flat (in million dollars)
180 1800 0
4
Residual Demand
2
1600
72
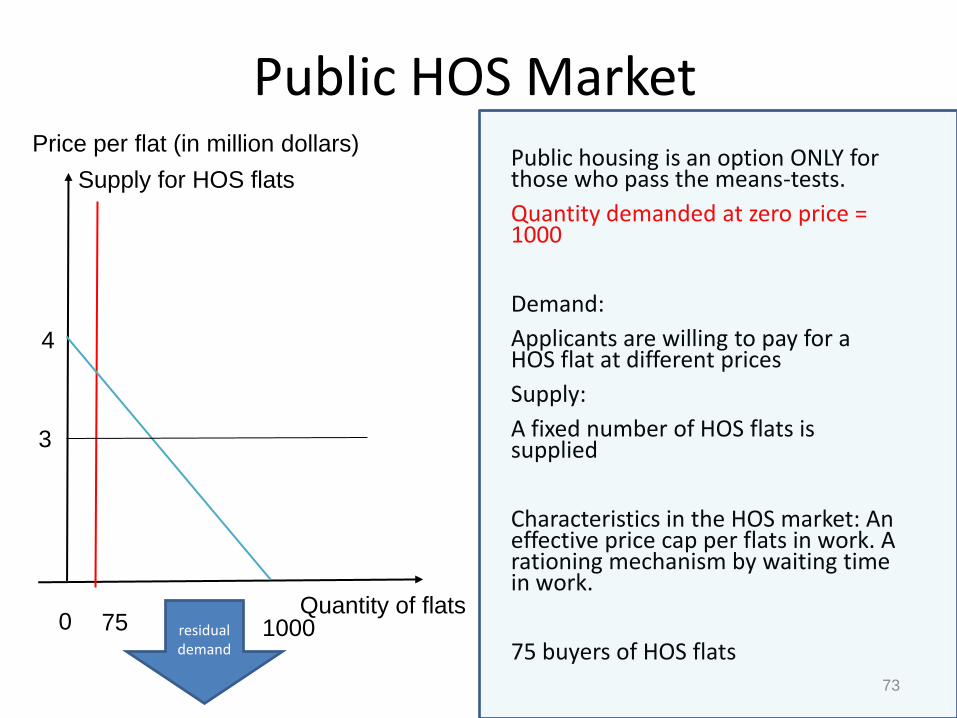
Public HOS Market Public housing is an option ONLY for those who pass the means-tests.
Quantity demanded at zero price = 1000
Demand:
Applicants are willing to pay for a HOS flat at different prices
Supply:
A fixed number of HOS flats is supplied
Characteristics in the HOS market: An effective price cap per flats in work. A rationing mechanism by waiting time in work.
75 buyers of HOS flats
Supply for HOS flats
3
Quantity of flats
Price per flat (in million dollars)
75 1000 0 residual demand
4
73
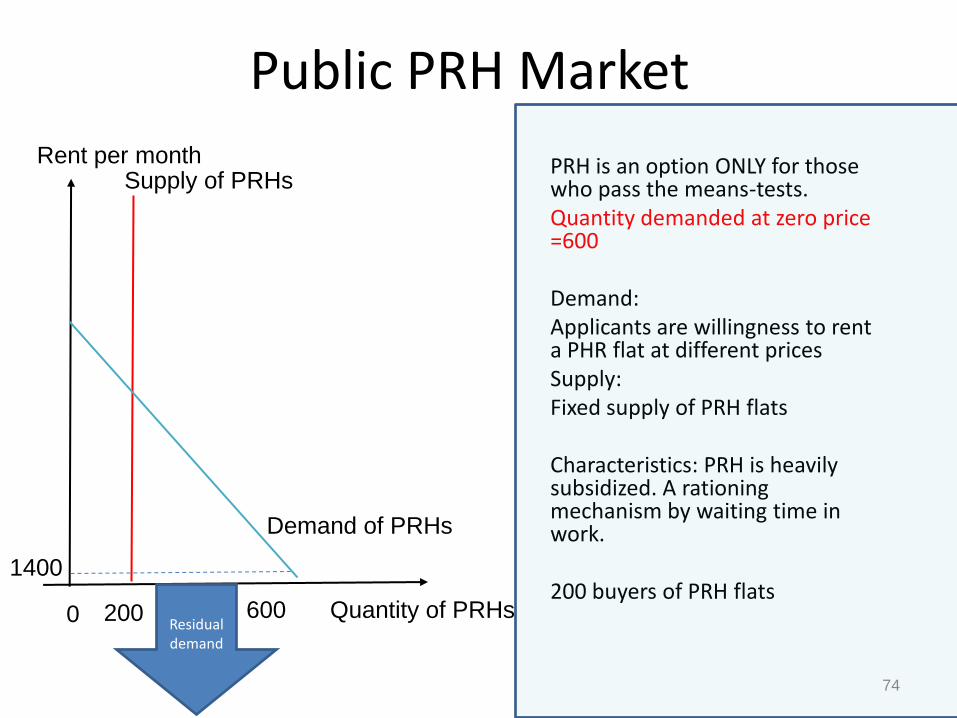
Public PRH Market
PRH is an option ONLY for those who pass the means-tests. Quantity demanded at zero price =600 Demand: Applicants are willingness to rent a PHR flat at different prices Supply: Fixed supply of PRH flats Characteristics: PRH is heavily subsidized. A rationing mechanism by waiting time in work. 200 buyers of PRH flats
Supply of PRHs
1400
Quantity of PRHs
Rent per month
Demand of PRHs
200 600 0 Residual demand
74

Supply of rental flats of higher quality
Demand for
private high
quality flats
Quantity of rental flats
Rent per year (in thousand dollars)
370 1325 0
280
244
401 1145
150
Quantity demanded at zero price = 2000 – 855 = 1145 Demand decreases Supply unchanged Price decreases Quantity traded decreases 370 renters of high quality flats
Residual Demand
Private High Quality Rental Flats Markets
75
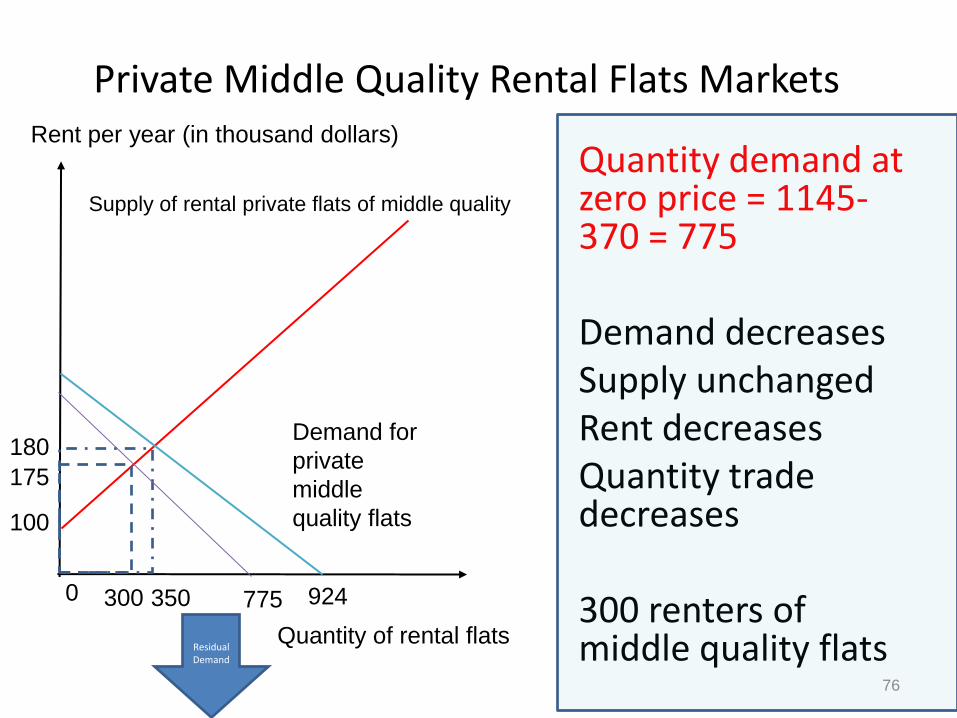
Supply of rental private flats of middle quality
Demand for
private
middle
quality flats
Rent per year (in thousand dollars)
350 924 0
180
Quantity of rental flats
775
100
300
175
Quantity demand at zero price = 1145-370 = 775 Demand decreases Supply unchanged Rent decreases Quantity trade decreases 300 renters of middle quality flats
Private Middle Quality Rental Flats Markets
Residual Demand
76

Private Subdivided Units Rental Market
Supply of subdivided units
3000
Quantity of
subdivided
units
Rent per month
Demand of subdivided
units
170 574 0
1000
475
2210
Unmet Demand
Quantity demanded at zero price = 775-300 = 475 Demand Decreases Supply Unchanged Rent decreases Quantity traded decreases 150 renters of subdivided units
150
77

Policy Evaluation
Will increase land supply for private flats improve the living conditions for the grass root households? Suggested Answer: • It depends on the room it creates in the rental
market for renters to move upstream from the lowest tier market. Yet, the unmet demand in the lowest tier quality market still exists.
• The people who cannot move upstream may be due to low income and/or deposit constrained.
78

Increasing Land Supply in Public Market
79

The Effects of Land Increase for Building Public Flats
• Supply increases
• Quantity traded increases
Public HOS
Market
•Supply increases
•Quantity traded increases
Public PRH
Market
•Decease the demand for subdivided units
•Rent falls
•Quantity traded decreases
Private Rental Market
80

HOS flats and Subdivided Units Rental Market
Supply for HOS flats
3
Quantity of flats
Price per flat (in million dollars)
75 1000 0
4
250
induces
Supply of rental private flats of middle quality
Demand for
private
middle
quality flats
Rent per year (in thousand dollars)
350 924 0
180
Quantity of rental flats
100
175
Residual Demand
81

PRH flats and Subdivided Units Rental Market
Supply of PRHs
1400
Quantity of
PRHs
Rent per month
Demand of PRHs
200 600 0 400
Supply of subdivided units
3000
Quantity of
subdivided
units
Rent per month
Demand of
subdivided units
170 574 0
1000
Unmet Demand
induce
(Freed up by Green Form applicants)
82

a) The rate of monetary return of the flat (i.e. rents) may be reduced.
b) The private market is affected, not immediately, but in a long run the value of first and second hand flats for sell will fall to approach an important theoretical equilibrium condition:
Fundamental value of private flats = Today annual rent + Present value of the future expected annual rents
83
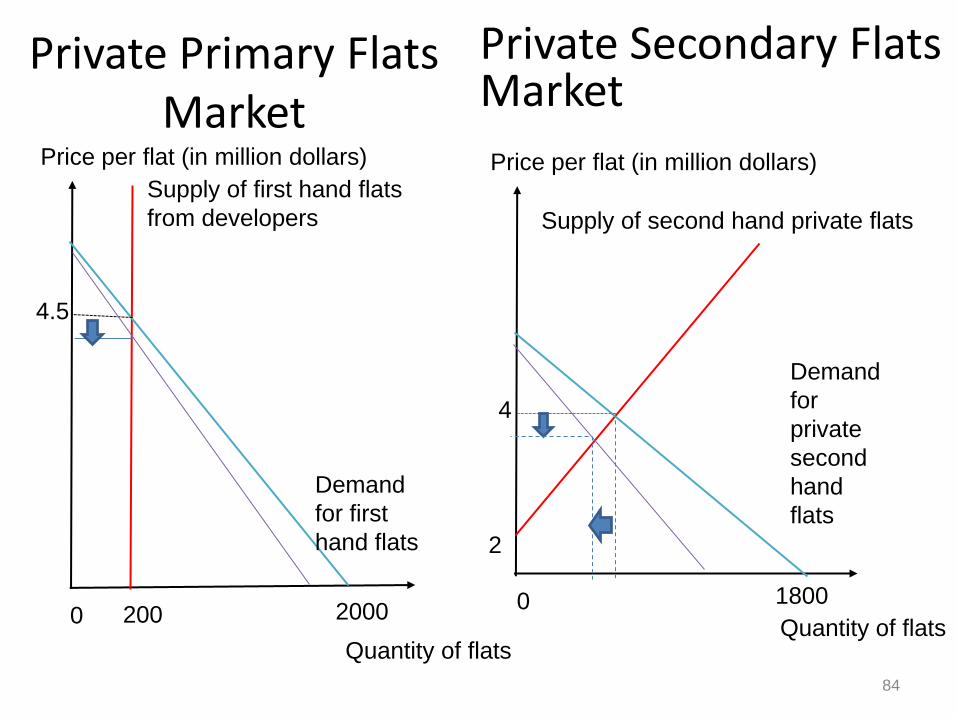
Private Primary Flats Market
Quantity of flats
Supply of first hand flats
from developers
Demand
for first
hand flats
Price per flat (in million dollars)
200 2000 0
4.5
Private Secondary Flats Market
Quantity of flats
Supply of second hand private flats
Demand
for
private
second
hand
flats
Price per flat (in million dollars)
1800 0
4
2
84

Effects of Land Supply Policy
Increase land supply policies in either the private and public sectors:
a) Lower price and rent of flats
b) May reduce quantity of flats rented
c) May reduce the number of homelessness, people living in caged homes and young people with housing needs.
85

Policy Evaluation
Will increase land for PRH improve the living conditions for the grass root households?
Suggestive answer: Yes, it can improve the applicant’s living condition by moving them in the newly developed PRH flats. By paying a subsidized rent, their quality of life will also be improved.
In addition, the living costs of the grass root households may be reduced as these households may pay lower rents for the lowest tier housing (i.e. the subdivided units).
86
Policy Evaluation
Will increase land for HOS improve the living conditions for the grass root households? Suggestive answer: Yes, an increase in HOS can increase the number of the people who are currently living in PRH to move upstream in the accommodation ladder, and thereby free up PRH resources to accommodate the applicants in line, and thus improve the grass root household’s living condition. Again, the living costs of the grass root households may be reduced as they may pay lower rents for the lowest tier housing (i.e. the subdivided units).
87

Policy Evaluation
Which one is a better policy if a policy objective is to raise the living conditions of the grass root households?
Suggestive answer: Increasing the land supply for HOS has an effect to create an upstream accommodation ladder, but increase the land supply for PRH does not. Both policies will improve the living conditions of some grass root households by moving them into the PRH flats. However, the former policy is more dynamic and has the potential to improve the living conditions of those who are currently living in PRHs but wish to own a HOS flat, and thereby freeing up resources.
88


