Tara Jensen and Ed Tollerudfor
DTC/HMT Team
Telecon – 5 Feb 2010
DTC/HMT Verification Overview
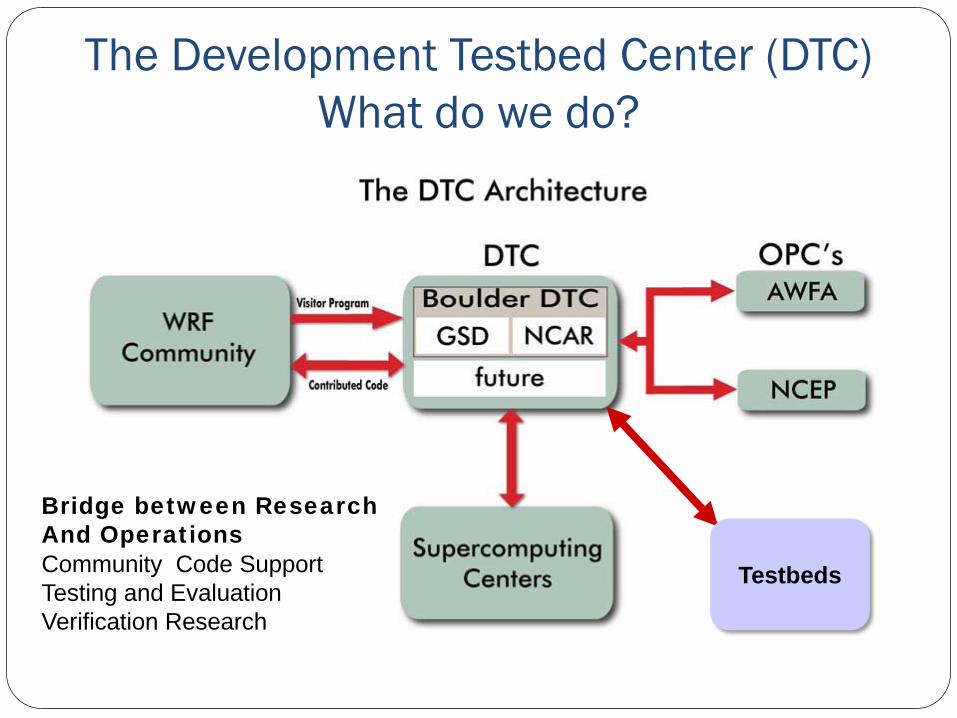
The Development Testbed Center (DTC)What do we do?
Testbeds
Bridge between ResearchAnd OperationsCommunity Code SupportTesting and EvaluationVerification Research
Evaluation system built on DTC Model Evaluation Tool (MET)
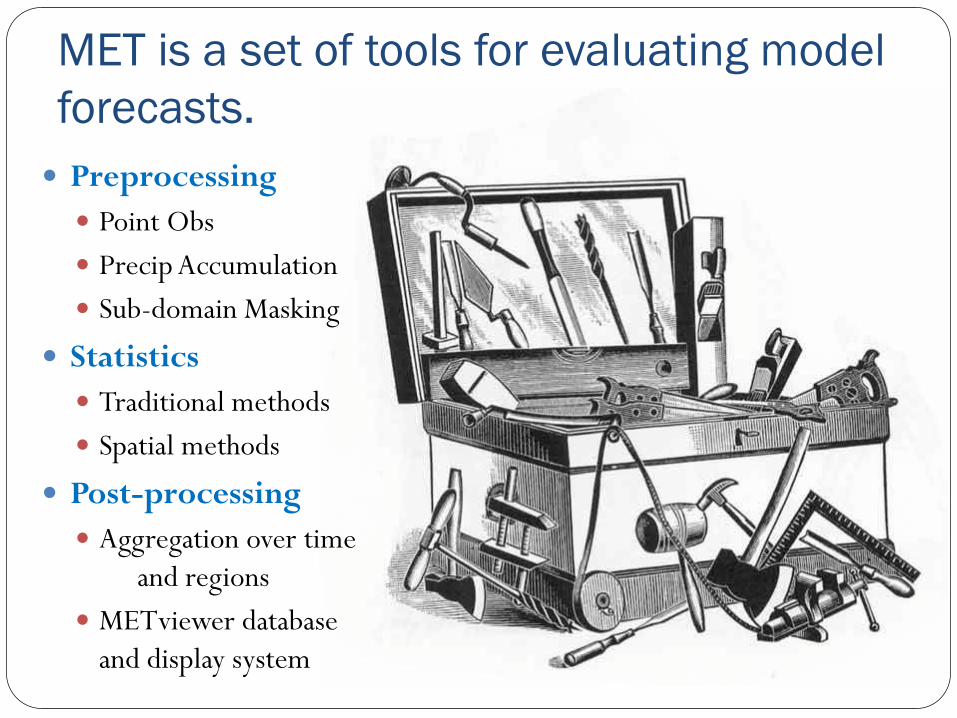
MET is a set of tools for evaluating model forecasts. Preprocessing Point Obs Precip Accumulation Sub-domain Masking
Statistics Traditional methods Spatial methods
Post-processing Aggregation over time
and regions METviewer database
and display system
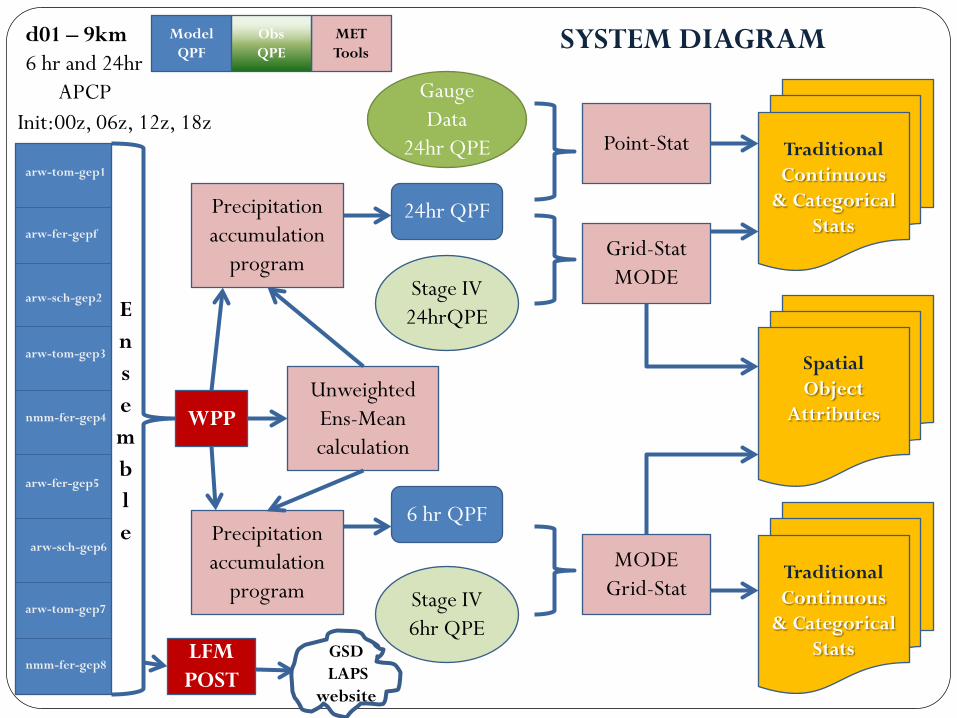
arw-tom-gep1
arw-fer-gepf
arw-sch-gep2
arw-tom-gep3
nmm-fer-gep4
arw-fer-gep5
arw-sch-gep6
arw-tom-gep7
nmm-fer-gep8
Precipitationaccumulation
program
UnweightedEns-Meancalculation
GaugeData
24hr QPE
Ensemble
Init:00z, 06z, 12z, 18z
d01 – 9km6 hr and 24hr
APCP
24hr QPF
6 hr QPF
Stage IV6hr QPE
Point-Stat
Grid-StatMODE
MODEGrid-Stat
SpatialObject
Attributes
TraditionalContinuous
& Categorical Stats
TraditionalContinuous
& Categorical Stats
SYSTEM DIAGRAMMET Tools
Stage IV24hrQPE
Precipitationaccumulation
program
ModelQPF
ObsQPE
WPP
LFMPOST
GSDLAPS
website
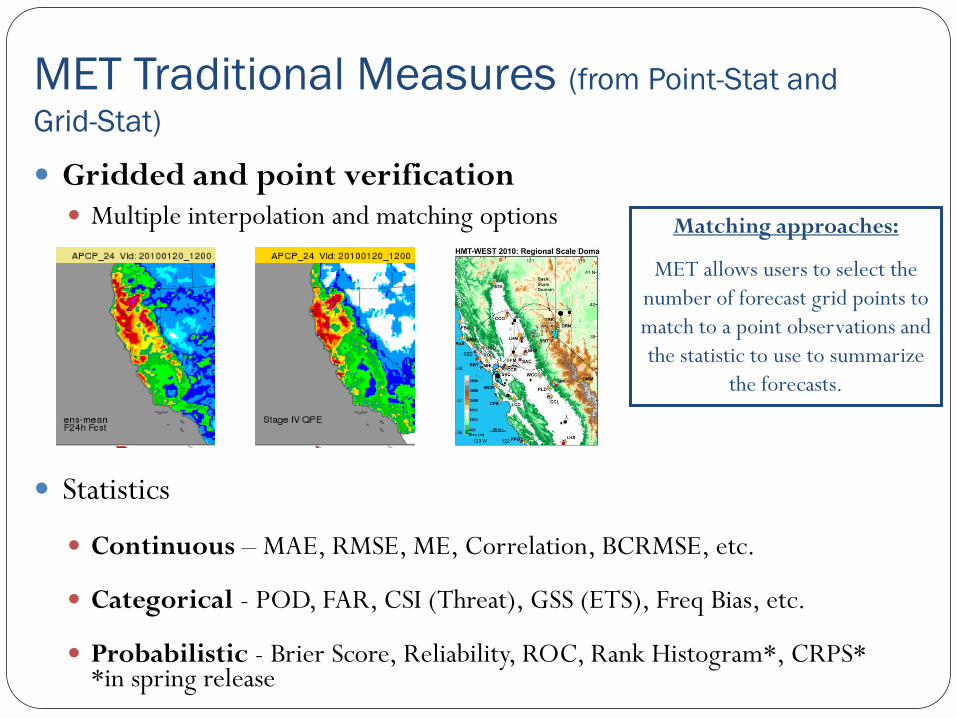
Gridded and point verification Multiple interpolation and matching options
Statistics
Continuous – MAE, RMSE, ME, Correlation, BCRMSE, etc.
Categorical - POD, FAR, CSI (Threat), GSS (ETS), Freq Bias, etc.
Probabilistic - Brier Score, Reliability, ROC, Rank Histogram*, CRPS* *in spring release
Matching approaches:
MET allows users to select the number of forecast grid points to match to a point observations and the statistic to use to summarize
the forecasts.
MET Traditional Measures (from Point-Stat and Grid-Stat)
How does model performance change over time??
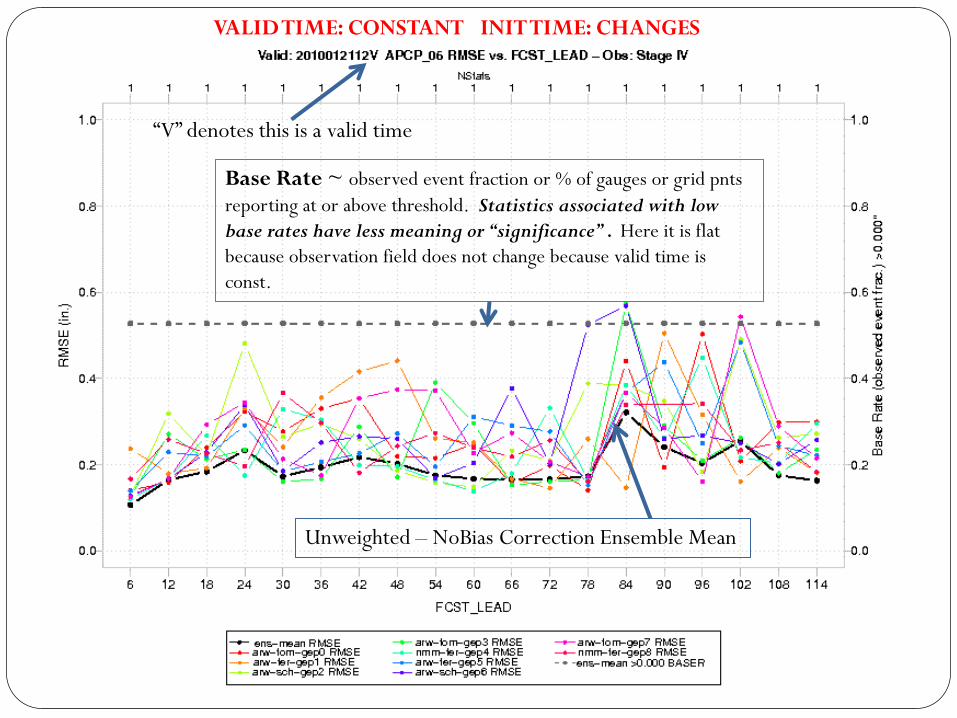
Base Rate ~ observed event fraction or % of gauges or grid pntsreporting at or above threshold. Statistics associated with low base rates have less meaning or “significance” . Here it is flat because observation field does not change because valid time is const.
Unweighted – NoBias Correction Ensemble Mean
“V” denotes this is a valid time
VALID TIME: CONSTANT INIT TIME: CHANGES
How does each model perform on a run-by-run basis??
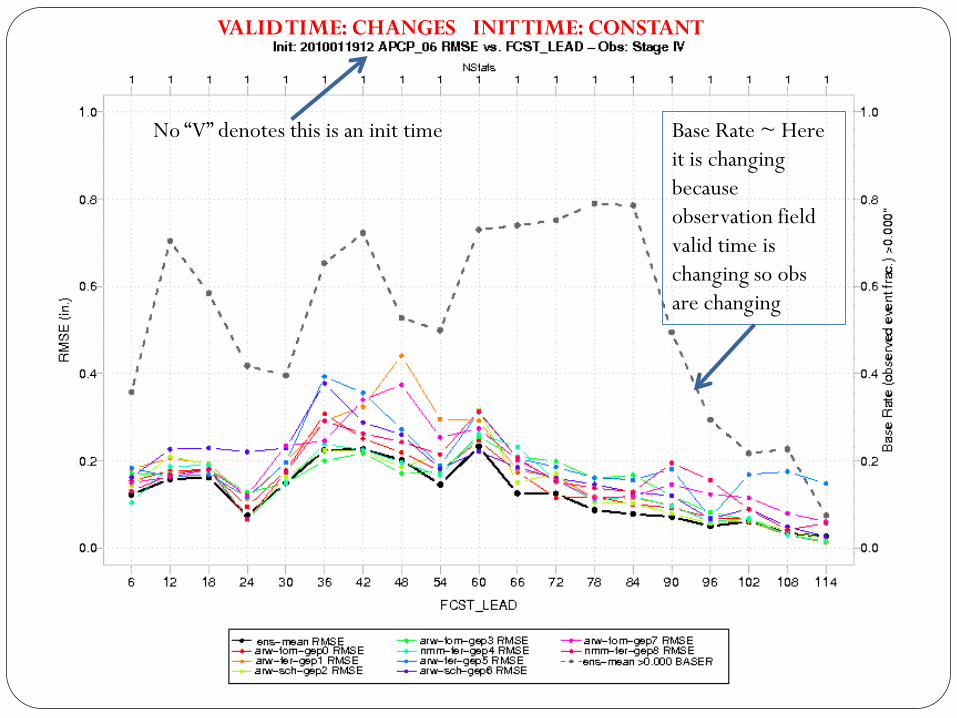
No “V” denotes this is an init time
VALID TIME: CHANGES INIT TIME: CONSTANT
Base Rate ~ Here it is changing because observation field valid time is changing so obsare changing
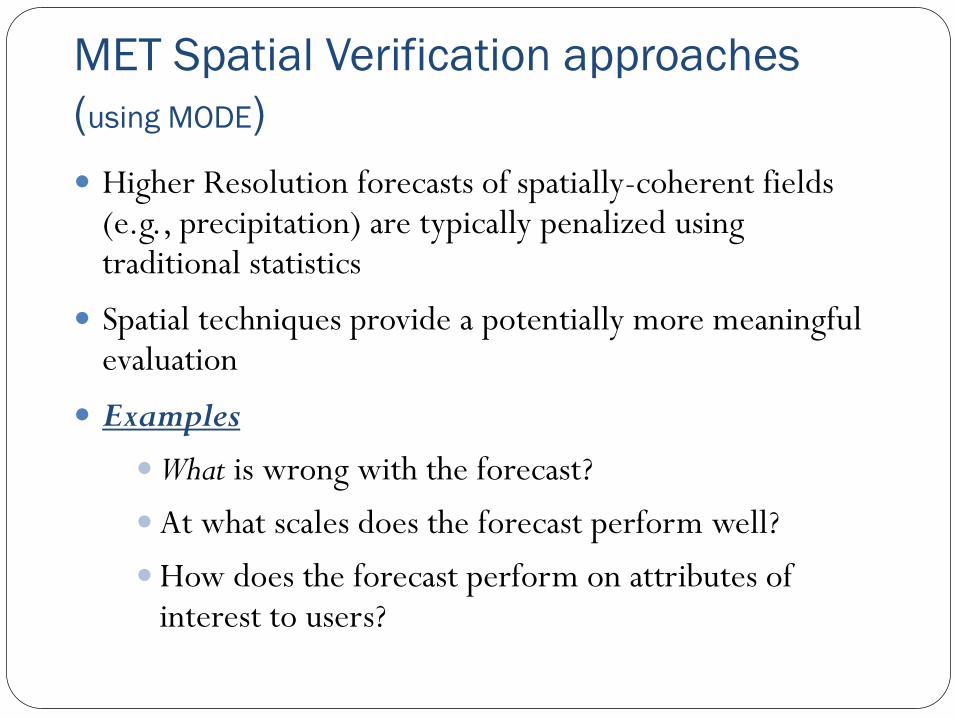
MET Spatial Verification approaches(using MODE) Higher Resolution forecasts of spatially-coherent fields
(e.g., precipitation) are typically penalized using traditional statistics
Spatial techniques provide a potentially more meaningful evaluation
Examples
What is wrong with the forecast?
At what scales does the forecast perform well?
How does the forecast perform on attributes of interest to users?
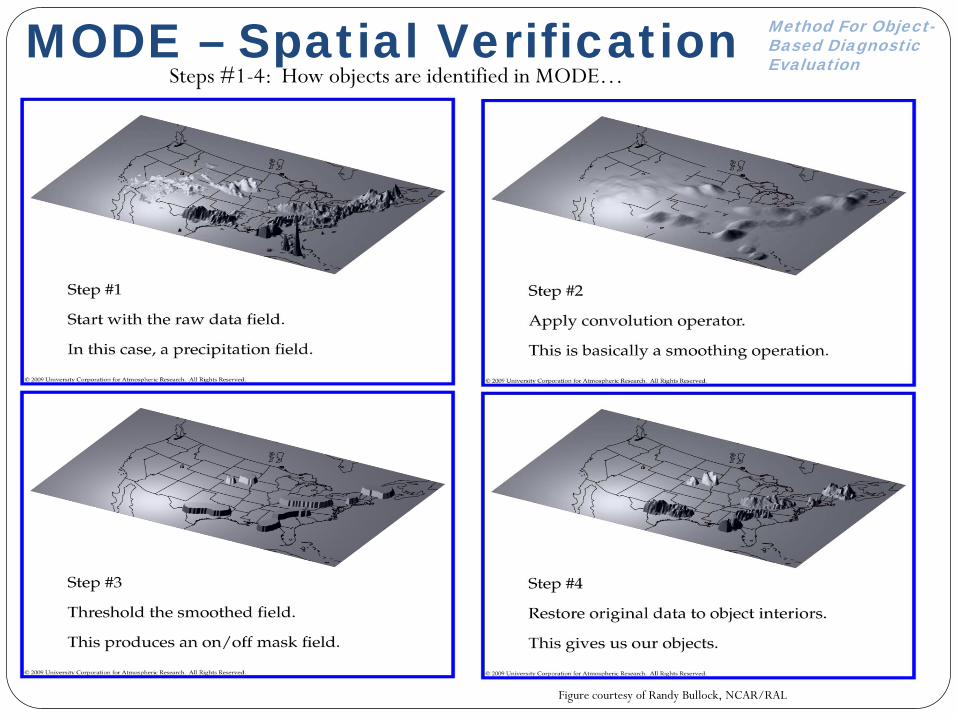
Method For Object-Based Diagnostic Evaluation
MODE – Spatial Verification
Figure courtesy of Randy Bullock, NCAR/RAL
Steps #1-4: How objects are identified in MODE…
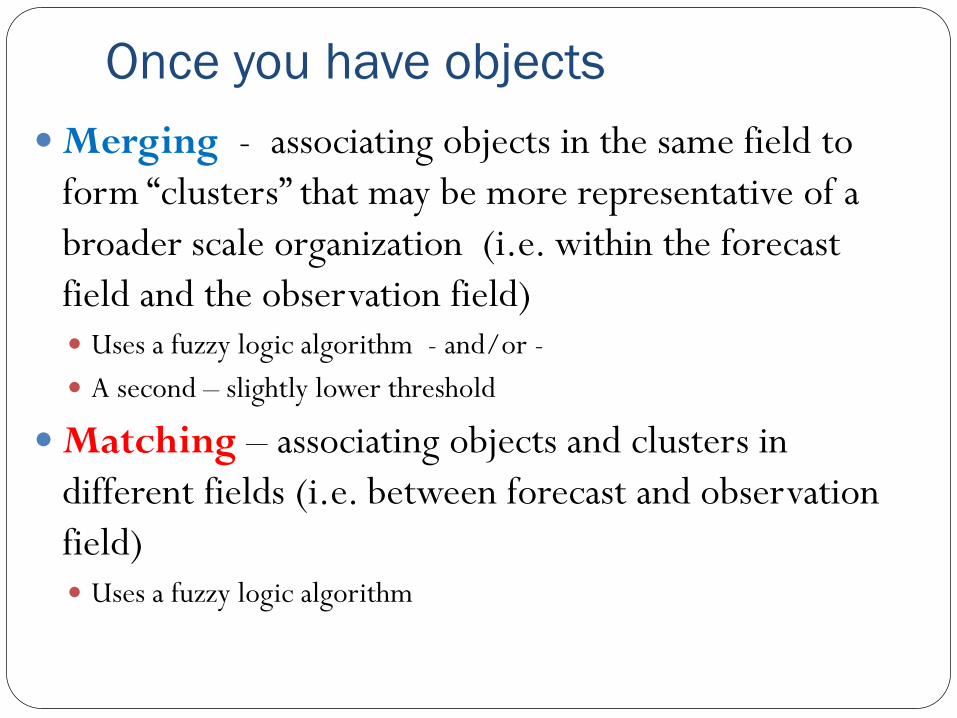
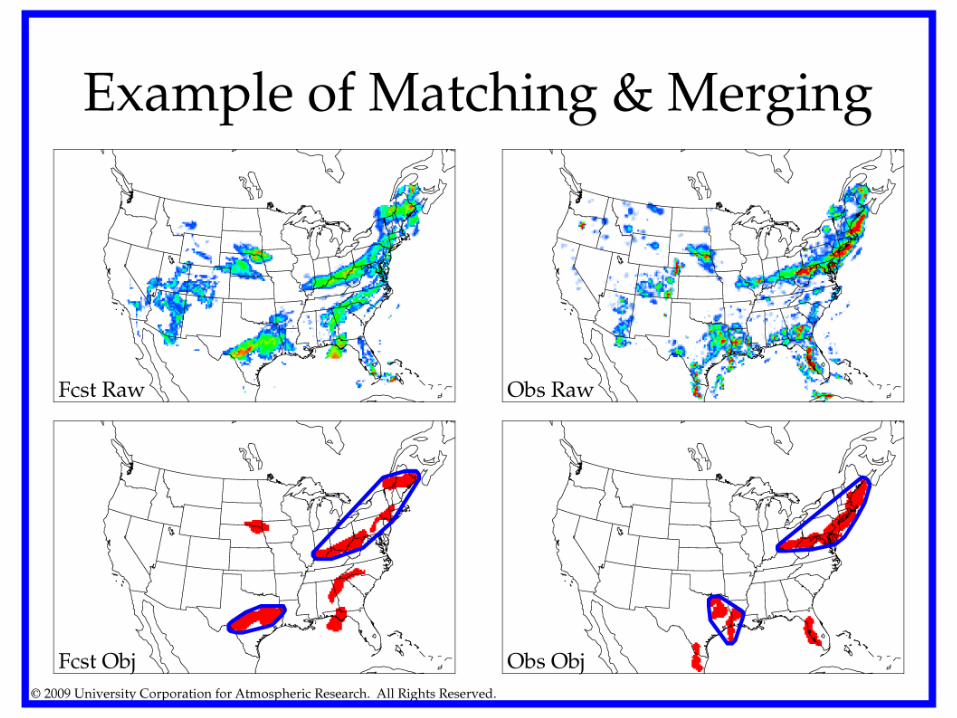
Once you have objects Merging - associating objects in the same field to
form “clusters” that may be more representative of a broader scale organization (i.e. within the forecast field and the observation field) Uses a fuzzy logic algorithm - and/or - A second – slightly lower threshold
Matching – associating objects and clusters in different fields (i.e. between forecast and observation field) Uses a fuzzy logic algorithm
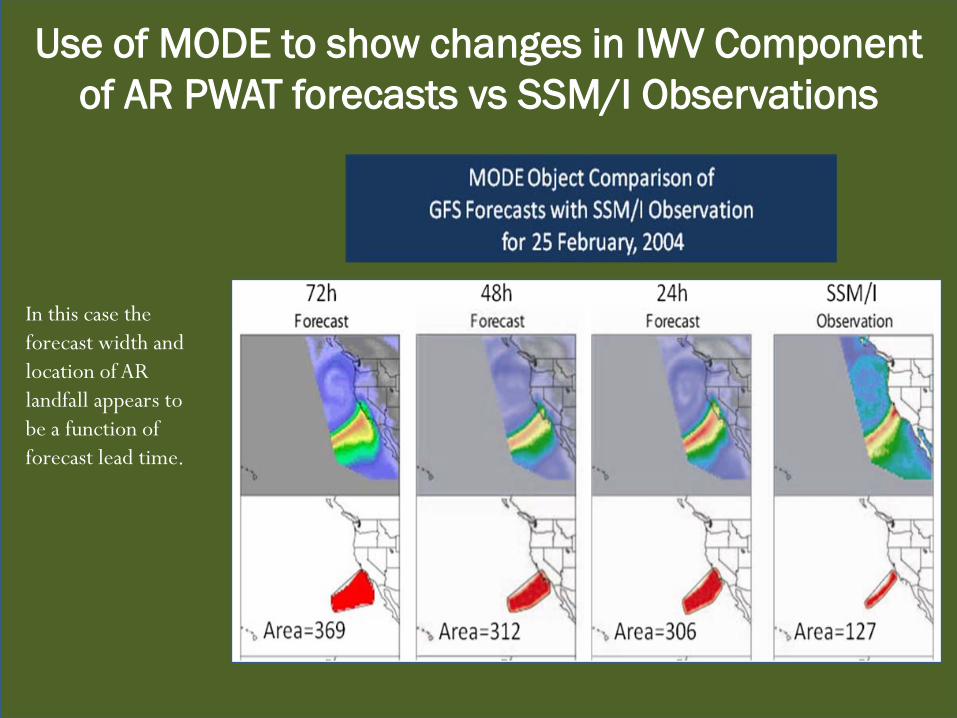
Use of MODE to show changes in IWV Component of AR PWAT forecasts vs SSM/I Observations
In this case the forecast width and location of AR landfall appears to be a function of forecast lead time.
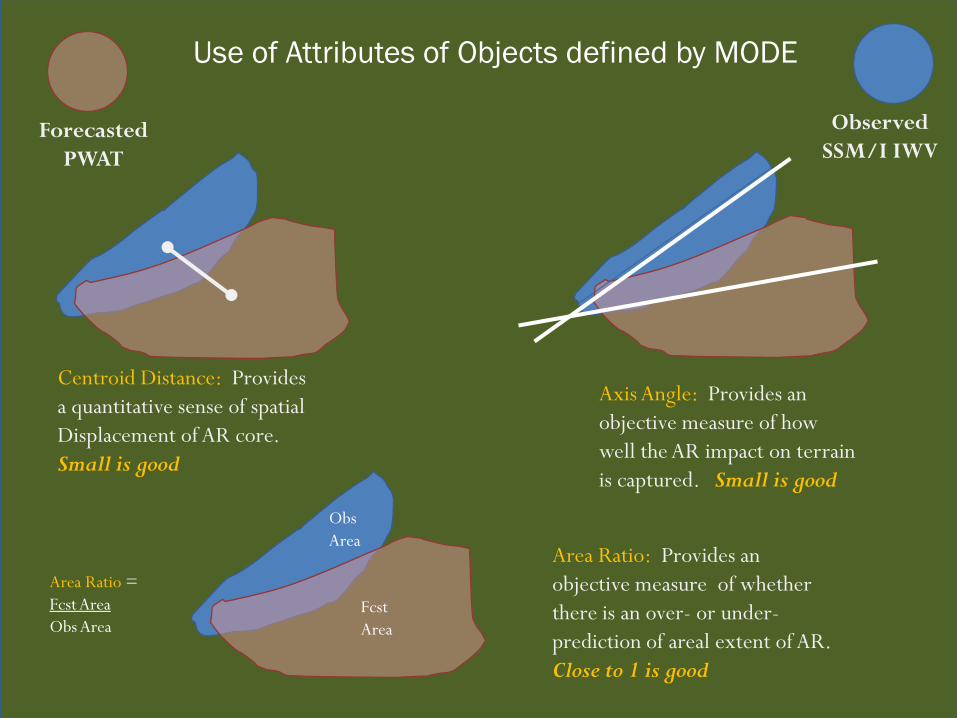
Use of Attributes of Objects defined by MODE
Centroid Distance: Providesa quantitative sense of spatialDisplacement of AR core.Small is good
ForecastedPWAT
ObservedSSM/I IWV
Axis Angle: Provides anobjective measure of howwell the AR impact on terrainis captured. Small is good
Area Ratio: Provides anobjective measure of whetherthere is an over- or under-prediction of areal extent of AR.Close to 1 is good
ObsArea
FcstArea
Area Ratio =Fcst AreaObs Area
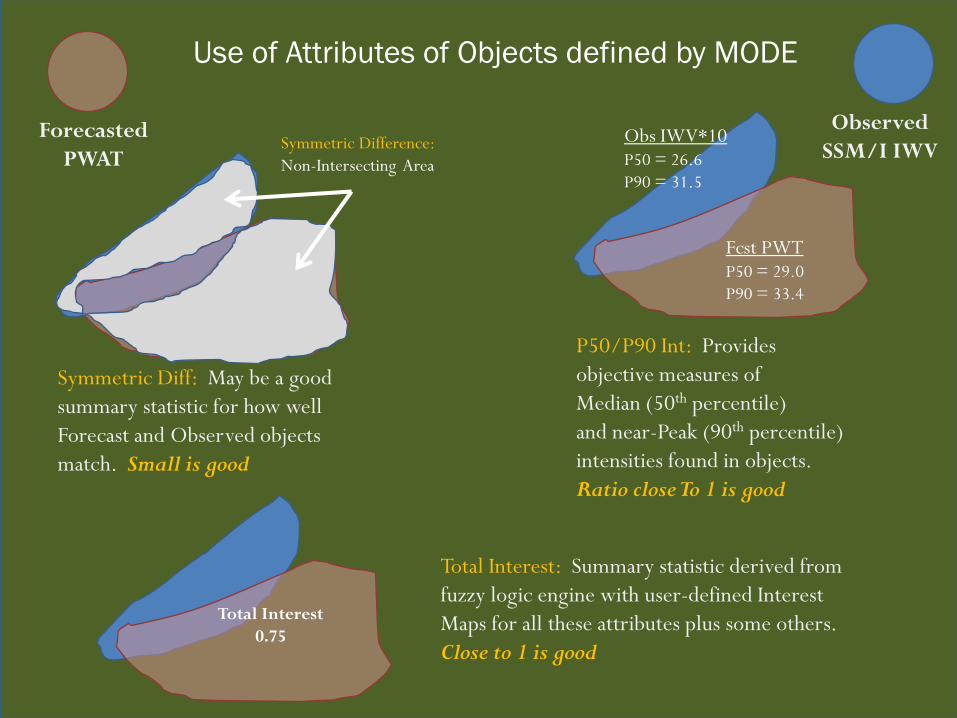
Symmetric Diff: May be a goodsummary statistic for how wellForecast and Observed objectsmatch. Small is good
ForecastedPWAT
ObservedSSM/I IWV
P50/P90 Int: Providesobjective measures ofMedian (50th percentile) and near-Peak (90th percentile)intensities found in objects.Ratio close To 1 is good
Total Interest: Summary statistic derived from fuzzy logic engine with user-defined InterestMaps for all these attributes plus some others.Close to 1 is good
Symmetric Difference:Non-Intersecting Area
Fcst PWTP50 = 29.0P90 = 33.4
Obs IWV*10P50 = 26.6P90 = 31.5
Total Interest0.75
Use of Attributes of Objects defined by MODE
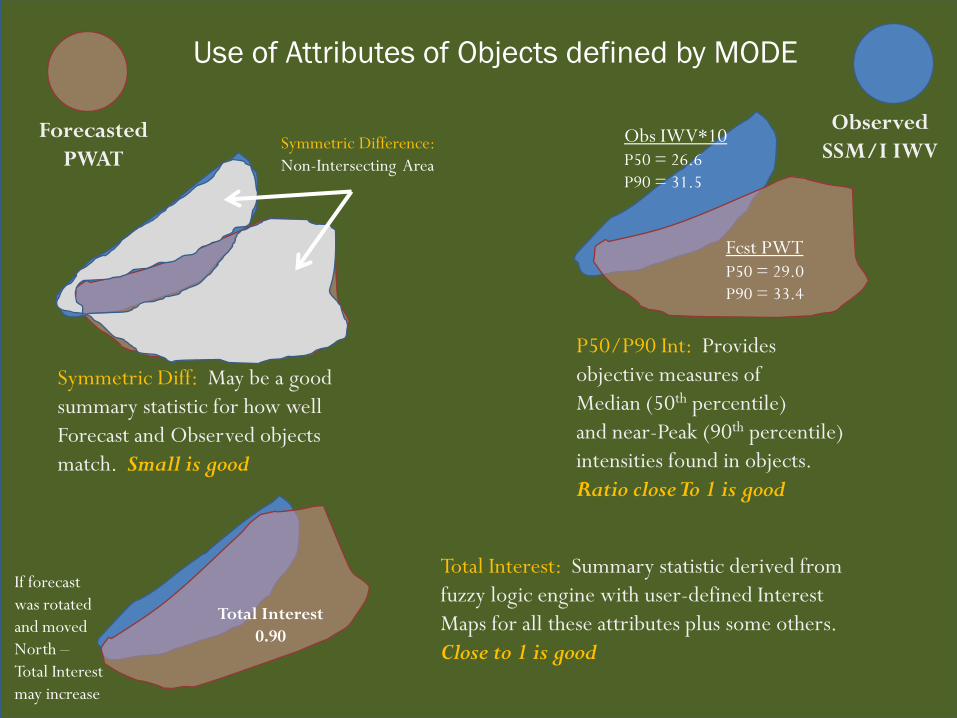
ForecastedPWAT
ObservedSSM/I IWVSymmetric Difference:
Non-Intersecting Area
Fcst PWTP50 = 29.0P90 = 33.4
Obs IWV*10P50 = 26.6P90 = 31.5
Total Interest0.90
If forecastwas rotatedand movedNorth –Total Interestmay increase
Total Interest: Summary statistic derived from fuzzy logic engine with user-defined InterestMaps for all these attributes plus some others.Close to 1 is good
Symmetric Diff: May be a goodsummary statistic for how wellForecast and Observed objectsmatch. Small is good
P50/P90 Int: Providesobjective measures ofMedian (50th percentile) and near-Peak (90th percentile)intensities found in objects.Ratio close To 1 is good
Use of Attributes of Objects defined by MODE

Question? Next – run through the website
After – Ed will discuss the 20 January case study to demonstrate how this site might be used (DTC-HMT_eval_20jan2010_case.pdf)


