Development of the Project Definition Rating Index (PDRI)
For Infrastructure Projects
by
Evan Bingham
A Thesis Presented in Partial Fulfillment
of the Requirements for the Degree Master of Science
Approved November 2010 by the Graduate Supervisory Committee:
G. Edward Gibson, Jr., Chair
William Badger Samuel Ariaratnam
ARIZONA STATE UNIVERSITY
December 2010

ii
ABSTRACT
Front End Planning (FEP) is a critical process for uncovering project unknowns,
while developing adequate scope definition following a structured approach for
the project execution process. FEP for infrastructure projects assists in identifying
and mitigating issues such as right-of-way concerns, utility adjustments,
environmental hazards, logistic problems, and permitting requirements. This
thesis describes a novel and effective risk management tool that has been
developed by the Construction Industry Institute (CII) called the Project
Definition Rating Index (PDRI) for infrastructure projects. Input from industry
professionals from over 30 companies was used in the tool development which is
specifically focused on FEP. Data from actual projects are given showing the
efficacy of the tool. Critical success factors for FEP of infrastructure projects are
shared. The research shows that a finite and specific list of issues related to scope
definition of infrastructure projects can be developed. The thesis also concludes
that the PDRI score indicates the current level of scope definition and corresponds
to project performance. Infrastructure projects with low PDRI scores outperform
projects with high PDRI scores.
iii
TABLE OF CONTENTS
Page
LIST OF TABLES ..................................................................................................... vii
LIST OF FIGURES .................................................................................................. viii
CHAPTER
1 INTRODUCTION .............................................................................................1
1.1 Research Team 268 .................................................................................1
1.1.1. Research Team Objectives ........................................................ 2
1.2. Project Domain ......................................................................................3
1.3. Research Objectives ..............................................................................4
1.4. Research Hypotheses ..............................................................................5
2 BACKGROUND .............................................................................................. 7
2.1 Summary Literature Review 16 ..............................................................7
2.1.1. Contrustion Industry Institute (CII) ............................................7
2.1.2. Front End Planning ....................................................................9
2.1.3. Project Scope Definition Tools ...............................................14
2.1.4. Project Definition Rating Index .............................................. 16
2.1.4.1. PDRI for Industrial Projects ..................................................18
2.1.4.2. PDRI for Building Projects ..................................................22
2.1.5. Infrastructure Project Literature .............................................. 25
2.1.5.1. People and Freight ...................................................26
CHAPTER Page
iv
2.1.5.2. Energy ......................................................................27
2.1.5.3. Fluids........................................................................29
2.1.5.4. Risk Factors of Infrastructure Projects ....................31
2.2. Literature Review Findings ................................................................. 32
3 PROBLEM STATEMENT AND RESEARCH HYPOTHESES ................... 34
3.1. Problem Statement ..............................................................................34
3.2. Research Hyptheses ..............................................................................35
3.3. Summary ..............................................................................................36
4 RESEARCH METHODOLOGY.....................................................................37
4.1. Development Methodology .................................................................37
4.1.1. Creating the PDRI Elements ....................................................39
4.1.1.1. Research Method .................................................... 39
4.1.1.2. Scorecard Development ...........................................39
4.1.1.3. Element Descriptions ...............................................40
4.1.2. PDRI Weighting Workshops ....................................................40
4.1.3. Validation Questionnaire ..........................................................41
4.1.3.1. PDRI Tool Analysis .................................................41
4.1.4. Weighting Workshop Data .......................................................42
4.1.4.1. Observations ............................................................43
4.1.4.2. Data Processing ........................................................43
4.1.5. Analytical Reviews ...................................................................44
CHAPTER Page
v
4.1.5.1 The Boxplot ..............................................................44
4.1.5.2. Skewness ..................................................................46
4.1.5.3 Regression Analysis ..................................................48
4.1.5.4 Independent Samples t-Test ......................................50
4.2 Research Application ............................................................................52
4.3. Limitations of Analyses........................................................................53
4.4. Summary ..............................................................................................53
5 PDRI DEVELOPEMENT PROCESS ............................................................ 54
5.1. Background of the PDRI for Infrastrure Projects ................................ 54
5.2. PDRI Weighting Workshops ............................................................... 56
5.2.1. Workshop Process ....................................................................58
5.3. Developing the PDRI Element Weights ..............................................64
5.3.1. Normalizing Process ................................................................64
5.3.2. Preliminary PDRI Element Weights ....................................... 65
5.3.3. Screening the Data using Boxplots .........................................66
5.3.4. Element Mean Weights for Definition Level 5 and 1 ............. 69
5.3.5. Interpolating the Weights for Definitions Levels 2,3, and 4 ... 70
5.4. Finalizing the PDRI Project Score Sheet ............................................72
5.5. Analyzing the Weighted PDRI ............................................................72
5.6. Element Weights for Project Types .....................................................74
5.6.1. Comparison of Owners and Contractors .................................75
CHAPTER Page
vi
5.6.2. Comparison of People and Freight, Energy, Fluids Projects ..76
5.6.3. Comparison of Right of Way Projects ....................................79
5.7. Summary .............................................................................................80
6 PDRI TESTING .............................................................................................. 81
6.1. Testing Project Domain ....................................................................... 81
6.2. Validation Questionnaire .....................................................................82
6.3. Sample Project Selection .....................................................................84
6.3.1. Sample Characteristics ............................................................84
6.4. Questionnaire Responses and Analyses ..............................................85
6.5. Selecting a PDRI Score Cutoff ............................................................ 85
6.6. Project Performance Analyses .............................................................86
6.6.1. Schedule Performance .............................................................86
6.6.2. Cost Performance ....................................................................89
6.6.3. Change Information .................................................................91
6.6.4. Project Performance Using Regression ...................................93
6.6.4.1. Regression and Schedule Performance ..........................93
6.6.4.2 Regression and Cost Performance .................................... 95
6.6.4.3. Regression and Change Performance ..............................96
6.7. Summary of Performance Evaluation ................................................. 97
6.8. In Process Projects..............................................................................100
6.9. Summary ...........................................................................................100

CHAPTER Page
vii
7 CONCLUSIONS AND RECOMENDATIONS ........................................... 102
7.1. Research Objectives ..........................................................................102
7.1.1. Research Hypotheseis ............................................................ 105
7.2. Key Findings .....................................................................................105
7.2.1. Workshop Findings ............................................................... 106
7.2.2. Testing Findings .................................................................... 106
7.3. Limitations and Cautions................................................................... 107
7.4. Summary of Thesis .............................................................................108
7.5. Recommendations for Future Research .............................................109
REFERENCES ...................................................................................................... 110
APPENDIX
A PARTICIPATING ORGANIZATIONS ....................................................115
B PDRI FOR INFRASTRUCTURE PROJECTS DOCUMENTS ................119
C DESCRIPTIVE STATISTICS ....................................................................184
D WEIGHTING WORKSHOP EVALUATION FORM ...............................211
E EXAMPLE OF COMPLETED WEIGHTING WORKSHOP ....................221
F PDRI VALIDATION QUESTIONNAIRE .................................................228
viii
LIST OF TABLES
Table Page
4.1 Independent Samples t-Test Ouput Using SPSS .................... 52
5.1 Weighting Workshops ............................................................ 57
5.2 Contribution Scores by Participant ......................................... 69
5.3 Results of Interpolation of Level 1 – Level 5 Weights ........... 71
5.4 Top Ten Element Weights: People and Freight Projects ........ 77
5.5 Top Ten Element Weights: Energy Projects ............................ 78
5.6 Top Ten Element Weights: Fluid Projects ............................... 79
5.7 Top Ten Element Weights: Right of Way Projects .................. 80
6.1 Example Scoring ...................................................................... 84
6.2 Independent Samples t-Test for Schedule Performance ......... 89
6.3 Independent Samples t-Test for Cost Performance ................ 91
6.4 Independent Samples t-Test for Change Order Performance .. 93
6.5 Trendline R2 and r by Performance ........................................ 98
ix
LIST OF FIGURES
Figure Page
2.0 Project Life Cycle Diagram ...................................................... 9
2.1 PDRI for Industrial Projects Element Description ................... 19
2.2 PDRI Ten Highest Weighted Elements - Industrial Projects . 20
2.3 PDRI Section and Category Weights - Industrial Project ........ 21
2.4 Cost, Schedule, & Change Order Performance PDRI
200 Point Cutoff for Industrial Projects PDRI ............................... 22
2.5 PDRI Ten Highest Weighted Elements - Building Projects ... 23
2.6 PDRI Section and Category Weights - Building Projects ....... 24
2.7 Cost, Schedule, & Change Order Performance PDRI
200 Point Cutoff for Building Projects PDRI ................................ 25
4.1 PDRI Development Methodology Flowchart ......................... 38
4.3 Graphical Representation of a Boxplot .................................... 45
4.4 Histogram – Positively Skewed Data ..................................... 47
4.5 Negative & Positive Skewness ............................................... 47
4.6 Regression Analysis – Scatterplot and Trendline ................... 49
4.7 Same Difference in Means with Different Variability ............. 51
5.1 PDRI Sections, Categories, and Elements .............................. 56
5.2 Weighted Workshop Summary ................................................ 58
5.6 Project Control Element Descriptions .................................... 59
5.7 Sample of Workshop Weighting Category E .......................... 61
5.9 Section Titles & Weights ........................................................ 72
Figure Page
x
5.10 Category Titles & Weights ................................................... 73
5.11 Top Twelve Element Weights .............................................. 74
6.2 Average Schedule Performance by PDRI Grouping .............. 88
6.3 Average Cost Performance by PDRI Grouping ...................... 90
6.4 Average Change Performance by PDRI Grouping .................. 92
6.5 Schedule Performance Regression Line ................................. 95
6.6 Cost Performance Regression Line ......................................... 96
6.7 Change Performance Resgression Line .................................. 97
6.8 Cost, Schedule, & Change Order Performance –
PDRI 200 Point Cutoff .................................................................. 99
6.9 Cost, Schedule, & Change Order Performance –
PDRI 250, 200, & 250 Point Cutoff ............................................. 99
1
CHAPTER 1: INTRODUCTION
For over two decades the Construction Industry Institute (CII) has been
pursuing research focused on front end planning also know as pre project
planning. The CII defines front end planning or FEP as the essential process of
developing sufficient strategic information with which owners can address risk
and make decisions to commit resources in order to maximize the potential for a
successful project (Gibson 1996). In its efforts, CII has developed tools that assist
project teams in the successful planning of projects. One such tool is the Project
Definition Rating Index (PDRI). The first PDRI tool developed by CII was the
PDRI for Industrial Projects. The subsequent success of that tool and high
demand led to the development of the PDRI for Building Projects. Like its
predecessor, the PDRI for Building Projects has become highly valued within the
CII membership and industry leaders. While addressing front end planning (FEP)
of industrial and building projects, previous CII research efforts have not focused
on infrastructure work, and little research in general has been performed in the
area of FEP for infrastructure projects. The research project outlined in this report
is a continuation of the research/development thread conducted by CII, extending
to the important industry sector of infrastructure projects.
1.1. Research Team 268
The task of completing a Project Definition Rating Index Tool for
Infrastructure Projects was given to CII Research Team 268 in 2008. This team
consisted of select members of the CII from both owner and contractor
organizations throughout the world. The team also consisted of members

2
representing academic institutions. The author of this thesis is one of the
academic contributors. A list of the participating research members and their
organizations can be found in Appendix A.
Research Team 268 consisted of professionals from all types infrastructure
projects; their expertise, as well as the contributions of over 60 industry
professionals helped in contributing the background and basis for the PDRI for
Infrastructure. Together they make up more than 1,300 years of experience
working on infrastructure projects. The following sections describe the main
objectives of the research team.
1.1.1. Research Team Objectives
The CII desired a user friendly FEP tool to assist project teams in defining
project scope and increasing the probability of successful infrastructure projects.
The first task of the research team was to identify what the infrastructure industry
was lacking. RT 268 determined that a quantitative understanding of scope
definition issues during FEP of infrastructure projects had not been systematically
studied. Their research goals were to develop a tool that would significantly
enhance the project team environment in the infrastructure industry by doing the
following:
• Improve predictability of project parameters
• Reduce the cost of design and construction
• Preserve schedule
• Reduce risk during project execution
• Improve project team alignment and communication
3
• Assure customer satisfaction
• Improve the probability of a successful project
The fundamental objective of the research team was centered on
developing a PDRI tool for infrastructure projects.
1.2. Project Domain
As the research team its effort, the team came to the conclusion that the
word infrastructure had many different meanings and was used within the
industry and outside of the industry to define many different things. In order to
clarify the domain of this tool they created a definition of infrastructure for use in
relation to the PDRI for Infrastructure Projects. Over several successive meetings
and using the available literature and suggestions of industry professionals the
team came to consensus upon the following definition of an infrastructure project:
“An infrastructure project is defined as a capital project that provides transportation, transmission, distribution, collection or other capabilities supporting commerce or interaction of goods, service, or people. Infrastructure projects generally impact multiple jurisdictions, stakeholder groups and/or a wide area. They are characterized as projects with a primary purpose that is integral to the effective operation of a system. These collective capabilities provide a service and are made up of nodes and vectors into a grid or system (e.g., pipelines (vectors) connected with a water treatment plant (node))” (Gibson et al. 2010).
This definition demonstrates the linear nature of infrastructure projects. In
further development of the tool the projects were divided in to three categories;
projects involving the transportation of people and freight, energy, and fluids.
People and Freight projects are considered to be projects involving the
transportation of people and/or freight and include projects such as highways,
4
railroads, access ramps, toll booths, tunnels, and airport runways. This type of
infrastructure project can also be extended to linear projects meant to control
people or freight, for example security fencing. An energy project is any project
involved in the distribution, transmission, or collection, of energy or
communications. Examples of these types of projects could include electricity
transmission/distribution, fiber optic networks, electrical substations/switch gears,
towers, wide area network (WAN), and many more. Fluids projects are linear in
nature and transport substances like gas, water, steam, oil, sewage, and many
more. Some projects that fall under this category could include pipelines,
aqueducts, pumping and compressor stations, locks, reservoirs, meters and
regulator stations, pig launchers and receivers, canals, water control structures,
and levees.
Because each of these types of projects have their own unique
characteristics and priorities, this thesis addresses the specific needs of each type
of project, and shows some of those distinguishing findings. That being said, the
tool was intended for general-use and the research team cautions against the use
of the tool as all inclusive.
1.3.Research Objectives
The objective of this thesis is to provide support for the tool development
methodology, tool testing/validation, and conclusions in relation to the work done
by the CII research team tasked with the development of the PDRI for
Infrastructure Projects. The methodologies, testing process, and conclusions by

5
the author are corroborated in this report by statistical analysis and supporting
literature.
1.4.Organization of the Thesis
The organization of this thesis is based very similarly to the previous
PDRI reports, as was the research itself. This thesis is organized into 7 chapters. It
includes several appendices that provide information on collected data, results
from analysis and other important reference materials. The report includes the
following.
Chapter one is an introduction to the research project scope, the research
team, and research objectives. Chapter two introduces previous research,
vocabulary, and general relevant information that assists in the comprehension of
the PDRI tool and its development. A background of the PDRI tools, and an
explanation of important concepts such as; front end planning, scope definition,
Project Definition Rating Index, is provided. Chapter three identifies the problem
statement and defines the research hypotheses. Chapter four outlines the
methodology used in developing the PDRI for Infrastructure. It also gives the
framework upon which the tool was developed through weighting workshops,
data collection and multiple statistical tests. Chapter five sets forth the
development process used in the tool’s creation. In this chapter the process of
formation for the tool and all its parts is presented. Chapter six is a report of the
research testing process and the outcome of findings from data collected from
actual projects. This chapter also shows the results of testing the research

6
hypotheses. Chapter seven offers recommendations for using the PDRI and
presents conclusions of the research.
7
Chapter 2 BACKGROUND To chronicle previous research and provide a foundation for further
research a literature review was performed. The study of past works offers a
background in the development of comparable tools as well as support for the
need for a front end planning tool specifically focused on infrastructure projects.
In addition, the literature review in this chapter helps introduce relevant
organizations, terms, and related studies essential in understanding the PDRI for
Infrastructure Projects and front end planning.
2.1. Summary Literature Review
This section provides findings of literature related to the PDRI tool, front
end planning, project definition rating index, planning related to infrastructure,
transportation, fluid transportation, energy transmission, as well as other topics of
relevant interest.
2.1.1. Construction Industry Institute (CII)
CII is an organization of owner, engineering-contractor, and supplier firms
from the public and private sector. The main purpose of this group is to
measurably improve the delivery of capital projects. (CII 2010). As a part of their
mission, they fund a considerable amount of research and have shown great
success in their research efforts by combining credible, quantitative research, with
significant industry input. CII works with academic professionals from
universities in this effort and combine with that the knowledge of highly skilled
professionals from the construction industry. These individuals make up research
teams tasked with certain topics of high demand within the CII membership and

8
industry as a whole. The CII has defined the mission of the organization as
follows:
“Through research-based, member-driven knowledge creation, dissemination and implementation, development of best practices and assessment of the impact of resulting improvements, CII creates global, competitive, and market advantages for its members. Through CII, member organizations and their employees cooperatively engage with academics in the creation of knowledge, including CII Best Practices. This collaborative effort adds value to member organizations and academia, and supports the professional development of employees, improving the entire industry. CII provides a forum for academics to discuss and investigate, in partnership with industry leaders, the most significant opportunities for industry improvement.” (CII 2010)
The research project for the development of the PDRI for Infrastructure
Projects is a CII sponsored research project. Many of the terms, definitions, and
findings, discussed in this chapter, come directly from the work done by CII and
its research teams. Some important terms and there definitions include: front end
planning – the process of developing sufficient strategic information with which
owners can address risk and make decisions to commit resources in order to
maximize the potential for a successful project (Gibson 1996). Project scope
definition – A process by which projects are defined and prepared for execution, it
is a key component of front end planning (Gibson et al. 1993). Project Definition
Rating Index – a tool used to assess the level of scope definition of a project and
identify risk factors that may impact the project (Gibson and Dumont 1996). This
chapter discusses these and other relevant terms in detail and provides a
description of their development.
2.1.2. Front End Planning
The CII defines
developing sufficient strategic information with which owners can address risk
and make decisions to commit resources in order to maxim
successful project (Gibson 1996).
This figure demonstrates the
construction; those of feasibili
considered to be part of the
Figure 2.0
In a study conducted by the CII in 1994 on
team began exploratory research to define the
benefits in the capital facility life cycle
end planning process was
This increased level of detail allows for greater streamlining, and control over t
project progress. After detailing the breakout of the model, the team offered
supporting research to validate the need for
The team recognized that, the first step in determining the relationship
between front end planning
9
Front End Planning
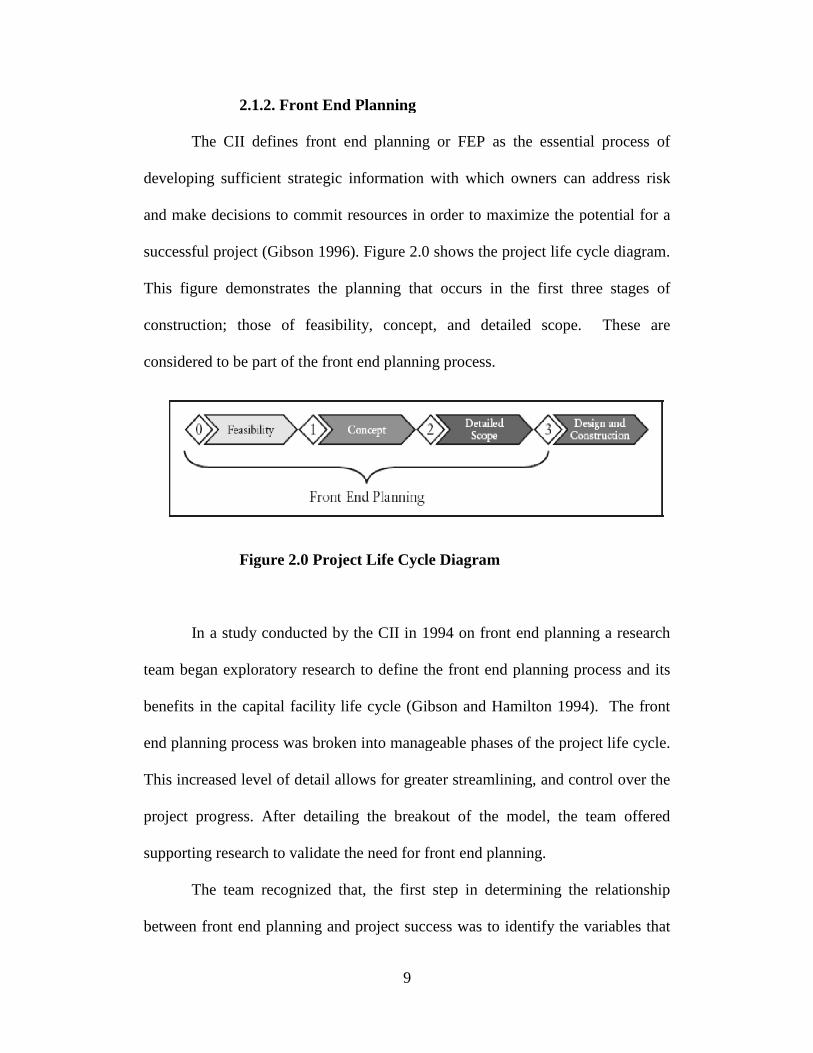
The CII defines front end planning or FEP as the essential process of
developing sufficient strategic information with which owners can address risk
and make decisions to commit resources in order to maximize the potential for a
Gibson 1996). Figure 2.0 shows the project life cycle diagram.
This figure demonstrates the planning that occurs in the first three stages of
construction; those of feasibility, concept, and detailed scope. These
part of the front end planning process.
Figure 2.0 Project Life Cycle Diagram
In a study conducted by the CII in 1994 on front end planning a research
exploratory research to define the front end planning process
benefits in the capital facility life cycle (Gibson and Hamilton 1994). The
process was broken into manageable phases of the project life cycle.
This increased level of detail allows for greater streamlining, and control over t
project progress. After detailing the breakout of the model, the team offered
supporting research to validate the need for front end planning.
The team recognized that, the first step in determining the relationship
front end planning and project success was to identify the variables that
or FEP as the essential process of
developing sufficient strategic information with which owners can address risk
ize the potential for a
shows the project life cycle diagram.
occurs in the first three stages of
These are
a research
process and its
. The front
broken into manageable phases of the project life cycle.
This increased level of detail allows for greater streamlining, and control over the
project progress. After detailing the breakout of the model, the team offered
The team recognized that, the first step in determining the relationship
ect success was to identify the variables that
10
define success and front end planning effort. After establishing this vital baseline,
the CII research team identified several fundamental principles that are important
to front end planning. Once these principles are mastered, the following benefits
are often realized; improved cost predictability, improved schedule predictability,
better attainment of operational and production goals in the first six months of
operation, better achievement of business goals, better definition of risks, fewer
scope changes, greatly reduced probability of project failures and disasters. It is
the recommendation of the authors that, front end planning should be adopted and
implemented as a Corporate Best Practice. This move may be difficult because
habits are deeply entrenched. This will make consistent implementation difficult,
at least in the beginning.” (CII 1994)
Building on the foundation of front end planning work begun earlier by
CII, Research Team 39 was tasked with identifying specific advantages to front
end planning. In 1994 their findings were published as “Pre Project Planning
Tools: Building a Project the Right Way” (Gibson et al. 1995). Their work has
provided much of the base for subsequent tools dealing with front end planning.
Some key findings of the research team indicate that well-performed front end
planning can:
• Reduce total project design and construction costs by as much as 20
percent (versus authorization estimate). • Reduce total project design and construction schedule by as much as 39
percent (versus authorization estimate).
• Improve project predictability in terms of cost, schedule, and operating performance.

11
• Increase the chance of the project meeting environmental and social goals. This research work outlined six front end planning factors that
significantly affect project success, among these are the need to increase total
project design work-hours completed to between 10 and 25 percent prior to
project authorization; development of a written charter; development of project
control guidelines; preparation of execution approach; assurance that adequate
numbers of organizations participate in front end planning; as well as having a
front end planning plan in place. The research team also made the following
conclusions:
• Pre-project planning is an owner-driven process that must be tied closely
to business goals.
• Pre-project planning is a complex process that must be adapted to the business needs of the company, tailored to specific projects, and applied consistently to all projects in order to gain full benefits.
• Corporate goals and guidelines for both pre-project planning and the project must be well defined and aligned among project participants. Alignment requires involvement of operations, business, and project management early in the pre-project planning process.
• A direct relationship exists between the level of pre-project planning effort
and project success.
Additional works by CII research teams include development of an alignment
tool for projects using the PDRI. This tool was completed in 1997 and was
followed by the PDRI for Buildings; these tools with be outlined later.
12
Another contributor to the research on front end planning was CII Research
Team 213. Through an analysis of case studies, they developed a set of rules for
using the front end planning tools. These rules are:
• Develop and consistently follow a defined front end planning process
• Ensure adequate scope definition prior to moving forward with design construction.
• Uses front end planning tools.
• Define existing conditions thoroughly.
• Select the proper contracting strategy early.
• Align the project team, include key stake holders.
• Build the project team, including owner stage holders and consultants.
• Include involvement from both owners and contractors.
• Staff critical project scoping and design areas with capable and experienced personnel.
• Identify and understand risks of new project types, technologies or locations.
• Address labor force skill and availability during planning.
• Provide leadership at all levels for front end planning process, including executive and project, owner and contractor.
The team concluded that project teams that did not follow these rules
would pay a price in terms of disappointing results (Gibson et al. 2006).
CII research team 242 worked on front end planning for renovation and
revamp projects. These projects were described as projects that include the act,
process, or work of replacing, restoring, repairing, or improving a facility with
capital funds or non-capital funds (Gibson et al. 2006). The findings concluded
13
that R&R projects have unique risks in areas such as security, existing conditions,
coordination, compatibility, environmental issues, contract and procurement
strategies, historical/archeological concerns, and dismantling/demolition
requirements. The team concluded that better focus on front end planning of
R&R projects can greatly benefit owners, designers, and contractors In addition to
this work the team contributed updated versions of previous tools for successful
front end planning.
Another study interest used as a reference in understanding the concept of
scope definition is a study entitled “Starting Smart: Key Practices for Developing
Scopes of Work for Facility Projects”. In the course of this study, the authors
concluded that the key practice for developing an effective scope of work for
design is to conduct a structured, consistent, and thorough front end planning
process and fully develop a project scope of work. The authors found that,
effective front end planning is not a process that can be consistently incorporated
throughout an entire organization in a short time frame, rather, full
implementation of these activities requires cultural and process changes that may
take several years to achieve. It was the opinion of the authors that the outlined
process will improve project team formation and cohesiveness, alignment of
goals, and project scope definition. The authors believe that outcomes will be an
improved capacity to develop accurate project scopes of work, the ability to
predict cost and schedule performance with greater accuracy, and, consequently,
an improved capacity to develop effective contractual requirements for scopes of
14
work for design. Ultimately, taking such actions should result in lower costs and
shorter schedules for the execution of facility projects (Gibson and Pappas 2003).
Within the CII organization, certain products of research results have
become highly valued within the industry. The practices associated with this
highly valued research are given the title “Best Practice.” Front End Planning, is
one of these “Best Practices.”
2.1.3. Project Scope Definition Tools
There have been several studies that have focused on the importance of
developing definition within projects scopes. Project scope definition is the
process through which projects are defined and prepared for execution. It is a key
component of front end planning (Gibson et al. 1993). Through project scope
definition a set of specifically defined deliverables or objectives is determined.
The CII sponsored a series of studies focused on the development of tools
that could assist project teams in achieving a greater level of scope definition and
improving the front end planning process. In this process the Project Definition
Rating Index (PDRI) for Industrial projects was developed. This tool included a
list of 70 elements categorized by the research team through an extensive
literature review and an assessment of industry practices. The elements related to
important considerations that should be made during a font end planning process
and were weighted in order of importance using input from 54 experienced
project managers and estimators (CII 1996).
The development of the PDRI for Industrial Projects and the subsequent
success of that tool led to the development of the PDRI for Building projects.
15
Similarly to the PDRI for Industrial projects, the research team for the PDRI for
building projects decided the best way to quickly develop reasonable and credible
weights for the PDRI elements was to rely on the expertise of a broad range of
construction industry experts marshaled together in workshops. The research team
hosted seven “weighting” workshops. The central premise of the PDRI for
Building Projects is that “teams must be working on the right project in a
collaborative manner (alignment) and performing the right work (scope
definition) during pre-project planning (CII 1999). This tool consists of 64
elements in a weighted checklist format and provides a method for measuring the
completeness of project scope development. It allows its users to measure the
level of scope definition and to compare scope definition to anticipated project
success. This tool was designed to help owners and contractors better achieve
business, operational, and project objectives.
Both the PDRI for Industrial and the PDRI for Buildings used a scoring
system in which a low score would represent better scope definition. A more in-
depth discussion of the PDRI tools, their development, and this scoring system are
discussed in detail in the next section.
Another notable study that can help understand project scope definition
and its use in developing the PDRI for Infrastructure Projects was performed by
the Texas Department of Transportation (TxDOT). The TxDOT study introduced
a risk management tool focused on a project’s scopes and improving the clarity,
comprehensiveness and entirety of those scopes. The tool Advanced Planning
Risk Analysis (APRA), was an easy-to-use tool for measuring the degree of scope
16
development and identifying potential risks early in the project (Caldas et al.
2007).
The creators of the APRA identified that the implementation of this tool
allows a project planning team to optimize the identification of the project
requirements in all major disciplines (e.g., right-of-way, utilities, environmental,
design, and planning and programming) by quantifying, rating, and assessing the
level of scope development. One key suggestion for the use of the APRA is that
this is not a "one use" tool; rather, it should be used at points throughout the
project development process to ensure continued alignment, process checkups,
and a sustained focus on the key project priorities. The PDRI documentation also
recommended the use of the PDRI at multiple stages during planning (Caldas et
al. 2007). In like manner to the PDRI tool’s scoring system, a low APRA score
represents a well-defined project scope and a higher score signifies that certain
elements within the project scope lack adequate definition.
2.1.4. Project Definition Rating Index
The Project Definition Rating Index (PDRI) tool offers a method to
measure project scope definition for completeness. Critical elements within a
scope definition package are described in detail. This provides project team
members a checklist or tool for determining the definition of a project at the time
of analysis. The tool could then be used in predicting the future project success or
failures in terms of cost, schedule, and changes. It allows for project teams to
focus on problem areas or scopes lacking complete definition. The PDRI is used

17
as a front end planning tool in the stages of a project previous to design and
construction (Gibson et al. 1997). The PDRI is:
• A checklist that a project team can use for determining the necessary steps to follow in defining the project scope.
• A listing of standardized scope definition terminology for infrastructure projects.
• An industry standard for rating the completeness of the project scope definition package to facilitate risk assessment and prediction of escalation, potential for disputes.
• A means to monitor progress at various stages during the front end planning effort when used successively.
• A tool that aids in communication and promotes alignment between owners and design contractors by highlighting poorly defined areas in a scope definition package.
• A means for project team participants to reconcile differences using a common basis for project evaluation.
• A means whereby members of the project team can identify enabling tasks and act upon them before the project schedule becomes delayed.
• A training tool for organizations and individuals throughout the industry.
• A benchmarking tool for organizations to use in evaluating completion of scope definition versus the performance of past projects, both within their organization and externally, in order to predict the probability of success on future projects.
The PDRI tools use a score sheet to rate the level of definition on a list of
element scopes. The resulting score gives a level of scope definition for the
project. Project teams work together to assign a list of elements relevant to the
project with a level of definition. Elements that are considered completely or well
defined are given the definition level one. Elements that are poorly or
incompletely defined are given the definition level of five. Definition levels of
two, three and four are given for levels of definition in between. Each element has
a weight assigned to the five levels of definition, higher weights or scores are

18
given to the elements determined to be the most likely to introduce risk and
therefore result in unplanned results. A higher total score represents a poorly
defined project and a low score represents a project that is well defined. The
scoring process is used to identify areas of risk within a project and allows teams
to work on achieving higher levels of definition within the project. Because the
PDRI for Infrastructure Projects was developed using this method of element
weights, the author has written about this process in more detail in the chapters
dealing with methodology and development process. There have been two PDRI
tools developed before the PDRI for Infrastructure Projects. The first was the
Project Definition Rating Index for Industrial Projects.
2.1.4.1. PDRI for Industrial Projects
The PDRI for Industrial Projects is a widely used front ended planning
tool. It is used in the industrial industry to reduce the risks through identification
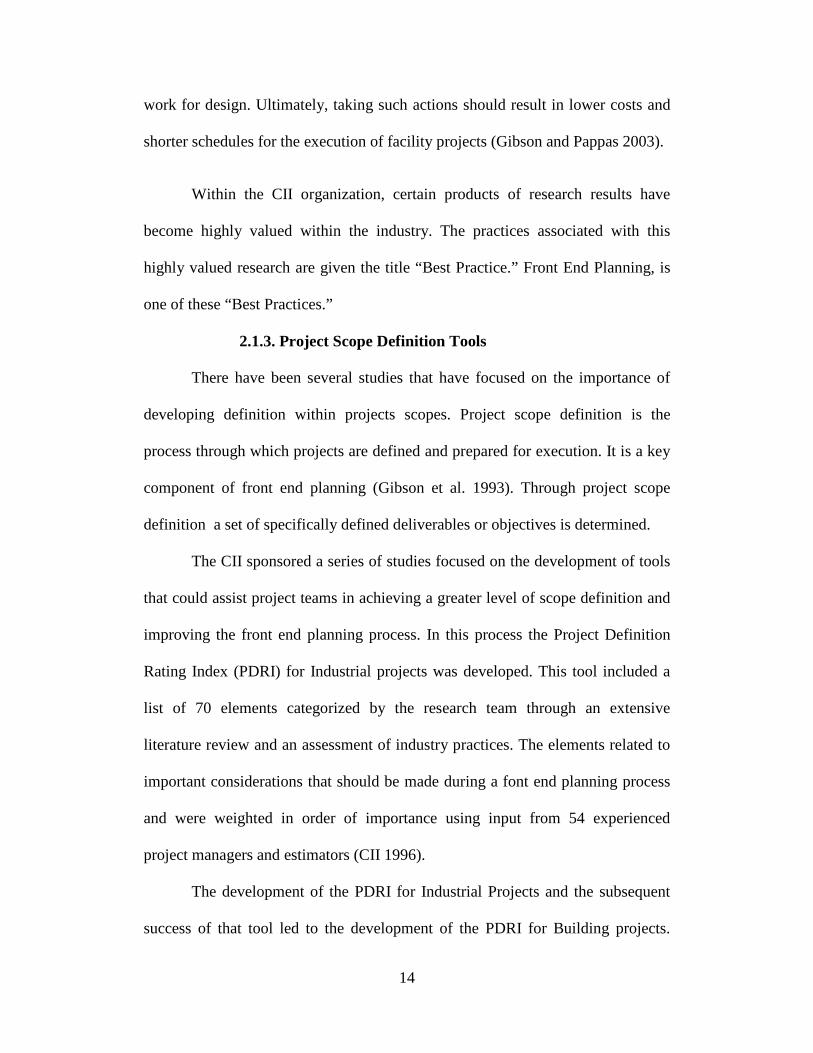
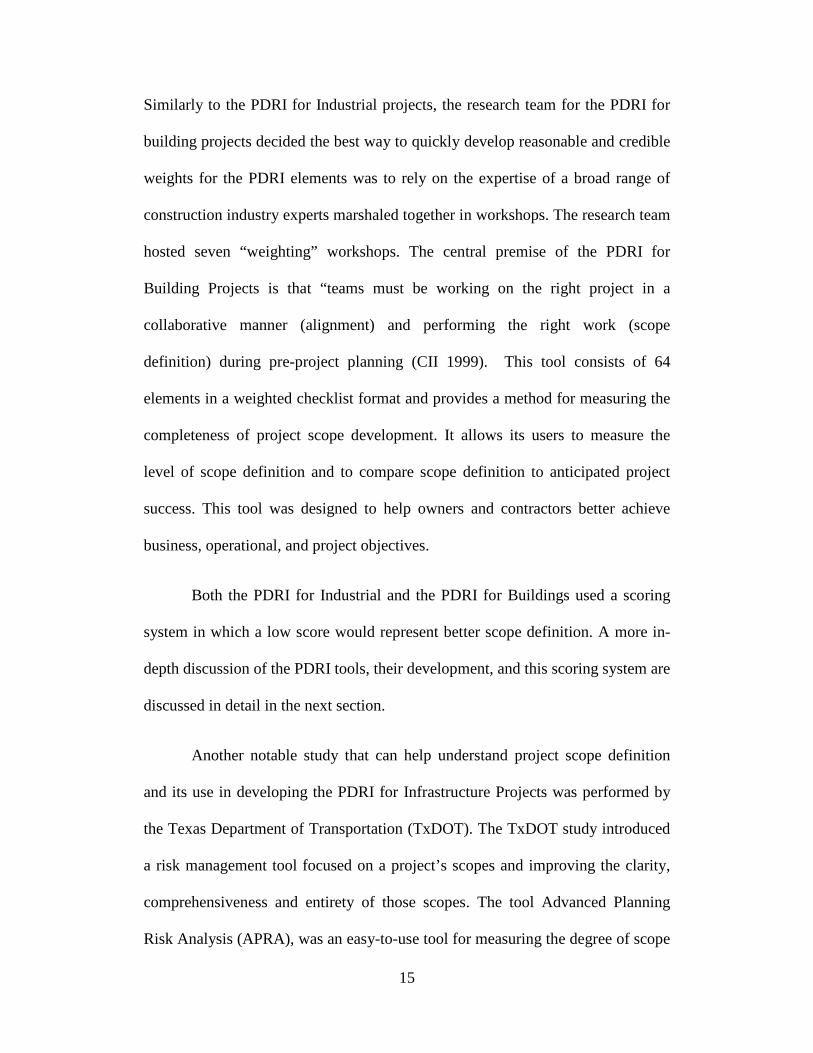
of key scopes. The tool is a list of 70 elements together with a detailed description
of each element. Figure 2.1 shows an example element and element description
that make up the tool.
19
A. MANUFACTURING OBJECTIVES CRITERIA
A1. Reliability Philosophy A list of the general design principles to be considered to achieve dependable operating performance from the unit. Evaluation criteria should include:
• Justification of spare equipment • Control, alarm, and safety systems redundancy • Extent of providing surge and intermediate storage capacity to permit
independent shutdown of portions of the plant • Mechanical / structural integrity of components (metallurgy, seals,
types of couplings, bearing selection, etc.)
Figure 2.1 PDRI for Industrial Projects Element Description
The 70 elements are divided among sections and categories and can be
used as a checklist to identify possible risk factors. The element titles are also
placed in a score sheet allowing team members to organize their effort and
determine the level of definition for each ranging from no definition to total
definition. The project team assigns the level of definition for each element based
on its level of definition. This in turn relates to the how critical that element is to
project success. The resulting total score is the project definition rating. The score
represents the level of definition for the project and is generally somewhere in
range from 70 (completely defined) to 1000 (no definition).
The tool was developed through a research process that is similar to the
research process that is outlined in this report. The study results showed that there
were certain elements that were determined as more or less important within the
industrial sector. These elements need the greatest focus when performing front
end planning. Figure 2.2 shows the top ten elements determined by the research
team as elements of greatest risk (i.e., those that are most critical to address).

20
Element Weights B1. Products 56 B5. Capacities 55 C1. Technology 54 C2. Processes 40 G1. Process Flow Sheets 36 F1. Site Location 32 G3. Piping & Instr. Diagrams (P&ID's) 31 D3. Site Characteristics Available vs. Required 29 B2. Market Strategy 26 D1. Project Objectives Statement 25
384/1000
Figure 2.2 PDRI Ten Highest Weighted Elements - Industrial Projects
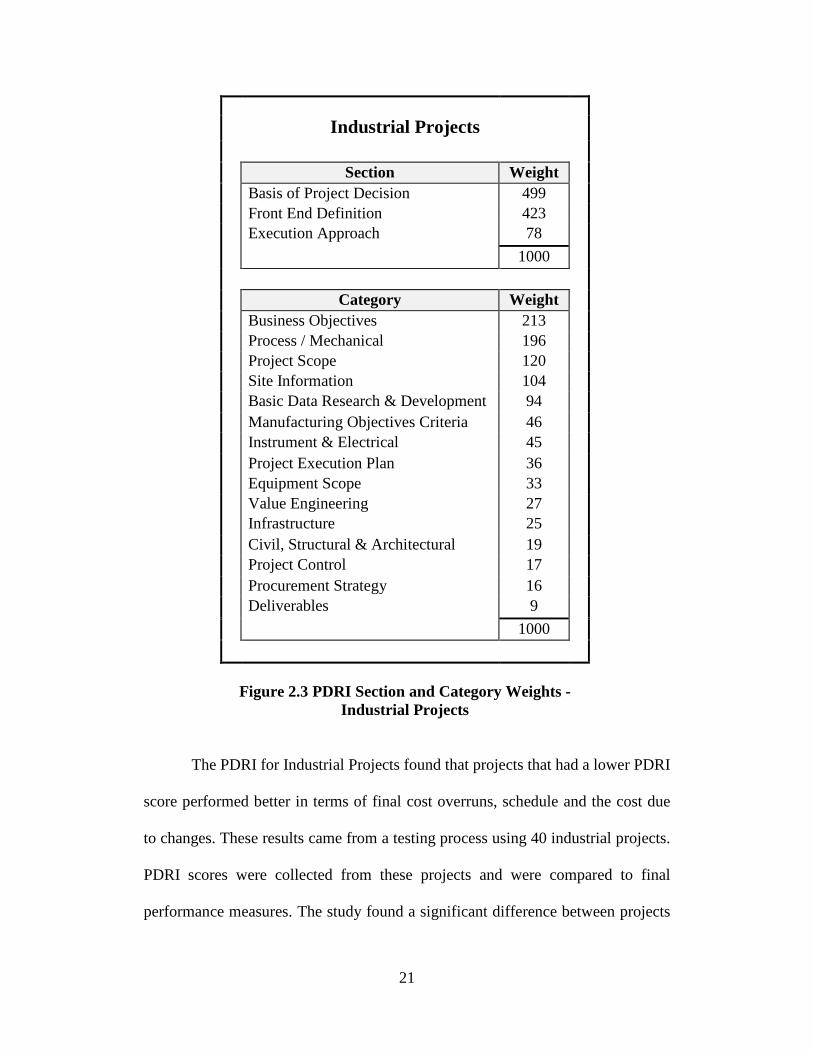
The PDRI for Industrial Projects determined that there was a ranking to
the element weights (i.e. some risks were more significant than others). In Figure
2.3 the section and category weights are displayed. If no work was completed in
front end planning these are the values that each section and category would
result.
21
Industrial Projects Section Weight Basis of Project Decision 499 Front End Definition 423 Execution Approach 78
1000 Category Weight Business Objectives 213 Process / Mechanical 196 Project Scope 120 Site Information 104 Basic Data Research & Development 94 Manufacturing Objectives Criteria 46 Instrument & Electrical 45 Project Execution Plan 36 Equipment Scope 33 Value Engineering 27 Infrastructure 25 Civil, Structural & Architectural 19 Project Control 17 Procurement Strategy 16 Deliverables 9
1000
Figure 2.3 PDRI Section and Category Weights -
Industrial Projects
The PDRI for Industrial Projects found that projects that had a lower PDRI
score performed better in terms of final cost overruns, schedule and the cost due
to changes. These results came from a testing process using 40 industrial projects.
PDRI scores were collected from these projects and were compared to final
performance measures. The study found a significant difference between projects
22
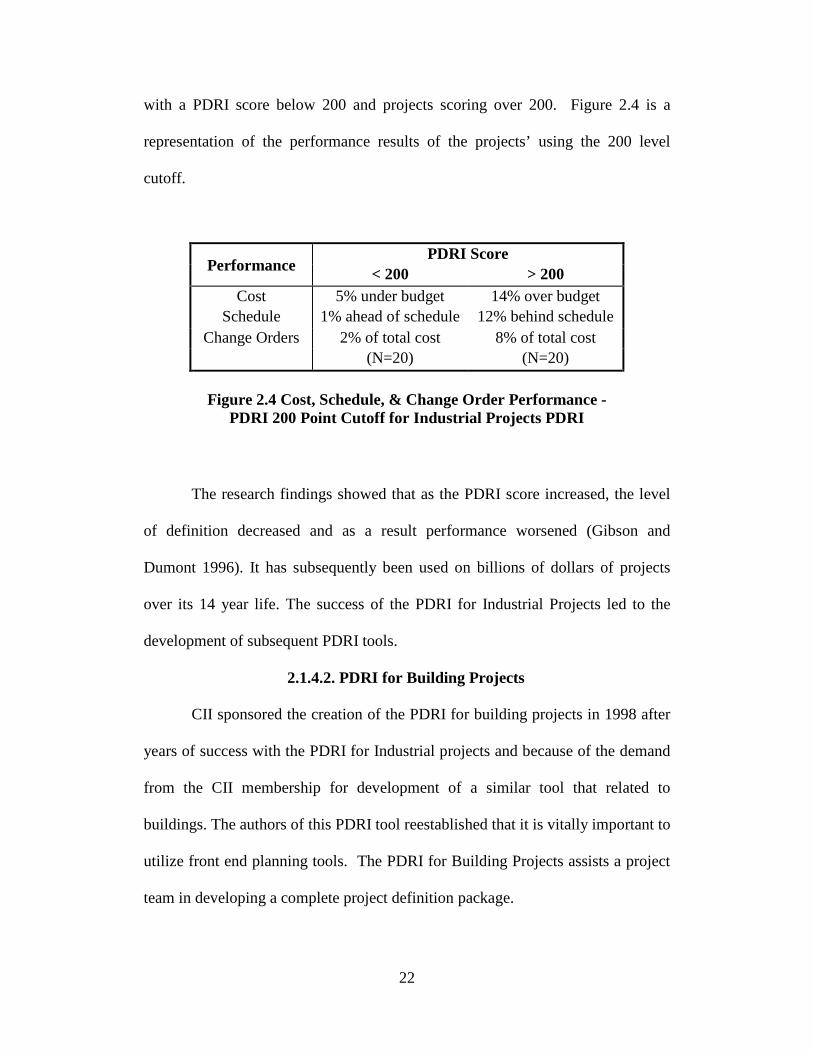
with a PDRI score below 200 and projects scoring over 200. Figure 2.4 is a
representation of the performance results of the projects’ using the 200 level
cutoff.
Performance PDRI Score
< 200 > 200 Cost 5% under budget 14% over budget
Schedule 1% ahead of schedule 12% behind schedule Change Orders 2% of total cost 8% of total cost
(N=20) (N=20)
Figure 2.4 Cost, Schedule, & Change Order Performance -
PDRI 200 Point Cutoff for Industrial Projects PDRI
The research findings showed that as the PDRI score increased, the level
of definition decreased and as a result performance worsened (Gibson and
Dumont 1996). It has subsequently been used on billions of dollars of projects
over its 14 year life. The success of the PDRI for Industrial Projects led to the
development of subsequent PDRI tools.
2.1.4.2. PDRI for Building Projects
CII sponsored the creation of the PDRI for building projects in 1998 after
years of success with the PDRI for Industrial projects and because of the demand
from the CII membership for development of a similar tool that related to
buildings. The authors of this PDRI tool reestablished that it is vitally important to
utilize front end planning tools. The PDRI for Building Projects assists a project
team in developing a complete project definition package.

23
The development process, as well as significant findings of the PDRI for
Building Projects effort was closely aligned to the findings of the PDRI for
Industrial Projects. The PDRI for Buildings found through an element weighting
process that there was ranking of elements according to their contribution to risk.
The top ten elements along with their weights can be can be seen here in Figure
2.5.
Element Weights A1. Building Use 44 A5. Facility Requirements 31 A7. Site Selection Considerations 28 A2. Business Justification 27 C6. Project Cost Estimate 27 A3. Business Plan 26 C2. Project Design Criteria 24 C3. Evaluation of Existing Facilities 24 A6. Future Expansion / Alteration Considerations 22 F2. Architectural Design 22
275/1000
Figure 2.5 PDRI Ten Highest Weighted Elements - Building Projects
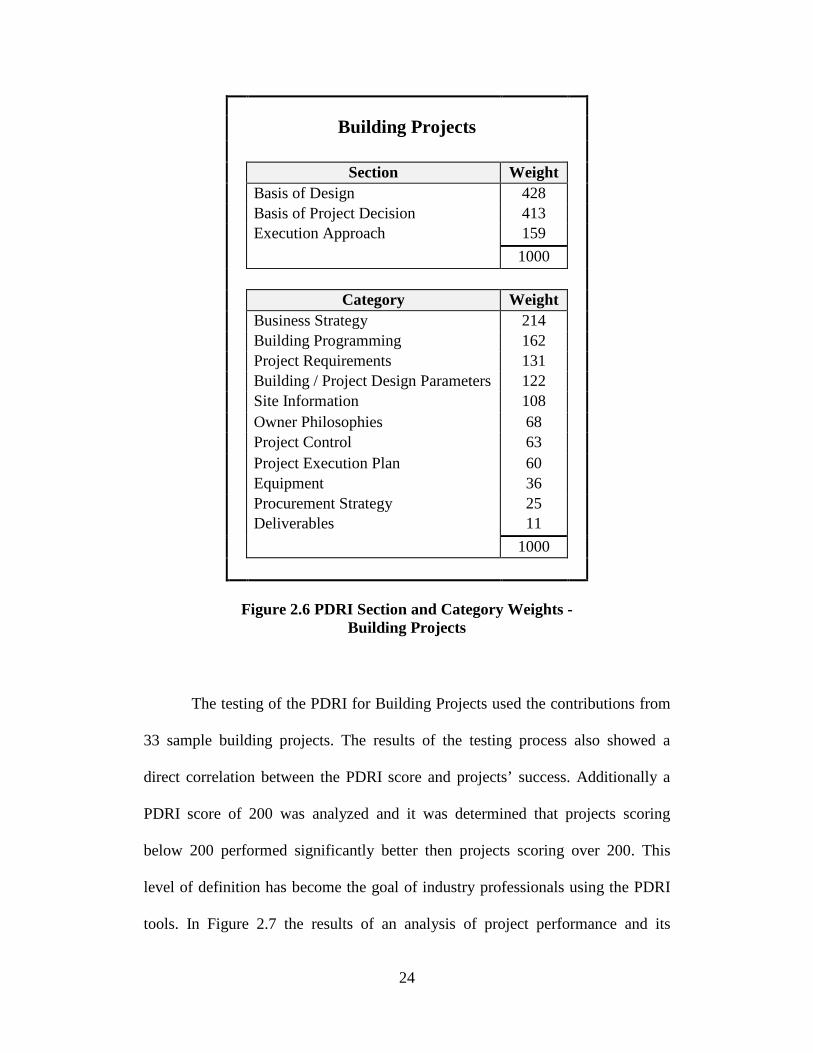
Additionally the weighting for sections and categories is shown in Figure
2.6.
24
Building Projects
Section Weight Basis of Design 428 Basis of Project Decision 413 Execution Approach 159
1000 Category Weight Business Strategy 214 Building Programming 162 Project Requirements 131 Building / Project Design Parameters 122 Site Information 108 Owner Philosophies 68 Project Control 63 Project Execution Plan 60 Equipment 36 Procurement Strategy 25 Deliverables 11
1000
Figure 2.6 PDRI Section and Category Weights -
Building Projects
The testing of the PDRI for Building Projects used the contributions from
33 sample building projects. The results of the testing process also showed a
direct correlation between the PDRI score and projects’ success. Additionally a
PDRI score of 200 was analyzed and it was determined that projects scoring
below 200 performed significantly better then projects scoring over 200. This
level of definition has become the goal of industry professionals using the PDRI
tools. In Figure 2.7 the results of an analysis of project performance and its
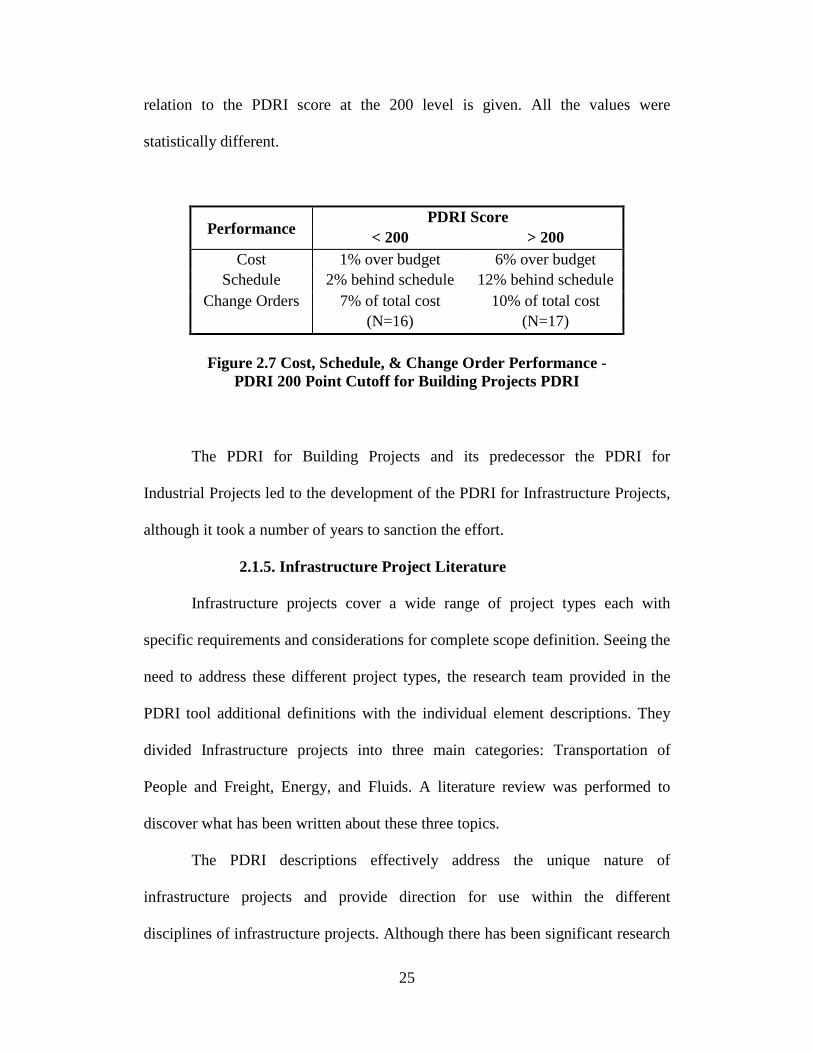
25
relation to the PDRI score at the 200 level is given. All the values were
statistically different.
Performance PDRI Score
< 200 > 200 Cost 1% over budget 6% over budget
Schedule 2% behind schedule 12% behind schedule Change Orders 7% of total cost 10% of total cost
(N=16) (N=17)
Figure 2.7 Cost, Schedule, & Change Order Performance -
PDRI 200 Point Cutoff for Building Projects PDRI
The PDRI for Building Projects and its predecessor the PDRI for
Industrial Projects led to the development of the PDRI for Infrastructure Projects,
although it took a number of years to sanction the effort.
2.1.5. Infrastructure Project Literature
Infrastructure projects cover a wide range of project types each with
specific requirements and considerations for complete scope definition. Seeing the
need to address these different project types, the research team provided in the
PDRI tool additional definitions with the individual element descriptions. They
divided Infrastructure projects into three main categories: Transportation of
People and Freight, Energy, and Fluids. A literature review was performed to
discover what has been written about these three topics.
The PDRI descriptions effectively address the unique nature of
infrastructure projects and provide direction for use within the different
disciplines of infrastructure projects. Although there has been significant research
26
involving each type of infrastructure project: People and Freight, Energy and
Fluids, this research has not specifically addressed front end planning.
2.1.5.1. People and Freight
Projects considered to be people and freight are involved in the
transportation, conveyance, distribution and/or collection of people or goods.
Some example of these types of projects include but are not limited to; highways
railroads, access ramps, toll booths, tunnels, and airport runways. In relation to
projects involving the transportation of people and freight some helpful research
used in the development for the PDRI for infrastructure includes a study by the
Federal Highway Administration (FHWA) that provides a strategic plan for
highway infrastructure research and development. It is a coordinated plan that
provides direction for future infrastructure research. This plan also demonstrates
how the focus on highway infrastructure research, development, and technology
deployment benefits the economy of the nation (Turner-Fairbank 2008).
Other notable works include a text on traffic and highway engineering.
The writers approach the subject of technical elements, and groupings in general
elements in order to provide adequate topic coverage. The authors begin by
discussing the basics of transportation, its importance in society, and the degree to
which transportation pervades our lives. The bulk of the text considers traffic
operations, management, planning, design, construction and maintenance (Garber
et al. 2002).
In Handbook of Transportation Engineering the author identifies various
aspects of transportation engineering. In chapter 5 specifically, the author speaks
27
to the applications of geographic information systems (GIS) in transportation
planning. There exists a need, therefore, for enhanced approaches to store,
manipulate, and analyze data spanning multiple themes, for example, highway
infrastructure, traffic flow, transit characteristics, demographics, and air quality.
GIS offers a data management and modeling platform capable of integrating a
vast array of data from various sources, captured at different resolutions, and on
seemingly unrelated themes (Spring 2004). Considerable amounts of literature
exist on the topic of projects involving people and freight. For a good overview
see Caldas et al. (2007).
2.1.5.2. Energy
Infrastructure projects that deal with the transmision or distribution of
energy also unique charactoristics. Writings from the U.S. Department of Energy
helped identify some of the special condtions surounding energy projects (USDEP
2008). Energy projects were difined to be projects involved in electrical
distribution. These types of projects extend into critical structures like towers and
substations. Energy type projects also deal with the transmision of infromation
through wide area networks or fiber optic networks.
A large amount of literature was found on energy infrastructure specific to
wind power. One example is an article entitled Wind Power and Energy Storage
(Groggin 2008). This article answers some of the most common questions
regarding wind power and the role of energy storage. The authors propose on
account of numerous peer-reviewed studies that show wind energy can provide
20% or more of our electricity without any need for energy storage. The secret to

28
achieving this lies in using the sources of flexibility that are already present on the
electric grid. A tremendous amount of flexibility is already built into the power
system. Demand for electricity can vary by a factor of three or more depending on
the time of day and year; which nationwide translates into hundreds of gigawatts
of flexibility that are already built into the power system.
Another work on green energy was created by the Solar Energy Industries
Association. This work called green power super highways, lays out a road map
to attain greater penetration of renewable energy into the United States (Gramlich
et al. 2009). The authors also identify current challenges to attaining this lofty
goal. Some of the current challenges outlined include, coordinating transmission
operations, consumer benefits of transmission, recovering costs, and reducing
land use impacts. In addition, the authors recognize the need for updating current
infrastructure. The authors also take note of ways that the current grid can be
utilized to enhance regional operations.
Discussing the actual planning of energy projects, an article by Norm
Richardson identifies that the future expansion of the electric transmission system
has been evolving, moving from a focus on reliability to a more comprehensive
analysis of economic benefits (Richardson 2007). Among the reforms viewed as
necessary by the author, are the following: coordination, openness, transparency,
information exchange, comparability, dispute resolution, regional coordination,
economic planning studies, and cost allocation. The authors also remark on the
need for a market efficiency analysis to determine the economic benefits of the
proposed project. Mr. Richardson's market efficiency analysis tool is reported to

29
be able to determine sensitivity around uncertainties. Finally, he identifies that in
the transmission planning process, consideration must be given to impacts on the
entire region .
On a more global scale, a study by the South Asian Survey included an
article outlining the current demand placed upon the world energy market by
countries in the south Asian region (Vasudev 200). In order to sustain the pace of
economic growth in the region, the author concludes that it is essential to invest in
the infrastructure sectors. One of the unique factors that are addressed in this
article is the need for cooperation, and collaboration amongst countries in the
region in order to improve the infrastructure in the region. It further discusses the
need for a uniform policy to be developed amidst the participating nations.
2.1.5.3. Fluids
Another topic of study for the research review is that of fluid infrastructure
projects. The works relating to fluids deal with many types of fluid projects some
of which include pipelines, aqueducts, pumping and compressor stations,
reservoirs, canals, water control structures, levees and many more. The United
States Environmental Protection Agency, The American Water Works
Association, and other water related organizations have devoted considerable
attention to water system asset management as a way to address infrastructure in a
comprehensive and sustainable manner. Asset management is defined as
"managing infrastructure capital assets to minimize the total cost of owning and
operating them, while delivering the service levels that customers desire."
30
Fundamental to asset management is having a complete understanding of the
basic infrastructure of a community (Job 2009).
Some additional literature reviewed, included an article in the
International Journal of Water Resources Development. This article discussed the
effective planning, design, and management of water resource systems for
sustainable development in developing countries (Biswas 1988). It was concluded
in this article that five major factors complicated this process. First, use is
frequently made of an incomplete framework for analysis, ignoring positive
impacts of development. Second, there is a lack of appropriate methodology for
applying environmental impact assessments in these countries. Third, there is a
lack of adequate knowledge about the effects of water development projects.
Fourth, there are institutional restraints, particularly the division of
responsibilities among various ministries. Fifth, monitoring and evaluation are
seldom integrated into project management.
The Journal of Civil Engineering provided useful literature on fluids
projects; for example, an article was reviewed which highlighted the current state
of pipelines in the United States. The author’s underlying goal is to facilitate an
approach to operating and maintaining the nation’s water and wastewater
pipelines which focuses on extending the life of existing assets. Additionally, it is
recognized that funds for infrastructure are limited and cities must ensure that
budgets are spent judiciously. Because rehabilitating pipelines after they fail can
be costly and can cause significant hardship to the communities they serve, the

31
author recommends a water pipeline database to improve asset management
(Landers 2008).
On the topic of planning for fluids infrastructure the government of
Victoria gave a report outlining the necessary steps of planning these projects.
This report recommends that the community be apprised of the processes used to
select and prioritize water supply projects. Further, project teams need to decide
how the project estimates underpinning the water infrastructure plan will be
verified and how this more rigorous information will be made available to the
community (Pearson 2008).
2.1.5.4. Risk Factors of Infrastructure Projects
Infrastructure projects often have risks that are not found in other tyes of
projects due to the fact that they often represent very large amounts of capital.
Some of these projects are even considered “megaprojects”. These projects come
with their own set of rules and demands and represent significant risks (Flybjerg
2008).
A literature review focusing on the risks of infrastructure projects was
performed in which many infrastructure projects that failed in one way or another
were studied. Some of these projects included the I-35 bridge failure in
Minnesota, the Lake Pontchartrain bridge failure, and the steam pipe explosion in
Manhattan. This review was performed to identify risks that could be addressed in
the early planning stages in order to avert catastrophic failures. The findings of
the review could be summarized in an article in the Contract Journal discussing
the root of project failure (unknown author 2009). This article outlines actions

32
that can be undertaken to reduce uncertainty in construction plans and
programming. By embracing, to at least some degree, certain programming and
planning actions prior to and during a construction project, uncertainty can be
addressed and hopefully minimized to the benefit of all. Successful projects are
usually those that have been well planned and the unsuccessful ones are usually
those that have not. With such uncertain times ahead in the industry, project teams
need to be able to plan and program projects with as much certainty as possible in
the hope to avoid costly and unwanted disputes (Contract Journal 2009).
2.2. Literature Review Findings
The literature review has provided a background and introduction into the
organizations, definitions, studies, and writings used as a foundation for the PDRI
for Infrastructure Projects. The findings give good support for the development of
the PDRI tool. The study of past works offers a background in the development of
comparable tools as well supports the need for a front end planning tool
specifically focused on infrastructure projects.
The author found through the literature, that infrastructure projects were
unique in several key characteristics. Not only do they differ from industrial and
buildings in orientation of the project (horizontal as opposed to vertical in nature),
but also in many more areas. Infrastructure projects are generally designed by
civil engineers where industrial projects deal mostly with chemical, industrial, and
mechanical engineers and building projects have an architect as their primary
designer. The operation of infrastructure projects seemed to be networked into a
grid as opposed to being nodal terminations. The idea of infrastructure projects
33
being vectors that connect deferent nodes comes from this concept. Infrastructure
projects have extensive involvement with the public; they have a large
environmental impact, and often deal with multiple jurisdictions. They typically
have large cost due to earthwork and associated structure and less cost due to
installed equipment. Another high cost for infrastructure projects can be the cost
of land. Right of way issues are of high concern for these types of projects. The
literature review shows that although much is understood about infrastructure
projects, a systematic study of the effects of front end planning on infrastructure
projects does not exist. No integrated planning tool was found in the literature
review for infrastructure projects, with the exception of the APRA.
34
Chapter 3: PROBLEM STATEMENT AND RESEARCH HYPOTHESES
The overarching findings from the literature review found in chapter two
show a need for research into front end planning of infrastructure projects. There
has been little work studying the effects of front end planning in infrastructure.
The lack of research on this subject led the author to the development a set of
hypotheses. This chapter establishes a problem statement which can be answered
by proving these research hypotheses.
3.1. Problem Statement
Infrastructure projects are often very complex. They can cross multiple
jurisdictions and involve multiple stake holders. The complexity of these projects
often leads to cost overruns, unmet schedules and costly changes. Like any
construction project there are certain actions that can be taken in order to reduce
the probability of a negative outcome. One of the most powerful tools in risk
mitigation is the use of front end planning. Multiple studies referenced previously
in the literature review conclusively show the direct correlation of a good FEP
system to future project success. This research has encompassed buildings and
industrial projects and is now continued for infrastructure projects. This research
comes as a result of demand within the construction industry for user friendly tool
to assist in the front end planning of highways, pipelines, energy distribution lines
and other infrastructure related projects. Because of the historic failures of these
types of projects in terms of costs, schedule and changes as well as often
catastrophic failures, this research has been performed in an effort to better
understand planning issues needed to deliver successful infrastructure projects.
35
3.2. Research Hypotheses
The PDRI for infrastructure Projects is modeled directly after the PDRI
for Industrial Projects and the PDRI for Building Projects. These PDRI tools all
share the same basic research hypotheses. In order to prove these hypotheses the
PDRI tools have gone through a testing process in which the correlation between
the PDRI score and key success indicators is measured for significance and
reliability. As this research follows essentially the same methodology as the
previous PDRI tools, the testing process was also followed for this tool and is
discussed in detail in chapter 6. The author provides the following:
Hypothesis 1 - A finite and specific list of issues related to scope definition of
infrastructure projects can be developed.
This hypothesis will be tested by developing the draft tool and sharing
with various expert focus groups. Their feedback is incorporated into the list of
scope definition elements.
Hypothesis 2 - The PDRI score indicates the current level of scope definition and
corresponds to project performance. Infrastructure projects with low PDRI scores
outperform projects with high PDRI scores.
This hypothesis was tested through the validation or testing process of the
PDRI on actual projects.

36
Within the PDRI a low score corresponds to a project that has good scope
definition. In contrast, a high PDRI score means a project has poor scope
definition. Testing of the hypotheses analyzes the performance difference between
projects with high PDRI scores and those with low PDRI scores.
In the PDRI for industrial projects as well as the PDRI for building
projects a second hypothesis was tested. This hypothesis stated that the PDRI
score is a reliable indicator of predicting project success.
3.3. Summary
The purpose and objective of this thesis is the testing of the research
hypotheses. The following chapters provide the research methodology that was
used in this effort, as well as the development and testing process for the PDRI
tool.
37
Chapter 4: RESEARCH METHODOLOGY
The PDRI for Infrastructure Projects development was based on years of
previous research within the CII as well notable works by reputable organization
such the Texas Department of Transportation. Consequently the methodology
used in developing the PDRI for Infrastructure Projects is modeled closely after
these previous works. This methodology proved reliable in reaching the research
objectives and testing of research hypotheses. This chapter discusses the
methodology used by these previous works and will detail the specific research
design for the PDRI for Infrastructure. In addition this chapter details the research
project design. As a part of the research design the ideas of conceptualization,
population sampling, research observations, data processing, analysis, and
research application are described in detail. This chapter also describes the
development of the PDRI scorecard, the use of weighting workshops, and the
types of measures used in the research. Finally a breakdown of the statistical tests
and specific conclusion of the PDRI for Infrastructure Projects are given.
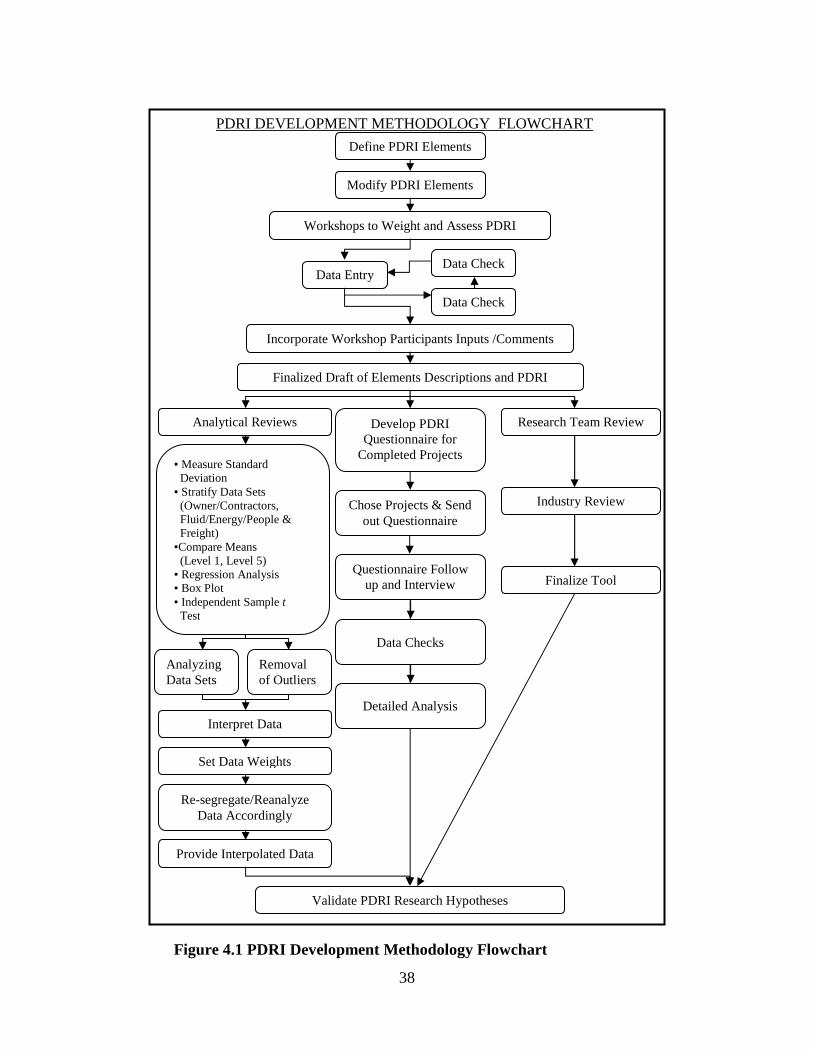
4.1. Development Methodology
A detailed description of the methodology process can be seen in Figure
4.1. This figure is a visual representation of the steps taken by the author to
complete the research objectives and test the hypotheses found in chapter three.
38
PDRI DEVELOPMENT METHODOLOGY FLOWCHART
Validate PDRI Research Hypotheses
Set Data Weights
Re-segregate/Reanalyze Data Accordingly
Provide Interpolated Data
Chose Projects & Send out Questionnaire
Questionnaire Follow up and Interview
Industry Review
Finalize Tool
Analyzing Data Sets
Removal of Outliers
Interpret Data
Finalized Draft of Elements Descriptions and PDRI
Develop PDRI Questionnaire for
Completed Projects
Research Team Review Analytical Reviews
▪ Measure Standard Deviation ▪ Stratify Data Sets (Owner/Contractors, Fluid/Energy/People & Freight) ▪Compare Means (Level 1, Level 5) ▪ Regression Analysis ▪ Box Plot ▪ Independent Sample t Test
Define PDRI Elements
Modify PDRI Elements
Workshops to Weight and Assess PDRI
Data Entry Data Check
Data Check
Incorporate Workshop Participants Inputs /Comments
Data Checks
Detailed Analysis
Figure 4.1 PDRI Development Methodology Flowchart
39
The following sections briefly describe the steps shown through the
methodology flowchart and the role of the author in each step. The detailed
development process of each step is shared in the next chapter.
4.1.1. Creating the PDRI Elements
Research conceptualization is the process of specifying the meaning of
concepts or variables that will be studied. Some of these concepts have been
identified and defined in the previous chapter. They include but are not limited to;
front end planning (FEP), pre- project planning, Project Definition Rating Index
(PDRI), project scope definition, as well other important concepts and vocabulary
critical in understanding the PDRI for Infrastructure Projects. These concepts are
defined as they are encountered throughout the thesis. In addition, further
clarification can be found in CII Implementation Resource 268-2, another product
of RT 268 (CII 2010).
4.1.1.1. Research Method
The PDRI for infrastructure uses various methods of research. The best
study designs use more than one research method, taking advantage of their
individual strengths (Babbie 2008). The author used multiple methods of research
in the development of the different parts of the PDRI tool. These methods include
survey research, field research, content analysis, existing data research,
comparative research, and evaluation research.
4.1.1.2. Scorecard Development
The main research methods used in the development the PDRI scorecard
are a basic content analysis with use of coding and the use of existing data

40
research. Content analysis is a study of recorded communications through books,
website, journals, and other forms of communication. The scorecard was
developed by basing it off of previous work and changing it to fit the use of the
PDRI for infrastructure projects. The process of coding was used to transform raw
data into a standardized form for processing and analysis. The method of
researching existing data is also a recognized research method that was used in
creating the scorecard.
4.1.1.3. Element Descriptions
Similarly to the PDRI scorecard the element list and its descriptions used
some of the same research methods of content analysis, coding, and the use of
existing research. In addition a field research method was employed this was
accomplished through visiting construction companies and gathering for team
meetings as well as during the workshops, to collectively write the descriptions of
the PDRI elements. This use of field research is especially appropriate for
studying attitudes best understood in a participants natural settings.
4.1.2. PDRI Weighting Workshops
The weighting workshops development methodology was modeled after
similar workshop structures used in previous PDRI projects. These workshops are
a form of survey research but are also a form of field research because industry
professionals were sought out to contribute to the tool. The workshops are a sort
of survey called a qualitative interview in which a focus group is asked by an
interviewer or facilitator to weigh on topics of interest (Babbie 2008). One
strength of field research is that participants are in a place they are comfortable.

41
Participants can also help each other in understanding what is being studied and
this can facilitate better response. Unfortunately the peer environment can also be
a weakness in field research if participants are swayed in their opinion by other
participants. The step by step process of the weighting workshops is detailed in
chapter five.
4.1.3. Validation Questionnaire
The testing process follows similar methodology to the weighting
workshops in that this is a type of survey research. Questions are asked in
questionnaire format and statements are collected from contributors. The
questionnaire was developed using a similar questionnaire that was used for the
PDRI for building projects. Modifications were made to match the responses
needed for the PDRI for infrastructure projects. The Validation questionnaire is
made up of a series of open and close ended questions. The questions provide
general information about the project as well as key performance result such as;
estimated vs. final schedule, estimated vs. final costs, number of change orders,
project success rating and other performance measuring questions. The validation
questionnaire is provided in Appendix F.
The use of an individual project for evaluation against certain parameters
can also be considered a case study. The valuation process is a type of evaluation
research. Evaluation research is research undertaken to determine whether an
intervention has impact on an outcome. In the case of the PDRI tool the
intervention is the implementation of front end planning and its effect on the
outcome or success of the project. The determination of whether the intervention
42
is producing the intended result is called program evaluation. Program evaluation
could be synonymous with validation or testing in this study.
4.1.3.1. PDRI Tool Analysis
Part of the methodology behind the development of the PDRI tools
involves the systematic testing of the tool. The author accomplished this through
collecting data from projects using the questionnaires and analyzing that data to
determine significance. A detailed data analysis was performed by the author and
the results of the analysis can be found in chapter six: Testing of the PDRI.
4.1.4. Weighting Workshop Data
Because it would be impossible to collect data from every person involved
in the planning of infrastructure projects, a sample is taken from the population.
This sample can be used represent the population to a certain level of significance.
The PDRI uses three kinds of sampling. Purposive sampling is when the ones
being observed or surveyed are selected from a population on the basis of the
researcher’s judgment about which individuals will be the most useful or
representative; this is also called judgmental sampling. In other words the
participants in the PDRI for infrastructure were chosen based on the fact that they
were industry professionals with experience in infrastructure projects. Snow ball
sampling was also used. This type of sampling is used in field research where
each person being sampled is asked to suggest people for interviewing. A lot of
the contribution to this method of sampling came from members of the research
team. Finally quota sampling was used. This form of sampling is similar to
purposive sampling in that people are selected based on pre-specified

43
characteristics. They are used to represent a specific population or focus group.
The focus group this research focused on is infrastructure projects and their
planners.
4.1.4.1. Observations
Data observation is the process of collecting data for interpretation and
analysis. The main method of data collection used to develop the PDRI for
Infrastructure Projects was through the workshop packets and validation
questionnaires. It also became necessary to contact some participants for the
gathering of missing, incomplete or unclear data. In the interest of research ethics
all the data collected was immediately given a code for identification. This
allowed the data to be analysis and shared without revealing proprietary
information. The collected data then went through a series of checks to make sure
there were no errors in data entry. Three separate individuals performed the data
check.
4.1.4.2. Data Processing
Through the process of data processing the collected data is put into a
format that that is appropriate for analysis. The data collected through the
weighting workshops as well as the validation questionnaire process was entered
into Excel™. From there the data was usable for calculation and analysis. This
analysis was performed through tools available through Excel 2007, as well as
through the use of the statistical software SPSS™.
44
4.1.5. Analytical Reviews
Several different statistical tools were used to determine the accuracy of
conclusions, assumptions, and hypotheses made in this study. Some of the
different analysis methods and tools are discussed in this section.
4.1.5.1 The Boxplot
The boxplot is a statistical tool that graphically displays the distribution of
data. Information the boxplots provide includes median, interquartile range,
outliers, and extremes. Figure 4.3 shows the different graphics used to depict this
various information. The median is demonstrated using a straight horizontal line.
The box around the median gives the interquartile range with the bottom end
showing the 25th percentile and the upper end depicting the 75th percentile. Fifty
percent of responses are found within this interquartile. The median demonstrates
the central tendency while the box around it shows variability. If the line is not in
the middle of the box, then the distribution is skewed, which is discussed in the
next section. Vertical lines extend past the box, both above and below,
demonstrating the largest and smallest values that are not considered outliers or
extremes. Outliers are notated using small circles and extremes are notated using
asterisks.
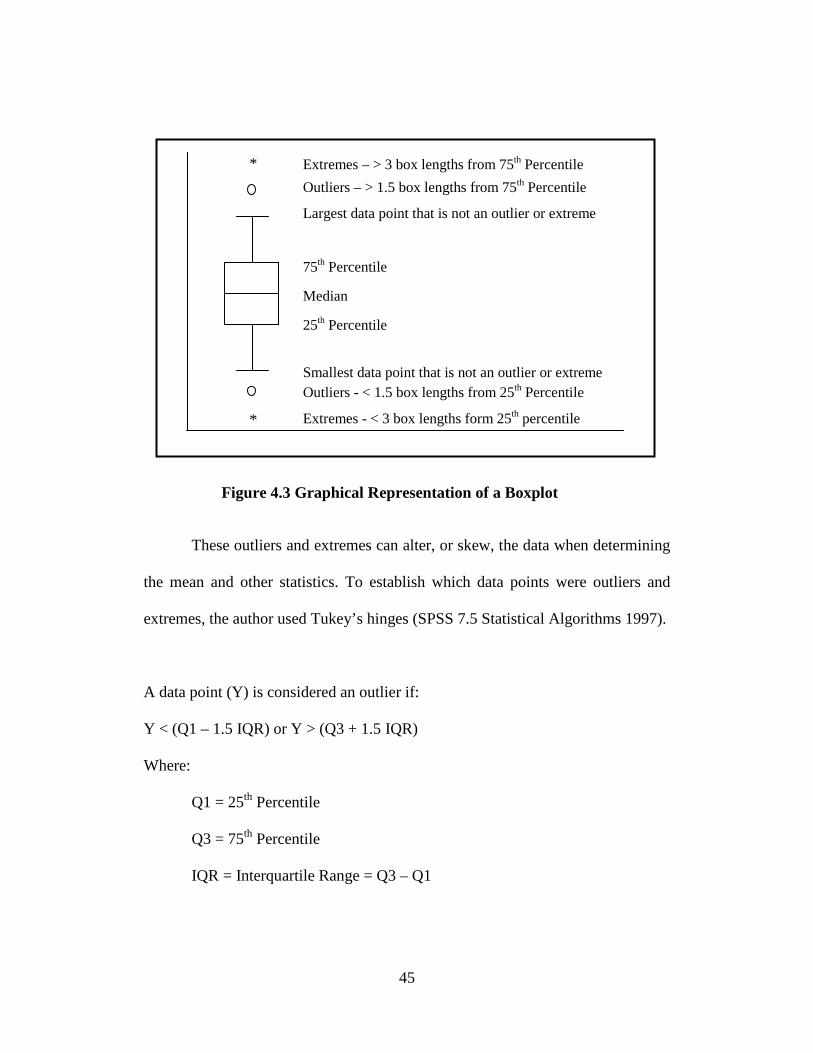
45
These outliers and extremes can alter, or skew, the data when determining
the mean and other statistics. To establish which data points were outliers and
extremes, the author used Tukey’s hinges (SPSS 7.5 Statistical Algorithms 1997).
A data point (Y) is considered an outlier if:
Y < (Q1 – 1.5 IQR) or Y > (Q3 + 1.5 IQR)
Where:
Q1 = 25th Percentile
Q3 = 75th Percentile
IQR = Interquartile Range = Q3 – Q1
Extremes – > 3 box lengths from 75th Percentile
Outliers – > 1.5 box lengths from 75th Percentile
Largest data point that is not an outlier or extreme 75th Percentile
Median
25th Percentile
Smallest data point that is not an outlier or extreme
Outliers - < 1.5 box lengths from 25th Percentile
Extremes - < 3 box lengths form 25th percentile *
*
Figure 4.3 Graphical Representation of a Boxplot
46
A data point (Y) is considered an extreme if:
Y < (Q1 – 3 IQR) or Y > (Q3 + 3 IQR)
Where:
Q1 = 25th Percentile
Q3 = 75th Percentile
IQR = Interquartile Range = Q3 – Q1
4.1.5.2. Skewness
Many of the statistical tools available to researchers involve an assumption
that the data collected is distributed normally; however, this is not always the
case. Often data sets can be skewed due to data points that trail off in one
direction as depicted in Figure 4.4. The Histogram below shows a data set where
the data points clump around lower values and trail off to the right. Skewness can
also be created by outliers and extremes.

47
Figure 4.5 below demonstrates how a distribution can be skewed to one
side. A distribution can be either positively or negatively skewed with a positively
skewed distribution trailing off to the right and a negatively skewed distribution
trailing off to the left.
Negative Skewness Positive Skewness
Figure 4.5 Negative & Positive Skewness
Measurement
Fre
quen
cy
Figure 4.4 Histogram - Positively Skewed Data

48
Skewness measures the symmetry of a distribution with a score of zero
implying perfect symmetry or a perfect normal distribution. Skewness greater
than one implies significant asymmetry and a distribution that is far from normal.
As mentioned before, skewness can alter the reliability of statistical
analysis because the normal distribution assumption is not met such as in
correlation coefficients and t-test which can cause inaccurate results when running
statistical analysis. It can be important to deal with skewness in order to have
accurate test results (Siegel 2003). Skewness was checked using descriptive
statistics in SPSS.
4.1.5.3 Regression Analysis
Regression analysis is used to predict one variable from another by using
an estimated line that summarizes the relationship between variables (Siegel
2003). When data is obtained and compiled into data sets, the information can be
graphed using a scatterplot. The independent variable or X is the data that is
assumed to predict behavior in the independent variable Y. Using the data sets
obtained, a researcher can graph the data that is independent along the X-axis and
the corresponding dependent data on the Y-axis producing this scatterplot as seen
in Figure 4.6.
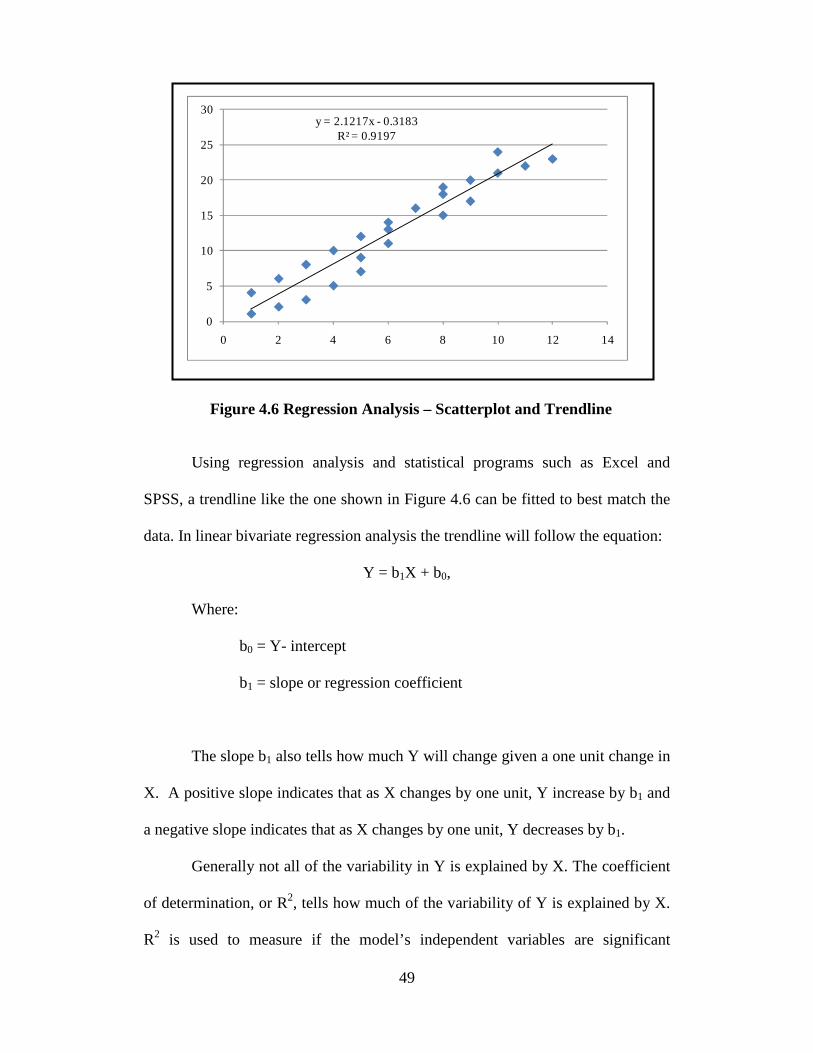
49
Using regression analysis and statistical programs such as Excel and
SPSS, a trendline like the one shown in Figure 4.6 can be fitted to best match the
data. In linear bivariate regression analysis the trendline will follow the equation:
Y = b1X + b0,
Where:
b0 = Y- intercept
b1 = slope or regression coefficient
The slope b1 also tells how much Y will change given a one unit change in
X. A positive slope indicates that as X changes by one unit, Y increase by b1 and
a negative slope indicates that as X changes by one unit, Y decreases by b1.
Generally not all of the variability in Y is explained by X. The coefficient
of determination, or R2, tells how much of the variability of Y is explained by X.
R2 is used to measure if the model’s independent variables are significant
y = 2.1217x - 0.3183R² = 0.9197
0
5
10
15
20
25
30
0 2 4 6 8 10 12 14
Figure 4.6 Regression Analysis – Scatterplot and Trendline
50
predictors of the dependent variables. R2 is calculated by squaring the correlation
r. R2 values range from zero to one with a one indicating that X perfectly predicts
Y and a 0 indicating that X does not predict Y at all. In other words, an R2 =0 .75
tells that 75 percent of the variation in Y is explained by X. The r value can show
whether there is a positive or negative relationship, r values range from negative
one to one and a negative r value indicates that as X increases, Y decreases. If r is
positive, then the reverse is true.
In order to determine the quality of the model and its predictability the
author calculated the r and R2 value as well an F-statistic with is corresponding p-
value using Excel and SPSS. A p-value of less than .05 would imply that the R2
is statistically significant at the 95 percent confidence level.
4.1.5.4 Independent Samples t-Test
The t-test measures whether the means of two groups are statistically
different from one another. The author focused on using an independent samples
t-test which evaluates whether means for two independent groups are significantly
different from each other (Green et al. 1997). The independent samples t-test
makes three assumptions.
1) The data being measured is collected from a random sample
2) Each sample average is assumed to be approximately normally
distributed
3) Variance of the two samples are equal

51
A t-test analyzes the means compared to the spread of variability using
these assumptions. Figure 4.7 demonstrates why it is important to compare the
means to the variability. The difference between the means of the two groups in
all three graphs are the same; however, the spread of variability is obviously
different with the highest spread of variability found in the second graph and the
lowest spread of variability in the last graph. The last graph would demonstrate
much higher statistical significance than the top or middle graph due to a low
spread of variability.
Figure 4.7 Same Difference in Means with Different Variability
SPSS can run several different t-tests, but for the testing of the PDRI the
independent samples t-test was used, giving an output of Levene’s test for
equality and the t-test for equality of means. Levene’s test for equality of variance

52
checks to for equal variance and SPSS returns a significance value or p-value to
determine this. A p-value less than 0.05 shows that the variances are statistically
different, in which case the author read the SPSS output of t-test for equality of
means using equal variances not assumed. Table 4.1 depicts a blank output box
from SPSS which shows these values:
Table 4.1 Independent Samples t-Test Output Using SPSS
Levene's Test for Equality of Variances
t-test for Equality of Means
F Sig. t df Sig. (2-tailed)
Mean Difference
Std. Error Difference
Equal variances assumed
Equal variances not assumed
This analysis and procedure was used to validate the PDRI using the
cutoff point of a PDRI score of 200, as well as other cut off points. The means of
performance between the two groups were compared using SPSS to determine if
there was a statistically significant difference between the two groups.
4.2 Research Application
The previous sections have described the methodology of gathering data
for the statistical tests used to validate the research hypotheses. The applications
of the research; reporting of results and implications, are summarized in the final
chapter on conclusions and recommendations for the PDRI. It should be noted
here however that there are some limitations to the data.

53
4.3. Limitations of Analyses
When performing statistical analysis it is important to recognize some
limitations that might be applicable to the sample being tested. In this case the
author had some limitations in regards to the sample population. The optimal
sampling would come from a truly random sample; however, due to the process
for collecting the data the author was limited to only those who would volunteer
the information. It is likely that participants chose more successful projects to
report, rather than less successful projects. Additionally, participants were
providing information months, and sometimes years after the fact and as such
there is room for inaccurate data. Due to these limitations broad generalizations
may not be applicable.
4.4. Summary
This chapter is a summary of the research methodology followed for the
development the PDRI documents as well as the process used by the author in the
testing of the PDRI. Support for the selection of research design was given and
described in detail throughout the sections, ending in a detailed analysis and
presentation of key findings. The next chapter describes the process of developing
the PDRI for Infrastructure Projects.
54
Chapter 5: PDRI DEVELOPMENT PROCESS
This chapter describes the process that was followed to develop the PDRI
for Infrastructure Projects. The primary means of data collection was through
workshops held in different parts of the United State as well as abroad. This
chapter describes how these workshops were facilitated, the demographics of their
participants, and the results from the data collected. The data managing and
screening techniques are also given in this chapter. Finally suggestions of how to
use the PDRI are given as well as an example of how the PDRI can be used on a
real project.
5.1. Background of the PDRI for Infrastructure Projects
The basic design of the PDRI element list as well as the element
descriptions that make up a checklist for defining scope definition within a project
is based on the PDRI-Industrial and PDRI-Buildings methodology. Through a
series of research team meetings and screening processes a draft element list was
developed.
In like manner the PDRI for Infrastructure Projects used the element lists
from the building, and industrial PDRI’s, as well as the APRA element list to
create a framework for its element list. Over a series of meetings conducted
during a nine month period, terms were changed to match more closely the
vocabulary used within infrastructure, additional elements unique to infrastructure
were added, and elements not relevant to infrastructure were removed. The list
went through many changes. Most of these changes came from the research team
as they shared their expertise in these areas. After these drafts the test draft
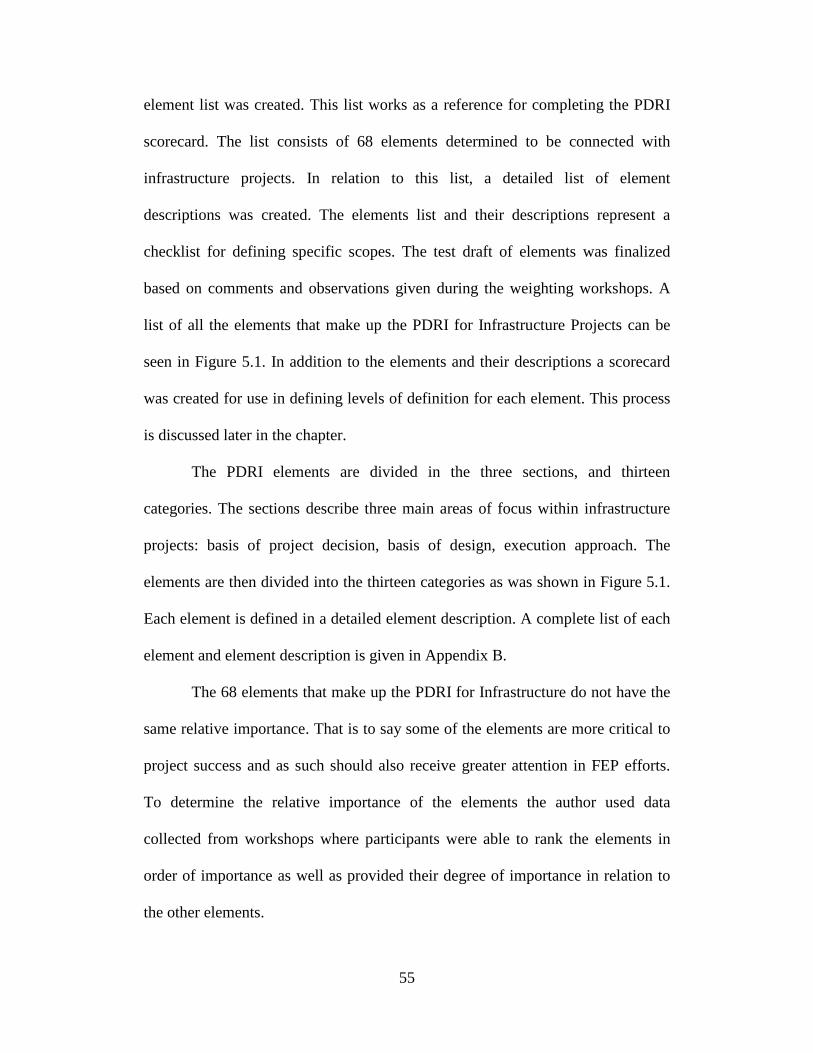
55
element list was created. This list works as a reference for completing the PDRI
scorecard. The list consists of 68 elements determined to be connected with
infrastructure projects. In relation to this list, a detailed list of element
descriptions was created. The elements list and their descriptions represent a
checklist for defining specific scopes. The test draft of elements was finalized
based on comments and observations given during the weighting workshops. A
list of all the elements that make up the PDRI for Infrastructure Projects can be
seen in Figure 5.1. In addition to the elements and their descriptions a scorecard
was created for use in defining levels of definition for each element. This process
is discussed later in the chapter.
The PDRI elements are divided in the three sections, and thirteen
categories. The sections describe three main areas of focus within infrastructure
projects: basis of project decision, basis of design, execution approach. The
elements are then divided into the thirteen categories as was shown in Figure 5.1.
Each element is defined in a detailed element description. A complete list of each
element and element description is given in Appendix B.
The 68 elements that make up the PDRI for Infrastructure do not have the
same relative importance. That is to say some of the elements are more critical to
project success and as such should also receive greater attention in FEP efforts.
To determine the relative importance of the elements the author used data
collected from workshops where participants were able to rank the elements in
order of importance as well as provided their degree of importance in relation to
the other elements.
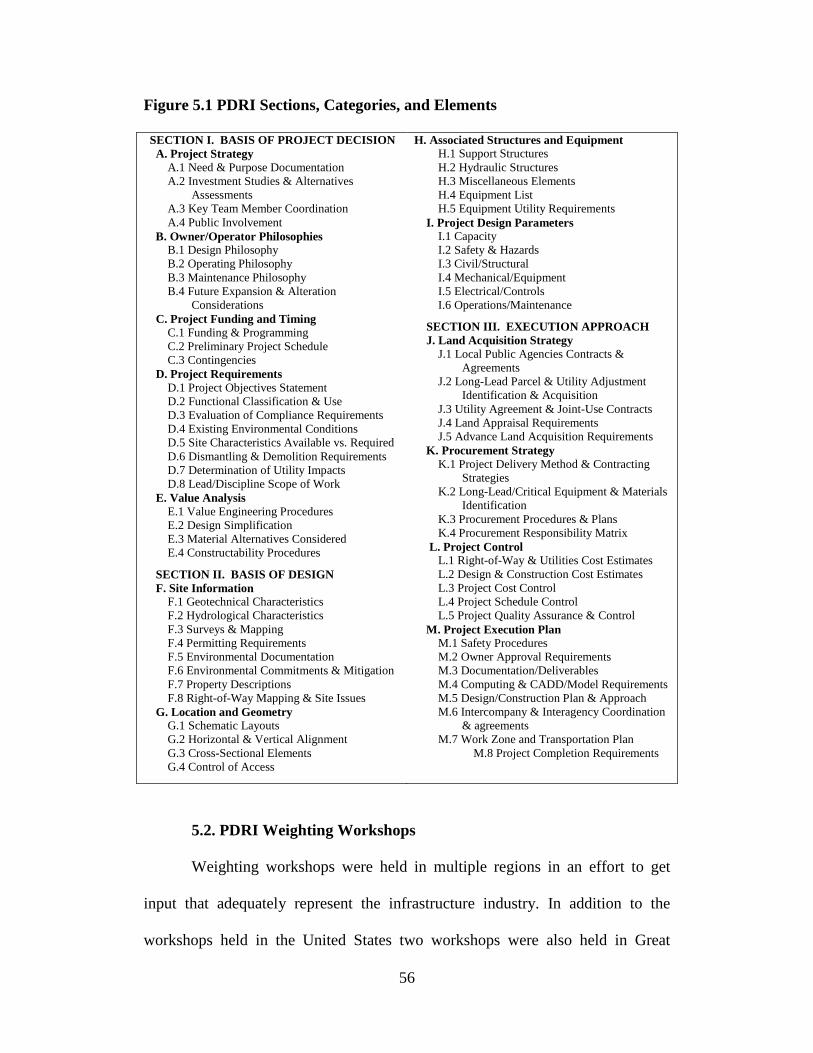
56
Figure 5.1 PDRI Sections, Categories, and Elements
SECTION I. BASIS OF PROJECT DECISION A. Project Strategy
A.1 Need & Purpose Documentation A.2 Investment Studies & Alternatives
Assessments A.3 Key Team Member Coordination A.4 Public Involvement
B. Owner/Operator Philosophies B.1 Design Philosophy B.2 Operating Philosophy B.3 Maintenance Philosophy B.4 Future Expansion & Alteration
Considerations C. Project Funding and Timing
C.1 Funding & Programming C.2 Preliminary Project Schedule C.3 Contingencies
D. Project Requirements D.1 Project Objectives Statement D.2 Functional Classification & Use D.3 Evaluation of Compliance Requirements D.4 Existing Environmental Conditions D.5 Site Characteristics Available vs. Required D.6 Dismantling & Demolition Requirements D.7 Determination of Utility Impacts D.8 Lead/Discipline Scope of Work
E. Value Analysis E.1 Value Engineering Procedures E.2 Design Simplification E.3 Material Alternatives Considered E.4 Constructability Procedures
SECTION II. BASIS OF DESIGN F. Site Information
F.1 Geotechnical Characteristics F.2 Hydrological Characteristics F.3 Surveys & Mapping F.4 Permitting Requirements F.5 Environmental Documentation F.6 Environmental Commitments & Mitigation F.7 Property Descriptions F.8 Right-of-Way Mapping & Site Issues
G. Location and Geometry G.1 Schematic Layouts G.2 Horizontal & Vertical Alignment G.3 Cross-Sectional Elements G.4 Control of Access
H. Associated Structures and Equipment H.1 Support Structures H.2 Hydraulic Structures H.3 Miscellaneous Elements H.4 Equipment List H.5 Equipment Utility Requirements
I. Project Design Parameters I.1 Capacity I.2 Safety & Hazards I.3 Civil/Structural I.4 Mechanical/Equipment I.5 Electrical/Controls I.6 Operations/Maintenance
SECTION III. EXECUTION APPROACH J. Land Acquisition Strategy
J.1 Local Public Agencies Contracts & Agreements
J.2 Long-Lead Parcel & Utility Adjustment Identification & Acquisition
J.3 Utility Agreement & Joint-Use Contracts J.4 Land Appraisal Requirements J.5 Advance Land Acquisition Requirements
K. Procurement Strategy K.1 Project Delivery Method & Contracting
Strategies K.2 Long-Lead/Critical Equipment & Materials
Identification K.3 Procurement Procedures & Plans K.4 Procurement Responsibility Matrix
L. Project Control L.1 Right-of-Way & Utilities Cost Estimates L.2 Design & Construction Cost Estimates L.3 Project Cost Control L.4 Project Schedule Control L.5 Project Quality Assurance & Control
M. Project Execution Plan M.1 Safety Procedures M.2 Owner Approval Requirements M.3 Documentation/Deliverables M.4 Computing & CADD/Model Requirements M.5 Design/Construction Plan & Approach M.6 Intercompany & Interagency Coordination
& agreements M.7 Work Zone and Transportation Plan
M.8 Project Completion Requirements
5.2. PDRI Weighting Workshops
Weighting workshops were held in multiple regions in an effort to get
input that adequately represent the infrastructure industry. In addition to the
workshops held in the United States two workshops were also held in Great

57
Britain. Through the workshops as well as through the testing process and in the
research team membership, representatives from eight countries provided input
into this PDRI tool. Table 5.1 shows the locations of the weighted workshops and
the dates of each.
Table 5.1 Weighting Workshops
Location Date Number of Participants
Washington, D.C. 7/76/2009 16 London 8/11/2009 8 London, Olympic site
8/13/2009 7
Houston 9/2/2009 13 Los Angeles 10/20/2009 9 New York 10/14/2009 11
The workshop participants represented industry professionals from all
over the world and representing multiple owner and contractor organizations. A
list of organizations that participated in the development of the PDRI for
Infrastructure can be found in Appendix A. Sixty-four participants contributed to
the development of weighted elements through the workshops. Figure 5.2
provides some relevant information about these participants. The next section
describes how these workshops were conducted.
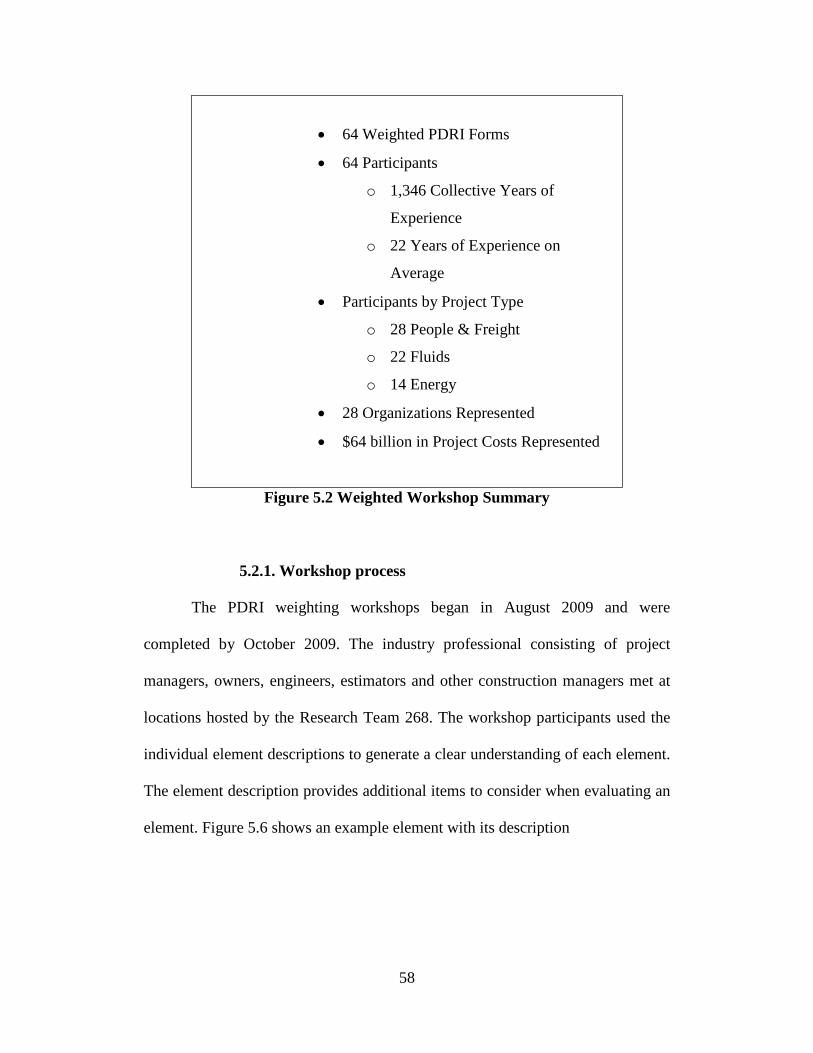
58
• 64 Weighted PDRI Forms
• 64 Participants
o 1,346 Collective Years of
Experience
o 22 Years of Experience on
Average
• Participants by Project Type
o 28 People & Freight
o 22 Fluids
o 14 Energy
• 28 Organizations Represented
• $64 billion in Project Costs Represented
Figure 5.2 Weighted Workshop Summary
5.2.1. Workshop process
The PDRI weighting workshops began in August 2009 and were
completed by October 2009. The industry professional consisting of project
managers, owners, engineers, estimators and other construction managers met at
locations hosted by the Research Team 268. The workshop participants used the
individual element descriptions to generate a clear understanding of each element.
The element description provides additional items to consider when evaluating an
element. Figure 5.6 shows an example element with its description
59
L. PROJECT CONTROL
L.1 Right-of-Way & Utilities Cost Estimates
� Cost of right-of-way � Amounts paid to fee appraisers for appraisal of the right-of-way � Costs normally paid that are incidental to land acquisition � Payment of property damages and losses to improvements � Recording costs � Deed fees � Salaries and expenses of employees engaged in the valuation and negotiation � Right-of-way costs incurred by a utility � Cost of utility adjustment and bringing necessary utilities to site � Other user defined
Figure 5.6 Project Control Element Descriptions
The workshop facilitator led the group through the scorecard and element
descriptions one by one. The following steps were taken by the facilitator to
instruct them on how they would contribute to the element weights. The complete
packet provided to each participant can be found in Appendix D.
The facilitator led the group through a PowerPoint presentation. A brief
background of the research team was provided as well as introduction to the PDRI
tool. The participants were provided with a packet that included a PDRI score
Right-of-way costs are defined as those instances where there is an interest
in land acquired and include all costs necessary to acquire the property. In some
cases land and interests in land must be acquired outside existing right-of-way
for or by the utility. The cost estimates in some cases are prepared by the utility
and submitted in support of the utility agreement and plans required for the
proposed work. These estimates should cover only the work for clearing
infrastructure project construction. Issues to consider include:

60
sheet, element descriptions, and a comment and question sheet. They also had a
form they filled out to provide their contact information and experience.
The industry professionals were asked to consider an infrastructure project
that had been involved with. They would be using this project as a reference
during the weighting process. They were instructed to think of a project that was
typical in size and scope and one familiar to their organization. Participants were
counseled not to choose projects based on their final project success of failure but
to choose a project that best typified projects there organization was accustoming
to dealing with. In total these projects represented $56 billion USD in capital
investment.
Each participant was then told to consider that they had been tasked to
estimate the project they had chosen just prior to the detail design process. As
each element was considered in turn the participants were asked to assign a
contingence amount to each element. First they were asked to consider that if the
project had been completely defined within a specific scope. In other words if all
of the considerations found in the element descriptions had been accounted and
planned for. They would then assign a contingency amount to that element. For
example in considering the element K.3 Procurement Procedures and Plans, the
participant would consider that element together with the element description and
assign that element the amount of percent of total that would be allotted to that
element in the form of contingency. In a like manner the participants were also
asked to consider that they had to assign a contingency to the element having little
to no definition prior to detailed design. In other words if the project that the
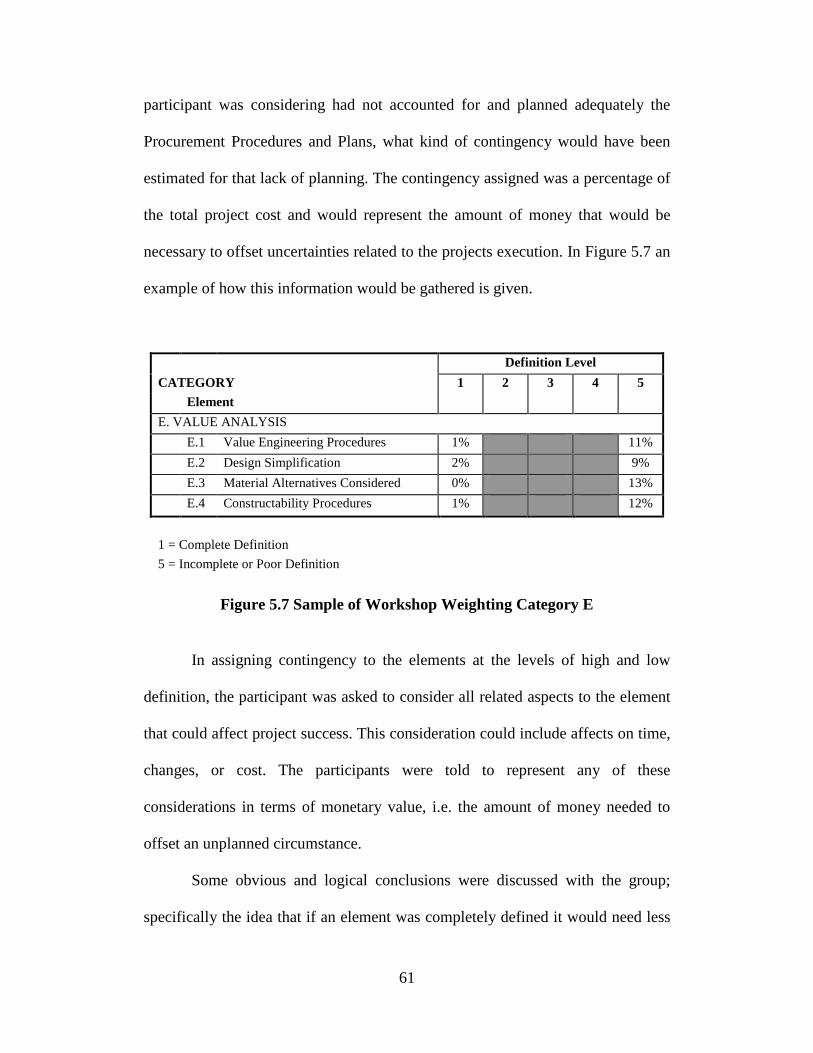
61
participant was considering had not accounted for and planned adequately the
Procurement Procedures and Plans, what kind of contingency would have been
estimated for that lack of planning. The contingency assigned was a percentage of
the total project cost and would represent the amount of money that would be
necessary to offset uncertainties related to the projects execution. In Figure 5.7 an
example of how this information would be gathered is given.
Definition Level
CATEGORY 1 2 3 4 5
Element
E. VALUE ANALYSIS
E.1 Value Engineering Procedures 1% 11%
E.2 Design Simplification 2% 9%
E.3 Material Alternatives Considered 0% 13%
E.4 Constructability Procedures 1% 12%
1 = Complete Definition 5 = Incomplete or Poor Definition
Figure 5.7 Sample of Workshop Weighting Category E
In assigning contingency to the elements at the levels of high and low
definition, the participant was asked to consider all related aspects to the element
that could affect project success. This consideration could include affects on time,
changes, or cost. The participants were told to represent any of these
considerations in terms of monetary value, i.e. the amount of money needed to
offset an unplanned circumstance.
Some obvious and logical conclusions were discussed with the group;
specifically the idea that if an element was completely defined it would need less

62
contingency than an element that was poorly defined. The values for each level of
definition would be recorded under definition levels 1 (represented a completely
defined element) and level 5 (representing an incompletely or poorly defined
element). The participants were allowed to make changes at any time as new
element descriptions were introduced. Times were allotted throughout the
workshop for review of all the elements where adjustments could be made.
Some projects did not have to deal with certain items on the element list.
For example a project that had no right of way issues would not have a level of
definition associated with the elements involving right of way. If that was the case
within the participants’ selected reference projects, they were to check that the
element was Not Applicable or NA in the provided box. It was made clear that an
NA needed to be entered and not a 0 because an answer of 0 would be a decision
that no contingency would be assigned to that element and would skew the data
from projects that actually considered the element in the evaluation. If an element
was applicable to the project but the participant was not familiar with it, the
participant was asked to use their general experience to judge the weight for that
element in a project of similar characteristics.
The elements were reviewed one by one, questions about the elements
were answered directly during the session and the facilitator kept a good flow
from beginning to end. Plenty of time was given for careful consideration of each
element, but not enough time to “over think” the elements. Questions that could
not be answered in the time allotted or that dealt with unrelated items were asked
to be written on the comment sheets. The comment sheets also had questions used

63
in making a complete element description list and in finalizing the development of
the PDRI tool. All the comments and suggestions from the participants were
considered by the research team and implemented as needed into the final version
of the tool.
The scorecard shows levels of definitions ranking from level 1, completely
defined to level 5, incomplete of poor definition. The levels 2, 3 and 4 allow for
the ranking of elements between the complete definition and poor definition
levels. Because previous research showed that the definitions levels 2, 3 and 4
trended linearly between levels 1 and 5 it was not necessary to have the
participant contribute contingency values to those levels of definition. A method
of data interpolation would be used to determine the weight of each element at
definition levels 2, 3 and 4 (Gibson and Oreilly 1997). This also helped to keep
the workshops to a manageable time by avoiding unnecessary work.
In summary of the weighting workshops, the PDRI for Infrastructure
projects follows the methodology used by Research Team 155, PDRI for Building
Projects and Research Team 113, PDRI for Industrial Projects. The APRA tool as
well as other CII studies were also used. Industry leaders were invited to
weighting workshops and contributed weights to each element as well as
contributed to the element descriptions. The workshops were very successful
both in terms of collected data for the weighting process as well as receiving
insights from experienced industry professionals on the value and use of the tool.
The participants contributed valuable information for the development effort.
After the workshops, the author used the collected data to create a weighted score
64
sheet. The next section covers how the data was used to develop weighted
elements.
5.3. Developing the PDRI Element Weights
The 64 completed evaluation scorecards were checked for completeness
and reliability and were all determined to be usable in developing the element
weights. The data was given an alpha numeric code to keep proprietary
information guarded. The first step in developing the weights was normalization.
5.3.1. Normalizing Process
This section describes the method for normalizing the data collected from
the workshops. As with the previous PDRI tools the scorecard was given a
maximum value of 1000. That would mean a project that scored each element as
definition level 5 or poorly defined would end up with a PDRI score of 1000. This
would represent a project with no definition. Conversely, a project scoring each
element as a level 1 or complete definition would have a low score. This score
would be determined on the number and weights of each element at definition
level 1 and would also depend on the number of N/A elements reported on the
score sheet. The weighting for definition level 1 is discussed later. Workshop
participants contributed contingency values for each element. Their level 5
contingencies would not be comparable to each other because no specific scale
was provided in determining the amount of contingency assigned to each element.
This was done on purpose to avoid creating a reporting bias. This is where the
normalization process is necessary. Normalization was accomplished by summing
each participant’s level 5 weights. This number was then divided into 1000 (the
65
max PDRI score) giving a normalizing multiplier. When this multiplier is
multiplied with each individual element contributions, the result is the elements
individual contribution to the maximum of 1000 points. This process takes all the
contributors data and puts them all on the same scale so they can be used in
comparison to each other.
This same process of normalization was used for the level 1 weights for
each of the 64 scorecards. The level 1 weight only differed in the method of
normalization slightly. Because this is the third PDRI tool developed the research
team wanted to make it comparable to the other tools. Both the PDRI for
Industrial projects and the PDRI for Building Project end up with a minimum
definition level 1 of 70 points when all the elements were added. That means a
project that it completely defined would have a PDRI score of 70. This number
had been used by industry professionals already familiar with the PDRI tool.
Consequently RT 268 decided that a minimum score for the PDRI for
Infrastructure would be 70. This benchmark was used for the level 1 element data
just as the 1000 mark was used in normalizing the data for the definition level 5.
5.3.2. Preliminary PDRI Element Weights
When all the calculations for normalization had been completed the 64
contributors could then be used to provide an average element weight. First the
definition level 5 contributions from all the participants were averaged for each
element. This gives a scale of relative importance for each of the 68 elements.
Because of round error the averages do not add to the desired 1000 point max for
level 5. Once again the data is normalized by dividing the sum of the average

66
element weights into 1000. This determines the normalized multiplier. Each
average element weight can then be multiplied by this multiplier. That leaves 68
elements that add to 1000 points for definition level 5. The process is used for
definition level 1 with a target minimum of 70 points.
For responses on certain elements that included a response of NA (or not
applicable) on the scorecard the sum of their data sets was divided by 64 less the
number of N/A responses. For example element L.1 had 4 participants that
responded N/A for that element on their level 5 definition. The project they were
considering did not have “Right of Way and Utility Cost Estimates”. The sum of
the normalized level 5 weights was divided by 60 (64 participants – 4 NA
responses = 60 computable responses). This process was used to differentiate the
NA responses from a response of 0.
5.3.3 Screening the Data using Boxplots
After the definition levels from the participants’ surveys were normalized,
the descriptive statistics for each element were run using SPSS to analyze the
mean, median, standard deviation, variance and skewness. Further analysis of the
data revealed that several of the elements were either moderately or highly
skewed. This meant that for certain elements the responses from participants were
skewing the data.
In order to determine the mean weights for the elements, the author
wanted to get the data as close to a normal distribution as possible. Boxplots were
created to analyze the outliers and extremes and to determine if there were certain
data sets, or participants that were regularly skewing the data. Boxplots were
67
created for all 68 elements yielding the median and interquartile as well as
outliers and extremes. These box plots are given in Appendix C.
When all of the outliers and extremes were determined, further analysis
was done to discover frequent contributors to outliers and extremes. Each
participant was assigned a contribution score calculated as:
Contribution Score = 3 * (No. of Extremes) + 1 * (No. of Outliers)
The scores were compiled into a table and participants were listed in
descending order by their contribution scores. This data made it obvious that
some of the data sets were skewing the means on several of the elements. This
information was presented to the research team, as well as some options for
dealing with these outliers and extremes. The first option was to decide the
outliers and extremes were still valid data points and use all data sets and points to
determine the element weights. The second option was to throw out entire data
sets, or participants, who had a contribution score that was determined “too high”
by the research team. A third option was to keep all the data sets but to throw out
only data points that were outliers and extremes on any given element. This would
have kept all the participants information but thrown out only their inputs that
were calculated as outliers and extremes. The fourth was a combination of options
2 and 3 and was to throw out the entire data sets for those whose contribution
score was determined to be “too high,” similar to option two, but then to also
throw out any remaining outliers and extremes on individual elements, similar to

68
option 3. This would have meant that only a few participants’ data would have
been discarded entirely and the rest of the participants would have only had
certain data points thrown out on certain elements. The fifth and final option
given to the research team was to discard only those data points that were
calculated as extremes and to leave in those calculated as outliers.
The team chose to go with option two of throwing out entire data sets from
participants whose contribution score was too high. The team chose “too high” to
mean a score of 9 or above. This decision was made based on the fact that there
was a large difference in the number of participants who contribution score was 9
and those whose score was 7, as can be seen in Table 5.2. This was a logical break
in the data set The team decided there were too many data sets with a contribution
score of 7 to discard all. More importantly, this decision was made due to the
nature of the projects of some of the participants with a high contribution score.
Some of these projects had unique characteristics that required abnormally large
amounts of contingency to be dedicated to certain elements that was atypical of
the industry. Five sets of data were discarded and a total of 59 scorecards were
used to determine the element weights.

69
Table 5.2 Contributions to Outliers & Extremes by Participant
Participant Contributions
(Outliers & Extremes)
Participant Contributions
(Outliers & Extremes)
Participant Contributions
(Outliers & Extremes)
L05 14 LA08 4 H08 1 NY04 11 W02 4 H13 1 W15 10 W07 4 L01 1 L08 9 W09 4 L10 1 W10 9 W13 4 LA07 1 H07 7 H11 3 LA09 1 L07 7 L13 3 NY08 1
LA03 7 LA04 3 W04 1 LA06 7 W01 3 W05 1 NY02 7 W03 3 H02 0 W14 7 L03 2 H05 0 L06 6 L09 2 H09 0 L12 6 L11 2 H12 0 L14 6 L15 2 LA05 0 H03 5 LA02 2 NY07 0 H04 5 NY01 2 NY09 0 L02 5 NY05 2 W06 0 L04 5 NY06 2 W11 0
NY03 5 NY10 2 W12 0 W08 5 NY11 2 W16 0 H10 4 H01 1 - -
LA01 4 H06 1 - - LA - Los Angeles, NY - New York, H - Houston, W - Washington DC, L - London
5.3.4. Element Mean Weights for Definition Level 5 and 1
After the data screening and Boxplot analysis was complete a final score
for both definition level 1 and definition level 5 were determined for each
element. The same procedure as discussed earlier for normalization of data was
used with these new weights. The individual elements were averaged and then the
sum of all the weights divided into 1000. This results in a multiplier that when
multiplied by the final average element weight, gives the final PDRI element
score for level 5. The same process was repeated for level one.
70
One significant part of the finalizing all the numbers was the use of
rounding. For the most part numbers were round using common rounding rules of
.50 and above being rounded up and .49 and below being rounded down. As the
sum of the level 5 elements had to equal 1000 some element weights were either
rounded up or down based on their comparison to the other numbers. For example
if the elements scores were adding up to 999 using common rounding practices,
and an the element B.2 was the closest to .50 having an unrounded score of 6.48 it
was rounded up to 7 making the max score 1000.
It should not be implied that the numbers are precise to that degree. The
PDRI score is an estimate of project definition. A project with a score of 285 as
not necessarily more well defined then a project with a PDRI score of 275. The
PDRI is not intended for that purpose, as it is intended to identify gaps in
knowledge and force action. Users are advised to use caution with the numbers.
5.3.5. Interpolating the Weights for Definition Level 2, 3, and 4
With the level 1 and level 5 weights completed it was now time to
compute the level 2, 3 and 4 weights. This was accomplished using a basic
interpolation of the data. The weights were computed as follows:
Level 2 Weight = ((level 5 Weight – Level 1 Weight)/4 + level 1 weight
Level 3 Weight = ((level 5 Weight – Level 1 Weight)/4 + level 2 weight
Level 4 Weight = ((level 5 Weight – Level 1 Weight)/4 + level 3 weight

71
This represents a direct linear interpolation of data. The results after
completion of the level 1 and 5 weights together with the interpolation of the level
2, 3and 4 weights is a final weighted PDRI scorecard. Table 5.3 shows the results
of the interpolation of the level 1 – level 5 element weights.
Table 5.3 Results of Interpolation of Level 1 – Level 5 Weights
Elements CategoriesSections
1 2 3 4 5 El Cat Sec
1 2 3 4 5 E l Cat Sec
1 2 3 4 5
A . 1 2 13 24 35 44 F.1 2 7 12 17 21 J . 1 1 4 7 10 1 4
A . 2 1 8 15 22 28 F.2 1 4 7 10 13 J . 2 1 5 9 13 1 5
A . 3 1 6 11 16 19 F.3 1 4 7 10 14 J . 3 1 4 7 10 1 2
A . 4 1 6 11 16 21 F.4 1 5 9 13 15 J . 4 1 3 5 7 1 0
A Totals 5 33 61 89 112 F.5 1 5 9 13 18 J . 5 1 3 5 7 9
B . 1 2 7 12 17 22 F.6 1 4 7 10 14 J 5 19 33 47 6 0
B . 2 1 5 9 13 16 F.7 0 3 5 7 10 K . 1 1 5 9 13 1 5
B . 3 1 4 7 10 12 F.8 1 4 7 10 14 K . 2 1 4 7 10 1 3
B . 4 1 5 9 13 17 F 8 36 63 90 119 K . 3 1 4 7 10 1 1
B Totals 5 21 37 53 67 G.1 1 4 7 10 13 K . 4 0 2 4 6 8
C . 1 1 6 11 16 21 G.2 1 4 7 10 13 K 3 15 27 39 4 7
C . 2 2 8 14 20 22 G.3 1 4 7 10 11 L . 1 1 3 5 7 1 0
C . 3 2 8 14 20 27 G.4 1 3 5 7 10 L . 2 2 8 14 20 2 5
C Totals 5 22 39 56 70 G 4 15 26 37 47 L . 3 1 5 9 13 1 5
D . 1 1 6 11 16 19 H.1 1 4 7 10 11 L . 4 1 5 9 13 1 7
D . 2 1 6 11 16 19 H.2 1 3 5 7 9 L . 5 1 4 7 10 1 3
D . 3 1 6 11 16 22 H.3 1 3 5 7 7 L 6 25 44 63 8 0
D . 4 1 6 11 16 22 H.4 1 4 7 10 11 M.1 1 4 7 10 1 2
D . 5 1 5 9 13 18 H.5 1 3 5 7 9 M.2 1 3 5 7 1 0
D . 6 1 4 7 10 11 H 5 17 29 41 47 M.3 1 3 5 7 9
D . 7 1 6 11 16 19 I.1 1 6 11 16 22 M.4 0 3 5 7 7
D . 8 1 4 7 10 13 I.2 1 4 7 10 12 M.5 1 4 7 10 1 4
D Totals 8 43 78 113 143 I.3 1 5 9 13 15 M.6 1 4 7 10 1 3
E . 1 1 3 5 7 10 I.4 1 3 5 7 10 M.7 1 3 5 7 9
E . 2 0 3 6 9 11 I.5 1 3 5 7 10 M.8 1 3 5 7 9
E . 3 1 3 5 7 9 I.6 1 4 7 10 11 M 7 27 46 65 8 3
E . 4 1 5 9 13 15 I 6 25 44 63 80 I I I 21 86 150 214 270
E Totals 3 14 25 36 45 Sec II 23 93 162 231 293 PDRI 70 312 552 792 1000
S E C I TOTAL 26 133 240 347 437
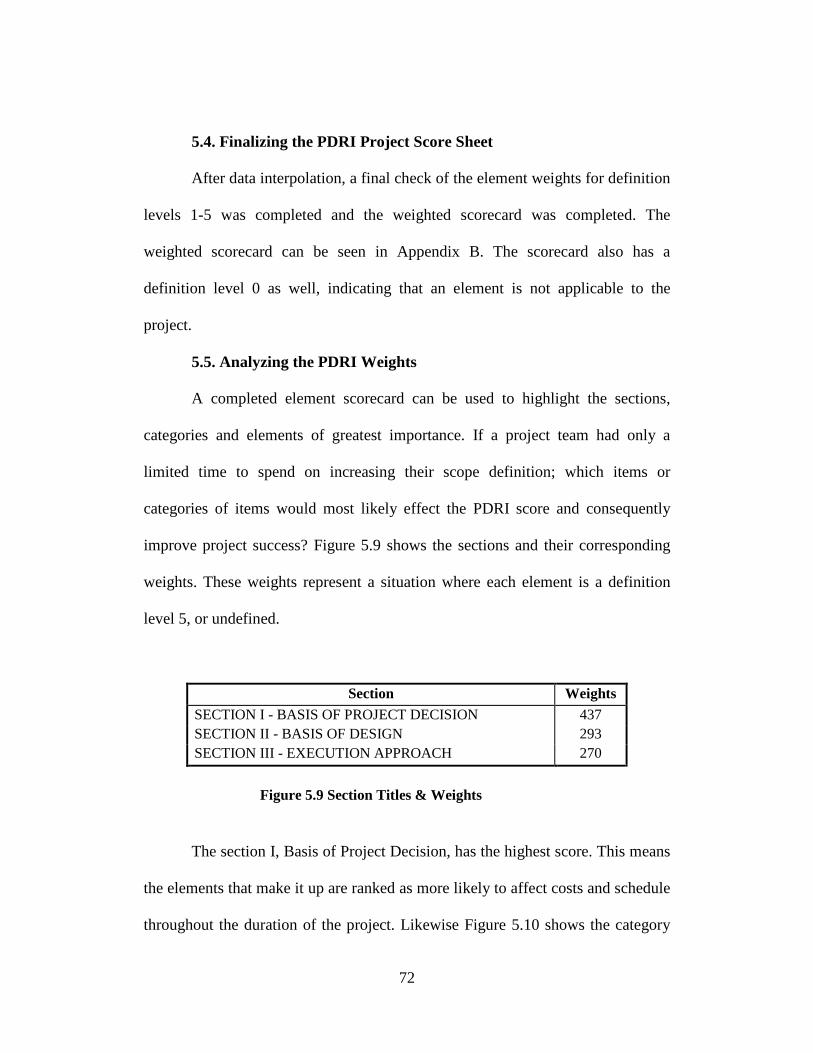
72
5.4. Finalizing the PDRI Project Score Sheet
After data interpolation, a final check of the element weights for definition
levels 1-5 was completed and the weighted scorecard was completed. The
weighted scorecard can be seen in Appendix B. The scorecard also has a
definition level 0 as well, indicating that an element is not applicable to the
project.
5.5. Analyzing the PDRI Weights
A completed element scorecard can be used to highlight the sections,
categories and elements of greatest importance. If a project team had only a
limited time to spend on increasing their scope definition; which items or
categories of items would most likely effect the PDRI score and consequently
improve project success? Figure 5.9 shows the sections and their corresponding
weights. These weights represent a situation where each element is a definition
level 5, or undefined.
Section Weights SECTION I - BASIS OF PROJECT DECISION 437 SECTION II - BASIS OF DESIGN 293 SECTION III - EXECUTION APPROACH 270
Figure 5.9 Section Titles & Weights
The section I, Basis of Project Decision, has the highest score. This means
the elements that make it up are ranked as more likely to affect costs and schedule
throughout the duration of the project. Likewise Figure 5.10 shows the category
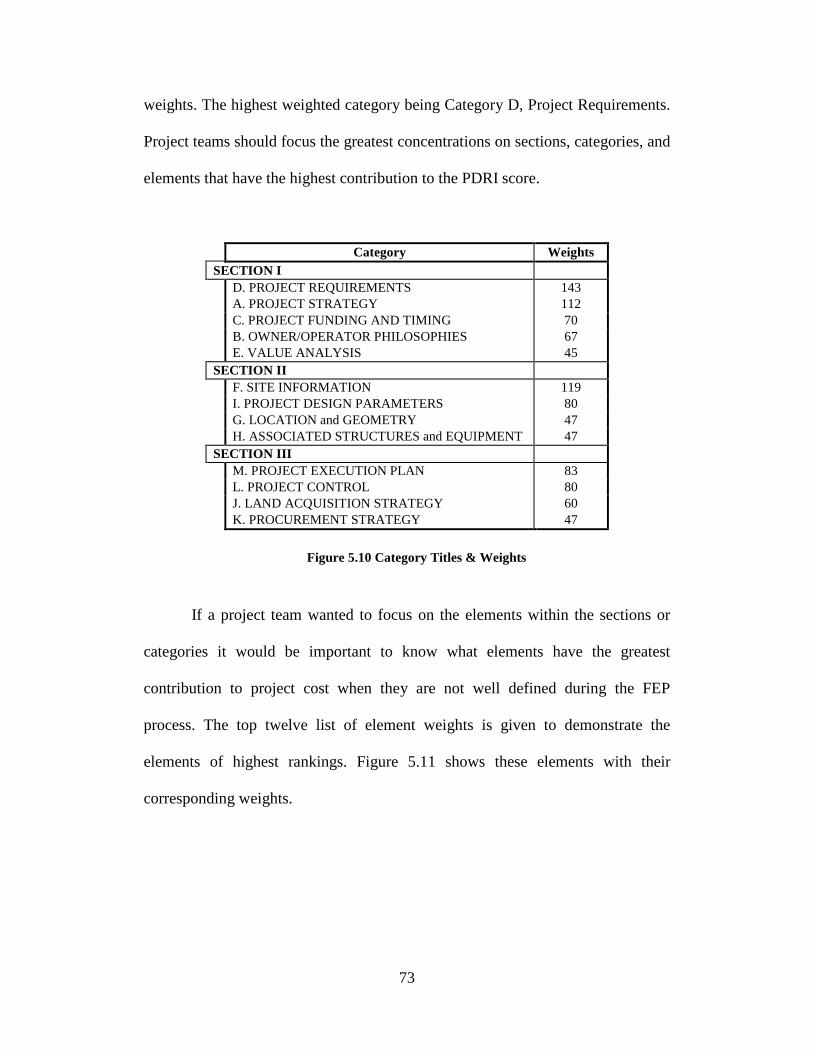
73
weights. The highest weighted category being Category D, Project Requirements.
Project teams should focus the greatest concentrations on sections, categories, and
elements that have the highest contribution to the PDRI score.
Category Weights SECTION I D. PROJECT REQUIREMENTS 143 A. PROJECT STRATEGY 112 C. PROJECT FUNDING AND TIMING 70 B. OWNER/OPERATOR PHILOSOPHIES 67 E. VALUE ANALYSIS 45
SECTION II F. SITE INFORMATION 119 I. PROJECT DESIGN PARAMETERS 80 G. LOCATION and GEOMETRY 47 H. ASSOCIATED STRUCTURES and EQUIPMENT 47
SECTION III M. PROJECT EXECUTION PLAN 83 L. PROJECT CONTROL 80 J. LAND ACQUISITION STRATEGY 60 K. PROCUREMENT STRATEGY 47
Figure 5.10 Category Titles & Weights
If a project team wanted to focus on the elements within the sections or
categories it would be important to know what elements have the greatest
contribution to project cost when they are not well defined during the FEP
process. The top twelve list of element weights is given to demonstrate the
elements of highest rankings. Figure 5.11 shows these elements with their
corresponding weights.
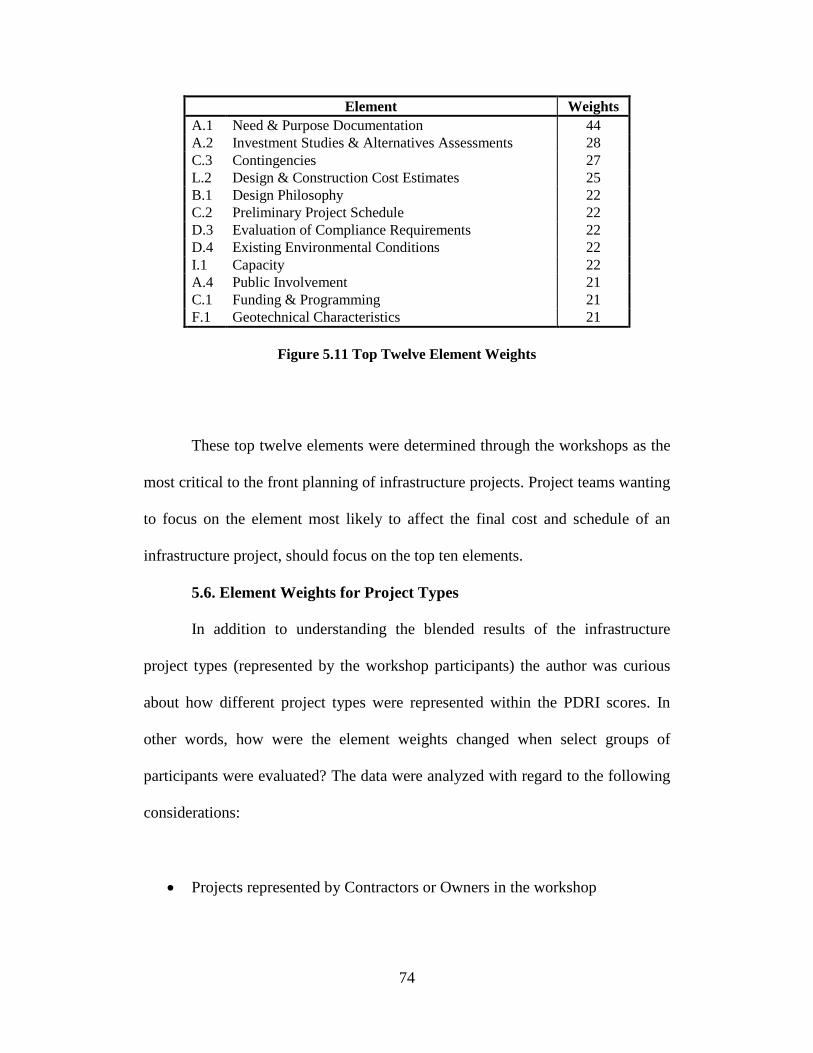
74
Element Weights A.1 Need & Purpose Documentation 44 A.2 Investment Studies & Alternatives Assessments 28 C.3 Contingencies 27 L.2 Design & Construction Cost Estimates 25 B.1 Design Philosophy 22 C.2 Preliminary Project Schedule 22 D.3 Evaluation of Compliance Requirements 22 D.4 Existing Environmental Conditions 22 I.1 Capacity 22 A.4 Public Involvement 21 C.1 Funding & Programming 21 F.1 Geotechnical Characteristics 21
Figure 5.11 Top Twelve Element Weights
These top twelve elements were determined through the workshops as the
most critical to the front planning of infrastructure projects. Project teams wanting
to focus on the element most likely to affect the final cost and schedule of an
infrastructure project, should focus on the top ten elements.
5.6. Element Weights for Project Types
In addition to understanding the blended results of the infrastructure
project types (represented by the workshop participants) the author was curious
about how different project types were represented within the PDRI scores. In
other words, how were the element weights changed when select groups of
participants were evaluated? The data were analyzed with regard to the following
considerations:
• Projects represented by Contractors or Owners in the workshop
75
• Did the projects deal with People and Freight, Fluids, or Energy, as
described by the workshop participants
• Did the project have significant right of way issues
These consideration were analyzed and the next section reports the
conclusions for the analysis the following figures show the results of the data as
they pertain to certain types of projects
5.6.1. Comparison of Owners and Contractors
Of the 64 workshop participants 37 were contractors and 27 were owners.
The elements weights that were reported for each element were analyzed by the
author to see if there were any significant differences between the two data sets.
Although there were differences in the ranking of the elements, in general the
element weights for contractors and owners was very similar. Some issues
weighted with greater importance to owners were; Need and Purpose
Documentation, and Design and Construction Cost Estimates. It comes as no
surprise that owners would rank these two elements highest. Contractors from the
workshops gave higher weights to the elements of Funding and Programming as
well as Existing Environmental Conditions. The rankings of these elements show
that contractors feel that these elements need to be well defined in order to
mitigate future risks and project unknowns. The difference in data is not enough
to warrant the creation of separate PDRI tool to analyze a project, but the element
rankings are helpful in provided added focus or perspective to the element
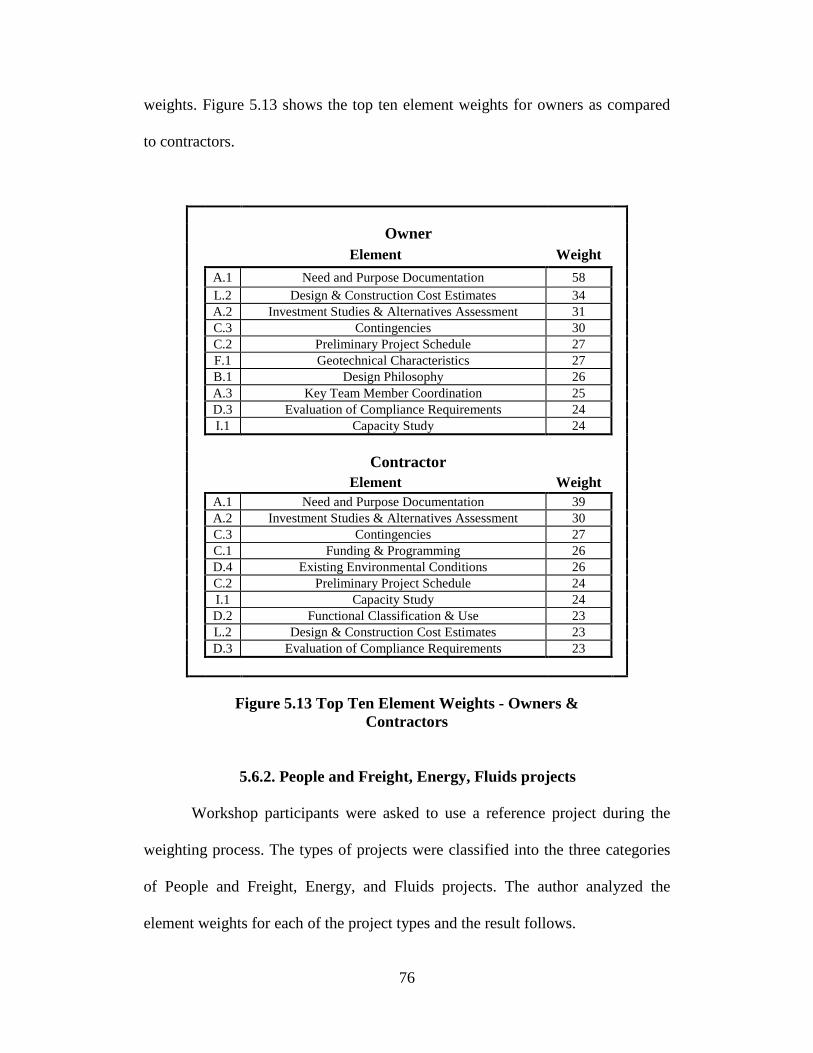
76
weights. Figure 5.13 shows the top ten element weights for owners as compared
to contractors.
Owner
Element Weight
A.1 Need and Purpose Documentation 58 L.2 Design & Construction Cost Estimates 34 A.2 Investment Studies & Alternatives Assessment 31 C.3 Contingencies 30 C.2 Preliminary Project Schedule 27 F.1 Geotechnical Characteristics 27 B.1 Design Philosophy 26 A.3 Key Team Member Coordination 25 D.3 Evaluation of Compliance Requirements 24 I.1 Capacity Study 24 Contractor
Element Weight
A.1 Need and Purpose Documentation 39 A.2 Investment Studies & Alternatives Assessment 30 C.3 Contingencies 27 C.1 Funding & Programming 26 D.4 Existing Environmental Conditions 26 C.2 Preliminary Project Schedule 24 I.1 Capacity Study 24 D.2 Functional Classification & Use 23 L.2 Design & Construction Cost Estimates 23 D.3 Evaluation of Compliance Requirements 23
Figure 5.13 Top Ten Element Weights - Owners & Contractors
5.6.2. People and Freight, Energy, Fluids projects
Workshop participants were asked to use a reference project during the
weighting process. The types of projects were classified into the three categories
of People and Freight, Energy, and Fluids projects. The author analyzed the
element weights for each of the project types and the result follows.

77
Similarly to the projects representing owners and contractors, the element
weights given to the three types of projects were very much alike, and matched
fairly closely with the blended element weights. This demonstrates the
applicability to infrastructure projects in general and lessens the need for a
separate PDRI tool to address each type of project. The author does note however
that there is a difference in the elements weights and therefore a difference in
priority among the three project types.
The 28 Projects represented by the workshop participants that involved
people and freight gave greater importance to element of Funding and
Programming; ranking this element as number one. The other two projects types
did not rank this element among their top ten. Both the elements; Existing
Environmental Conditions, and Environmental Documentation were ranked
highly by participants referencing people and fright projects, this demonstrates
the high priority these type of projects place on environmental impact and the
risks it presents. Table 5.4 shows the top ten elements for people and freight
projects.
Table 5.4 Top Ten Element Weights: People and Freight Projects
Element Weight C.1 Funding & Programming 34 A.1 Need and Purpose Documentation 33 A.2 Investment Studies & Alternatives Assessment 30 C.3 Contingencies 29 L.2 Design & Construction Cost Estimates 29 D.4 Existing Environmental Conditions 28 C.2 Preliminary Project Schedule 25 D.3 Evaluation of Compliance Requirements 23 A.4 Public Involvement 22 F.5 Environmental Documentation 22
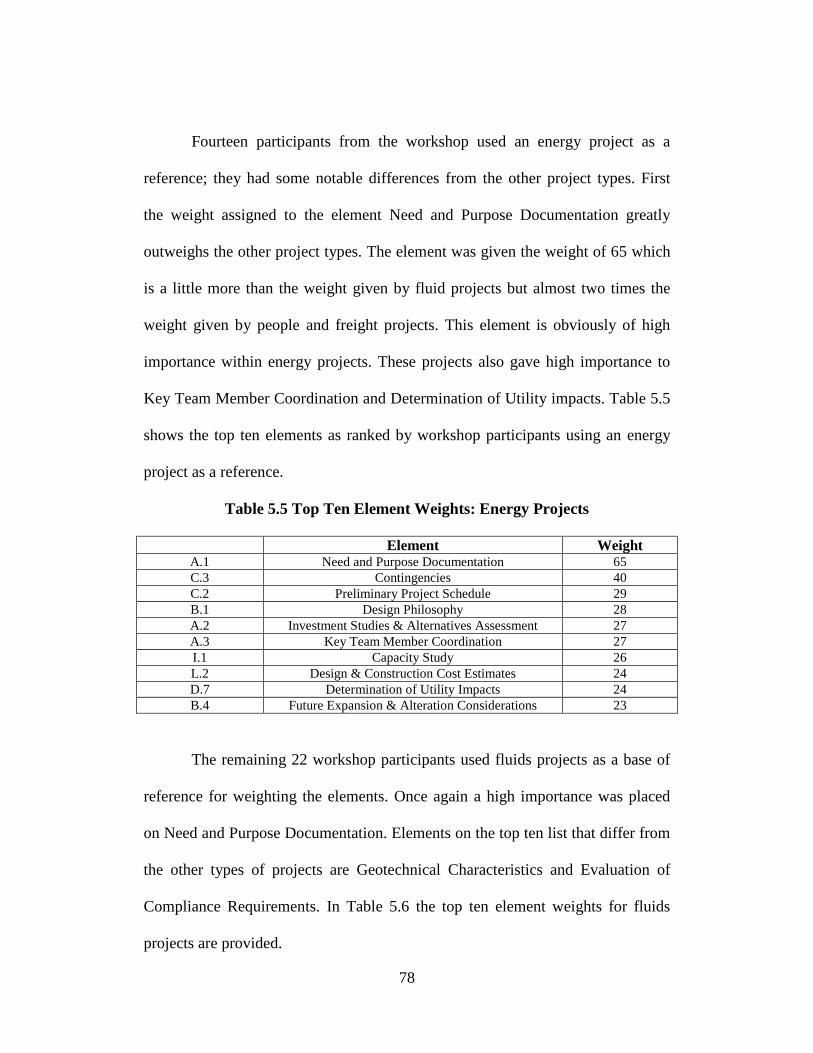
78
Fourteen participants from the workshop used an energy project as a
reference; they had some notable differences from the other project types. First
the weight assigned to the element Need and Purpose Documentation greatly
outweighs the other project types. The element was given the weight of 65 which
is a little more than the weight given by fluid projects but almost two times the
weight given by people and freight projects. This element is obviously of high
importance within energy projects. These projects also gave high importance to
Key Team Member Coordination and Determination of Utility impacts. Table 5.5
shows the top ten elements as ranked by workshop participants using an energy
project as a reference.
Table 5.5 Top Ten Element Weights: Energy Projects
Element Weight A.1 Need and Purpose Documentation 65 C.3 Contingencies 40 C.2 Preliminary Project Schedule 29 B.1 Design Philosophy 28 A.2 Investment Studies & Alternatives Assessment 27 A.3 Key Team Member Coordination 27 I.1 Capacity Study 26 L.2 Design & Construction Cost Estimates 24 D.7 Determination of Utility Impacts 24 B.4 Future Expansion & Alteration Considerations 23
The remaining 22 workshop participants used fluids projects as a base of
reference for weighting the elements. Once again a high importance was placed
on Need and Purpose Documentation. Elements on the top ten list that differ from
the other types of projects are Geotechnical Characteristics and Evaluation of
Compliance Requirements. In Table 5.6 the top ten element weights for fluids
projects are provided.

79
Table 5.6 Top Ten Element Weights: Fluid Projects
Element Weight A.1 Need and Purpose Documentation 53 A.2 Investment Studies & Alternatives Assessment 33 F.1 Geotechnical Characteristics 30 L.2 Design & Construction Cost Estimates 28 I.1 Capacity Study 26 B.1 Design Philosophy 25 D.3 Evaluation of Compliance Requirements 25 C.2 Preliminary Project Schedule 23 A.4 Public Involvement 21 D.2 Functional Classification & Use 21
The author notes that the differences between each project type seem very
logical when the nature and requirements of the project type are considered. It
would be beneficial to users of the PDRI to be aware of the element ranking
specific to their project type and remember that additional focus should be given
to elements of greater weight within their project type.
5.6.3. Comparison of Right of Way Projects
The last type of comparison performed by the author was a look at
projects that represented significant right of way issues. Thirty one of the 64
projects used as reference during the weighting workshops reported right of way
issues. Once again the author points out the high importance given to Need and
Purpose Documentation. Interestingly, the elements involved in right of way or
land acquisition did not rank any higher among the projects representing
significant right of way issues. The author performed this analysis to specifically
study that difference and no notable difference was discovered. Table 5.7. shows
the top 10 elements for project involving in right of way.
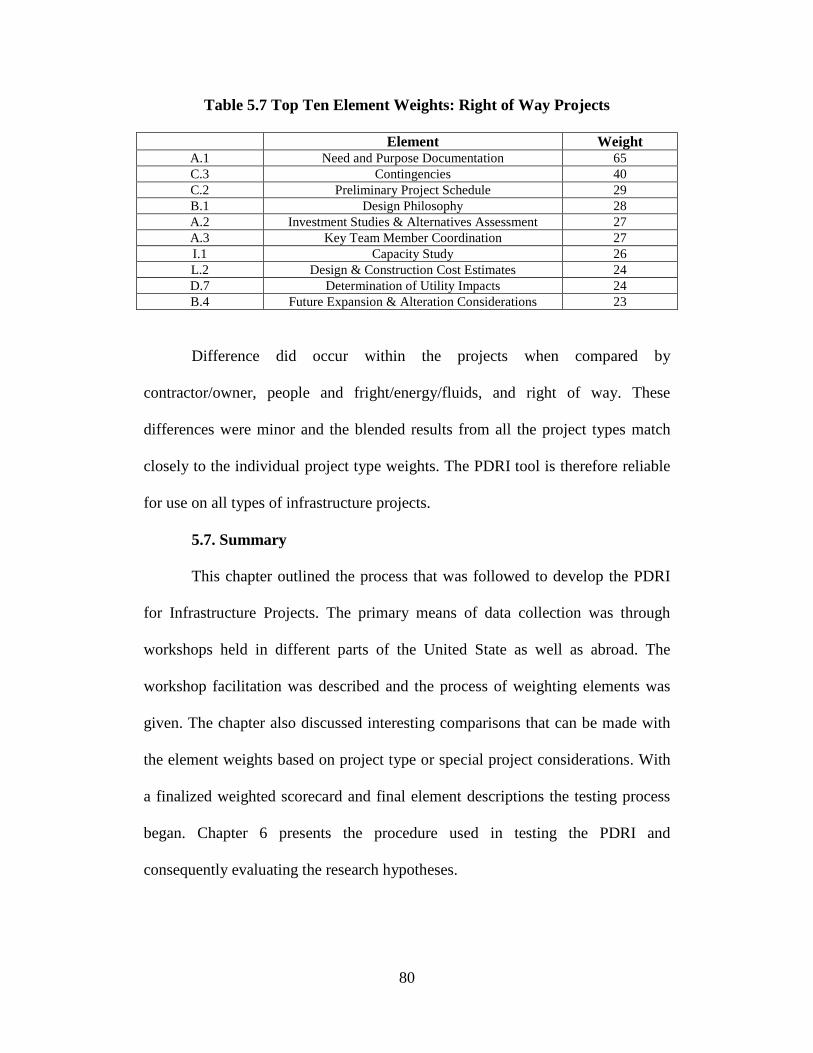
80
Table 5.7 Top Ten Element Weights: Right of Way Projects
Element Weight A.1 Need and Purpose Documentation 65 C.3 Contingencies 40 C.2 Preliminary Project Schedule 29 B.1 Design Philosophy 28 A.2 Investment Studies & Alternatives Assessment 27 A.3 Key Team Member Coordination 27 I.1 Capacity Study 26 L.2 Design & Construction Cost Estimates 24 D.7 Determination of Utility Impacts 24 B.4 Future Expansion & Alteration Considerations 23
Difference did occur within the projects when compared by
contractor/owner, people and fright/energy/fluids, and right of way. These
differences were minor and the blended results from all the project types match
closely to the individual project type weights. The PDRI tool is therefore reliable
for use on all types of infrastructure projects.
5.7. Summary
This chapter outlined the process that was followed to develop the PDRI
for Infrastructure Projects. The primary means of data collection was through
workshops held in different parts of the United State as well as abroad. The
workshop facilitation was described and the process of weighting elements was
given. The chapter also discussed interesting comparisons that can be made with
the element weights based on project type or special project considerations. With
a finalized weighted scorecard and final element descriptions the testing process
began. Chapter 6 presents the procedure used in testing the PDRI and
consequently evaluating the research hypotheses.

81
Chapter 6: PDRI TESTING
This chapter provides the testing information collected on the PDRI for
Infrastructure Projects in an effort to prove its ability to predict project success.
This testing has been performed using projects that have been completed. Testing
continues to take place on projects that are currently in process. Because the
testing of the PDRI for Infrastructure Projects using in process projects is still
underway, not all data collected from these projects is reported in this thesis.
Testing data on those projects is still being completed and will be reported in of
future CII research. This chapter deals primarily with the testing process followed
on completed infrastructure projects. The chapter explains the completed project
questionnaire, provide a summary of the focus projects, and provide supporting
statistical data and conclusion made from a detailed analysis of the project
information.
6.1. Testing Project Domain
The expertise of the many workshop participants was invaluable in
developing the element weights and helping compile a complete list of element
description. It is the objective of the author to prove that the tool is an actual
indicator for project success. In order to validate the PDRI tool it would be
necessary to test it out on actual projects. Projects were selected from volunteers
highly involved in the planning and construction phases for varies infrastructure
projects. The projects that were used in the testing process had to meet certain
requirements. The projects were to be a completed infrastructure project with an
operation period of six months or longer. The projects would represent a greater
82
than $5 million USD total project cost (or comparable currency). Additionally the
project needed to be completed within the past three years. Contributors were
asked to provide projects that were both “successful” and “unsuccessful” projects
for a better analysis.
6.2. Validation Questionnaire
The primary means of collecting data was through a questionnaire sent out
through email. When a project was volunteered and if it met the minimum
requirements for consideration a questionnaire was mailed to the construction
manager, owner, or company representative familiar enough with the project to be
able provide detailed information about the project’s costs, duration, change
orders and other important information.
The survey or questionnaire was intended to gather information about the
projects being analyzed, each of the questions together with the summary of the
projects response is provided in the next few sections. Along with the
questionnaire the evaluators were given a PDRI scorecard (unweighted) along
with the element descriptions. They were given an unweighted scorecard so that
there would be no bias in the evaluation of each element. This completed project
questionnaire can be seen as Appendix F. More information regarding the projects
used in the testing of the PDRI can also be found there. Evaluators were given
instruction on how to fill out the questionnaire as well as instruction on how to
complete the scorecard. These are the instruction they were given:
83
Assume that your team is in the beginning stages of developing construction documents for your project. You have an understanding of your feasibility, concept and detailed scope. At this stage in the construction progress you have a certain level of “scope definition”. Using the list of sixty-eight elements that have been defined in the document entitled “Description of the PDRI Elements,” please mark the level of definition your chosen project had for each element. The levels of definition that will be used for evaluating each element range from one to five and are defined as follows:
1 = Complete Definition 2 = Minor Deficiencies 3 = Some Deficiencies 4 = Major Deficiencies 5 = Incomplete or Poor Definition
Consider each element individually. If the element is not applicable to your project check "n/a" and do not rate the element. NOTE: If you don't feel confident, but feel it was applicable just use your best judgment relying on your general knowledge base--don't check N/A. An example of how to complete the scorecard is given below:
Example
Completed project was the construction of Interstate 7. After completing
the feasibility, concept, and detailed scope phases, and before beginning
design and construction, I felt like the Project Objectives Statement
(D.1) for my project was poorly defined. For this purpose I checked
level 5 “Incomplete or Poor Definition” (complete a similar evaluation
for all 68 elements)

84
Table 6.1 Example Scoring
CATEGORY n/a 1 2 3 4 5 Element
D. SITE INFORMATION
D1. Project Objectives Statement X
6.3. Sample Project Selection
The sample projects used in the testing process came from four main
sources; workshop participants, members of the Research Team 268,
benchmarking data, and special industry contacts. In all 22 projects were
collected. Although the research team was hoping for more sample projects, the
project data that was provided represents a significant amount of capital. Also a
significant portion of the projects were international infrastructure projects which
were welcomed by the author.
6.3.1. Sample Characteristics
The completed projects evaluated represented a total cost of just over $6
billion dollars worth of capital investments. The in-process projects currently
being evaluated represent an additional $2 billion. With only 22 completed
projects represented it is easy to conclude that these projects and often
infrastructure projects in general, represent a great deal of capital. The largest
project evaluated was just over $ 2 billion dollars. Fourteen different
organizations participated in the contribution of projects. The list of participating
organizations can be found in Appendix A.
n/a = not applicable to this project (see note above) 0 = Not Applicable 2 = Minor Deficiencies 4 = Major Deficiencies 1 = Complete Definition 3 = Some Deficiencies 5 = Incomplete or Poor Definition
85
The three types of infrastructure projects were also represented within the
projects; people and freight, fluids, and energy projects. Twelve projects were
people and freight projects, four were energy projects, and six were fluids
projects.
Three of the projects were renovation projects; the other 19 represent new
construction. Nine of the projects were Design-Bid contracts, one was a CM at
risk, another was a Cost Plus contract. The remaining eleven projects were
Design-Bid-Build contracts. Six of the projects encountered significant right of
way issues.
6.4. Questionnaire Responses and Analyses
Using the un-weighted scorecards, each respondent indicated a level of
definition for each of the elements. These levels of definition return a PDRI score
for each project. The PDRI scores for the projects ranged from 71 to 405, with an
average score of 190. The purpose of the collection of data was to prove the
hypothesis that the PDRI score would indicate a projects subsequent degree of
success or failure. As describe previously in this report, success could be
measured in terms of overruns in cost, overruns in schedule, and the amount of
capital needed for changes in the form of change orders. The data collected from
participants was compared against selected segregated PDRI average scores. This
procedure is discussed in depth in this next section.
6.5. Selecting a PDRI Score Cutoff
The author analyzed different levels of PDRI scores to select as a cutoff
point in order to compare performance between the two groups. Some options for

86
cutoff points were the 150, 200, and 250 levels. In the end, the team selected the
200 level PDRI score as the cutoff to compare performance for a few reasons.
One reason was based on the number of projects in each group. The 200 level
cutoff point appeared to be the most evenly split between all projects in the
sample with 13 projects below the 200 level and 9 projects above. The second
reason it was selected was the statistical significance found at this level as is
shown later. The final reason the 200 level cutoff was selected was in keeping
with past PDRI projects. Both the Industrial and Building PDRIs used a 200 level
cutoff.
6.6. Project Performance Analyses
Analyses was done using information provided from the completed project
validation questionnaire to test the hypotheses that low PDRI scores or higher
amounts of front-end planning resulted in more successful projects. Information
provided on the questionnaire covered areas such as schedule, cost, change order
performance and overall success ratings. This information was gathered and used
to perform statistical analyses using the methodology discussed in chapter 4.
6.6.1. Schedule Performance
The completed project validation questionnaire contained questions that
allowed the author to determine the projects’ schedule performance. Participants
were asked to give specific information about the projects’ duration such as
planned start and completion dates of construction as well as actual start and
completion dates. This information was used to compile information comparing
the projects’ actual total duration to the planned duration and to calculate the
87
schedule performance for each project. Schedule performance was used to
measure the actual project duration as percentage of the planned duration in order
to determine how much over longer the project took than was initially expected at
the end of the planning process.
Schedule performance was calculated as:
Actual Project Duration – Planned Project Duration Planned Project Duration
Where:
Actual Project Duration = (Actual Date Completed – Actual Date Began)
Planned Project Duration = (Planned Date Completed – Planned Date Began)
After schedule performance was calculated for each project, the
performance measures were averaged for projects with a PDRI score below 200
and those above 200. A considerable difference between the two groups was
noticed when comparing the averages. The 13 projects with a PDRI score less
than 200, on average took 5.4 percent longer than they had initially planned in
terms of schedule, whereas the nine projects with a PDRI score over 200 took
29.2 percent longer than they had initially planned. This is represented in Figure
6.2.

88
Figure 6.2 Average Schedule Performance by PDRI Grouping
Statistical analysis was performed to determine if the difference in
schedule performance between the two groups was statistically significant. An
Independent samples t-test was performed using SPSS which revealed that the
variances could not be assumed equal based on Leven’s Test which gave a p-
value of 0.003. This p-value shows that the variances are significantly different
and therefore the p-value from the t-test for equality is 0.035, which is statistically
significant at the 95 percent confidence interval. This can be seen in Table 6.1
which shows the resulting output from SPSS.
5.4%
29.2%
0.0%
5.0%
10.0%
15.0%
20.0%
25.0%
30.0%
35.0%
Per
cent
Be
hind
Sch
edul
e
< 200 > 200PDRI Score
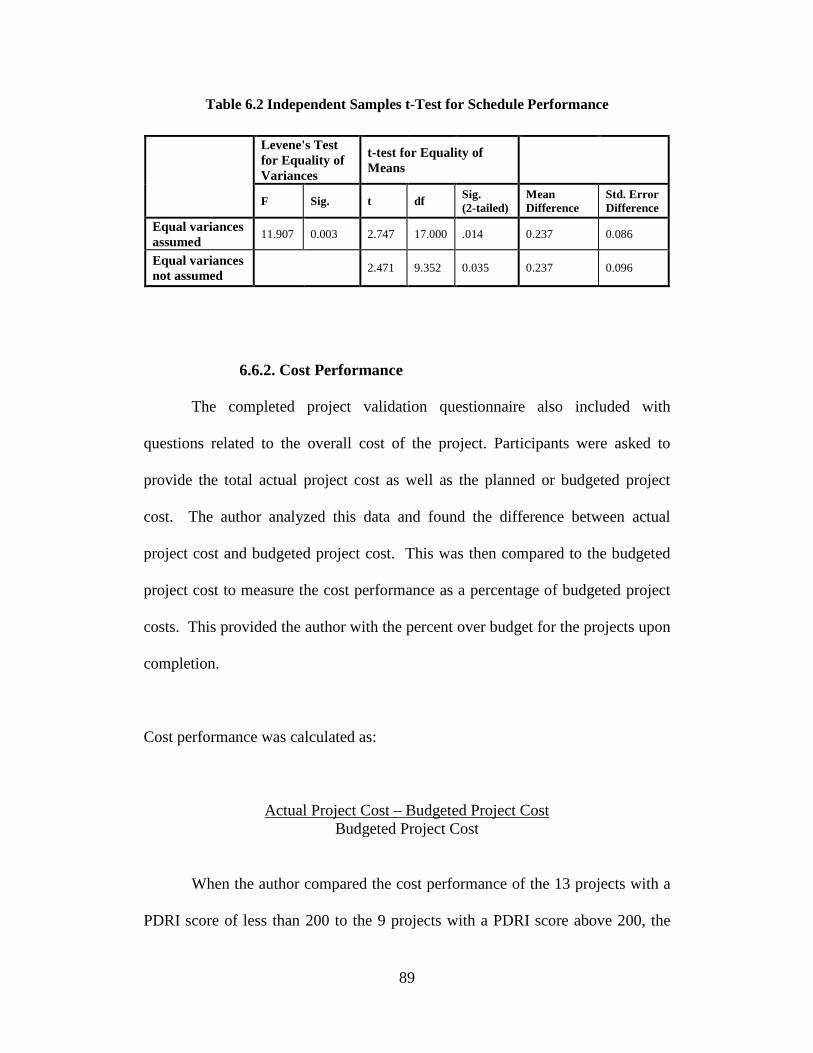
89
Table 6.2 Independent Samples t-Test for Schedule Performance
Levene's Test for Equality of Variances
t-test for Equality of Means
F Sig. t df Sig. (2-tailed)
Mean Difference
Std. Error Difference
Equal variances assumed
11.907 0.003 2.747 17.000 .014 0.237 0.086
Equal variances not assumed
2.471 9.352 0.035 0.237 0.096
6.6.2. Cost Performance
The completed project validation questionnaire also included with
questions related to the overall cost of the project. Participants were asked to
provide the total actual project cost as well as the planned or budgeted project
cost. The author analyzed this data and found the difference between actual
project cost and budgeted project cost. This was then compared to the budgeted
project cost to measure the cost performance as a percentage of budgeted project
costs. This provided the author with the percent over budget for the projects upon
completion.
Cost performance was calculated as:
Actual Project Cost – Budgeted Project Cost Budgeted Project Cost
When the author compared the cost performance of the 13 projects with a
PDRI score of less than 200 to the 9 projects with a PDRI score above 200, the
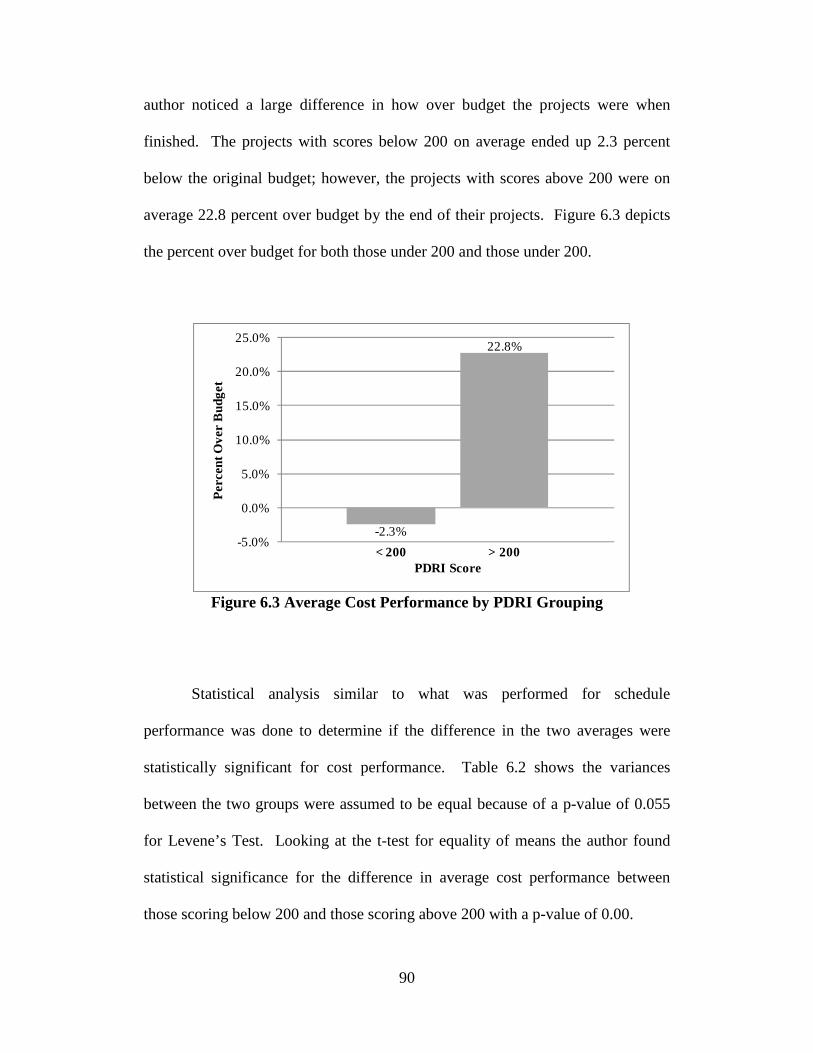
90
author noticed a large difference in how over budget the projects were when
finished. The projects with scores below 200 on average ended up 2.3 percent
below the original budget; however, the projects with scores above 200 were on
average 22.8 percent over budget by the end of their projects. Figure 6.3 depicts
the percent over budget for both those under 200 and those under 200.
Figure 6.3 Average Cost Performance by PDRI Grouping
Statistical analysis similar to what was performed for schedule
performance was done to determine if the difference in the two averages were
statistically significant for cost performance. Table 6.2 shows the variances
between the two groups were assumed to be equal because of a p-value of 0.055
for Levene’s Test. Looking at the t-test for equality of means the author found
statistical significance for the difference in average cost performance between
those scoring below 200 and those scoring above 200 with a p-value of 0.00.
-2.3%
22.8%
-5.0%
0.0%
5.0%
10.0%
15.0%
20.0%
25.0%
Pe
rcen
t Ove
r B
udg
et
< 200 > 200PDRI Score
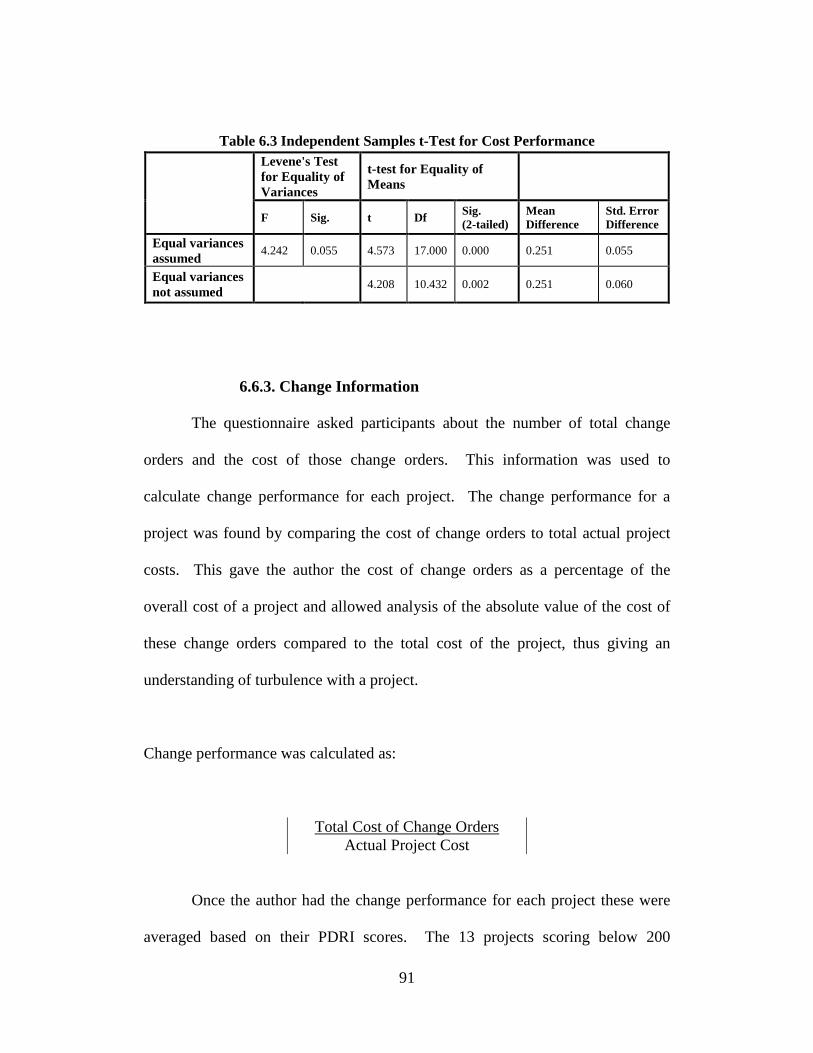
91
Table 6.3 Independent Samples t-Test for Cost Performance
Levene's Test for Equality of Variances
t-test for Equality of Means
F Sig. t Df Sig. (2-tailed)
Mean Difference
Std. Error Difference
Equal variances assumed
4.242 0.055 4.573 17.000 0.000 0.251 0.055
Equal variances not assumed
4.208 10.432 0.002 0.251 0.060
6.6.3. Change Information
The questionnaire asked participants about the number of total change
orders and the cost of those change orders. This information was used to
calculate change performance for each project. The change performance for a
project was found by comparing the cost of change orders to total actual project
costs. This gave the author the cost of change orders as a percentage of the
overall cost of a project and allowed analysis of the absolute value of the cost of
these change orders compared to the total cost of the project, thus giving an
understanding of turbulence with a project.
Change performance was calculated as:
Total Cost of Change Orders Actual Project Cost
Once the author had the change performance for each project these were
averaged based on their PDRI scores. The 13 projects scoring below 200
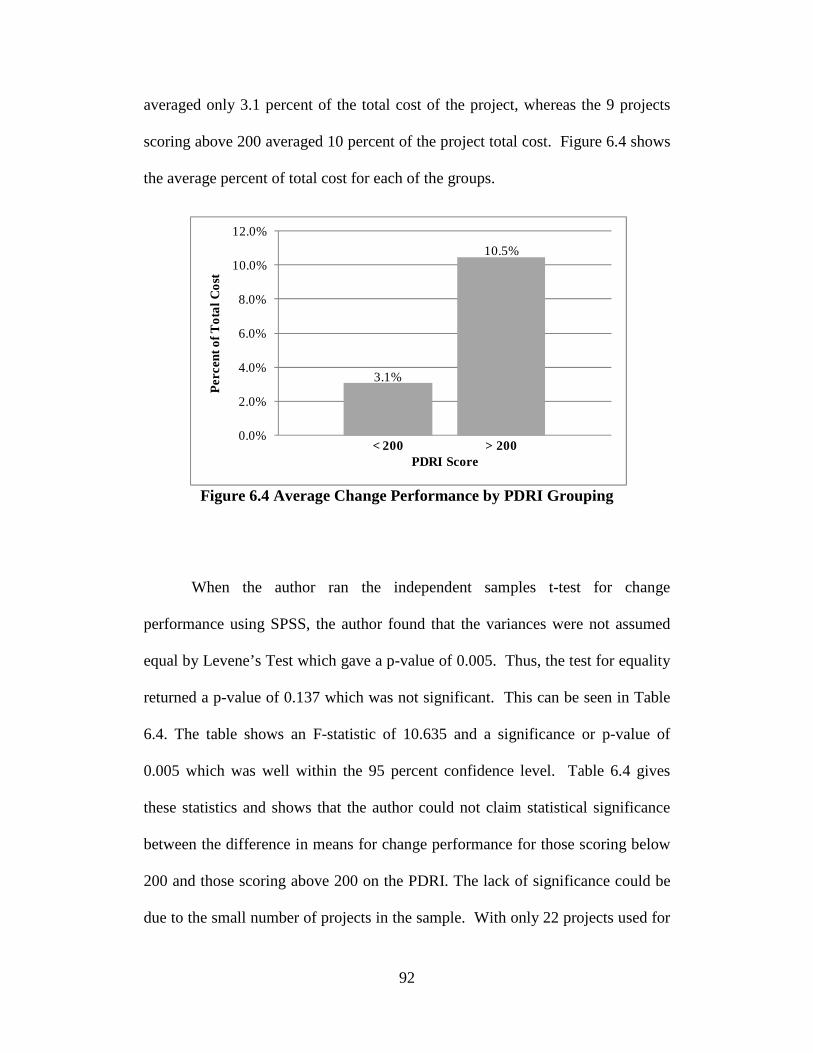
92
averaged only 3.1 percent of the total cost of the project, whereas the 9 projects
scoring above 200 averaged 10 percent of the project total cost. Figure 6.4 shows
the average percent of total cost for each of the groups.
Figure 6.4 Average Change Performance by PDRI Grouping
When the author ran the independent samples t-test for change
performance using SPSS, the author found that the variances were not assumed
equal by Levene’s Test which gave a p-value of 0.005. Thus, the test for equality
returned a p-value of 0.137 which was not significant. This can be seen in Table
6.4. The table shows an F-statistic of 10.635 and a significance or p-value of
0.005 which was well within the 95 percent confidence level. Table 6.4 gives
these statistics and shows that the author could not claim statistical significance
between the difference in means for change performance for those scoring below
200 and those scoring above 200 on the PDRI. The lack of significance could be
due to the small number of projects in the sample. With only 22 projects used for
3.1%
10.5%
0.0%
2.0%
4.0%
6.0%
8.0%
10.0%
12.0%P
erc
ent o
f To
tal C
ost
< 200 > 200PDRI Score

93
the calculations, it is likely that as more projects are added the results may gain
statistical significance.
Table 6.4 Independent Samples t-Test for Change Performance
Levene's Test for Equality of Variances
t-test for Equality of Means
F Sig. t df Sig. (2-tailed)
Mean Difference
Std. Error Difference
Equal variances assumed
10.635 0.005 1.923 17.000 0.071 0.074 0.039
Equal variances not assumed
1.660 7.733 0.137 0.074 0.045
6.6.4. Project Performance Using Regression
Regression analysis was used on the performance measures of schedule,
cost and change versus the PDRI score. An individual graph was completed for
each of these performance measures. Each project’s PDRI score was plotted on
the x-axis with its corresponding performance measure along the y-axis, resulting
in a scatterplot graph as shown in Figures 6.5, 6.6, and 6.7. At this point a
bivariate linear regression was done to fit a trendline through the scatterplot which
gave the resulting equation in the form of Y = b1X + b0 as well as r value and R2
for each performance measure.
6.6.4.1. Regression and Schedule Performance
Figure 6.5 shows the scatterplot, linear regression line, and R2 for schedule
performance. The scatterplot displayed a slight trend upward for projects that

94
took longer than originally planned; however, there were many whose total
project duration was the same as planned giving them a percent over schedule of
zero. The 13 projects reporting an on time completion had a PDRI score of 225
or lower. It did appear that scores above 225 began to increase their percent over
schedule as their PDRI scores increased. The regression gave an equation for the
trendline of Y = 0.001X – 0.0288, which would imply that as a PDRI score
increases by one point the project’s total duration would increase by .1 percent
over what was originally planned. This may seem like an insignificant amount;
however, PDRI scores in the sample ranged from 88 to 405. The equation
suggests that a PDRI score increase of 100 points could result in being 10 percent
over schedule. The R2 was 0.1217 suggesting that 12.17 percent of the variability
in schedule performance is explained by the PDRI score, or more specifically by
the level of front-end planning done. Obviously there are other factors that can
account for being over schedule which would explain a lower R2.
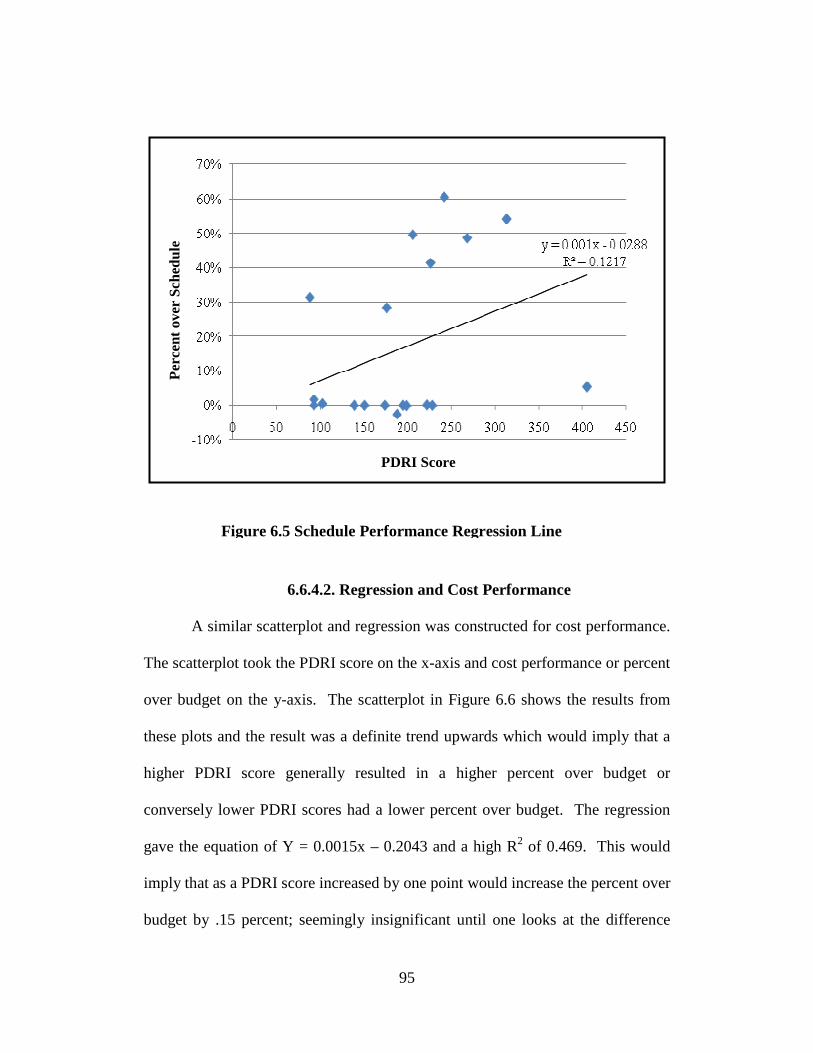
95
6.6.4.2. Regression and Cost Performance
A similar scatterplot and regression was constructed for cost performance.
The scatterplot took the PDRI score on the x-axis and cost performance or percent
over budget on the y-axis. The scatterplot in Figure 6.6 shows the results from
these plots and the result was a definite trend upwards which would imply that a
higher PDRI score generally resulted in a higher percent over budget or
conversely lower PDRI scores had a lower percent over budget. The regression
gave the equation of Y = 0.0015x – 0.2043 and a high R2 of 0.469. This would
imply that as a PDRI score increased by one point would increase the percent over
budget by .15 percent; seemingly insignificant until one looks at the difference
Figure 6.5 Schedule Performance Regression Line
PDRI Score
Per
cent
ove
r S
ched
ule
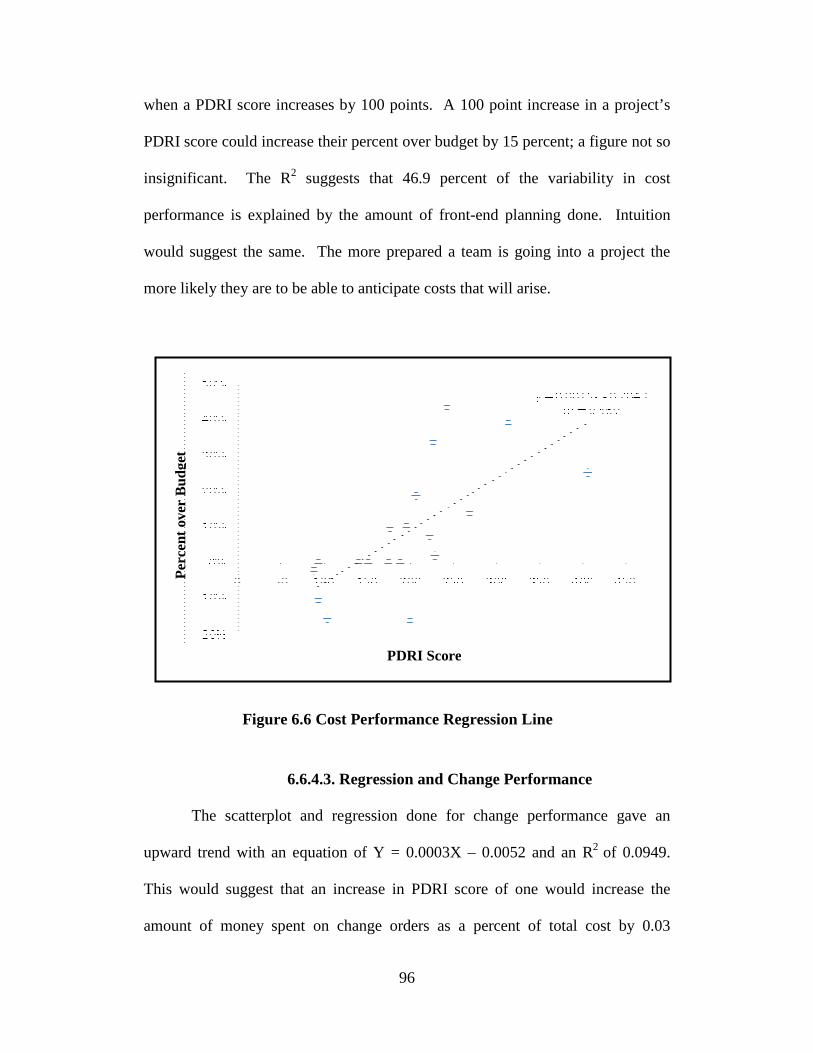
96
when a PDRI score increases by 100 points. A 100 point increase in a project’s
PDRI score could increase their percent over budget by 15 percent; a figure not so
insignificant. The R2 suggests that 46.9 percent of the variability in cost
performance is explained by the amount of front-end planning done. Intuition
would suggest the same. The more prepared a team is going into a project the
more likely they are to be able to anticipate costs that will arise.
6.6.4.3. Regression and Change Performance
The scatterplot and regression done for change performance gave an
upward trend with an equation of Y = 0.0003X – 0.0052 and an R2 of 0.0949.
This would suggest that an increase in PDRI score of one would increase the
amount of money spent on change orders as a percent of total cost by 0.03
Figure 6.6 Cost Performance Regression Line
PDRI Score
Per
cent
ove
r B
udge
t
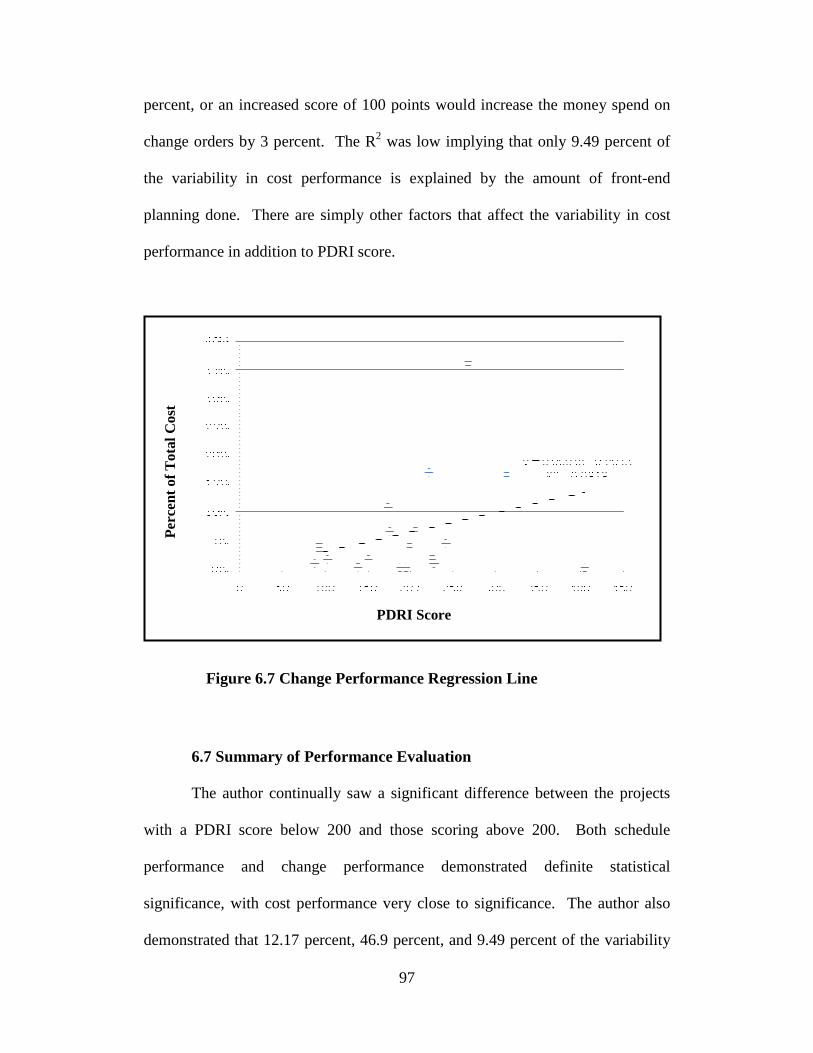
97
percent, or an increased score of 100 points would increase the money spend on
change orders by 3 percent. The R2 was low implying that only 9.49 percent of
the variability in cost performance is explained by the amount of front-end
planning done. There are simply other factors that affect the variability in cost
performance in addition to PDRI score.
6.7 Summary of Performance Evaluation
The author continually saw a significant difference between the projects
with a PDRI score below 200 and those scoring above 200. Both schedule
performance and change performance demonstrated definite statistical
significance, with cost performance very close to significance. The author also
demonstrated that 12.17 percent, 46.9 percent, and 9.49 percent of the variability
Figure 6.7 Change Performance Regression Line
PDRI Score
Per
cent
of T
otal
Cos
t

98
in schedule, cost, and change performance could be explained by a project’s PDRI
score, respectively. This can be seen in Table 6.5 below.
Table 6.5 Trendline R2 and r by Performance
Trendline R2 r
Schedule Performance Y = 0.001x - 0.0288 0.1217 0.351 Cost Performance Y = 0.0015x - 0.2043 0.4690 0.685 Change Performance Y = 0.0003x -0.0052 0.0949 0.308
To summarize, on average the projects scoring below 200 outperformed
those scoring above 200 in schedule, cost, and change order performance. Figure
6.8 shows the average performance for each category with a point cutoff of 200.
For schedule performance, those who scored under 200 were on average 5 percent
behind schedule while those scoring over 200 were on average 32 percent behind
schedule. In regards to cost performance, projects scoring below 200 were on
average 7 percent over budget while those scoring over 200 were on average 23
percent over budget. Lastly for change performance, those scoring under 200 had
change orders that cost on average 3 percent of their total project cost versus those
scoring over 200 who had change orders that cost on average 10 percent of their
total project cost.
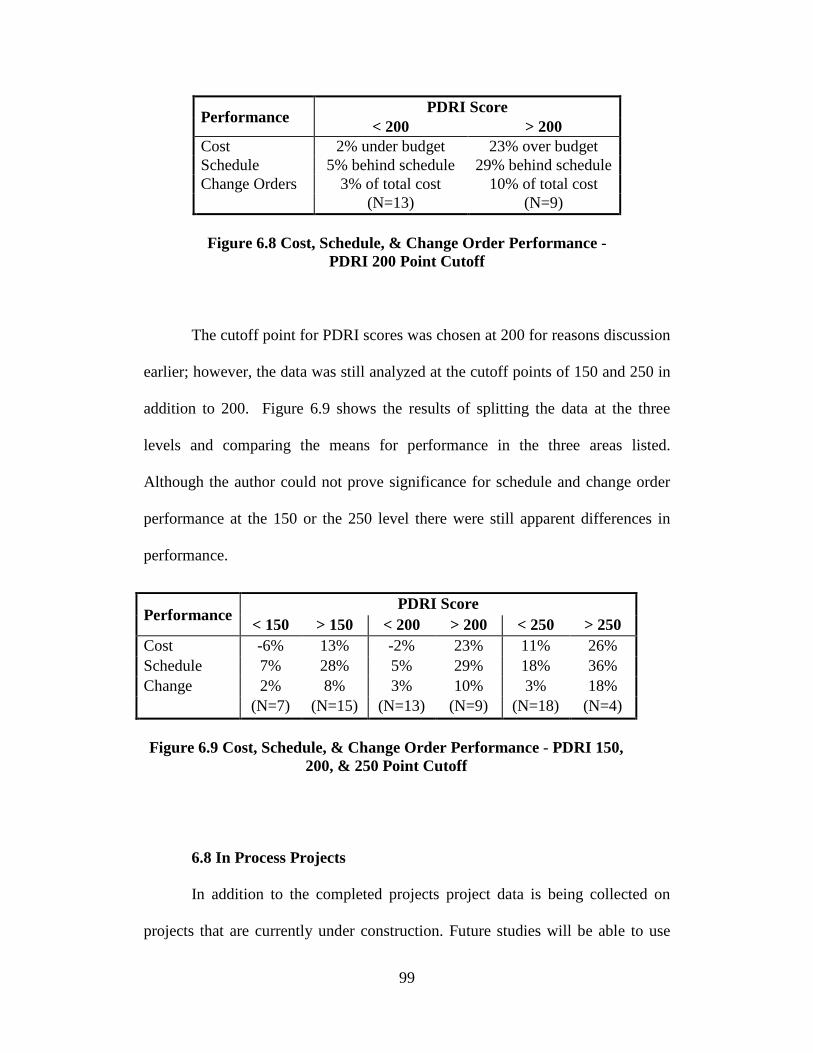
99
Performance PDRI Score
< 200 > 200 Cost 2% under budget 23% over budget Schedule 5% behind schedule 29% behind schedule Change Orders 3% of total cost 10% of total cost (N=13) (N=9) Figure 6.8 Cost, Schedule, & Change Order Performance -
PDRI 200 Point Cutoff
The cutoff point for PDRI scores was chosen at 200 for reasons discussion
earlier; however, the data was still analyzed at the cutoff points of 150 and 250 in
addition to 200. Figure 6.9 shows the results of splitting the data at the three
levels and comparing the means for performance in the three areas listed.
Although the author could not prove significance for schedule and change order
performance at the 150 or the 250 level there were still apparent differences in
performance.
6.8 In Process Projects
In addition to the completed projects project data is being collected on
projects that are currently under construction. Future studies will be able to use
Performance PDRI Score
< 150 > 150 < 200 > 200 < 250 > 250 Cost -6% 13% -2% 23% 11% 26% Schedule 7% 28% 5% 29% 18% 36% Change 2% 8% 3% 10% 3% 18%
(N=7) (N=15) (N=13) (N=9) (N=18) (N=4)
Figure 6.9 Cost, Schedule, & Change Order Performance - PDRI 150,
200, & 250 Point Cutoff
100
these projects to perform PDRI evaluations throughout the front end planning
process and test the PDRI for infrastructure in more depth. Appendix F gives a
summary of in process projects currently evaluating the PDRI.
6.9 Summary
In order to validate the PDRI for Infrastructure, information was gathered
from 22 different completed projects as well as 4 in-process projects. These
projects represented a capital investment of over $8 billion. A significant
difference was found between average schedule, cost, and change order
performance at the 200 point cutoff with schedule and cost demonstrating
significance at the 95 percent confidence interval.
Given the findings from the statistical analyses, some caution still needs to
be given as to how the author generalize the results to the infrastructure industry
as a whole. One limitation to the data is that the data was provided from
volunteers and does not necessarily represent a truly random sample as mentioned
in chapter 4. The author chose the methodology of gathering data based on a
convenience sample. In other words, analyses were performed using data from
industry volunteers. A truly random sample would be needed to imply that the
PDRI would have the same results across the industry. Due to these limitations to
the sample, caution should be used when using the data to project or predict future
success. As had been previously mentioned the PDRI tool is not intended to
forecast the percent of future cost overruns, but rather is a guide for project teams
in the improvement of the front end planning process.
101
Chapter 7: CONCLUSIONS AND RECOMMENDATIONS
This chapter provides the final conclusions and recommendations of the
thesis for the Project Definition Rating Index (PDRI) for Infrastructure Projects.
The research is the result of the collaborative efforts of the research team, industry
professionals, and academic advisors. This report has shown a successful
completion of the team objectives as well as the successful defense of the research
hypotheses. The report introduces key terms to understanding the PDRI tool and
gives a background for the purpose and need of the research. A comprehensive
literature review has shown the need for an FEP tool specifically designed to
address the issues faced by infrastructure projects. The report provides the
methodology for the development of the PDRI tool based on accepted designs of
social research. The development process has been explained and finally the tool
has been validated through the use of real projects. The design of the research
team and volunteers is in an effort to support and achieve research objectives.
7.1. Research Objectives
The goal of the research effort was to develop a tool that would significantly
enhance the project team environment during front end planning in the
infrastructure industry by doing the following:
• Improve predictability of project parameters • Reduce the cost of design and construction • Preserve schedule • Reduce risk during project execution • Improve project team alignment and communication • Assure customer satisfaction • Improve the probability of a successful project

102
The study has accomplished the objectives. The PDRI for Infrastructure
tool is now being circulated and used to improve projects. Future research will
show the effectiveness of the PDRI for Infrastructure Projects. Like its PDRI
predecessors this tool is expected to be highly valued by the construction industry.
The PDRI tool is able to improve predictability of project parameters by
providing a detailed process for the evaluation of project scope allowing team
members to understand the level of definition there projects has. In addition the
tool provides a ranking of the scope most likely to improve the project
parameters. Project teams can use this information to focus efforts on the most
important elements.
It is the goal of every project to reduce the cost of design and construction;
this research is part of a research thread that supports the theory that a good front
end planning process will improve projects costs. The testing section of this report
gave conclusive evidence that the level of scope definition directly related to the
final cost. It was concluded that as the level of scope definition increase the cost
of design and construction decreases.
Another primary goal of project teams is to preserve the project schedule.
The PDRI for Infrastructure Projects can greatly contribute to the preservation of
schedule by identifying possible risk factors that commonly effect infrastructure
projects. The testing section of this report was also helpful in showing the
relationship that exist between projects that have a clearly defined scopes and
those that have not given adequate attention to front end planning.

103
The PDRI tool can also be used to reduce risk during project execution.
The more a project team knows about a project the less risk they have and the
more likely they will be able to manage unavoidable risk through mitigation steps.
The detailed element descriptions provided through the PDRI tool provides a
checklist that project teams can use to identify the specific unknowns within a
project. The team can then develop a plan to manage that risk.
One of the greatest qualities of the PDRI tool is its ability to improve
project team alignment and communication. The tool is designed for use by
project teams at multiple stages within the front end panning project. Each PDRI
assessment can be used as a measure of the teams progress and allow for
allocation of team resource for further definition of poorly defined elements.
One of the best ways to assure customer satisfaction is by delivering a
project on time, within budget, and without conflict. When used as a part of the
FEP process the PDRI tool can improve schedule, reduce cost and provide
reliable expectations for both the owner as well as the contractor. By reducing
project unknowns project satisfaction increases.
In summary the PDRI for Infrastructure projects can be used to improve
the probability of a successful project. Although success can be measured in many
ways (and it is not the scope of this report to define success), the factors most
commonly attributed to success are: cost, schedule and changes. The PDRI for
Infrastructure Projects is shown as a realizable tool for improvement in all of
these critical areas.

104
7.1.1. Research Hypotheses
The primary purposes of this thesis were to provide a documentation of
the research for the development of the PDRI for Infrastructure as well as to
substantiate the research hypotheses. The hypotheses of this research as follows:
Hypothesis 1- A finite and specific list of issues related to scope definition of
infrastructure projects can be developed.
Hypothesis 2- The PDRI score indicates the current level of scope definition and
corresponds to project performance. That is infrastructure projects with low
PDRI scores outperform projects with high PDRI scores
In order to validate this hypothesis data was collected for actual
infrastructure projects. A summary of key finding are given in the following
sections.
7.2. Key Findings
The findings of the author are divided into two sections: workshop
findings and testing findings. Results for workshop findings are based on the
weighting workshops held throughout the US and in Great Britain and represent
data collected from 64 industry professionals representing over 1,300 years of
experience in infrastructure projects. The findings for the testing of the PDRI
come from 22 completed projects totaling over $6 Billion in project costs. The
data from both sources was analyzed using widely excepted statistical tests a
105
summary of the findings and the conclusions based on those findings were
presented.
7.2.1. Workshop Findings
The weighting workshops were used to collect opinions from industry
professionals to contribute weights or a ranking to a list 68 elements that make up
the PDRI. After the data was collected it went through a series of data screening
processes as was described in the chapter on methodology. The final result was a
list of prioritized elements with their relative weights on a scale adding up to 1000
possible points. Higher scores represent projects with little to no definition; lower
scores represent projects with good or complete scope definition. The weighting
workshops supported the hypothesis that a finite and specific list of issues related
to scope definition of infrastructure projects can be developed. The weighted
elements provide project teams with a planning tool that allows the most focus to
be placed on the scopes that are most likely to affect the future project success.
7.2.2. Validation Findings
Independent Samples t-Tests were run using SPSS for Schedule, Cost &
Change Order Performance. The analyses found that the difference between the
means for schedule performance for the projects scoring above 200 and those
scoring below 200 was statistically significant. The average schedule
performance for projects below 200 was 5 percent behind schedule while those
scoring above 200 on average were 29 percent behind schedule. When the author
ran the t-test for cost performance the author found that there was definite
statistical significance between the groups with those scoring below 200 on
106
average finishing a project 2 percent under budget and those scoring over 200 on
average finishing 23 percent over budget. A t-test was also run for change order
performance. The groups scoring below 200 had, on average, change order costs
that equaled 3 percent of their total project cost while those scoring above 200
had, on average, change order costs that equaled 10 percent of their total project
cost. Regression analysis was also done for schedule, cost, and change order
performance to test the R2 of each performance measure. The author found that
the PDRI score explained the variability of schedule, cost, and change order
performance by 12.17 percent, 46.9 percent, and 9.49 percent, respectively. Cost
performance had a large R2 of 46.9 percent implying that a 46.9 percent of the
variability in cost performance can be explained by a projects PDRI score.
Through this testing process it was concluded that the PDRI score indicates the
current level of scope definition and corresponds to project performance. That is
infrastructure projects with low PDRI scores outperform projects with high PDRI
scores.
7.3. Limitations and Cautions
It is recommended that the project team using the PDRI tool use it as it
was primarily intended; a project alignment and risk management tool. Users
should not think of the tool as a onetime assessment. The recommended use of the
PDRI involves many different assessments. When using this tool on specific
projects teams should not be afraid to modify the PDRI for their specific project;
for example there may be additional description to elements unique to the project
107
that could be added. Because not all projects are the same the PDRI should be
used in way most advantages to each specific project.
Although there is statistical significance showing a direct correlation between
the PDRI score and project success. Caution should be used in employing the
PDRI score as forecasting tool for cost, schedule, and changes. It other words a
specific PDRI score cannot accurately forecast how much over budget a project
will be. This is due in part to the small sample size. The PDRI score can however
point areas of focus that could improve the final costs, schedule and other
measurements that relate to project success.
When used in a team environment the individual scoring of scopes by team
members should be noted. Different opinions in scoring represent a perceived
definition of scope. This once again highlights the importance and advantages of
using the PDRI for Infrastructure tool to promote team communication and
alignment.
7.4. Summary of Thesis
This thesis is a documentation of the proceedings of the author in
correlation with CII RT268 in the development of the Project Definition Rating
Index (PDRI for Infrastructure Projects. The thesis gives background and support
for the purpose and need of the PDRI tool as a front end planning tool. The
methodology followed by the author was outlined in detail and the findings from
collected data were reported. A detailed development process was described and
the means of testing for the PDRI tool was illustrated. Finally key research
findings were reported, the research hypotheses were tested, and conclusions and

108
recommendations for use were given. The CII will continue to add to the tools
used in the front end planning process. The methodology followed in the
development of the PDRI for Infrastructure Projects along with the proven
techniques of the previous PDRI tools provide a good base for any future
research.
7.5. Recommendations for Future Research
The author recommends that future research be done using the PDRI for
Infrastructure Projects. That research could work with case studies to test the tool
further. Some of that work has already begun with the projects that are currently
in-process and have implemented the PDRI tool. As was done with previous
PDRI tools, the PDRI for Infrastructure projects needs to integrated into the PDRI
toolkit. The toolkit is a set of tools created by the CII to improve front end
planning. CII continues to develop new versions of the PDRI tools they have
created. The PDRI for Infrastructure Projects will also need to be revisited and
revised as it becomes more implemented into the industry and CII discovers how
they can improve the tool.

109
REFERENCES Anderson, S.D., & Tucker, R.L., 1990. Potential for Construction Industry
Improvement Volume I – Assessment Methodology – Source Document 61. Austin, Texas: Construction Industry Institute, The University of Texas at Austin, Austin, Texas.
Babbie, E. 2008. The Basics of Social Research, 5th Edition. Wadsworth,
Cengage Learning Bergeron, A. 2008. Lake Pontchartrain Bridge Work Halted Following Fatal
Accident. Engineering News Record. 1-2. Biswas, Asit K. 1988. Sustainable Water Development For Developing
Countries. International Journal of Water Resources Development. 232 - 242.
Broaddus, J.A., 1995. Managing Inputs to Design for Project Success:
Participant Handbook – CII Education Module EM-9. Austin, Texas: Construction Industry Institute, The University of Texas at Austin.
Caldas, C.H., et al. 2007. Identifying Right-of-Way Requirements during the
Project Development Process. VCTR. 1-210. Caldas, C.H., Gibson, G.E., & Le, T. 2007. TxDOT Best Practices Model and
Implementation Guide for Advance Planning Risk Analysis for Transportation Projects. VCTR. 1-73.
Chalabi, A.F., Beaudin, B.J., & Salazar, G., 1987. Input Variables Impacting
Design Effectiveness – Source Document 26. Austin, Texas: Construction Industry Institute, The University of Texas at Austin.
Cho, C., Forman, J., & Gibson, G.E. 1999. Development of the Project
Definition Rating Index (PDRI) for Building Projects. Resource Report 155-11. Austin, Texas: Construction Industry Institute, The University of Texas at Austin.
The Construction Industry Institute. 1987. Input Variables Impacting Design
Effectiveness – Publication 8-2. Austin, Texas: Construction Industry Institute, The University of Texas at Austin.
The Construction Industry Institute. 1991. Manual for Special Project
Management – Special Publication. Austin, Texas: Construction Industry Institute, The University of Texas at Austin.
The Construction Industry Institute. 1993. Constructability Implementation
110
Guide – Special Publication 34-1. Austin, Texas: Construction Industry Institute, The University of Texas at Austin.
The Construction Industry Institute. 1994. Pre-Project Planning: Beginning a
Project the Right Way - CII Publication 39-1. Austin, Texas: Construction Industry Institute, The University of Texas at Austin.
The Construction Industry Institute. 1995. Pre-Project Planning Handbook –
Special Publication 39-2. Austin, Texas: Construction Industry Institute, The University of Texas at Austin.
The Construction Industry Institute. 1996. PDRI: Project Definition Rating
Index Industrial Projects – Implementation Resource 113-2. Austin, Texas: Construction Industry Institute, The University of Texas at Austin.
The Construction Industry Institute. 1996. Predictive Tools: Closing the
Performance Gap – Research Summary 107-1. Austin, Texas: Construction Industry Institute, The University of Texas at Austin.
The Construction Industry Institute. 1998. Planning for Startup –
Implementation Resource 121-2. Austin, Texas: Construction Industry Institute, The University of Texas at Austin.
The Construction Industry Institute. 1998. Planning for Startup: Overview of
Research – Research Summary 121-1. Austin, Texas: Construction Industry Institute, The University of Texas at Austin.
Construction Industry Institute.199. Project definition rating index (PDRI), building projects. Implementation Resource. 155-2, Austin, Tex.
Doll, C., Pablo L., Durango-Cohen, & Ueda T. 2009. Transportation
Infrastructure Planning, Management, and Finance. Journal of Infrastructure Systems. 1-2.
Dumont, P.R., Gibson, G.E., & Fish, J.R. 1997. Scope Management Using
Project Definition Rating Index. Journal of Management in Engineering., ASCE 13(5), 54-60.
Flyvbjerg, B., Bruzelius, N., & Rothengatter W. Megaprojects and Risk.
Cambridge: Cambridge Press, 2008. Garber, N.J., & Hoel, L.A. 2002. Traffic & Highway Engineering. United States:
Thomson Learning. Gibson, G.E., & Dumont, P.R. 1996. Project Definition Rating Index (PDRI) –
Research Report 113-11. Austin, Texas: Construction Industry Institute,

111
The University of Texas at Austin. Gibson, G.E., et al. 1997. Pre Project Planning Tools: PDRI and Alignment.
113-1. Austin, Texas: Construction Industry Institute, The University of Texas at Austin.
Gibson, G.E., et. al. 2010. Project Definition Rating Index for Infrastructure
Projects. Implementation Resource 268-2. Austin, Texas: Construction Industry Institute, The University of Texas at Austin.
Gibson, G.E., Kaczmarowski, J.H., & Lore, H.E. 1993. Modeling Pre-Project
Planning for the Construction of Capital Facilities – Source Document 94. Austin, Texas: Construction Industry Institute, The University of Texas at Austin.
Gibson, G.E., Tortora, A.L., & Wilson, C.T. 1994. Perceptions of Project
Representatives Concerning Project Success and Pre-Project Planning Effort – Source Document 102. Austin, Texas: Construction Industry Institute, The University of Texas at Austin.
Gibson, G.E.., & Hamilton, M.R. 1994. Analysis of Pre-Project Planning Effort
and Success Variables for Capital Facility Projects – Source Document 105. Austin, Texas: Construction Industry Institute, The University of Texas at Austin.
Gibson, G.E., Liao, S., Broaddus, J.A., & Bruns, T.A. 1997. The University of
Texas System Capital Project Performance, 1990 – 1995. Austin, Texas: Office of Facilities Planning and Construction, The University of Texas System.
Glagola, C., Ledbetter, W.B., & Stevens, J.D., 1992. Quality Performance
Measurements of the EPC Process: Current Practices – Source Document 79. Austin, Texas: Construction Industry Institute, The University of Texas at Austin.
Goggin, M. 2008. Wind Power and Energy Storage. American Wind
Energy Association. Gramlich, R., Goggin, M., & Gensler, K. 2009. Green Power Superhighways.
White Paper. American Wind Energy Association. Griffin, C.W. 1972. Development Building: The Team Approach. New York:
Halsted Press Division, John Wiley & Sons, Inc. Griffith, A.F., & Gibson, G.E. 1997. Team Alignment During Pre-Project
Planning of Capital Facilities – Research Report 113-12. Austin, Texas:
112
Construction Industry Institute, The University of Texas at Austin. Griffith, A.F., Gibson, G.E., Hamilton, M.R., Tortora, A.L., & Wilson, C.T.
1999. Project success index for capital facility construction projects. Journal of Performance of Constructed Facilities., 13(1), 39-45.
Hackney, J.W., 1992. Control & Management of Capital Projects – Second
Edition. New York, New York: McGraw-Hill, Inc. Hendrata, H. 1996. Empirical Analyses of Project Definition Rating Index.
Report submitted in partial fulfillment of the degree of Master of Science in Engineering, Department of Civil Engineering. University of Texas at Austin, Austin, Texas.
Job, C. 2009. Water System Infrastructure: Long-range Planning and
Sustainability. American Water Works Association. 39. Landers, J. 2008. Water Pipeline Database Will Improve Asset Management.
Civil Engineering. 33. Laufer, A., 1989. Owner’s Project Planning: The Process Approach – Source
Document 45. Austin, Texas: Construction Industry Institute, The University of Texas at Austin.
O’Connor, J.T., & Vickroy, C.G. 1986. Control of Construction Project Scope –
Source Document 6. Austin, Texas: Construction Industry Institute, The University of Texas at Austin.
O'Keefe, M., Marx, T., & Yacus, E. 26 July 2008. U.S. Bridges Under Scrutiny
2008. ABC News. 1-2. O’Reilly, A.D., 1997. Project Definition Rating Index for Buildings. Thesis
submitted in partial fulfillment of the degree of Master of Science in Engineering, Department of Civil Engineering. The University of Texas at Austin, Austin, Texas.
Pearson, DDR. 2008. Planning for Water Infrastructure in Victoria. Government
Repoirt. Richardson, N. 2007. Maximizing Transmission Planning Efficiency. Electric
Light and Power. 62. Rowings, J.E., & Behling, K.R., 1993. Organizing for Capital Projects: A
Rational Approach – Source Document 93. Austin, Texas: Construction Industry Institute, The University of Texas at Austin.
113
Rowings, J.E., Nelson, M.G., & Perry, K.J. 1987. Project Objective-Setting by Owners and Contractors – Source Document 31. Austin, Texas: Construction Industry Institute, The University of Texas at Austin.
Russell, J.S., Jaselskis, E.J., Lawrence, S.P., Tserng, H.P., & Prestine, M.T. 1996.
Development of a Predictive Tool for Continuous Assessment of Project Performance – Research Report 107-11. Austin, Texas: Construction Industry Institute, The University of Texas at Austin.
Sanvido, V.E., & Konchar, M.D. 1998. Project Delivery Systems: CM at Risk,
Design-Build, Design-Bid-Build – Research Report 133-11. Austin, Texas: Construction Industry Institute, The University of Texas at Austin.
Siegel, A.F. 2003. Practical business Statistics, 5th Edition. McGraw-Hill, Inc. Spring, G.S. 2004. Handbook of Transportation Engineering. McGraw-Hill,
Inc. Tatum, C.B., Vanegas, J.A., & Williams, J.M., 1986. Constructability
Improvement During Conceptual Planning – Source Document 4. Austin, Texas: Construction Industry Institute, The University of Texas at Austin.
Thornburn, Andrew A. 1994. A Design-Build Process Map for Air Force
Military Construction Projects. Austin, Texas: University of Texas at Austin.
Turner-Fairbank Highway Research Center. 2008. Highways of the Future—A
Strategic Plan for Highway Infrastructure Research and Development. Federal Highway Administration Report.
The University of Texas System. 1995. Facilities Programming Guidelines.
Austin, Texas: Office of Facilities Programming and Construction, The University of Texas System.
Unknown Author. 2008. Forensic Analysis of I-35 Bridge Failure. Applied
Science International. 1-2. Unknown Author. 2009. Why Failure to Plan is at The Root of Many Project
Failures. Contract Journal. 1-2. U. S. Department of Energy. 2008. 20% Wind Energy By 2030. Energy
Efficiency and Renewable Energy. 1-248. Vasudev, G. 2000. Improving Infrastructure. South Asian Survey. 150-162.

114
APPENDIX A
PARTICIPATING ORGANIZATIONS

115
PROJECT DEFINITION RATING INDEX FOR INFRASTRUCTURE PROJECTS RESEARCH TEAM MEMBERSHIP
(2008 – 10)
Mahir Aydin Ontario Power Generation
Homer D. Bothe DFW International Airport
Eskil E. Carlsson, Co-Chair CSA Group
Paul Mickey Collins Pathfinder, LLC.
Don Cooley CH2M Hill
Brian Foy Burns & McDonnell
Dennis W. Gardner Mustang
G. Edward Gibson, Jr. Arizona State University
David R. Halicks Tennessee Valley Authority
Tim Hoopengarner JMJ Associates
Chad Kendrick Southern Company
Steve Laskowski Flour Corporation
Robert Mitrocsak U.S. Arch. of the Capitol
Jim Palmer Hill International
Richard Payne Jacobs
Scott Penrod Walbridge
Tim Podesta, Co-Chair BP
Richard Rye Hill International
James B. Vicknair WorleyParsons
Evan Bingham, Student Arizona State University
Rick Stogner, Student University of Alabama

116
ORGANIZATIONS PARTICIPATING IN THE WEIGHTING WORKSHOPS
AECOM
AOE
Architect of the Capital
Bentley transportation
Booz Allen Hamilton
BP
CH2M Hill
Chevron
Conoco Phillips
CSA Group
Department of Energy
D'Orange Ltd
European Construction Institute
European Investment Bank
Exxon Mobil
Fluor Enterprises
Highways Agency
Hill International
Jacobs Engineering
KBR
KPFF Consulting Engineers
Mustang Engineering
National Institute of Standards and Technology
Network Rail
P2s Engineering
Pathfinder, LLC
Port of Long Beach
Salt River Project
SB Infrastructure Ltd.
Sempra
Smithsonian Institution (Technology Trends)
Syngenta
Teixeira Camargo Correa
The RBA Group
US Army Corps of Engineers
Walbridge
Wasit Offshore Platforms and Pipeline div
Worley Parsons
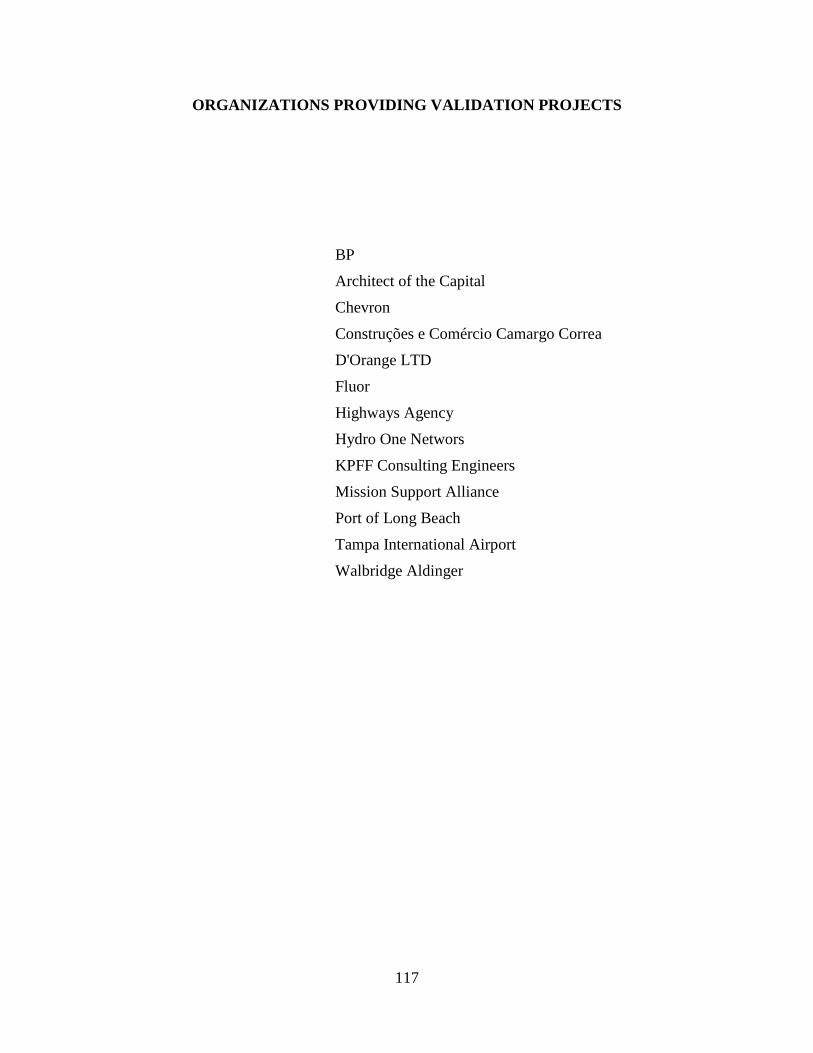
117
ORGANIZATIONS PROVIDING VALIDATION PROJECTS
BP
Architect of the Capital
Chevron
Construções e Comércio Camargo Correa
D'Orange LTD
Fluor
Highways Agency
Hydro One Networs
KPFF Consulting Engineers
Mission Support Alliance
Port of Long Beach
Tampa International Airport
Walbridge Aldinger

118
APPENDIX B
PDRI FOR INFRASTRUCTURE PROJECTS DOCUMENTS
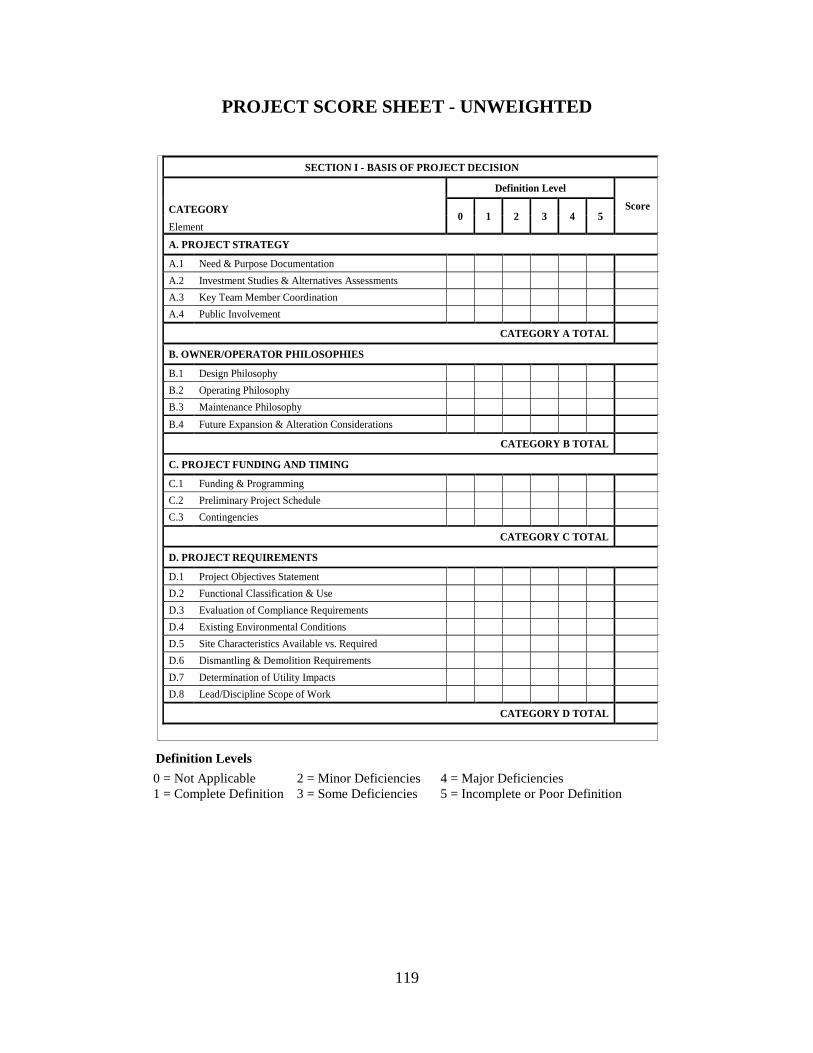
119
PROJECT SCORE SHEET - UNWEIGHTED
Definition Levels
SECTION I - BASIS OF PROJECT DECISION
Definition Level
Score CATEGORY 0 1 2 3 4 5
Element
A. PROJECT STRATEGY
A.1 Need & Purpose Documentation A.2 Investment Studies & Alternatives Assessments A.3 Key Team Member Coordination A.4 Public Involvement
CATEGORY A TOTAL
B. OWNER/OPERATOR PHILOSOPHIES
B.1 Design Philosophy B.2 Operating Philosophy B.3 Maintenance Philosophy
B.4 Future Expansion & Alteration Considerations
CATEGORY B TOTAL
C. PROJECT FUNDING AND TIMING
C.1 Funding & Programming C.2 Preliminary Project Schedule C.3 Contingencies
CATEGORY C TOTAL
D. PROJECT REQUIREMENTS
D.1 Project Objectives Statement D.2 Functional Classification & Use D.3 Evaluation of Compliance Requirements D.4 Existing Environmental Conditions D.5 Site Characteristics Available vs. Required D.6 Dismantling & Demolition Requirements D.7 Determination of Utility Impacts D.8 Lead/Discipline Scope of Work
CATEGORY D TOTAL
0 = Not Applicable 2 = Minor Deficiencies 4 = Major Deficiencies 1 = Complete Definition 3 = Some Deficiencies 5 = Incomplete or Poor Definition

120
PROJECT SCORE SHEET - UNWEIGHTED (continued)
Definition Levels
SECTION I - BASIS OF PROJECT DECISION (Cont’d)
Definition Level
Score CATEGORY 0 1 2 3 4 5
Element
E. VALUE ANALYSIS
E.1 Value Engineering Procedures E.2 Design Simplification E.3 Material Alternatives Considered E.4 Constructability Procedures
CATEGORY E TOTAL
0 = Not Applicable 2 = Minor Deficiencies 4 = Major Deficiencies 1 = Complete Definition 3 = Some Deficiencies 5 = Incomplete or Poor Definition
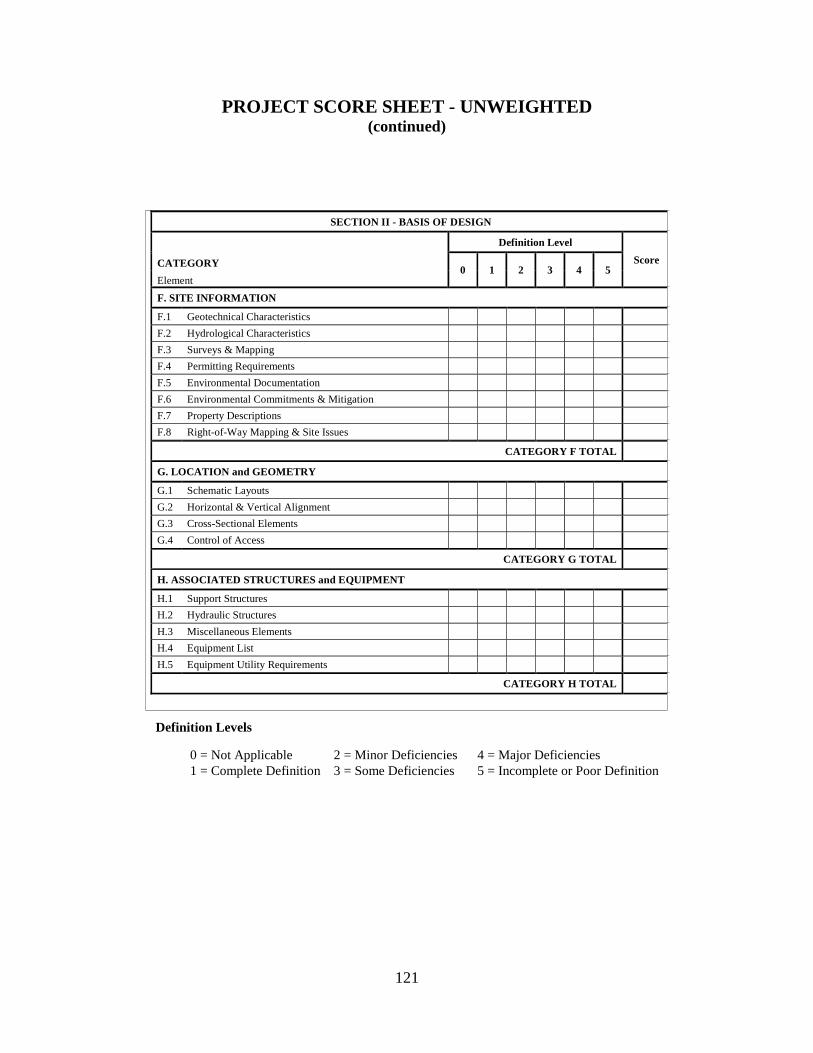
121
PROJECT SCORE SHEET - UNWEIGHTED (continued)
Definition Levels
SECTION II - BASIS OF DESIGN
Definition Level
Score CATEGORY 0 1 2 3 4 5
Element
F. SITE INFORMATION
F.1 Geotechnical Characteristics F.2 Hydrological Characteristics F.3 Surveys & Mapping F.4 Permitting Requirements F.5 Environmental Documentation F.6 Environmental Commitments & Mitigation F.7 Property Descriptions F.8 Right-of-Way Mapping & Site Issues
CATEGORY F TOTAL
G. LOCATION and GEOMETRY
G.1 Schematic Layouts G.2 Horizontal & Vertical Alignment G.3 Cross-Sectional Elements G.4 Control of Access
CATEGORY G TOTAL
H. ASSOCIATED STRUCTURES and EQUIPMENT
H.1 Support Structures H.2 Hydraulic Structures H.3 Miscellaneous Elements H.4 Equipment List H.5 Equipment Utility Requirements
CATEGORY H TOTAL
0 = Not Applicable 2 = Minor Deficiencies 4 = Major Deficiencies 1 = Complete Definition 3 = Some Deficiencies 5 = Incomplete or Poor Definition
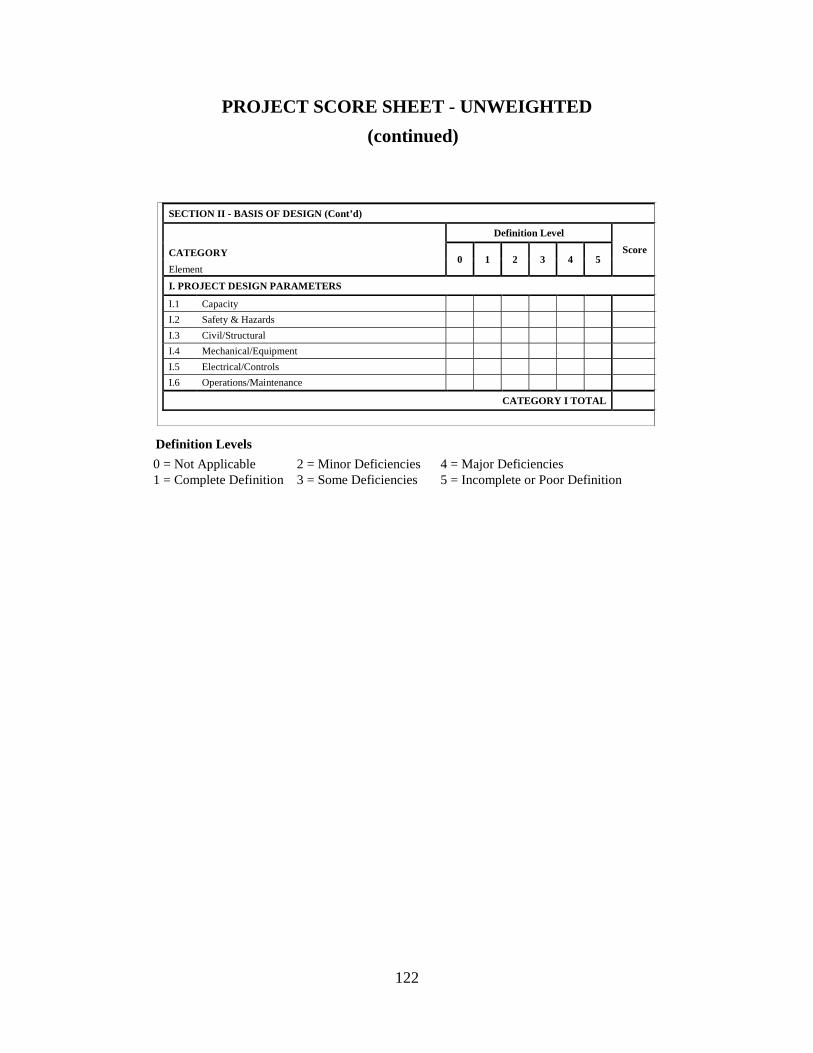
122
PROJECT SCORE SHEET - UNWEIGHTED
(continued)
Definition Levels
SECTION II - BASIS OF DESIGN (Cont’d)
Definition Level
Score CATEGORY 0 1 2 3 4 5
Element
I. PROJECT DESIGN PARAMETERS
I.1 Capacity I.2 Safety & Hazards I.3 Civil/Structural I.4 Mechanical/Equipment I.5 Electrical/Controls I.6 Operations/Maintenance
CATEGORY I TOTAL
0 = Not Applicable 2 = Minor Deficiencies 4 = Major Deficiencies 1 = Complete Definition 3 = Some Deficiencies 5 = Incomplete or Poor Definition
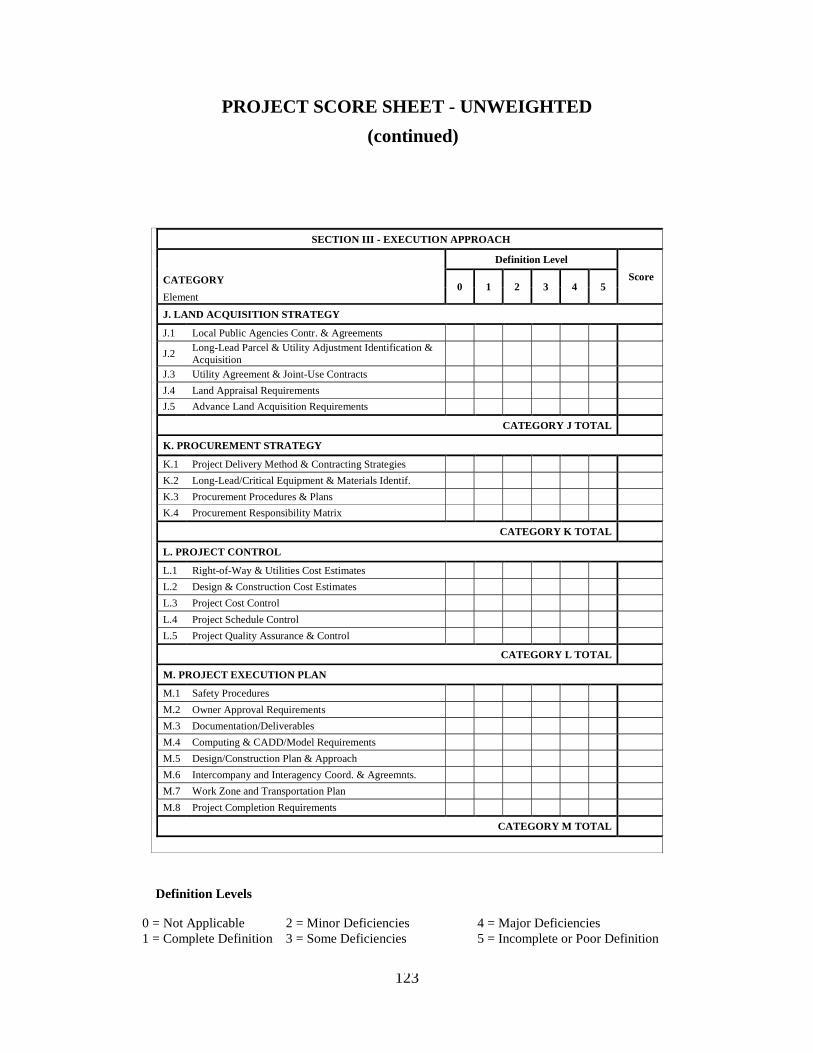
123
PROJECT SCORE SHEET - UNWEIGHTED
(continued)
Definition Levels 0 = Not Applicable 2 = Minor Deficiencies 4 = Major Deficiencies 1 = Complete Definition 3 = Some Deficiencies 5 = Incomplete or Poor Definition
SECTION III - EXECUTION APPROACH
Definition Level
Score CATEGORY 0 1 2 3 4 5
Element
J. LAND ACQUISITION STRATEGY
J.1 Local Public Agencies Contr. & Agreements
J.2 Long-Lead Parcel & Utility Adjustment Identification & Acquisition
J.3 Utility Agreement & Joint-Use Contracts J.4 Land Appraisal Requirements J.5 Advance Land Acquisition Requirements
CATEGORY J TOTAL
K. PROCUREMENT STRATEGY
K.1 Project Delivery Method & Contracting Strategies K.2 Long-Lead/Critical Equipment & Materials Identif. K.3 Procurement Procedures & Plans K.4 Procurement Responsibility Matrix
CATEGORY K TOTAL
L. PROJECT CONTROL
L.1 Right-of-Way & Utilities Cost Estimates L.2 Design & Construction Cost Estimates L.3 Project Cost Control L.4 Project Schedule Control L.5 Project Quality Assurance & Control
CATEGORY L TOTAL
M. PROJECT EXECUTION PLAN
M.1 Safety Procedures M.2 Owner Approval Requirements M.3 Documentation/Deliverables M.4 Computing & CADD/Model Requirements M.5 Design/Construction Plan & Approach M.6 Intercompany and Interagency Coord. & Agreemnts. M.7 Work Zone and Transportation Plan M.8 Project Completion Requirements
CATEGORY M TOTAL
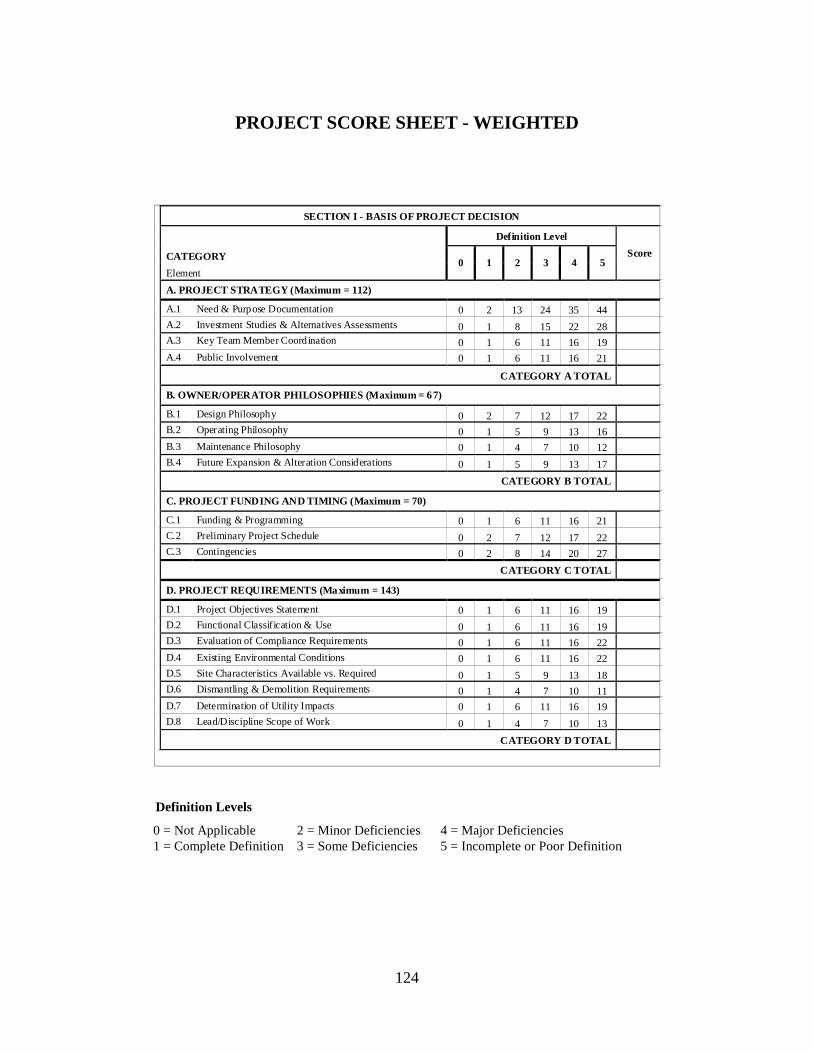
124
PROJECT SCORE SHEET - WEIGHTED
Definition Levels
0 = Not Applicable 2 = Minor Deficiencies 4 = Major Deficiencies 1 = Complete Definition 3 = Some Deficiencies 5 = Incomplete or Poor Definition
SECTION I - BASIS OF PROJECT DECISION
Definition Level
Score CATEGORY 0 1 2 3 4 5
Element
A. PROJECT STRATEGY (Maximum = 112)
A.1 Need & Purpose Documentation 0 2 13 24 35 44
A.2 Investment Studies & Alternatives Assessments 0 1 8 15 22 28 A.3 Key Team Member Coordination 0 1 6 11 16 19
A.4 Public Involvement 0 1 6 11 16 21
CATEGORY A TOTAL
B. OWNER/OPERATOR PHILOSOPHIES (Maximum = 67)
B.1 Design Philosophy 0 2 7 12 17 22 B.2 Operating Philosophy 0 1 5 9 13 16
B.3 Maintenance Philosophy 0 1 4 7 10 12
B.4 Future Expansion & Alteration Considerations 0 1 5 9 13 17
CATEGORY B TOTAL
C. PROJECT FUNDING AND TIMING (Maximum = 70)
C.1 Funding & Programming 0 1 6 11 16 21
C.2 Preliminary Project Schedule 0 2 7 12 17 22 C.3 Contingencies 0 2 8 14 20 27
CATEGORY C TOTAL
D. PROJECT REQUIREMENTS (Maximum = 143)
D.1 Project Objectives Statement 0 1 6 11 16 19
D.2 Functional Classification & Use 0 1 6 11 16 19 D.3 Evaluation of Compliance Requirements 0 1 6 11 16 22
D.4 Existing Environmental Conditions 0 1 6 11 16 22
D.5 Site Characteristics Available vs. Required 0 1 5 9 13 18 D.6 Dismantling & Demolition Requirements 0 1 4 7 10 11
D.7 Determination of Utility Impacts 0 1 6 11 16 19
D.8 Lead/Discipline Scope of Work 0 1 4 7 10 13
CATEGORY D TOTAL

125
PROJECT SCORE SHEET - WEIGHTED
(continued)
Definition Levels
SECTION I - BASIS OF PROJECT DECISION (Cont’d)
Definition Level
Score CATEGORY 0 1 2 3 4 5
Element
E. VALUE ANALYSIS (Maximum = 45)
E.1 Value Engineering Procedures 0 1 3 5 7 10 E.2 Design Simplification 0 0 3 6 9 11
E.3 Material Alternatives Considered 0 1 3 5 7 9
E.4 Constructability Procedures 0 1 5 9 13 15
CATEGORY E TOTAL
Section I Maximum Score = 437 SECTION I TOTAL
0 = Not Applicable 2 = Minor Deficiencies 4 = Major Deficiencies 1 = Complete Definition 3 = Some Deficiencies 5 = Incomplete or Poor Definition
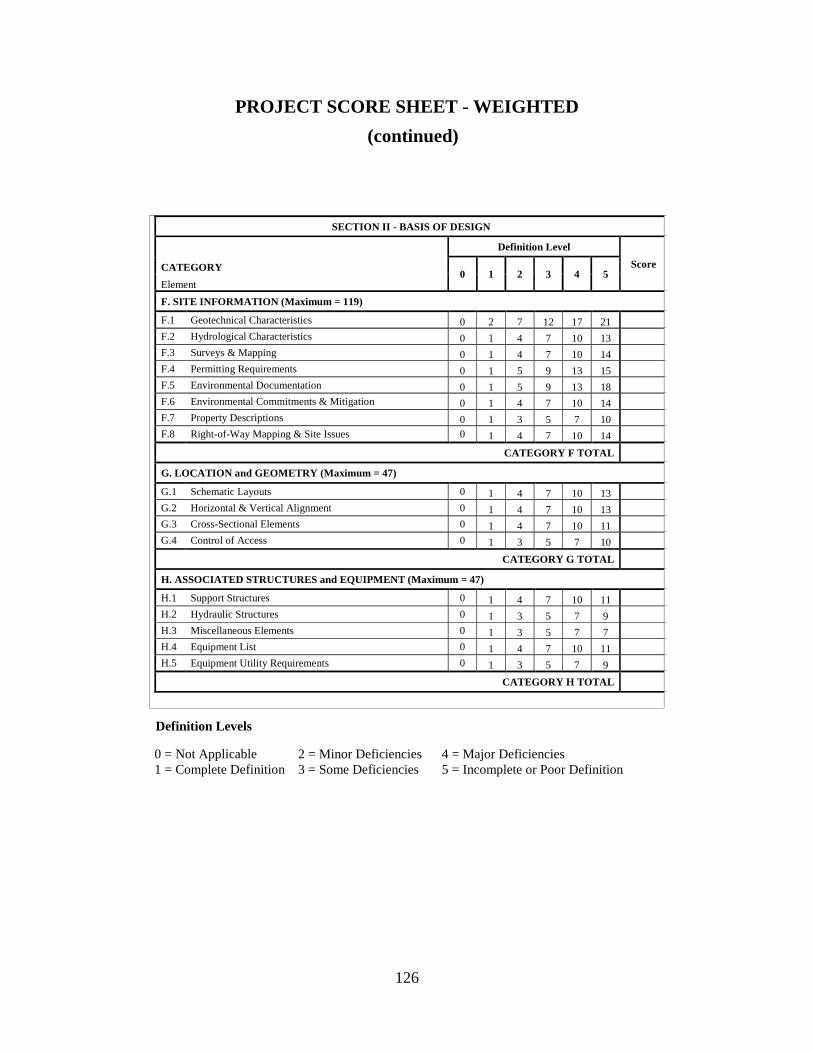
126
PROJECT SCORE SHEET - WEIGHTED
(continued)
Definition Levels
SECTION II - BASIS OF DESIGN
Definition Level
Score CATEGORY 0 1 2 3 4 5
Element
F. SITE INFORMATION (Maximum = 119)
F.1 Geotechnical Characteristics 0 2 7 12 17 21 F.2 Hydrological Characteristics 0 1 4 7 10 13 F.3 Surveys & Mapping 0 1 4 7 10 14 F.4 Permitting Requirements 0 1 5 9 13 15 F.5 Environmental Documentation 0 1 5 9 13 18 F.6 Environmental Commitments & Mitigation 0 1 4 7 10 14 F.7 Property Descriptions 0 1 3 5 7 10 F.8 Right-of-Way Mapping & Site Issues 0 1 4 7 10 14
CATEGORY F TOTAL
G. LOCATION and GEOMETRY (Maximum = 47)
G.1 Schematic Layouts 0 1 4 7 10 13 G.2 Horizontal & Vertical Alignment 0 1 4 7 10 13 G.3 Cross-Sectional Elements 0 1 4 7 10 11 G.4 Control of Access 0 1 3 5 7 10
CATEGORY G TOTAL
H. ASSOCIATED STRUCTURES and EQUIPMENT (Maximum = 47)
H.1 Support Structures 0 1 4 7 10 11 H.2 Hydraulic Structures 0 1 3 5 7 9 H.3 Miscellaneous Elements 0 1 3 5 7 7 H.4 Equipment List 0 1 4 7 10 11 H.5 Equipment Utility Requirements 0 1 3 5 7 9
CATEGORY H TOTAL
0 = Not Applicable 2 = Minor Deficiencies 4 = Major Deficiencies 1 = Complete Definition 3 = Some Deficiencies 5 = Incomplete or Poor Definition
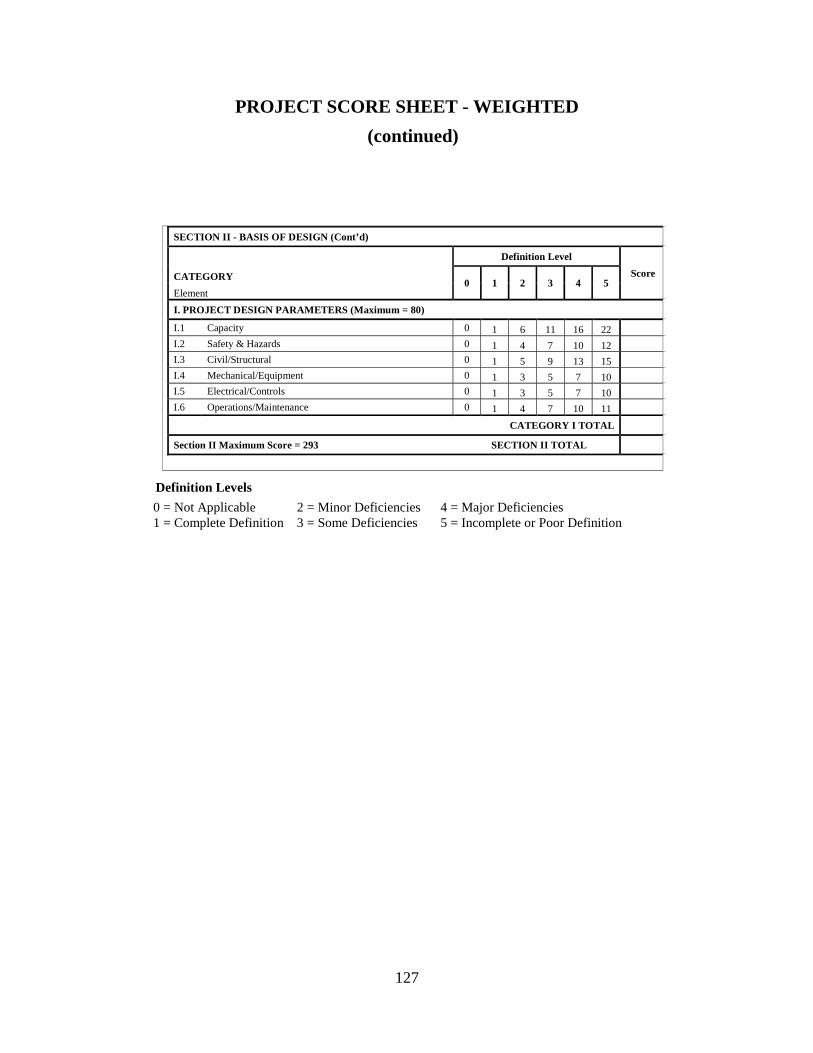
127
PROJECT SCORE SHEET - WEIGHTED
(continued)
Definition Levels
SECTION II - BASIS OF DESIGN (Cont’d)
Definition Level
Score CATEGORY 0 1 2 3 4 5
Element
I. PROJECT DESIGN PARAMETERS (Maximum = 80)
I.1 Capacity 0 1 6 11 16 22 I.2 Safety & Hazards 0 1 4 7 10 12 I.3 Civil/Structural 0 1 5 9 13 15 I.4 Mechanical/Equipment 0 1 3 5 7 10 I.5 Electrical/Controls 0 1 3 5 7 10 I.6 Operations/Maintenance 0 1 4 7 10 11
CATEGORY I TOTAL
Section II Maximum Score = 293 SECTION II TOTAL
0 = Not Applicable 2 = Minor Deficiencies 4 = Major Deficiencies 1 = Complete Definition 3 = Some Deficiencies 5 = Incomplete or Poor Definition
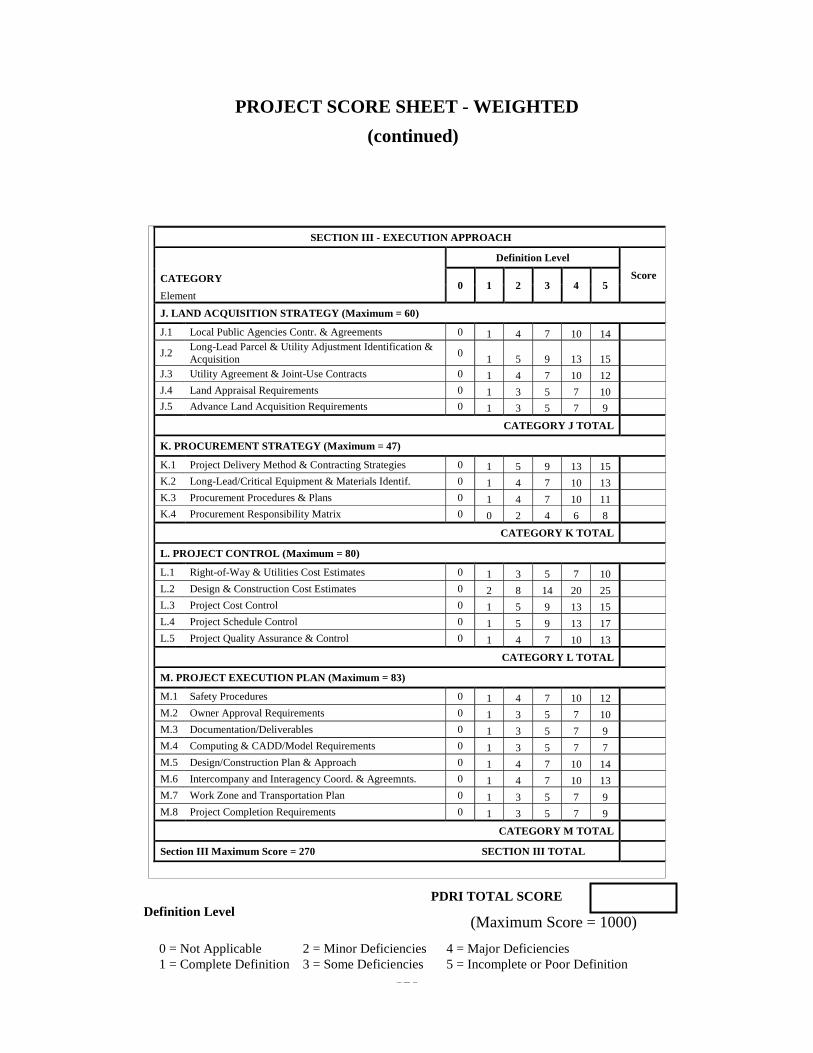
128
PROJECT SCORE SHEET - WEIGHTED
(continued)
PDRI TOTAL SCORE Definition Level
SECTION III - EXECUTION APPROACH
Definition Level
Score CATEGORY 0 1 2 3 4 5
Element
J. LAND ACQUISITION STRATEGY (Maximum = 60)
J.1 Local Public Agencies Contr. & Agreements 0 1 4 7 10 14
J.2 Long-Lead Parcel & Utility Adjustment Identification & Acquisition
0 1 5 9 13 15
J.3 Utility Agreement & Joint-Use Contracts 0 1 4 7 10 12 J.4 Land Appraisal Requirements 0 1 3 5 7 10 J.5 Advance Land Acquisition Requirements 0 1 3 5 7 9
CATEGORY J TOTAL
K. PROCUREMENT STRATEGY (Maximum = 47)
K.1 Project Delivery Method & Contracting Strategies 0 1 5 9 13 15 K.2 Long-Lead/Critical Equipment & Materials Identif. 0 1 4 7 10 13 K.3 Procurement Procedures & Plans 0 1 4 7 10 11 K.4 Procurement Responsibility Matrix 0 0 2 4 6 8
CATEGORY K TOTAL
L. PROJECT CONTROL (Maximum = 80)
L.1 Right-of-Way & Utilities Cost Estimates 0 1 3 5 7 10 L.2 Design & Construction Cost Estimates 0 2 8 14 20 25 L.3 Project Cost Control 0 1 5 9 13 15 L.4 Project Schedule Control 0 1 5 9 13 17 L.5 Project Quality Assurance & Control 0 1 4 7 10 13
CATEGORY L TOTAL
M. PROJECT EXECUTION PLAN (Maximum = 83)
M.1 Safety Procedures 0 1 4 7 10 12 M.2 Owner Approval Requirements 0 1 3 5 7 10 M.3 Documentation/Deliverables 0 1 3 5 7 9 M.4 Computing & CADD/Model Requirements 0 1 3 5 7 7 M.5 Design/Construction Plan & Approach 0 1 4 7 10 14 M.6 Intercompany and Interagency Coord. & Agreemnts. 0 1 4 7 10 13 M.7 Work Zone and Transportation Plan 0 1 3 5 7 9 M.8 Project Completion Requirements 0 1 3 5 7 9
CATEGORY M TOTAL
Section III Maximum Score = 270 SECTION III TOTAL
0 = Not Applicable 2 = Minor Deficiencies 4 = Major Deficiencies 1 = Complete Definition 3 = Some Deficiencies 5 = Incomplete or Poor Definition
(Maximum Score = 1000)
129
PDRI ELEMENT DESCRIPTIONS
The following descriptions have been developed to help generate a clear understanding of the terms used in the Un-weighted Project Score Sheet. Some descriptions include checklists of sub-elements to clarify concepts and facilitate ideas when assessing each element. Note that these checklists are not all-inclusive and the user may supplement these lists when necessary.
The descriptions are listed in the same order as they appear in the Un-weighted or Weighted Project Score Sheet. They are organized in a hierarchy by section, category, and element. The Score Sheet consists of three main sections, each of which is a series of categories that have elements. Note that some of the elements have issues listed that are specific to projects that are renovations and revamps and are identified as “Additional items to consider for Renovation & Revamp projects.” Use these issues for discussion if applicable. Scoring is performed by evaluating the definition level of each element.
It should be noted that this tool and these descriptions have been developed to address a variety of types of infrastructure projects that are “horizontal” in nature and connect nodes in different types of infrastructure systems. Three basic varieties of projects are addressed in this tool; those that convey people and freight (such as highways and railroads), those that convey fluids (such as pipelines and open channels), and those that convey energy (such as transmission lines or microwave corridors). For example, a pipeline project may connect a tank farm to a port facility, or transmission lines may connect a power plant to a substation and then to a home or business. Throughout the descriptions, the user will see sub-elements that relate to the variety of projects the tool is meant to encompass. These sub-elements are provided in the order in which they are discussed above. If the sub-element is not applicable to the project that the user is assessing, then it should be ignored. Note: the PDRI-Building Projects (CII Implementation Resource 152-2) and the PDRI-Industrial Projects (CII Implementation Resource 113-2) should be used singly or combined for the vertical (node) aspects of the infrastructure project as deemed appropriate. Detailed user information is provided in Chapter 1 of this document. Particular focus should be maintained to ensure no gaps develop at the interfaces of the vertical and horizontal elements during the FEP process by the project management team. The sections, categories, and elements are organized as follows:
SECTION I – BASIS OF PROJECT DECISION
This section consists of information necessary for understanding the project objectives. The completeness of this section determines the degree to which the project team will be able to achieve alignment in meeting the project’s business objectives.

130
Categories:
A – Project Strategy
B – Owner/Operator Philosophies
C – Project Funding and Timing
D – Project Requirements
E –Value Analysis
SECTION II – BASIS OF DESIGN
This section consists of geotechnical, hydrological, environmental, structural, and other technical design elements that should be evaluated to fully understand their impact on the project and its risk.
Categories:
F – Site Information
G – Location and Geometry
H – Associated Structures and Equipment
I. – Project Design Parameters
SECTION III – EXECUTION APPROACH
This section consists of elements that should be evaluated to fully understand the requirements of the owner’s execution strategy and approaches for detailed design, right of way acquisition, utility adjustments, and construction.
Categories:
J – Land Acquisition Strategy
K – Procurement Strategy
L – Project Control
M – Project Execution Plan
The following pages contain detailed descriptions for each element in the PDRI.
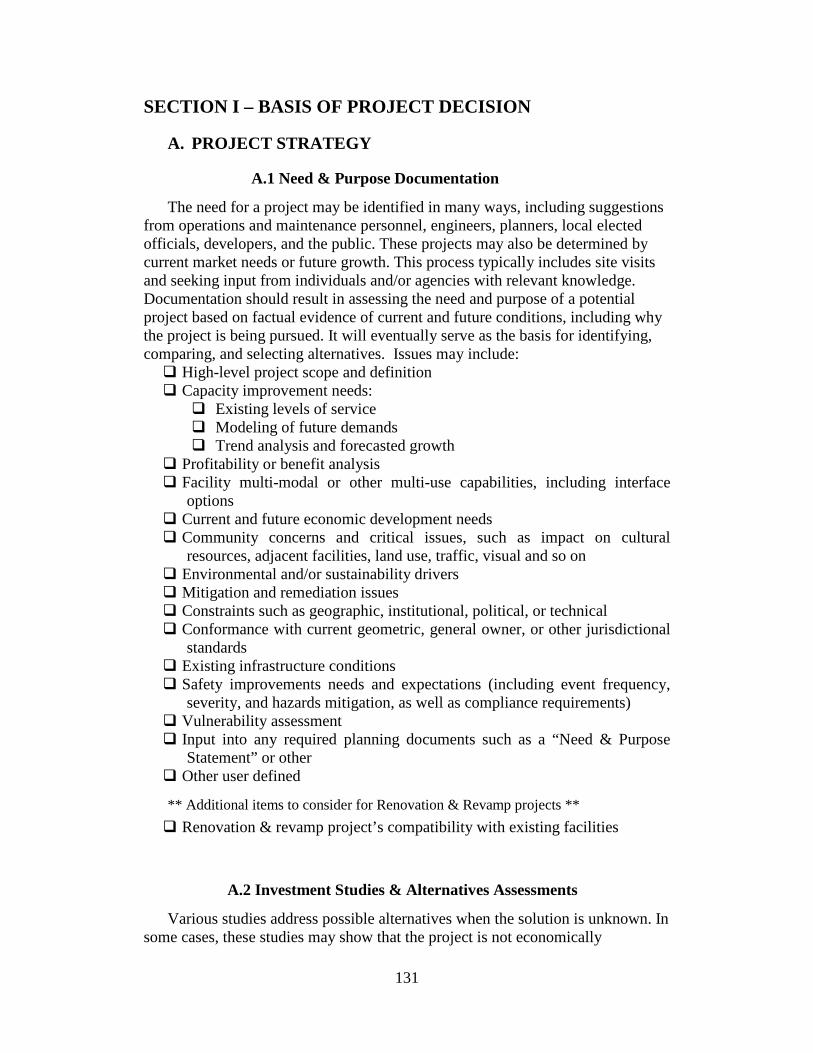
131
SECTION I – BASIS OF PROJECT DECISION
A. PROJECT STRATEGY
A.1 Need & Purpose Documentation
The need for a project may be identified in many ways, including suggestions from operations and maintenance personnel, engineers, planners, local elected officials, developers, and the public. These projects may also be determined by current market needs or future growth. This process typically includes site visits and seeking input from individuals and/or agencies with relevant knowledge. Documentation should result in assessing the need and purpose of a potential project based on factual evidence of current and future conditions, including why the project is being pursued. It will eventually serve as the basis for identifying, comparing, and selecting alternatives. Issues may include:
� High-level project scope and definition � Capacity improvement needs:
� Existing levels of service � Modeling of future demands � Trend analysis and forecasted growth
� Profitability or benefit analysis � Facility multi-modal or other multi-use capabilities, including interface
options � Current and future economic development needs � Community concerns and critical issues, such as impact on cultural
resources, adjacent facilities, land use, traffic, visual and so on � Environmental and/or sustainability drivers � Mitigation and remediation issues � Constraints such as geographic, institutional, political, or technical � Conformance with current geometric, general owner, or other jurisdictional
standards � Existing infrastructure conditions � Safety improvements needs and expectations (including event frequency,
severity, and hazards mitigation, as well as compliance requirements) � Vulnerability assessment � Input into any required planning documents such as a “Need & Purpose
Statement” or other � Other user defined
** Additional items to consider for Renovation & Revamp projects **
� Renovation & revamp project’s compatibility with existing facilities
A.2 Investment Studies & Alternatives Assessments
Various studies address possible alternatives when the solution is unknown. In some cases, these studies may show that the project is not economically
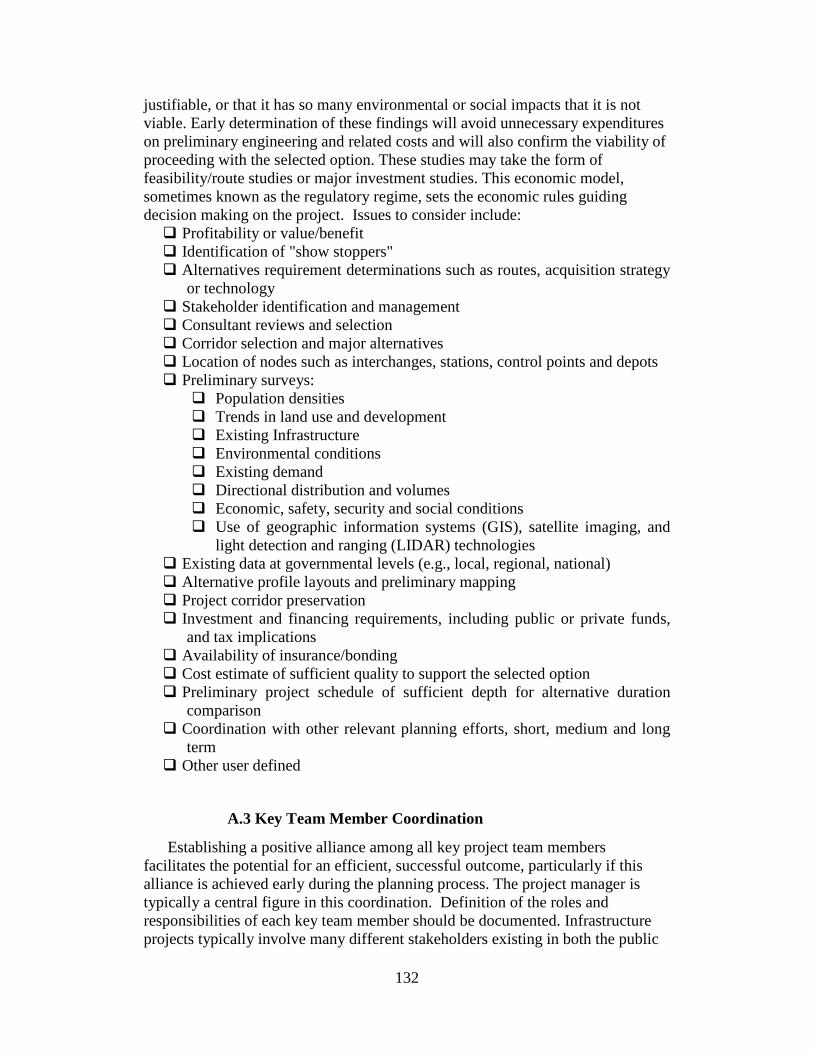
132
justifiable, or that it has so many environmental or social impacts that it is not viable. Early determination of these findings will avoid unnecessary expenditures on preliminary engineering and related costs and will also confirm the viability of proceeding with the selected option. These studies may take the form of feasibility/route studies or major investment studies. This economic model, sometimes known as the regulatory regime, sets the economic rules guiding decision making on the project. Issues to consider include:
� Profitability or value/benefit � Identification of "show stoppers" � Alternatives requirement determinations such as routes, acquisition strategy
or technology � Stakeholder identification and management � Consultant reviews and selection � Corridor selection and major alternatives � Location of nodes such as interchanges, stations, control points and depots � Preliminary surveys:
� Population densities � Trends in land use and development � Existing Infrastructure � Environmental conditions � Existing demand � Directional distribution and volumes � Economic, safety, security and social conditions � Use of geographic information systems (GIS), satellite imaging, and
light detection and ranging (LIDAR) technologies � Existing data at governmental levels (e.g., local, regional, national) � Alternative profile layouts and preliminary mapping � Project corridor preservation � Investment and financing requirements, including public or private funds,
and tax implications � Availability of insurance/bonding � Cost estimate of sufficient quality to support the selected option � Preliminary project schedule of sufficient depth for alternative duration
comparison � Coordination with other relevant planning efforts, short, medium and long
term � Other user defined
A.3 Key Team Member Coordination
Establishing a positive alliance among all key project team members facilitates the potential for an efficient, successful outcome, particularly if this alliance is achieved early during the planning process. The project manager is typically a central figure in this coordination. Definition of the roles and responsibilities of each key team member should be documented. Infrastructure projects typically involve many different stakeholders existing in both the public

133
and private sectors. All key team members must be competent in the project at hand, informed of project decisions, and given the opportunity to attend project planning meetings in order to minimize the impacts on subsequent activities. Key team members may include:
� Planners and programmers � Project management � Design engineering � Project controls � Right-of-way planning � Environmental planning � Construction engineering � Operations and maintenance � Procurement � Marketing/business � Public relations � Consultants � Local, regional, and national governmental authorities, agencies, and
officials � Budgeting officers � Safety � Other user defined
Input into any expected meetings such as a “Feasibility Scoping Meeting”,
“Project Concept Conference”, “Utility Coordination Meetings,” or other should be considered when choosing key team members.
A.4 Public Involvement
Public involvement is an integral part of project development and should be planned and managed. Most infrastructure projects have to afford some level of public involvement to inform the public of project scope issues and to measure public attitudes regarding the development process. The level of public involvement and transparency of operations is dependent upon a number of social, economic, and environmental factors, along with the type and complexity of the project. In general, public involvement, input and interaction are important components of successful infrastructure planning. Community involvement efforts may include meetings with key stakeholders, including contact with affected governmental and non-governmental organizations (NGO), first nation or native inhabitants, property owners, business interests, public meetings, and public hearings. Issues to consider include:
� Policy determinations regarding public involvement � Notification procedures and responsibilities � Identification of key stakeholders � Identification of utility providers � Types of public involvement:
� Press releases and notices � Public meetings/hearings

134
� Individual or group meetings with affected property owners � Local support and/or opposition � Public involvement strategies after project approval � Available website content � Input of public involvement information into any typical deliverables such
as a “Environmental Impact Statements”, “Public Hearing Notices,” or other
� Other user defined
B. OWNER/OPERATOR PHILOSOPHIES
B.1 Design Philosophy
A list of general design principles should be developed to achieve a successful project that fulfills the functional requirements and assimilates into the existing infrastructure system. Issues to consider include:
� Design life � Configuration strategy � Reliability � Failure modes � Design risk analysis � Life cycle cost studies � Safety improvement requirements, (Safety, Health and Environmental
(SH&E), including event frequency, severity, and hazards mitigation, as well as compliance with applicable jurisdictional requirements)
� Security/anti-terrorism enhancements based project vulnerabilities � Sustainability guidelines � Use of existing or new technology � Automation philosophy � Compatibility with other uses or adjacent projects and facilities � Aesthetics or image requirements � Compatibility with long-range goals and other infrastructure improvement
programs � Environmental sustainability � Access management � Geometric/alignment � System validation � Commissioning � Decommissioning strategies � Other user defined
B.2 Operating Philosophy
A list of general design principles should be developed to preserve the level of service desired and at a sufficient capacity over an extended period of time. This particularly focuses on developing strategic operations plans to prevent sub-optimal capacity-related problems. Issues to consider include:
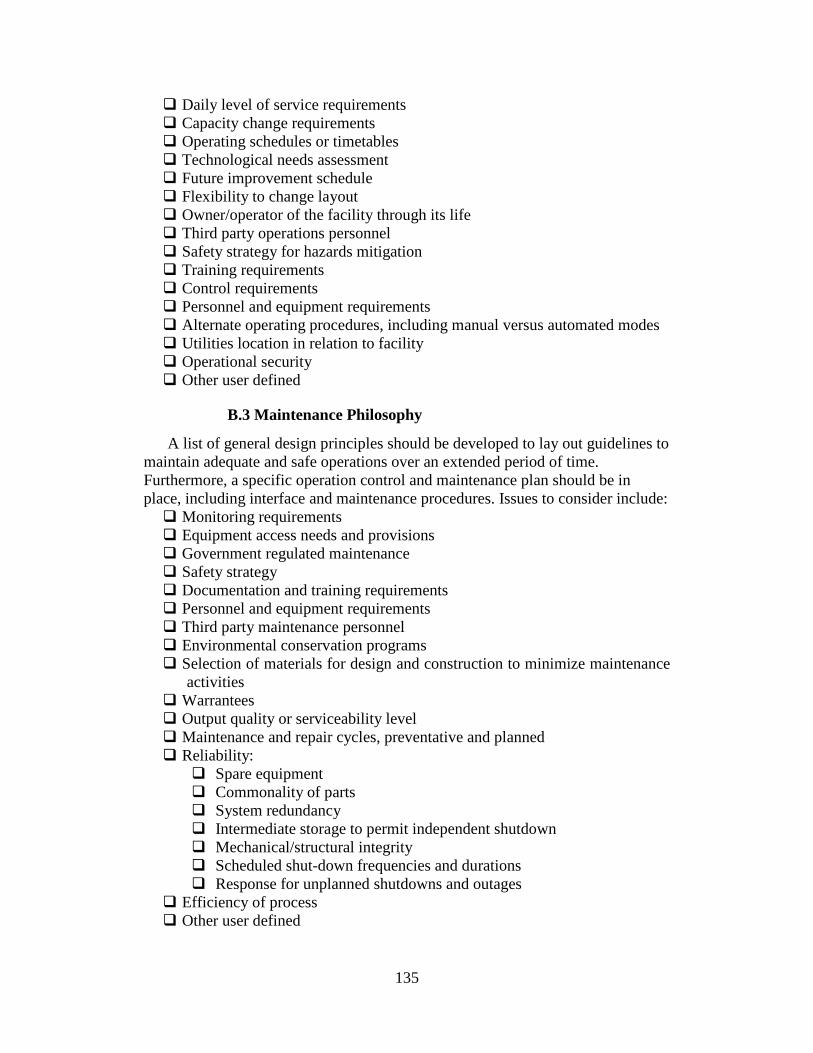
135
� Daily level of service requirements � Capacity change requirements � Operating schedules or timetables � Technological needs assessment � Future improvement schedule � Flexibility to change layout � Owner/operator of the facility through its life � Third party operations personnel � Safety strategy for hazards mitigation � Training requirements � Control requirements � Personnel and equipment requirements � Alternate operating procedures, including manual versus automated modes � Utilities location in relation to facility � Operational security � Other user defined
B.3 Maintenance Philosophy
A list of general design principles should be developed to lay out guidelines to maintain adequate and safe operations over an extended period of time. Furthermore, a specific operation control and maintenance plan should be in place, including interface and maintenance procedures. Issues to consider include:
� Monitoring requirements � Equipment access needs and provisions � Government regulated maintenance � Safety strategy � Documentation and training requirements � Personnel and equipment requirements � Third party maintenance personnel � Environmental conservation programs � Selection of materials for design and construction to minimize maintenance
activities � Warrantees � Output quality or serviceability level � Maintenance and repair cycles, preventative and planned � Reliability:
� Spare equipment � Commonality of parts � System redundancy � Intermediate storage to permit independent shutdown � Mechanical/structural integrity � Scheduled shut-down frequencies and durations � Response for unplanned shutdowns and outages
� Efficiency of process � Other user defined
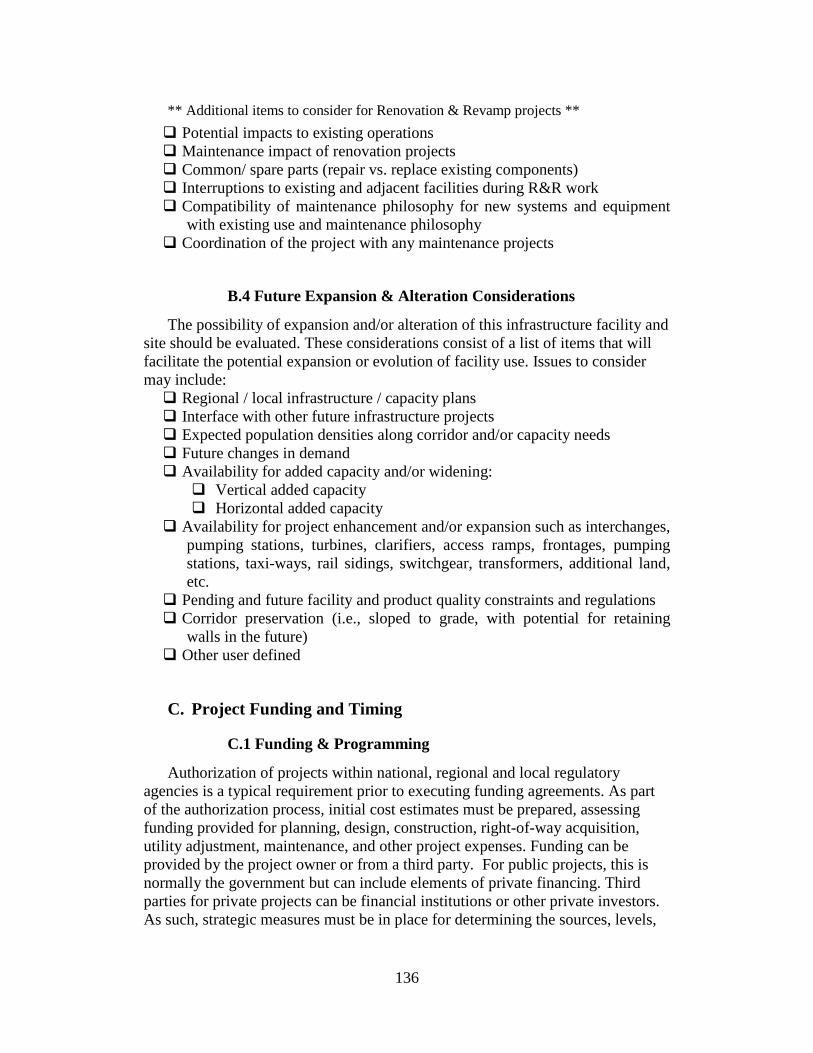
136
** Additional items to consider for Renovation & Revamp projects **
� Potential impacts to existing operations � Maintenance impact of renovation projects � Common/ spare parts (repair vs. replace existing components) � Interruptions to existing and adjacent facilities during R&R work � Compatibility of maintenance philosophy for new systems and equipment
with existing use and maintenance philosophy � Coordination of the project with any maintenance projects
B.4 Future Expansion & Alteration Considerations
The possibility of expansion and/or alteration of this infrastructure facility and site should be evaluated. These considerations consist of a list of items that will facilitate the potential expansion or evolution of facility use. Issues to consider may include:
� Regional / local infrastructure / capacity plans � Interface with other future infrastructure projects � Expected population densities along corridor and/or capacity needs � Future changes in demand � Availability for added capacity and/or widening:
� Vertical added capacity � Horizontal added capacity
� Availability for project enhancement and/or expansion such as interchanges, pumping stations, turbines, clarifiers, access ramps, frontages, pumping stations, taxi-ways, rail sidings, switchgear, transformers, additional land, etc.
� Pending and future facility and product quality constraints and regulations � Corridor preservation (i.e., sloped to grade, with potential for retaining
walls in the future) � Other user defined
C. Project Funding and Timing
C.1 Funding & Programming
Authorization of projects within national, regional and local regulatory agencies is a typical requirement prior to executing funding agreements. As part of the authorization process, initial cost estimates must be prepared, assessing funding provided for planning, design, construction, right-of-way acquisition, utility adjustment, maintenance, and other project expenses. Funding can be provided by the project owner or from a third party. For public projects, this is normally the government but can include elements of private financing. Third parties for private projects can be financial institutions or other private investors. As such, strategic measures must be in place for determining the sources, levels,
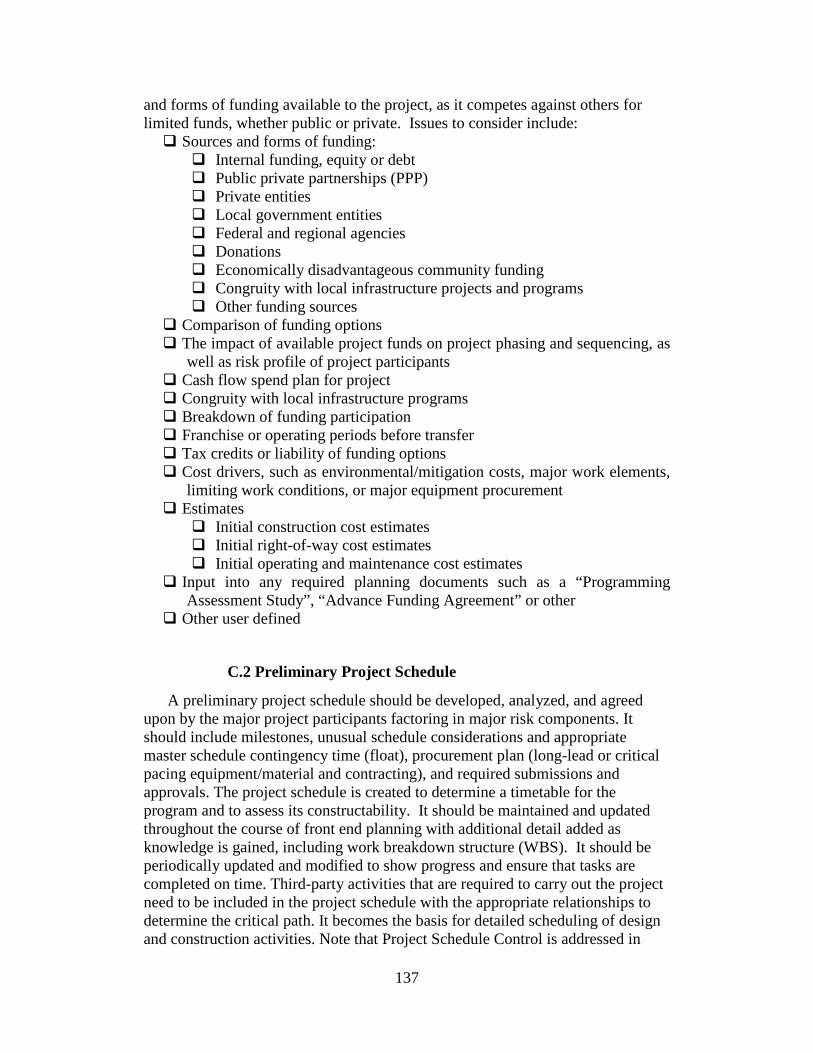
137
and forms of funding available to the project, as it competes against others for limited funds, whether public or private. Issues to consider include:
� Sources and forms of funding: � Internal funding, equity or debt � Public private partnerships (PPP) � Private entities � Local government entities � Federal and regional agencies � Donations � Economically disadvantageous community funding � Congruity with local infrastructure projects and programs � Other funding sources
� Comparison of funding options � The impact of available project funds on project phasing and sequencing, as
well as risk profile of project participants � Cash flow spend plan for project � Congruity with local infrastructure programs � Breakdown of funding participation � Franchise or operating periods before transfer � Tax credits or liability of funding options � Cost drivers, such as environmental/mitigation costs, major work elements,
limiting work conditions, or major equipment procurement � Estimates
� Initial construction cost estimates � Initial right-of-way cost estimates � Initial operating and maintenance cost estimates
� Input into any required planning documents such as a “Programming Assessment Study”, “Advance Funding Agreement” or other
� Other user defined
C.2 Preliminary Project Schedule
A preliminary project schedule should be developed, analyzed, and agreed upon by the major project participants factoring in major risk components. It should include milestones, unusual schedule considerations and appropriate master schedule contingency time (float), procurement plan (long-lead or critical pacing equipment/material and contracting), and required submissions and approvals. The project schedule is created to determine a timetable for the program and to assess its constructability. It should be maintained and updated throughout the course of front end planning with additional detail added as knowledge is gained, including work breakdown structure (WBS). It should be periodically updated and modified to show progress and ensure that tasks are completed on time. Third-party activities that are required to carry out the project need to be included in the project schedule with the appropriate relationships to determine the critical path. It becomes the basis for detailed scheduling of design and construction activities. Note that Project Schedule Control is addressed in

138
Element L.4. This schedule should involve obtaining early input from and assign responsibility to:
� Owner/Operations � Program/Project Management � Design/Engineering � Construction � Procurement � Other user defined
** Additional items to consider for Renovation & Revamp (R&R) projects **
� The schedule should contain input from the traffic or flow control management to coordinate disruptions
R&R projects require a high level of planning to minimize risk because they interface with existing operations and are many times performed in conjunction with other on-going projects. Shutdowns/turnarounds/outages are special cases in that they are particularly constrained in terms of time and space, requiring very detailed plans and schedules.
C.3 Contingencies
Project risks must be identified and understood so that proper contingencies can be allocated and maintained in order to mitigate unforeseen issues. The contingency management process should effectively communicate the contingency magnitude and confidence level to all appropriate stakeholders. Estimates are used to plan and budget the project from the earliest stages of planning, and are essential in managing project contingency. It is important to have estimates of the proper accuracy, consistency, and clarity at the right phase of the planning process. Contingencies are forecasted and adjusted throughout the planning process based on level of confidence in the current estimate accuracy. It is also important to assign ownership of the different contingency allocations (such as management reserve, project contingency and contractor contingency) for the project, as well as authority to release these funds. (Note that final Cost Estimates for the planning phase are covered in Elements L1. and L.2 Project Cost Control is addressed in Element L.3.) Issues to consider:
Estimates evolve in terms of accuracy and may be based on: � Order-of-magnitude cost model � Benchmarks � Parametric cost estimates (e.g., $/unit) � Unit Price estimate � Detailed element cost estimate
Contingency set aside may include funds and/or schedule for uncertainty in: � Weather � Scope Changes � Unforeseen site conditions � Extended overhead for potential project delays � Critical Path impact

139
� Market conditions � Commodity pricing � Currency exchange rates � Escalation pricing � Contracting strategy � Labor availability � Labor competency � Project location � Political stability � Definition of project � Other user defined
D. PROJECT REQUIREMENTS
D.1 Project Objectives Statement
This statement defines the project objectives and priorities for meeting the business strategy, including project need and purpose. It should be clear, concise, measurable, and specific to the project. It is desirable to obtain consensus from the entire project team regarding these objectives and priorities to ensure alignment. Specifically, the priorities among cost, schedule, and value-added quality features should be clear. To ensure the project is aligned to the applicable objectives, the following should be considered:
� Stakeholder’s understanding of objectives, including questions or concerns � Constraints or limitations placed on the project � Typical objectives with associated performance metrics:
� Safety � Quality � Cost � Schedule including milestones � Technology usage � Capacity or size � Startup or commissioning � Communication � Operational performance � Maintainability � Security � Sustainability, including possible certification (for example, by the
U.S. Green Building Council) � Other user defined
D.2 Functional Classification & Use
An essential step in the design process is to determine the functions that the project is to serve, including how the product or service will be conveyed
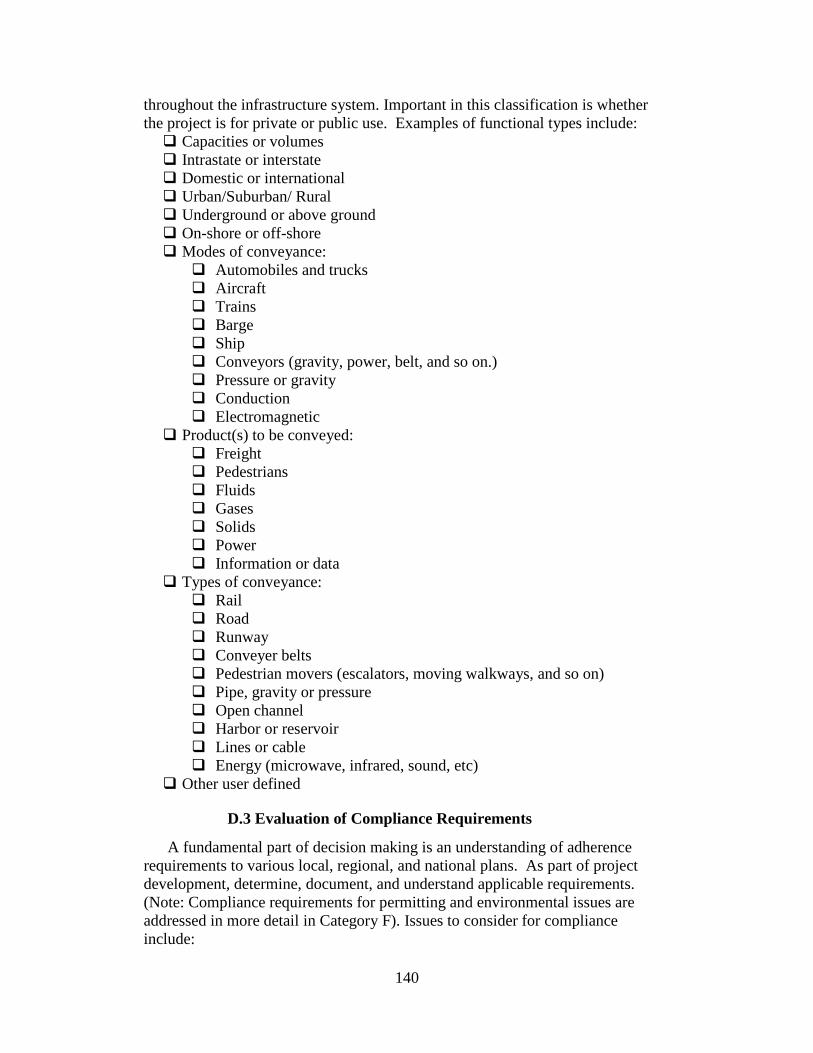
140
throughout the infrastructure system. Important in this classification is whether the project is for private or public use. Examples of functional types include:
� Capacities or volumes � Intrastate or interstate � Domestic or international � Urban/Suburban/ Rural � Underground or above ground � On-shore or off-shore � Modes of conveyance:
� Automobiles and trucks � Aircraft � Trains � Barge � Ship � Conveyors (gravity, power, belt, and so on.) � Pressure or gravity � Conduction � Electromagnetic
� Product(s) to be conveyed: � Freight � Pedestrians � Fluids � Gases � Solids � Power � Information or data
� Types of conveyance: � Rail � Road � Runway � Conveyer belts � Pedestrian movers (escalators, moving walkways, and so on) � Pipe, gravity or pressure � Open channel � Harbor or reservoir � Lines or cable � Energy (microwave, infrared, sound, etc)
� Other user defined
D.3 Evaluation of Compliance Requirements
A fundamental part of decision making is an understanding of adherence requirements to various local, regional, and national plans. As part of project development, determine, document, and understand applicable requirements. (Note: Compliance requirements for permitting and environmental issues are addressed in more detail in Category F). Issues to consider for compliance include:
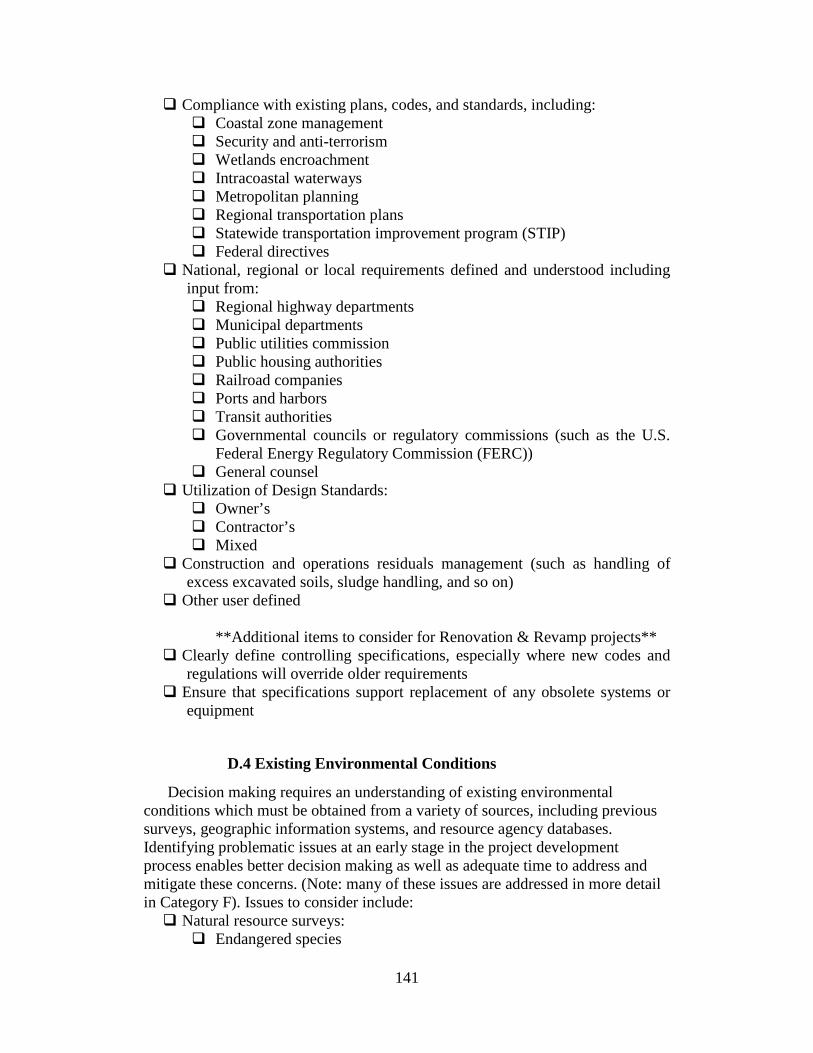
141
� Compliance with existing plans, codes, and standards, including: � Coastal zone management � Security and anti-terrorism � Wetlands encroachment � Intracoastal waterways � Metropolitan planning � Regional transportation plans � Statewide transportation improvement program (STIP) � Federal directives
� National, regional or local requirements defined and understood including input from: � Regional highway departments � Municipal departments � Public utilities commission � Public housing authorities � Railroad companies � Ports and harbors � Transit authorities � Governmental councils or regulatory commissions (such as the U.S.
Federal Energy Regulatory Commission (FERC)) � General counsel
� Utilization of Design Standards: � Owner’s � Contractor’s � Mixed
� Construction and operations residuals management (such as handling of excess excavated soils, sludge handling, and so on)
� Other user defined **Additional items to consider for Renovation & Revamp projects**
� Clearly define controlling specifications, especially where new codes and regulations will override older requirements
� Ensure that specifications support replacement of any obsolete systems or equipment
D.4 Existing Environmental Conditions
Decision making requires an understanding of existing environmental conditions which must be obtained from a variety of sources, including previous surveys, geographic information systems, and resource agency databases. Identifying problematic issues at an early stage in the project development process enables better decision making as well as adequate time to address and mitigate these concerns. (Note: many of these issues are addressed in more detail in Category F). Issues to consider include:
� Natural resource surveys: � Endangered species

142
� Wetland status � Bodies of water � Existing and potential park system land � Permit requirements
� Cultural resource surveys: � Historical preservation � Existence of cemeteries � Archaeological sites � Local customs
� Air quality surveys: � Mobile source pollutants � Air quality analysis � Congestion mitigation-air quality
� Noise surveys including evaluation of need for abatement � Hazardous materials:
� Existing land use (for example, the existence of an underground storage tank)
� Superfund and regulatory agency database review � Contaminated material, not classified as hazardous � Climatic data � Site visits � Local inhabitant interviews � Socioeconomic impacts � Other user defined
D.5 Site Characteristics Available vs. Required
An assessment of the available versus the required site characteristics is needed. The intent is to ensure that the project team has taken into consideration the need to improve or upgrade existing site utilities and support characteristics. Issues to consider should include:
� Capacity: � Utilities � Fire water � Cooling water � Power
� Waste treatment/disposal � Storm water containment and/or transport system � Type of buildings/structures � Land area � Amenities:
� Food service � Change rooms � Medical facilities � Recreation facilities � Ambulatory access
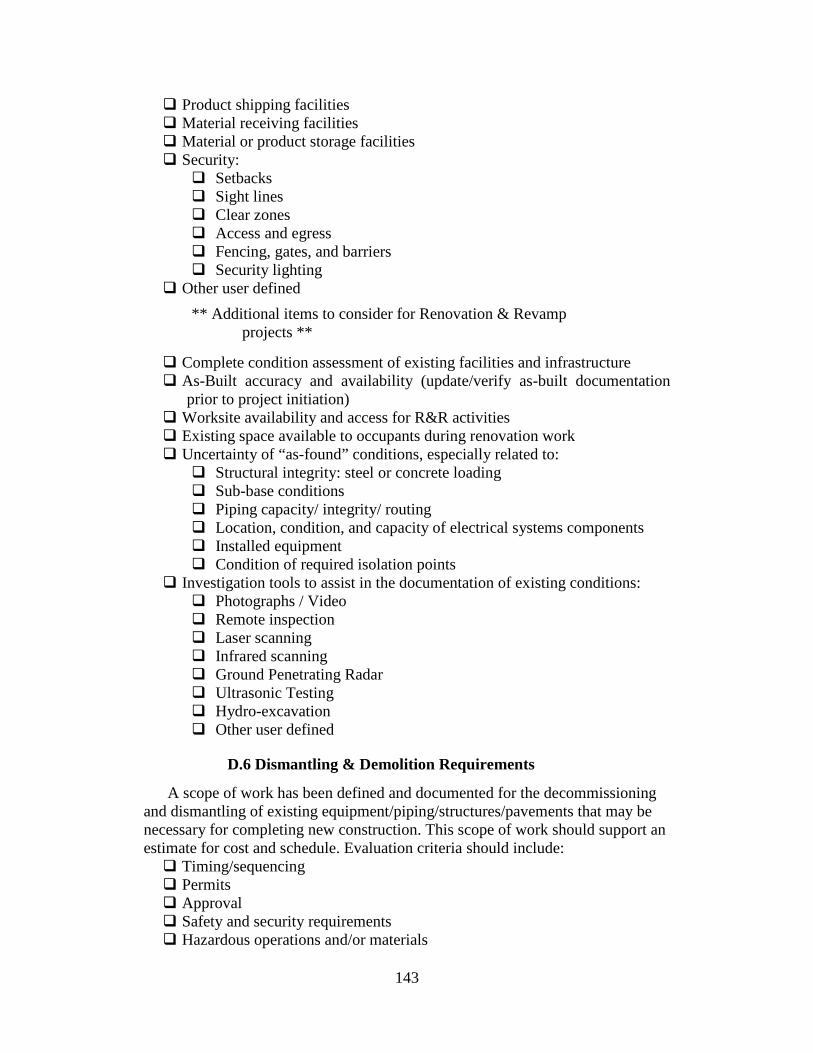
143
� Product shipping facilities � Material receiving facilities � Material or product storage facilities � Security:
� Setbacks � Sight lines � Clear zones � Access and egress � Fencing, gates, and barriers � Security lighting
� Other user defined
** Additional items to consider for Renovation & Revamp projects **
� Complete condition assessment of existing facilities and infrastructure � As-Built accuracy and availability (update/verify as-built documentation
prior to project initiation) � Worksite availability and access for R&R activities � Existing space available to occupants during renovation work � Uncertainty of “as-found” conditions, especially related to:
� Structural integrity: steel or concrete loading � Sub-base conditions � Piping capacity/ integrity/ routing � Location, condition, and capacity of electrical systems components � Installed equipment � Condition of required isolation points
� Investigation tools to assist in the documentation of existing conditions: � Photographs / Video � Remote inspection � Laser scanning � Infrared scanning � Ground Penetrating Radar � Ultrasonic Testing � Hydro-excavation � Other user defined
D.6 Dismantling & Demolition Requirements
A scope of work has been defined and documented for the decommissioning and dismantling of existing equipment/piping/structures/pavements that may be necessary for completing new construction. This scope of work should support an estimate for cost and schedule. Evaluation criteria should include:
� Timing/sequencing � Permits � Approval � Safety and security requirements � Hazardous operations and/or materials
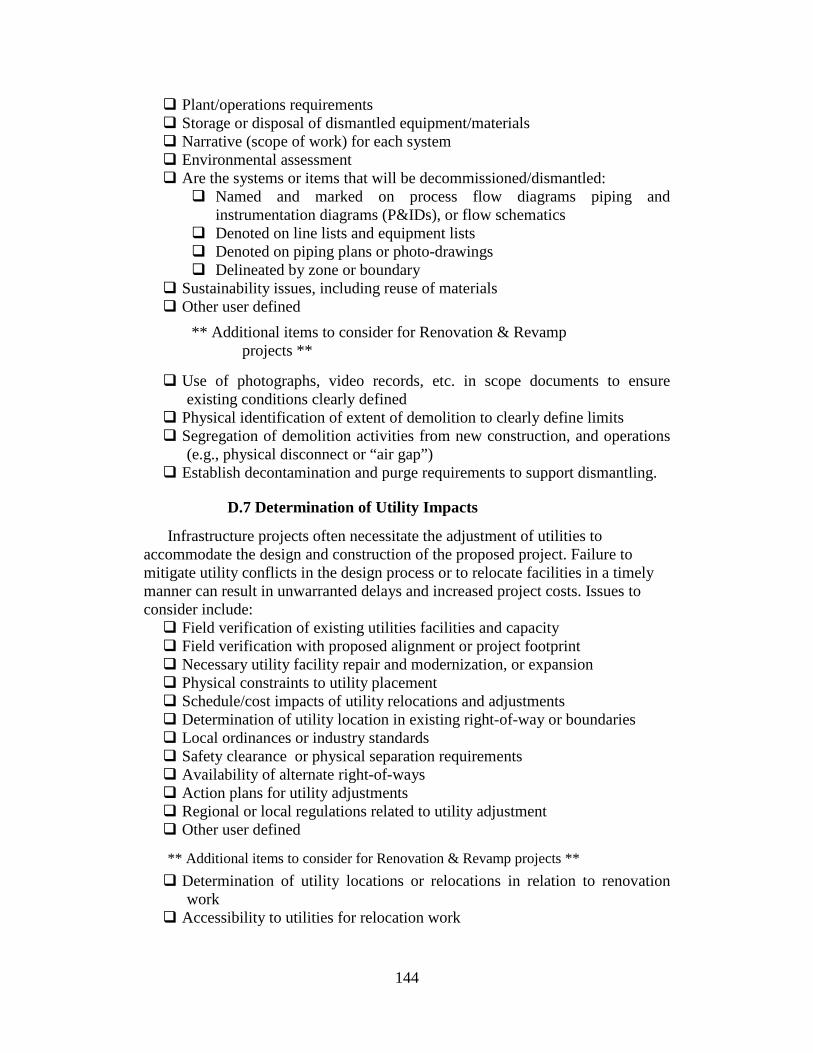
144
� Plant/operations requirements � Storage or disposal of dismantled equipment/materials � Narrative (scope of work) for each system � Environmental assessment � Are the systems or items that will be decommissioned/dismantled:
� Named and marked on process flow diagrams piping and instrumentation diagrams (P&IDs), or flow schematics
� Denoted on line lists and equipment lists � Denoted on piping plans or photo-drawings � Delineated by zone or boundary
� Sustainability issues, including reuse of materials � Other user defined
** Additional items to consider for Renovation & Revamp projects **
� Use of photographs, video records, etc. in scope documents to ensure existing conditions clearly defined
� Physical identification of extent of demolition to clearly define limits � Segregation of demolition activities from new construction, and operations
(e.g., physical disconnect or “air gap”) � Establish decontamination and purge requirements to support dismantling.
D.7 Determination of Utility Impacts
Infrastructure projects often necessitate the adjustment of utilities to accommodate the design and construction of the proposed project. Failure to mitigate utility conflicts in the design process or to relocate facilities in a timely manner can result in unwarranted delays and increased project costs. Issues to consider include:
� Field verification of existing utilities facilities and capacity � Field verification with proposed alignment or project footprint � Necessary utility facility repair and modernization, or expansion � Physical constraints to utility placement � Schedule/cost impacts of utility relocations and adjustments � Determination of utility location in existing right-of-way or boundaries � Local ordinances or industry standards � Safety clearance or physical separation requirements � Availability of alternate right-of-ways � Action plans for utility adjustments � Regional or local regulations related to utility adjustment � Other user defined
** Additional items to consider for Renovation & Revamp projects **
� Determination of utility locations or relocations in relation to renovation work
� Accessibility to utilities for relocation work

145
D.8 Lead/Discipline Scope of Work
Project manager's complete narrative description of the project laying out the major components of work to be accomplished, generally discipline oriented, should be developed and oriented towards the architect/engineer/contracting agent. This narrative should be tied to a high level Work Breakdown Structure (WBS) for the project. Items to consider would include:
� Background information � Project summary � High level WBS � Level of requirements development by each discipline � Sequencing of work � Interface issues for various contractors, contracts, or work packages � Exclusions and limitations to the scope of work � Other user defined
** Additional items to consider for Renovation & Revamp projects **
� Identification of specific interface or coordination efforts with operations and owner’s staff
E. VALUE ANALYSIS
E.1 Value Engineering Procedures
Procedures for conducting Value Engineering (VE) during front end planning and later in the project during design and construction need to be in place. VE methodology should be used to assess a project's overall effectiveness or how well the project meets identified needs. VE is designed to gather expertise and experience of individuals to produce the most effective solution to the conveyance need. For instance, study findings may show that redesign of an alternative is needed, in which case concepts or schematics may require revisions. Issues to consider include:
� Policy requirements and procedures � Team member and team leader identification � Session attendance requirements � Frequency of assessments � Documentation requirements � Strategic resource collection and studies:
� Lessons learned review � Redundancy factors � Over capacity factors � Life-cycle and replacement costs � Environmental impact resolution
� Report preparation and recommendations � Approved response submittals � Planning document revisions

146
� Other user defined
E.2 Design Simplification
Procedures for conducting design simplification during front end planning and later in the project need to be in place. Identify and document activities or strategies (through studies, reviews) for reducing the number of process steps, number of interchanges, number of bridges, length of route, extent of right-of-way, or the amount of equipment needed in the design in order to optimize performance without compromising safety, function, reliability and security. Items to evaluate include:
� Redundancies � Overcapacity � Horizontal or vertical alignment � Above or below ground or water � Retaining walls versus embankments � Commonality � Flexibility � Discretionary scope issues � Discretionary spares � Controls simplification � Other user defined
E.3 Material Alternatives Considered
A structured approach should be in place to consider and select among material alternatives, including sustainability considerations during front end planning and as the project progresses. Rejected material alternatives should be documented. Material evaluation should include:
� Cost effective materials of construction � Life-cycle analysis, including operations and maintenance considerations � Modularized or pre-fabricated components � Ease or cost effectiveness during construction � Sustainability considerations (such as use of local materials, pollution
abating concrete, recycled materials, LED lighting, and so on) � Environment in which materials are to be installed or operated (such as
heat, humidity, corrosive, etc.) � Other user defined
E.4 Constructability Procedures
A structured process and procedures should be in place for constructability analysis during front end planning and as the project proceeds into design and construction. CII defines constructability as, “the optimum use of construction knowledge and experience in planning, design, procurement, and field operations to achieve overall project objectives. Maximum benefits occur when people with construction knowledge and experience become involved at the very beginning of

147
a project.” Provisions have been made to provide this on an ongoing basis. This process includes examining design options that minimize construction costs while maintaining standards of safety, security, quality, and schedule. This process should be initiated in the front end planning process during concept or detailed scope definition. Elements of constructability during front end planning include:
� Constructability program in existence � Construction knowledge/experience used in project planning � Early construction involvement in contracting strategy development � Developing a construction-sensitive project schedule (with operations input
and considering operational needs) � Considering major construction methods in basic design approaches � Developing site layouts for efficient construction � Early identification of project team participants for constructability analysis � Usage of advanced information technologies � Other user defined
** Additional items to consider for Renovation & Revamp projects **
� Installability (e.g., smaller components/modules/pre-assembly to facilitate installation in congested areas)
� Opportunities to perform as much work as possible outside of shutdowns or outages
� Developing an operations-sensitive project schedule (e.g., minimization of Shutdown/Turnaround work and hot work in operating areas, reduction of traffic disruption at high volume times and so on)

148
SECTION II – BASIS OF DESIGN
F. SITE INFORMATION
F.1 Geotechnical Characteristics
Geotechnical and soil test evaluations of the project footprint should be developed. Ways in which the project will be impacted by geotechnical characteristics should be considered. Items to evaluate and consider include:
� General site descriptions (e.g., terrain, spoil removals, areas of hazardous waste)
� Collection of all previous geotechnical investigation data � Soil composition and strata structure � Potential soil expansion considerations � Soil densities and compaction requirements � Seismic requirements, including liquefaction potential � Foundation requirements:
� Allowable bearing capacities � Pier/pile capacities
� Water table � Groundwater flow rates and directions � Soil percolation rate and conductivity � Karst formations, caves or mines � Man-made/abandoned facilities � Existing foundations or subsurface structures � Existing or abandoned landfills � Existing or abandoned cemeteries � Site characterization to identify areas of hazardous or toxic soils � Soil treatment and remediation needs � Soil boring tests and test pits � Horizontal directional drilling versus open cut � Geological Baseline Reports (GBR) � Other user defined
F.2 Hydrological Characteristics
Hydraulic information should be reviewed and analyzed at a high level prior to selection of alternatives and detailed design. This information is necessary for determining hydraulic structural requirements and detention facilities, as well as preliminary right-of-way requirements. Issues to consider include:
� Drainage basin characteristics: � Size, shape, and orientation � Slope of terrain � Groundwater � Watershed development potential � Geology � Surface infiltration

149
� Antecedent moisture condition � Storage potential (e.g., overbank, wetlands, ponds, reservoirs,
channels) � Flood plain characteristics � Waves, tides, and currents � Soil types and characteristics � Cathodic protection requirements � Ground cover and erosion concerns, including scour susceptibility � Meteorological characteristics:
� Precipitation types and amounts � Peak flow rates � Hydrographs � Special precipitation concerns � Storm water runoff control
� Potential impacts of future development � Impacted communities or agencies such as watershed districts/regulations � Other user defined
F.3 Surveys & Mapping
Once it has been determined that a corridor or site needs to be studied, a reconnaissance of the corridor/site should be conducted. This includes a study of the entire area. The study facilitates the development of one or more routes or corridors or location options in sufficient detail to enable appropriate officials to recommend which will provide the optimum location. Issues to consider include:
� Existing geographic/mapping information from general sources or previous study, including geographical information system data
� Right-of-entry requirements � Surveying consultant requirements � Aerial photography from general sources or previous studies and surveys � Regional demographic maps, identifying areas of special impact � Existing right-of-way maps/inventory, including easements � Preliminary survey, including recovery of existing monuments � Topography (contours) � Existing structure locations � Grid ticks and centerlines � Geotechnical summaries � Utility information � Satellite/Light Detection and Ranging (LIDAR) surveys � Affected area maps � Special property owner concerns � Use of Subsurface Utility Engineers (SUE) � Other user defined
F.4 Permitting Requirements
Permitting usually begins concurrently with surveys and continues throughout project construction. Personnel responsibilities should be specific to each permit
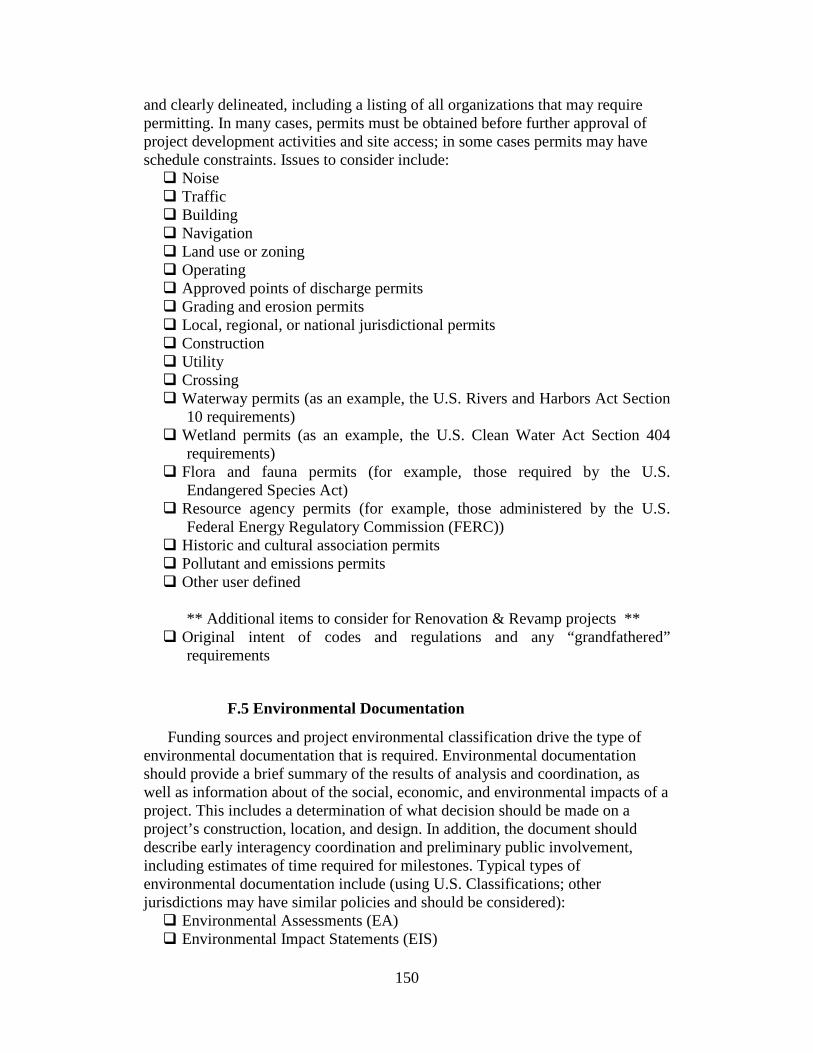
150
and clearly delineated, including a listing of all organizations that may require permitting. In many cases, permits must be obtained before further approval of project development activities and site access; in some cases permits may have schedule constraints. Issues to consider include:
� Noise � Traffic � Building � Navigation � Land use or zoning � Operating � Approved points of discharge permits � Grading and erosion permits � Local, regional, or national jurisdictional permits � Construction � Utility � Crossing � Waterway permits (as an example, the U.S. Rivers and Harbors Act Section
10 requirements) � Wetland permits (as an example, the U.S. Clean Water Act Section 404
requirements) � Flora and fauna permits (for example, those required by the U.S.
Endangered Species Act) � Resource agency permits (for example, those administered by the U.S.
Federal Energy Regulatory Commission (FERC)) � Historic and cultural association permits � Pollutant and emissions permits � Other user defined
** Additional items to consider for Renovation & Revamp projects **
� Original intent of codes and regulations and any “grandfathered” requirements
F.5 Environmental Documentation
Funding sources and project environmental classification drive the type of environmental documentation that is required. Environmental documentation should provide a brief summary of the results of analysis and coordination, as well as information about of the social, economic, and environmental impacts of a project. This includes a determination of what decision should be made on a project’s construction, location, and design. In addition, the document should describe early interagency coordination and preliminary public involvement, including estimates of time required for milestones. Typical types of environmental documentation include (using U.S. Classifications; other jurisdictions may have similar policies and should be considered):
� Environmental Assessments (EA) � Environmental Impact Statements (EIS)
151
� Environmental Impact Report (EIR) � Categorical Exclusions (CE) � Potential Outcomes:
� Findings of No Significant Impact (FONSI) � Notice of Intent (NOI) � Record of Decision (ROD) � Categorical Exclusion (CE)
� Section 4F Documentation (e.g., parks and recreation areas, refuges, cultural resources, and other sites)
� Environmental monitoring � Environmental constraints should be incorporated into preliminary right-of-
way maps and schematics (as described in Element F.7). � Other user defined (Note: All jurisdictions have specific environmental policies and requirements
that need to be understood by planners. For example, the U. S. National Environmental Policy Act (NEPA) requires three levels of environmental analysis. At the first level, an undertaking may be categorically excluded (CE) from a detailed environmental analysis if it meets certain criteria that a federal agency has previously determined as having no significant environmental impact. At the second level of analysis, a federal agency prepares a written Environmental Assessment (EA) to determine whether or not a federal undertaking would significantly affect the environment. If this is not the case, the agency issues a Finding of No Significant Impact (FONSI). An Environmental Impact Statement (EIS) is a more detailed evaluation of the proposed action and alternatives. A Notice of Intent (NOI) announces an agency’s decision to prepare an EIS for a particular action and must be published in the Federal Register. The public, other federal agencies and outside parties may provide input into the preparation of an EIS and then comment on the draft EIS when it is completed. Following the Final EIS, the agency will prepare a Record of Decision (ROD).)
F.6 Environmental Commitments & Mitigation
Environmental commitments determine what a project’s involved parties can and cannot do to protect the environment. Environmental commitments begin at the earliest phase of project development, although completion of commitments may not occur until the operation and maintenance phase of a project. Because there is a substantial time gap between the beginning and end of a commitment, it is imperative that commitments are communicated from environmental clearance through detailed design, pre-bid conference, project letting, maintenance, and operation. Issues to consider include:
� Avoidance commitments � Compensation commitments � Enhancements commitments � Minimization commitments � Habitat mitigation � Water quality facilities management

152
� Wetland mitigation � Storm water management plans � Cultural resources mitigation � Noise abatement remediation � Hazardous materials abatement locations � Environmental remediation plans � Other user defined
F.7 Property Descriptions
Property descriptions are prepared as exhibits for the conveyance of property interests that will be affected. The property descriptions reflect a boundary survey showing ownership including legal descriptions, as well as parcel plat determinations. Property descriptions should be summarized from survey information into an appropriate documentation form that can be logged into project information systems. The level of confidence and validation of the documentation such as field verified versus scaled from existing maps should be noted. Information needed includes:
� Type of property or businesses affected � Historical data used in preparing the survey � Parcel plats � Parcel size and area � Control reference point data � Easements � Centerline station ties � Control of access lines � Gates, fences and barriers � County, city, federal or other jurisdictional boundary lines � Review of existing right-of-way maps from previous projects � On-site canvas of the proposed affected properties � Appraisal maps and records � Abstractor's indices � Real property records � Mineral and water rights � Other user defined
F.8 Right-of-Way Mapping & Site Issues
A right-of-way map is a compilation of internal data, property descriptions (which includes field notes and parcel plats), appraisal information, and improvements related to the project. Right-of-way maps are typically internal planning and management documents, with significant impact on the project development process. Preparation of these maps normally begins after obtaining schematic design approval. Parcels that may cause difficulties in acquisition should be identified, including indications of specific site conditions or characteristics that may cause delays or problems. Issues to consider include:
� Parcel numbers and priority � Existing site information:
153
� Improvements within right-of-way � Previous uses of land � Zoning � Utility locations � Record ownership data of adjacent properties � Existing boundaries and limits � Existing drainage channels and easements
� Design information: � Access control lines � Configuration of infrastructure project � Hydraulics � Maintenance access or connecting ramps � Limit of flood pool
� Parcel information: � Property owner name � Parcel title requirements � Parcel number � Parent tract � Type of conveyance, if known (e.g., donation, negotiation,
condemnation) � Station to station limits and offset � Area in acres and/or square feet � Area of uneconomic remainders � Property lines � Bearing and distance to control points � Property descriptions
� Inherent parcel issues that may cause difficulties in right-of-way acquisition: � Landfill and superfund records � Hazardous material exposure, such as Poly-chlorinated biphenyls
(PCB) transformers or underground storage tank locations � Wetlands identification � Floodway identification � Endangered species locations � Stockpiles and production sites � Outfall locations � Oil and gas well piping � Railroad and/or roadway interests � Special use properties (e.g., government use, alcohol sales, cemeteries,
etc.) � Beautification and signage � Land use impacts � Socioeconomic impacts � Economic development/speculation � Legal (lawyer) activity in area � Title curative issues

154
� National, regional or locally owned properties � Number of partial takings � Splitting of parcels � Landlocked parcels � Existing easements � Cultural issues � Public park space � Cultural resources � Historical landmarks � Archeologically sensitive sites
� Other user defined
G. LOCATION and GEOMETRY
G.1 Schematic Layouts
The submission of schematic layouts should include basic information necessary for the proper review and evaluation of the proposed improvement. The schematic is essential for use in public meetings and coordinating design features. Format and delivery should be tailored to the audience. Issues to consider include:
� General project information (e.g., boundary limits, speed or volume, classification)
� Location of structures such as interchanges, main lanes, frontages, ramps, levees, channels, ditches, dam structures, towers, utilities, drainage structures, and so on
� Signage schematics � Profiles and alignments � Overhead and underground right-of-way � Added or future capacity analyses � Tentative right-of-way limits � Geometrics � Location of retaining and noise abatement walls � Projected capacities � Control of access during and after construction � Existing structures and removal of improvements � Master plan zoning map � Soils Maps � Cut and fill balance � Jurisdictional map � Watershed / water basin delineation � Other user defined Location/arrangement drawings identify the location of each major project
item including equipment, support structure or miscellaneous elements. These drawings should.include:
� Location, including coordinates
155
� Coordination of location among all items � Setbacks � Interface � Elevation views � Visibility or line of sight � Access � Other user defined
** Additional items to consider for Renovation & Revamp projects **
� Renovation work in relation to existing structures and demolition � Detours or bypasses � Temporary conveyance facilities � Clearly identify existing systems and equipment to be removed or
rearranged, or to remain in place
G.2 Horizontal & Vertical Alignment
Due to the near permanent nature of the right-of-way alignment once the infrastructure project is constructed, it is important that the proper alignment be selected considering design speed, pressure pipe hydraulics, open channel hydraulic parameters, existing and future roadside or adjacent development, subsurface conditions, topography, etc. Issues to consider include:
� Horizontal geometry � Vertical geometry � Design exceptions or waivers identified and validated � Pipeline or power line corridors and easements � Sight distances � Geometry referenced to a surveying control system � Crossover grades and profiles � Vertical lift � Vertex data � Grade restrictions � Access to target users or market � Proximity to raw materials � Natural corridors � Upstream and downstream control structures/parameters � Social/political constraints � Constrained right-of-way zones areas (choke points) � River, lake or ocean crossings, including landfall or transitions � Existing above-ground and underground utilities, especially in dense urban
areas � Horizontal Directional Drilling (HDD) / tunneling feasibility � Other user defined
156
G.3 Cross-Sectional Elements
Cross-sections are an important design element related to cost and schedule of the proposed project. The width of the right-of-way will be controlled by the proposed design. Examination of the typical cross-section will indicate those elements of design affecting the width of proposed right-of-way and utility adjustments among other factors. Issues to consider include:
� Maintenance access � Cut or fill slopes � Easements � Horizontal clearances to obstructions � Pavement cross slopes � Frontage roads and ramp radii � Sidewalks and pedestrian elements � Noise abatement (for example walls, structures, or operating limitations) � Number and width of road lanes � Width of median � Width of shoulder � Pipeline support berm width � Extent of berm areas � Channel levee widths � Cross drainage structures � Extent of side slopes and ditches, including levees and dams � Linear profile for hydraulic/hydrostatic testing � Channel routing models � Other user defined
G.4 Control of Access
Maintaining access to specific portions of the infrastructure project is developed in front end planning for both construction and permanent access. Planners need to address the concerns of controlled access limits to and from adjacent property or facilities. Access control should be coordinated with right-of-way acquisition including access deeds and restrictions. Issues to consider include:
� Entrance/exit locations and length � Growth capacity � Access deed restrictions � Safety and security of access � Trunk tie-ins � Special required access lanes:
� Bike and pedestrian lanes � High Occupancy Vehicle (HOV)/High Occupancy Toll (HOT) lanes � Truck-only lanes � Crossover lanes or access � Turnarounds
� Frontage road requirements
157
� Controlled access systems, including life safety requirements � Split-parcel access requirements � Driveway access requirements � Waiting lanes or rails � Bypasses � Access to runways � Intermodal interface � Pumping or support stations � Valve tie-ins � Pig access � Cleanouts � Pretreatment, including bar screens, grit removal, grinders and compactors � Desalting and settling tanks � Manholes � Transformer location � Switching stations � Data security � Integration and compatibility � Other user defined
H. ASSOCIATED STRUCTURES and EQUIPMENT
H.1 Support Structures
Support structures for conveyance requirements along the extent of right-of-way for a project are often necessary (such as bridges for freight, people, or pipelines). As a result, right-of-way requirements must take into account the impacts of structure design on the affected corridor. For example, pipelines may need to span a gap while maintaining a specified grade, while transportation and distribution facilities must span long gaps while maintaining a specified clearance above a transportation corridor. The following should be addressed:
� Structure locations � Materials of construction � Foundation requirements � Seismic requirements � Right of way impacts � Towers � Stringing requirements � Toll plazas � Safety tolerances:
� Maximum height � Minimum clearances � Maximum loads and capacities � Clear roadway width
� Utilities attached to bridge structures � Turnarounds
158
� Access requirements � Maintenance of right-of-way � Retaining walls and abutments � Vertical and horizontal alignment � Fencing � Lightning protection � Safety lighting � Maintenance accessibility � Pipe racks � Cable trays � Span gap � Special load requirements, such as ice, wind, heavy load, etc. � Thrust blocks � Valve and pumping stations/enclosures � Other user defined
** Additional items to consider for Renovation & Revamp projects ** � Current condition and life expectancy � Temporary signage � Maximum construction bridge loading � Bypasses or temporary conveyance � Detour bridge requirements or lane rerouting
H.2 Hydraulic Structures
In analyzing or designing drainage facilities, the investment of time, expense, concentration, and completeness should be influenced by the relative importance of the facility. Some of the basic components inherent in the design or analysis of any pipeline, channel, or highway drainage facility include data such as surveys of existing characteristics, estimates of future characteristics, engineering design criteria, discharge estimates, structure requirements and constraints, and receiving facilities. Issues to consider include:
� Open channels, tunnels, and outfall structures: � Right-of-way impact � Environmental impact
� Storm drain systems � Emergency spillways � Collection basins � Culverts � Fluid energy abatement � Inlets/outlets � Irrigation controls � Street cleaning requirements � Special required easements
159
� Hydraulic routing � Hydraulic channel controls � Wildlife crossing structures � Life-cycle maintenance considerations and costs � Multipurpose requirements (flood control plus power generation, etc.) � Erosion control � Other user defined ** Additional items to consider for Renovation & Revamp projects ** � Current condition and life expectancy � Bypasses or temporary conveyance
H.3 Miscellaneous Elements
In addition to typical pipeline, water channel, energy, and/or roadway design elements, the following features may require consideration and planning and in some cases the acquisition of additional right-of-way. These items should be identified and listed and may include:
� Longitudinal barriers � Rip-rap / gabions / soil retaining structures � Fencing � Emergency management issues � Noise abatement walls � Visual architectural blending structures � Maintenance and storage yards � Toll-way structures � Border and immigration structures � Parking � Rest areas and stops � Blast deflection devices � Signage, delineation, roadway markings, historical markers � Extended shoulders for service � Truck weigh stations � Pedestrian separations and ramps � Emergency median openings and widths � Runaway vehicle lanes � Hazardous material traps � Storm septors and other storm water control devices � Emergency spillway area � Berms or containment structures � Other user defined
160
H.4 Equipment List
Project-specific installed equipment should be defined and listed. In some cases, equipment may have to be manufactured and purchased specifically for construction of the facility. In situations where owners are furnishing equipment, the equipment should be properly defined and purchased. Items may include:
� Traffic control devices: � Low-volume roads � School zones � Highway-rail or -light rail transit grade crossings � Bicycles � Temporary
� Intelligent transportation systems devices: � Cameras � Loop detectors � Sensors � Monitors
� Specialized equipment such as tunnel boring machines (TBM), dredges, cranes, etc.
� Electronic signage � Highway traffic signals � Toll equipment � Rest area requirements � Turbines � Compressors � Pumps � Conveyor systems � Grinders � Clarifiers � Tanks or basins � Filtering � Transformers � Electrical substations (breakers, disconnect switches, protection and control
equipment) � Spares and commonality requirements � Other user defined
Training requirements for equipment operation have been defined and responsibility
established in areas such as:
� Control systems � Information systems and technology � Equipment operation � Maintenance of systems � Training materials and equipment (e.g., manuals, simulations) � Safety � Other user defined
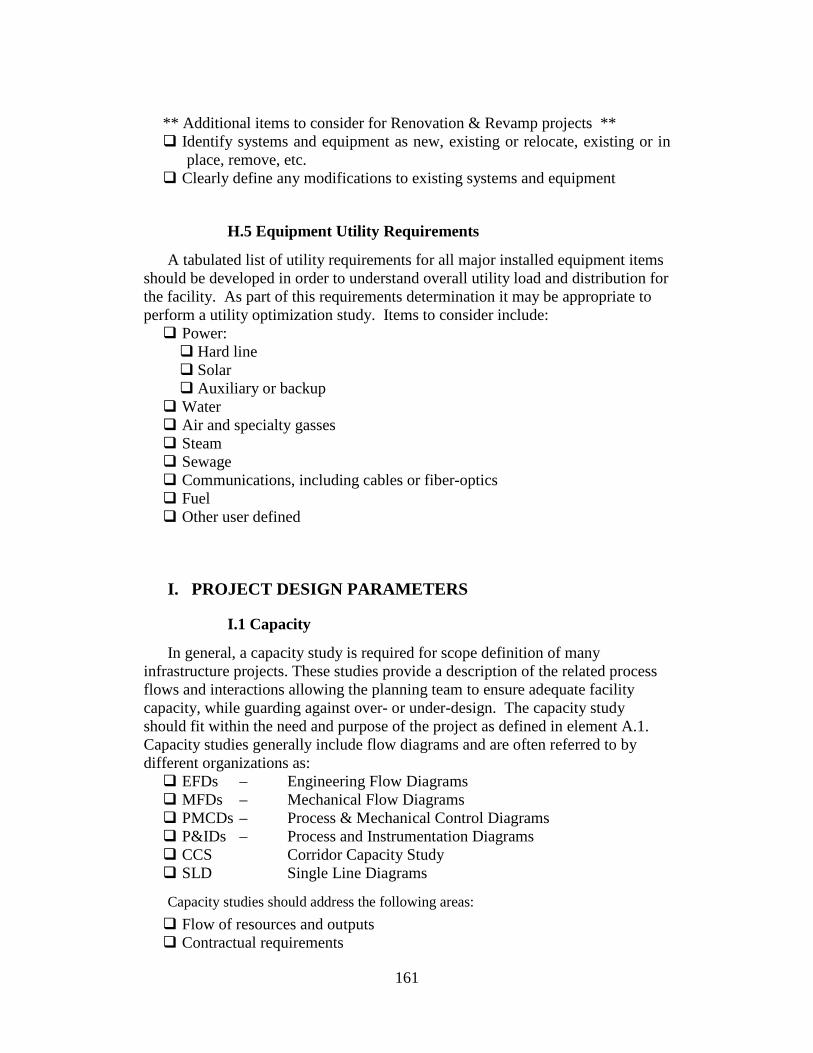
161
** Additional items to consider for Renovation & Revamp projects ** � Identify systems and equipment as new, existing or relocate, existing or in
place, remove, etc. � Clearly define any modifications to existing systems and equipment
H.5 Equipment Utility Requirements
A tabulated list of utility requirements for all major installed equipment items should be developed in order to understand overall utility load and distribution for the facility. As part of this requirements determination it may be appropriate to perform a utility optimization study. Items to consider include:
� Power: � Hard line � Solar � Auxiliary or backup
� Water � Air and specialty gasses � Steam � Sewage � Communications, including cables or fiber-optics � Fuel � Other user defined
I. PROJECT DESIGN PARAMETERS
I.1 Capacity
In general, a capacity study is required for scope definition of many infrastructure projects. These studies provide a description of the related process flows and interactions allowing the planning team to ensure adequate facility capacity, while guarding against over- or under-design. The capacity study should fit within the need and purpose of the project as defined in element A.1. Capacity studies generally include flow diagrams and are often referred to by different organizations as:
� EFDs – Engineering Flow Diagrams � MFDs – Mechanical Flow Diagrams � PMCDs – Process & Mechanical Control Diagrams � P&IDs – Process and Instrumentation Diagrams � CCS Corridor Capacity Study � SLD Single Line Diagrams
Capacity studies should address the following areas:
� Flow of resources and outputs � Contractual requirements
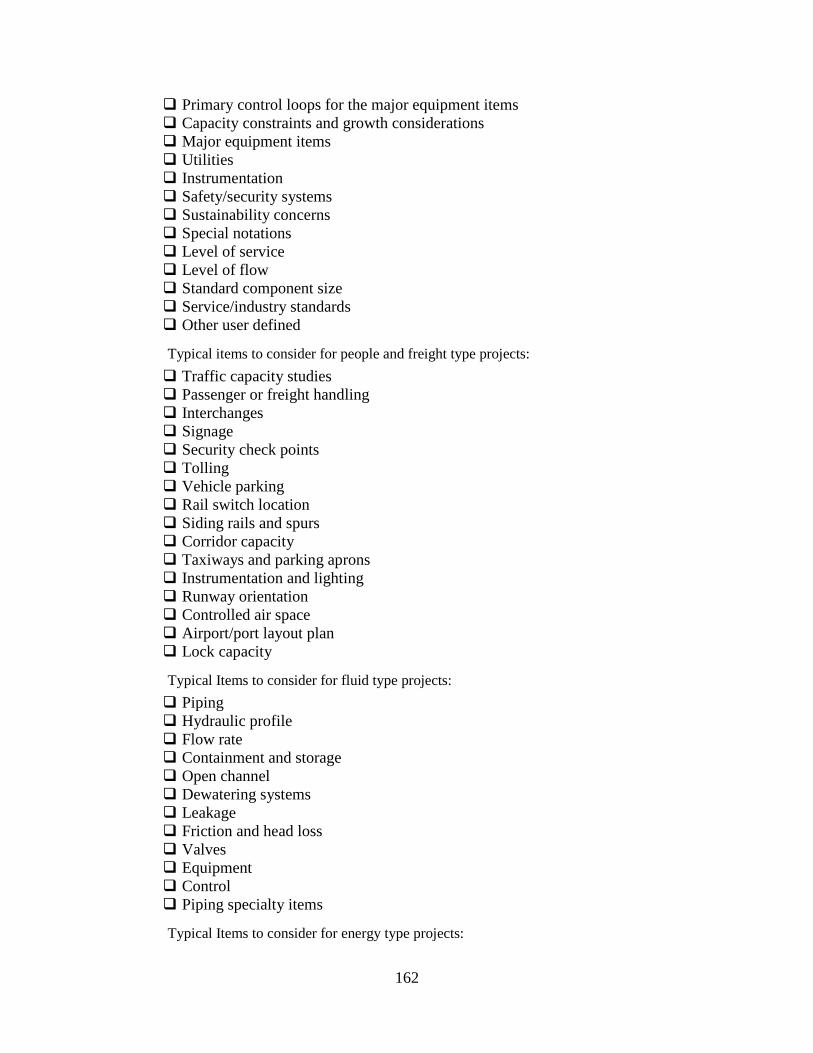
162
� Primary control loops for the major equipment items � Capacity constraints and growth considerations � Major equipment items � Utilities � Instrumentation � Safety/security systems � Sustainability concerns � Special notations � Level of service � Level of flow � Standard component size � Service/industry standards � Other user defined
Typical items to consider for people and freight type projects:
� Traffic capacity studies � Passenger or freight handling � Interchanges � Signage � Security check points � Tolling � Vehicle parking � Rail switch location � Siding rails and spurs � Corridor capacity � Taxiways and parking aprons � Instrumentation and lighting � Runway orientation � Controlled air space � Airport/port layout plan � Lock capacity
Typical Items to consider for fluid type projects:
� Piping � Hydraulic profile � Flow rate � Containment and storage � Open channel � Dewatering systems � Leakage � Friction and head loss � Valves � Equipment � Control � Piping specialty items
Typical Items to consider for energy type projects:
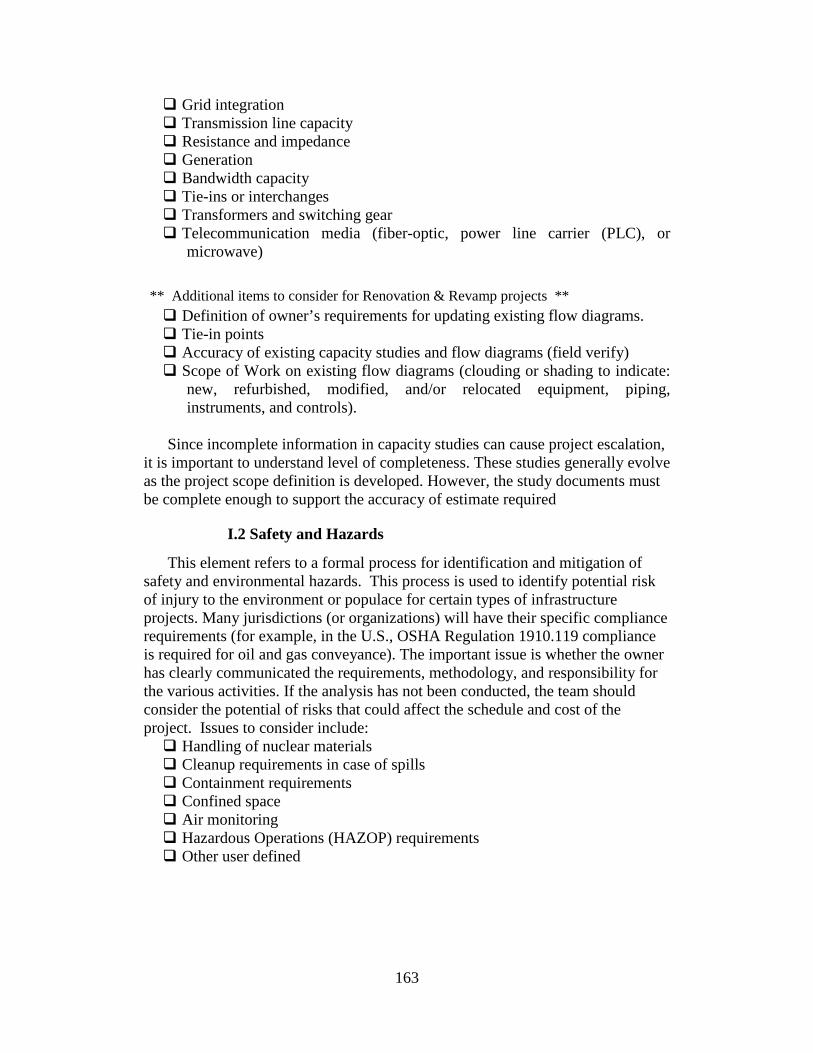
163
� Grid integration � Transmission line capacity � Resistance and impedance � Generation � Bandwidth capacity � Tie-ins or interchanges � Transformers and switching gear � Telecommunication media (fiber-optic, power line carrier (PLC), or
microwave)
** Additional items to consider for Renovation & Revamp projects ** � Definition of owner’s requirements for updating existing flow diagrams. � Tie-in points � Accuracy of existing capacity studies and flow diagrams (field verify) � Scope of Work on existing flow diagrams (clouding or shading to indicate:
new, refurbished, modified, and/or relocated equipment, piping, instruments, and controls).
Since incomplete information in capacity studies can cause project escalation,
it is important to understand level of completeness. These studies generally evolve as the project scope definition is developed. However, the study documents must be complete enough to support the accuracy of estimate required
I.2 Safety and Hazards
This element refers to a formal process for identification and mitigation of safety and environmental hazards. This process is used to identify potential risk of injury to the environment or populace for certain types of infrastructure projects. Many jurisdictions (or organizations) will have their specific compliance requirements (for example, in the U.S., OSHA Regulation 1910.119 compliance is required for oil and gas conveyance). The important issue is whether the owner has clearly communicated the requirements, methodology, and responsibility for the various activities. If the analysis has not been conducted, the team should consider the potential of risks that could affect the schedule and cost of the project. Issues to consider include:
� Handling of nuclear materials � Cleanup requirements in case of spills � Containment requirements � Confined space � Air monitoring � Hazardous Operations (HAZOP) requirements � Other user defined

164
I.3 Civil/Structural
A clear statement of civil/structural requirements should be identified or developed, and then documented as a basis of design. This documentation should include issues such as the following:
� Client specifications (e.g., basis for design loads, capacity, vulnerability and risk assessments)
� Future expansion considerations � Physical requirements � Seismic requirements � Safety considerations � Construction materials (e.g., concrete, steel, client standards, etc.) � Sustainability considerations, including certification � Standard or customized design � Define nomenclature and documentation requirements for civil drawings
including: � Overall project site plan � Project phasing requirements � Interim traffic or by-pass control plans � Structures � Location of equipment and facilities � Utilities � Roads and paving � Grading/drainage/erosion control/landscaping � Corrosion control / protective coatings � Minimum clearances � Architectural theme
� Other user defined
** Additional items to consider for Renovation & Revamp projects **
� Existing structural conditions (e.g., foundations, building framing, harmonics / vibrations, etc)
� Potential affect of noise, vibration and restricted headroom in installation of piling and on existing operations
� Underground interference (utilize shallow depth designs)
I.4 Mechanical /Equipment
A clear statement of mechanical and equipment design requirements should be identified or developed, and then documented as a basis of design. This documentation should include issues such as:
� Life cycle costing basis � Energy conservation � Sustainability considerations, including certification � Equipment/space special requirements with respect to environmental
conditions (e.g., air quality, special temperatures) � System redundancy requirements
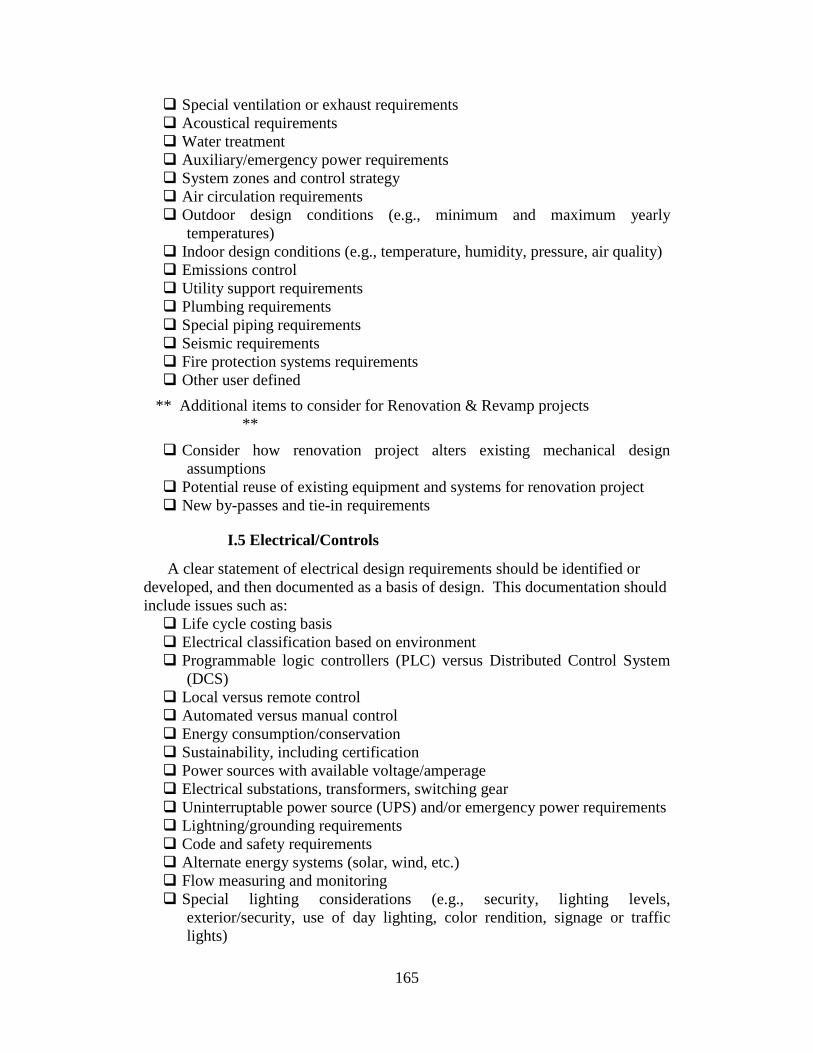
165
� Special ventilation or exhaust requirements � Acoustical requirements � Water treatment � Auxiliary/emergency power requirements � System zones and control strategy � Air circulation requirements � Outdoor design conditions (e.g., minimum and maximum yearly
temperatures) � Indoor design conditions (e.g., temperature, humidity, pressure, air quality) � Emissions control � Utility support requirements � Plumbing requirements � Special piping requirements � Seismic requirements � Fire protection systems requirements � Other user defined
** Additional items to consider for Renovation & Revamp projects **
� Consider how renovation project alters existing mechanical design assumptions
� Potential reuse of existing equipment and systems for renovation project � New by-passes and tie-in requirements
I.5 Electrical/Controls
A clear statement of electrical design requirements should be identified or developed, and then documented as a basis of design. This documentation should include issues such as:
� Life cycle costing basis � Electrical classification based on environment � Programmable logic controllers (PLC) versus Distributed Control System
(DCS) � Local versus remote control � Automated versus manual control � Energy consumption/conservation � Sustainability, including certification � Power sources with available voltage/amperage � Electrical substations, transformers, switching gear � Uninterruptable power source (UPS) and/or emergency power requirements � Lightning/grounding requirements � Code and safety requirements � Alternate energy systems (solar, wind, etc.) � Flow measuring and monitoring � Special lighting considerations (e.g., security, lighting levels,
exterior/security, use of day lighting, color rendition, signage or traffic lights)

166
� Voice, data and video communications requirements � Telecommunication and data systems � Instrumentation � Advanced audio/visual (A/V) connections � Personnel sensing � Security/access control systems � Other user defined
** Additional items to consider for Renovation & Revamp projects **
� Integration of new technology with existing systems, including interface issues
� Safety systems potentially compromised by any new technology � How renovation project alters existing electrical design assumptions � Potential reuse of existing equipment and systems for renovation project
I.6 Operations/Maintenance
A clear statement of operations/maintenance design requirements should be identified or developed, and then documented as part of the basis of design. Operations and maintenance activities are related to the performance of routine, preventive, predictive, scheduled, and unscheduled actions aimed at preventing equipment failure or decline in order to maintain the correct level of efficiency, reliability, and safety. Operational efficiency represents the life-cycle cost-effective mix of preventive, predictive, and reliability-centered maintenance technologies, coupled with equipment calibration, tracking, and computerized maintenance management capabilities all targeting reliability, safety, occupant comfort, and system efficiency. Sustainability concerns should be addressed as appropriate. Design parameters for operations/maintenance should be considered for infrastructure components such as levees, utilities, roadway structures, drainage structures, traffic control devices, vegetation, and other infrastructure project related items. To the extent practical, utilization of desirable design criteria regarding maximum side-slope ratios and ditch profile grades will reduce maintenance and make required maintenance operation easier to accomplish. Items to consider include:
� Accessibility: � Access roads, gates, ramps � Seasonal access requirements � Restricted access � Surveillance and intrusion detection systems � Elevated and subsurface access � Valve and pumping station � Barriers / obstructions / berms / fences
� Egress and access structures: � Manholes � Platforms
167
� Vaults � Underground walk-able tunnels � Steam stations
� Safety: � Confined space permitting � Fall protection � Overhead power lines � Underground utilities � Emergency response evacuation and communications system
� Detour or by-pass options � Temporary structures for maintenance � Repair parts storage and fabrication facilities � Surface finishes (paint, hot-dip galvanized, etc.) � Right-of-way vegetative clearing and maintenance
� Types of vegetation � Overhead interferences
� Remote monitoring capabilities � Other user defined
168
SECTION III - EXECUTION APPROACH
J. LAND ACQUISITION STRATEGY
J.1 Local Public Agencies Contracts & Agreements
Contractual agreements with local public agencies (LPA) participants may be required. The execution of contractual agreements establishes responsibilities for the acquisition of right of way, adjustment of utilities and cost sharing between the LPA(s) and the project owner. The type of contract to be used is determined by whether the LPA desires to administer right of way activities and payments or defer those responsibilities to the owner. In some cases an agreement must be entered into before a project is released for right-of-way acquisition. Issues to consider include:
� Master agreement governing local agency project advance funding � Cost participation and work responsibilities between the owner and LPAs or
others � Reimbursement to the Local Public Agencies (LPA) or others for purchased
parcels � Lender requirements or stipulations � Prerequisites to secure right-of-way project release on non-federal-aid
projects � Request for determination of eligibility � Compatibility with local regulations and procedures � Long term operation and maintenance responsibility � Other user defined
J.2 Long-lead Parcel & Utility Adjustment Identification and Acquisition
Right-of-way acquisition and utility adjustment are almost always on the critical path of an infrastructure project. It is important to identify and focus on all parcels within the right-of-way (ROW), but especially those that might cause delay, such as those that may require eminent domain acquisition or have other inherent problems (as identified in Element F.7). Utilities with a history of slow response in making adjustments should be aggressively managed. It should be noted that ROW and utility adjustment issues may be of concern even in cases where the parcel or utility is owned by a separate public entity. A strategy must be developed to address these problematic parcels and/or utility adjustments. Issues to consider include:
� Identification and prioritization of long lead parcels and utilities � Defining responsible party for parcel acquisition and utility adjustment � Appraisal responsibility and performance � Acquisition of parcels � Relocation of displacees � Abatement and removal of existing improvements � Other user defined

169
J.3 Utility Agreement & Joint-Use Contracts
Prioritizing utility agreements may be essential to insure that the concurrent review and approval processes are coordinated and efficient. The utility agreements and joint-use contracts effectively enable the utility to share space on public or private right-of-way and complete utility adjustments. Note that utilities are sometimes owned and controlled by separate public entities and must be coordinated. Issues to consider include:
� Utility agreements, plans, and estimates � Public or private utilities � Crossing permits for highways, railroads, canals, etc. � Supporting documentation � Transmittal memo from district to division � Crossing and parallel encroachment permits � Compatibility with jurisdictional regulatory and approval processes � Other user defined
J.4 Land Appraisal Requirements
Acquisition should not begin until a formal right-of-way release or organizational go-ahead is obtained. An early step in acquisition is to determine the value of parcels for reimbursement. Ensuring appraisal occurs in a timely manner is essential. Appraisal requirements include:
� Pre-appraisal contacts � Determination of number of appraisers required � Determination of appraisal assignments � Use of in-house or contract appraisers � Prioritization of parcel appraisals, if required � Other user defined
J.5 Advance Land Acquisition Requirements
Advance acquisition is defined as right-of-way acquisition that occurs before normal release for acquiring right-of-way is given for the project. Advance acquisition requirements need to be identified and addressed as soon as possible in the project. Although this process bypasses detailed environmental scoping, consideration for environmental effects should be made in determining parcels for advance acquisition. (Note: this is not the acquisition of long-lead parcels that occurs through the normal release process.) Examples of advance acquisition include the following:
� Protective buying to prevent imminent parcel development that would materially increase right-of-way costs
� Hardship acquisition of a parcel at the property owner's request � Donation of land for right-of-way purposes for no consideration
170
� Acquisition of parcels with multiple, sometimes undivided owners or unknown owners
� Other user defined
K. PROCUREMENT STRATEGY
K.1 Project Delivery Method & Contracting Strategies
The methods of project design and construction delivery, including fee structure and risk allocation for the project should be identified. Types of project delivery methods and contract strategies to consider include:
� Owner self-performed � Selected methods (e.g., design/build, construction management (CM) at
risk, competitive sealed proposal, bridging, design-bid-build, multi-prime, sole source negotiated)
� Requirements under franchises, concessions, or other agreements � Designer and constructor qualification selection process � Compensation arrangement (e.g., lump sum, cost-plus, negotiated) � Design/build scope package considerations � Solicitation package is competitive in the market place ("bidability") � Craft labor studies � Small business and disadvantaged business contract requirements � Local content requirements � Other user defined
K.2 Long-Lead/Critical Equipment & Materials Identification
Installed equipment and material items with long lead times may impact the design and construction schedule. These items should be identified and tracked. A strategy should be developed to expedite these items if possible. Examples may include:
� Engineered components � Toll equipment � Electronic information boards � Bridge or tower structural components � Pre-cast elements � Directional lighting systems � Computer and/or software systems � Pumps, piping and valves � Transformers and switchgear � Cable � Structural steel � Other user defined
K.3 Procurement Procedures & Plans
Procurement procedures and plans include specific guidelines, special requirements, or methodologies for accomplishing the purchasing, expediting, and
171
delivery of equipment and materials required for the project. Issues to consider include:
� Responsibility for performing procurement � Listing of approved vendors, if applicable � Client or contractor purchase orders � Reimbursement terms and conditions � Equipment / material specifications � Guidelines for supplier alliances, single source, or competitive bids � Guidelines for engineering/construction contracts and approval � Responsibility for owner-purchased items, including: � Financial � Shop inspection documentation (e.g., factory acceptance tests) � Expediting and tracking � Tax strategy, including:
� Depreciation capture � Local sales and use tax treatment � Investment tax credits � Local regulations (e.g., tax restrictions, tax advantages)
� Definition of source inspection requirements and responsibilities � Definition of traffic/insurance responsibilities � Definition of procurement status reporting requirements � Additional/special owner accounting requirements � Definition of spare parts requirements � Incentive/penalty strategy for contracts � Delivery requirements � Receiving, staging and storage � Warranty � Operating manual requirements and training � Restricted distribution of construction documents for security and anti-
terrorism reasons � Other user defined
K.4 Procurement Responsibility Matrix
A procurement responsibility matrix has been developed showing authority and responsibility for procurement. This matrix should outline responsibilities for:
� Engineering, design and professional services � Engineered equipment � Construction � Bulk materials � Fabrication/modularization � Consulting services � Commissioning and startup materials � Source inspection � Other

172
** Additional items to consider for Renovation & Revamp projects **
� Utilization of reused and existing equipment, materials, lines, electrical and instrumentation, etc.
� Availability of procurement support during time-constrained R&R work, especially where expedited material services are required
L. PROJECT CONTROL
L.1 Right-of-Way & Utilities Cost Estimates
Right-of-way costs are defined as those instances where there is an interest in land acquired and include all costs necessary to acquire the property. In some cases land and interests in land must be acquired outside existing right-of-way for or by the utility. The cost estimates in some cases are prepared by the utility and submitted in support of the utility agreement and plans required for the proposed work. These estimates should cover only the work for clearing infrastructure project construction. Issues to consider include:
� Cost of right-of-way � Amounts paid to fee appraisers for appraisal of the right-of-way � Costs normally paid that are incidental to land acquisition � Payment of property damages and losses to improvements � Recording costs � Deed fees � Salaries and expenses of employees engaged in the valuation and
negotiation � Right-of-way costs incurred by a utility � Cost of utility adjustment and bringing necessary utilities to site � Other user defined
L.2 Design & Construction Cost Estimates
The project cost estimates should address all costs (excluding right-of-way acquisition and utility adjustment costs that are addressed in element L.1) necessary for completion of the project. These cost estimates may include the following:
� Design costs � Construction contract estimate � Professional fees � Construction management fees � General conditions costs � Trades resource plan � Administrative costs � Inspection costs � Environmental monitoring � Public relations � Contingencies

173
� Cost escalation for labor and materials � Cost escalation for elements outside the project cost estimates � Startup and commissioning costs � Capitalized overhead � Safety, health, and environmental items � Site-specific insurance requirements � Incentives � Miscellaneous expenses including but not limited to:
� Specialty consultants � Inspection and testing services � Bidding costs � Site clearance � Environmental impact mitigation measures � Jurisdictional permit fees � Sureties
� Taxes: � Depreciation schedule � Capitalized/expensed � Tax incentives � Contractors’ sales tax
� Utility costs during construction (this will be a cost to the project whether paid by owner or contractor
� Interest on borrowed funds (cost of money) � Site surveys, soils tests � Availability of construction lay-down and storage at site or in remote or
rented facilities � Licensing � Other user defined
L.3 Project Cost Control
Procedures for controlling project cost need to be outlined and responsibility assigned. These may include cost control requirements such as:
� Financial (client/regulatory) � Phasing or area sub-accounting � Capital versus non-capital expenditures � Report requirements � Payment schedules and procedures � Cash flow projections/draw down analysis � Cost code scheme/strategy � Costs for each project phase � Periodic control check estimates � Change order management procedure, including scope control and interface
with information systems � Costs pertaining to right-of-way acquisition and utility adjustment during
project execution � Project and financial control software
174
� Other user defined
L.4 Project Schedule Control
The project schedule is created to show progress and ensure that the project is completed on time. The schedule is necessary for design and construction of the facility. A schedule format and control procedures should be developed during front end planning, including responsibilities. Typical items to consider include:
� Milestones � Required submissions and/or approvals � Resource loading requirements � Required documentation/responsible party � Baseline schedule versus progress-to-date schedule � Critical path activities, including field surveys � Contingency or “float time” � Force majeure � Permitting or regulatory approvals � Activation and commissioning � Liquidated damages/incentives � Unusual schedule considerations � Unscheduled delays because adverse weather delay days � The owner must also identify how special project issues will be scheduled.
These items may include: � Selection, procurement, and installation of equipment � Stages of the project that must be handled differently than the rest of the
project � Tie-ins, service interruptions, and road closures � Other user defined
L.5 Project Quality Assurance & Control
Quality assurance and quality control procedures for the project need to be established, including responsibilities for approvals. These procedures may include:
� Administration of contracted professional services � Responsibility during design and construction � Testing of materials and workmanship � Quality management system requirements, including audits (e.g., ISO 9000) � Environmental quality control � Submittals � Inspection reporting requirements, including “hold or witness” points � Progress photos � Reviewing changes and modifications � Communication documents (e.g., Requests for Information, Requests for
Qualifications) � Lessons-learned feedback � Correction of impaired materials, equipment and construction
175
� Jurisdictional quality control requirements such as those outlined in U. S. National Environmental Policy Act (NEPA)
� Other user defined
M. PROJECT EXECUTION PLAN
M.1 Safety Procedures
Safety procedures and responsibilities must be identified for design consideration and construction. Safety issues to be addressed may include:
� Staging area for material handling � Transportation of personnel and material to/from off-site storage � Environmental safety procedures, including hazardous material handling � Right-of-way needs for safe construction � Safety in utility adjustment � Interaction with the public/ securing site � Working at elevations/fall hazards � Excavation � Evacuation plans and procedures � Drug testing � First aid stations � Location and/or availability of medical facilities � Accident reporting and investigation, including incident management � Pre-task planning � Safety for motorists and workers, including work zone safety � Requirements for safety personnel (designated/dedicated, third party) � Safety orientation and planning � Safety communication � Safety incentives � Owner Controlled Insurance Program (OCIP) � Development of site specific safety plan � Crane action plans � Contractor requirements � Sub-contractor requirements � Other special or unusual safety issues
M.2 Owner Approval Requirements
All documents that require owner approval should be clearly defined. These documents maybe developed in planning or during design or construction. These may include:
� Project objectives statement � High level scope and project definition � Design philosophy � Operating philosophy � Maintenance philosophy

176
� Project milestone or resource loaded schedule � Corridor selection � Permit responsibility matrix � Schematic design approval � Project design parameters � Land acquisition strategy, including acquisition release � Milestones for drawing approval:
� Comment � Approval � Bid issued � Construction
� Electronic model reviews � Durations of approval cycle compatible with schedule � Individual(s) responsible for reconciling comments before return � Types of drawings that require formal approval � Purchase documents:
� Data sheets � Inquiries � Bid tabs � Purchase orders
� Change management approval authority � Quality assurance/quality control plan � Vendor information � Other
M.3 Documentation/Deliverables
Deliverables during design, construction, and commissioning of the facility should be identified. The following items should be included in a list of deliverables:
� Field surveying books � Estimates � Required submissions and/or approvals � Drawings � Project correspondence � Permits � Project data books (quantity, format, contents, and completion date) � Equipment folders (quantity, format, contents, and completion date) � Design calculations (quantity, format, contents, and completion date) � Procuring documents � As-built documents � Quality assurance documents � Updated information systems and databases � Operations and maintenance manuals � Plans, specifications &estimates (PS&E) checklist and data sheet � Other user defined
177
M.4 Computing & CADD/Model Requirements
Computing hardware, software and Computer Aided Drafting and Design (CADD) requirements to support planning, design, and construction should be defined. These requirements should include any hard or soft model needs and computing guidelines. Evaluation criteria should include:
� Handling of life cycle facility data including asset information, models, and electronic documents
� Civil Information System (CIS) requirements � Geographical Information System (GIS) requirements � Building Information Modeling (BIM) requirements � Owner/contractor standard symbols, file formats and details � Information technology infrastructure to support electronic modeling
systems, including uninterruptible power systems (UPS) and disaster recovery
� Application software preference (e.g., 2D or 3D CADD, application service provider (ASP)), including licensing requirements
� Configuration and administration of servers and systems documentation defined
� Compatibility requirements of information systems (e.g. design information system, construction information system)
� Security and auditing requirements defined � Physical model requirements � Other user defined
M.5 Design/Construction Plan & Approach
A documented plan should be developed identifying specific approaches to be used in designing and constructing the project. This plan should include items such as:
� Organizational structure � Work Breakdown Structure (WBS) � Interface with other projects or facilities, including coordination � Responsibility matrix � Subcontracting strategy � Project labor agreements � Work week plan/schedule, including weekend and night work � Permitting requirements and action plan � Design and approval of sequencing with parcel acquisition � Construction sequencing of events � Site logistics plan � Integration of safety requirements/program with plan � Identification of critical activities that have potential impact on facilities
(i.e., existing facilities, traffic flows, utility shut downs and tie-ins) � Quality assurance/quality control (QA/QC) plan � Environmental monitoring plan

178
� Design and approvals sequencing of events � Integration of permitting, design, right-of-way acquisition, utility
adjustment, and construction � Materials management, including field equipment and materials
transportation, receiving, warehousing, staging, maintenance, and control � Contractor meeting/ reporting schedule � Partnering or strategic alliances � Alternative dispute resolution � Furnishings, equipment, and built-ins responsibility � Public relations, community communications � Other user defined
M.6 Intercompany and Interagency Coordination & Agreements
Coordination with appropriate private owners, contractors, resource agencies, local governmental entities, and the public plays a vital role in project execution planning of proposed infrastructure projects. Both public and private entities may be responsible for coordination during project execution and agreements should be in place to assure efficient project delivery. Coordination is initiated at the appropriate levels. Coordination entities to consider may include:
� Owner/funding sources � Key contractors and suppliers � State historic preservation offices � Natural resource conservation services � Environmental protection agencies, such as the U.S. Environmental
Protection Agency � Air quality boards � Fish and wildlife services � International boundary and water commissions � Federal emergency management organizations, such as the U.S. Federal
Emergency Management Agency (FEMA) � Offices of habitat conservation � Law enforcement agencies � Immigration agencies � Parks and wildlife agencies � Federal, state and municipal building departments � Railroad agencies � Federal agencies such as US Army Corps of Engineers (USACE) � Flood control district � Departments of transportation � Utility companies � Special districts (such as municipal utility districts (MUDs) and roadway
utility districts (RUDs) � Other user defined

179
M.7 Work Zone and Transportation Plan
A preliminary work zone and transportation plan should be developed to understand logistics and safety. The plan should clearly show provisions for safe and efficient operation of all modes of transportation adjacent or concurrent with the project during construction, including safety of construction workers and inspection personnel. The plan should address use of heavy equipment and equipment or material delivery and storage during construction. The plan should be compliant with national, regional and local jurisdictional requirements. Issues to consider include:
� Compliance with requirements (for example, a Department of Transportation’s Manual of Uniform Traffic Control Devices (MUTCD or other)
� Control plan, including provisions to minimize disruption of services or functionality (for example, lane rental requirements for a road construction project or liquidated damages for service down-time)
� Detours or by-pass plans � Appropriate signs, markings, and barricades per the traffic control plan � Safety equipment, such as:
� Barrels � Signage � Flagmen � Positive barriers � Vertical panels
� Clear zone protection devices, such as: � Concrete traffic barriers � Metal beam guard fencing � Appropriate end treatments
� Other appropriate warning devices � Special permitting (for instance, for moving equipment or materials across a
levee or beach) � Hazardous material movement � Pedestrian safety � Oversized loads � Heavy hauls and lifts � Transportation, including barges, sea-lifts, rail, trailers and other equipment � Remote location access � Other user defined
M.8 Project Completion Requirements
Issues dealing with project completion should be addressed to make sure that the project has a smooth transition to operations. The owner’s required sequence for turnover of the project for pre-commissioning, testing, and startup activation should be developed. It should include items such as:
� Sequence of turnover, including system identification and priority � Contractor’s and owner’s required level of involvement in:
180
� Pre-commissioning � Training � Testing
� Clear definition of mechanical/electrical acceptance/approval requirements Startup requirements have been defined and responsibility established. A
process is in place to ensure that startup planning will be performed. Issues include:
� Startup goals � Leadership responsibility � Sequencing of startup � Technology start-up support on-site, including information technology � Feedstock/raw materials � Off-grade waste disposal � Quality assurance/quality control � Work force requirements
Substantial Completion (SC) is the point in time when the facilities are ready
to be used for their intended purposes. Preliminary requirements for substantial completion need to be determined to assist the planning and design efforts. The following may need to be addressed:
� Specific requirements for SC responsibilities developed and documented � Warranty, permitting, insurance, and tax implication considerations � Technology start-up support on-site, including information technology and
systems � Equipment/systems startup and performance testing � Occupancy phasing � Final code inspection � Calibration � Verification � Documentation � Training requirements for all systems � Community acceptance � Landscape requirements � Punch list completion plan and schedule � Substantial completion certificate � Other user defined
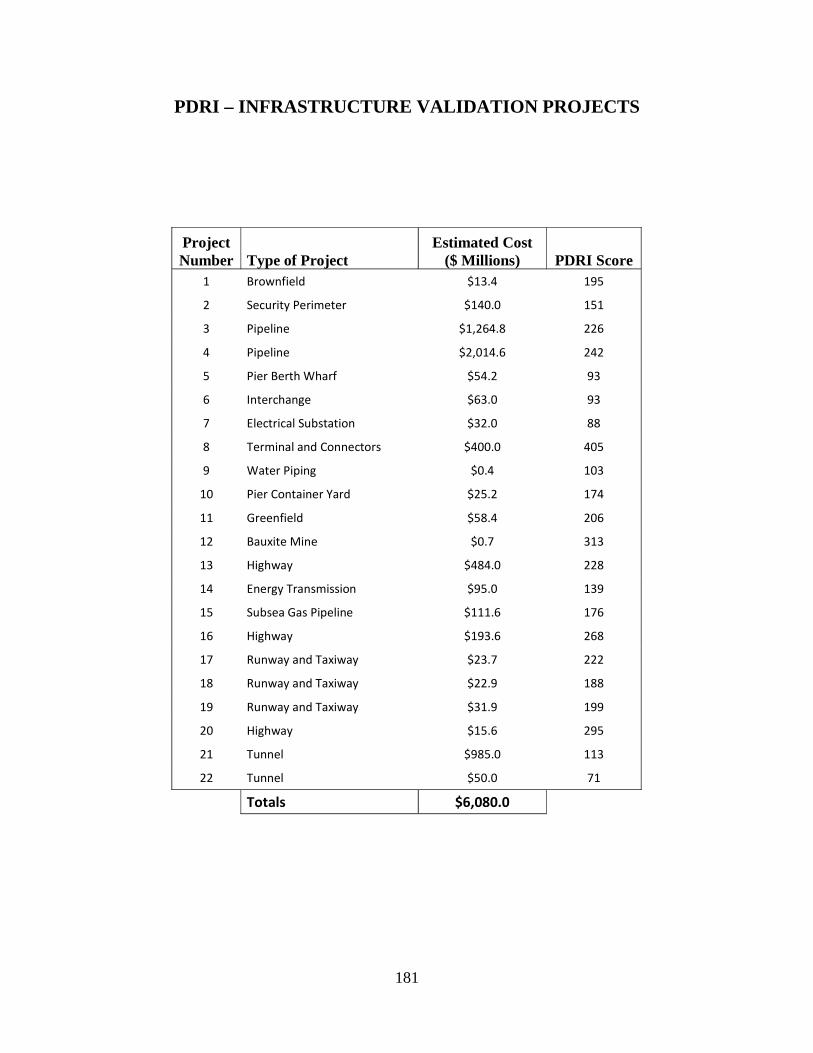
181
PDRI – INFRASTRUCTURE VALIDATION PROJECTS
Project Number Type of Project
Estimated Cost ($ Millions) PDRI Score
1 Brownfield $13.4 195
2 Security Perimeter $140.0 151
3 Pipeline $1,264.8 226
4 Pipeline $2,014.6 242
5 Pier Berth Wharf $54.2 93
6 Interchange $63.0 93
7 Electrical Substation $32.0 88
8 Terminal and Connectors $400.0 405
9 Water Piping $0.4 103
10 Pier Container Yard $25.2 174
11 Greenfield $58.4 206
12 Bauxite Mine $0.7 313
13 Highway $484.0 228
14 Energy Transmission $95.0 139
15 Subsea Gas Pipeline $111.6 176
16 Highway $193.6 268
17 Runway and Taxiway $23.7 222
18 Runway and Taxiway $22.9 188
19 Runway and Taxiway $31.9 199
20 Highway $15.6 295
21 Tunnel $985.0 113
22 Tunnel $50.0 71
Totals $6,080.0

182
IN-PROGRESS PDRI – INFRASTRUCTURE VALIDATION PROJECTS
Project Number Type of Project
Project Cost ($ Millions) PDRI Score
1 Pipeline TBD 142
2 Pipeline $1,407.13 663
3 Fluids Transmission $628.00 283
4 Oil Pipeline $100.00 92
Totals $2,135

183
APPENDIX C
DESCRIPTIVE STATISTICS
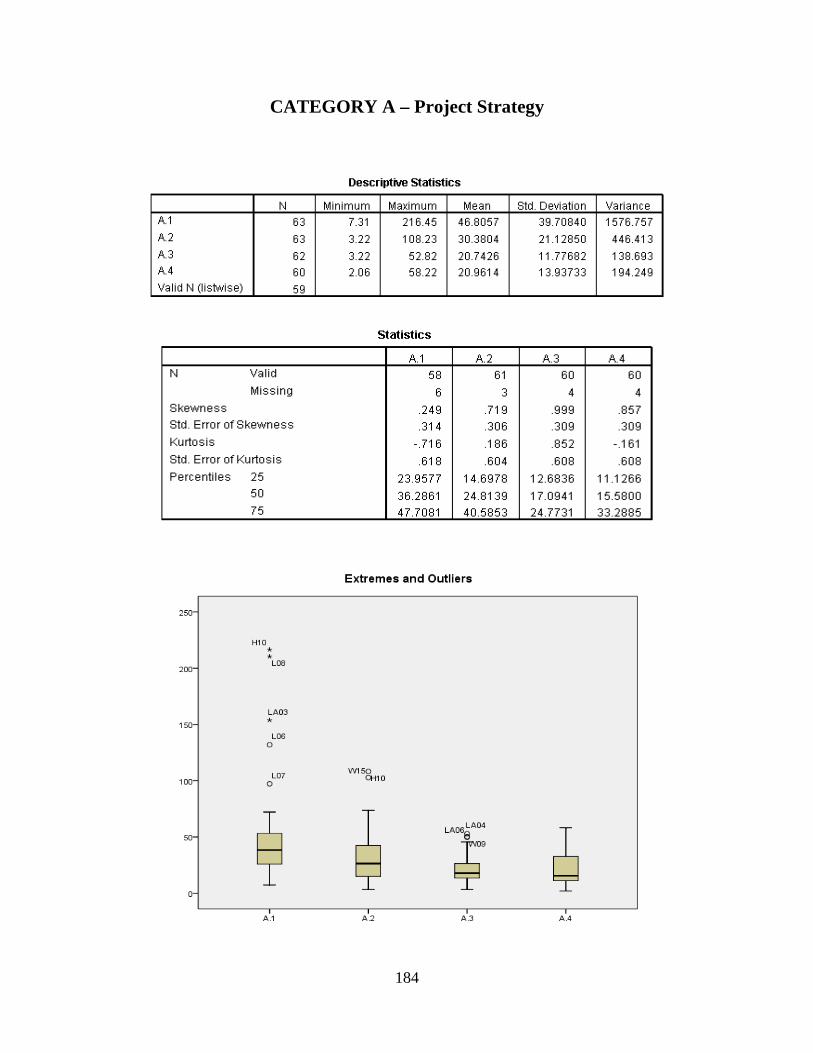
184
CATEGORY A – Project Strategy
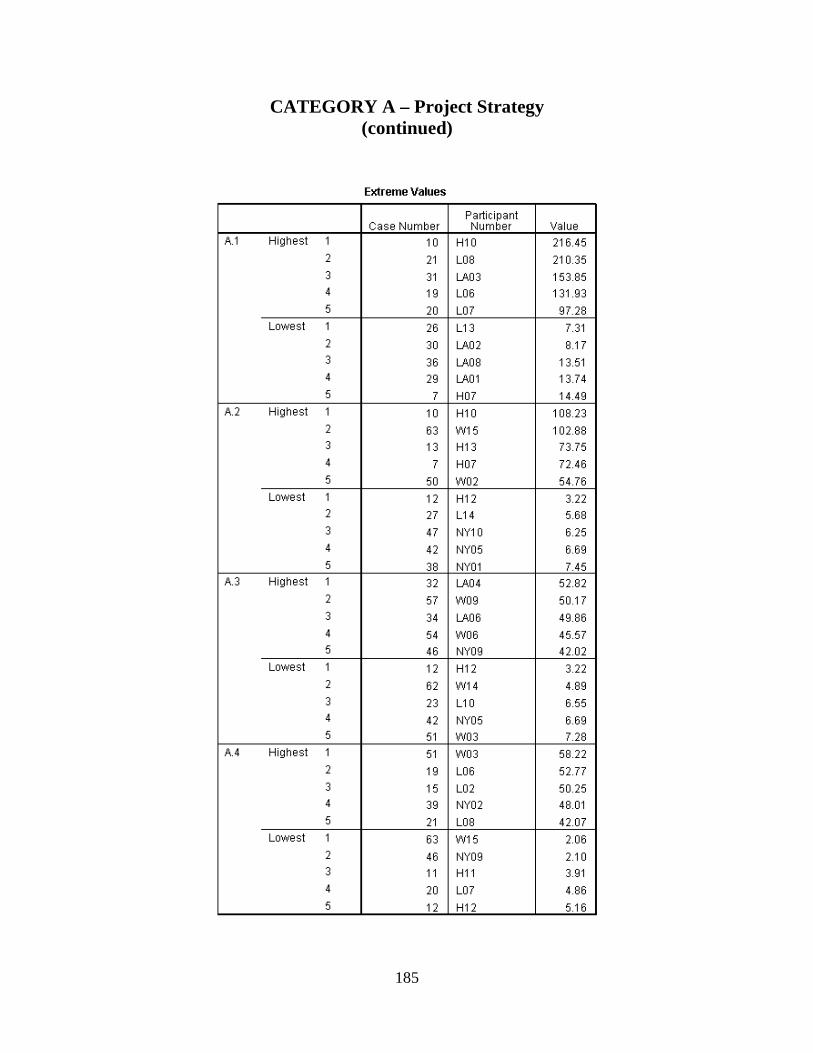
185
CATEGORY A – Project Strategy (continued)

186
CATEGORY B – Owner / Operator Philosophies

187
CATEGORY B – Owner / Operator Philosophies (continued)
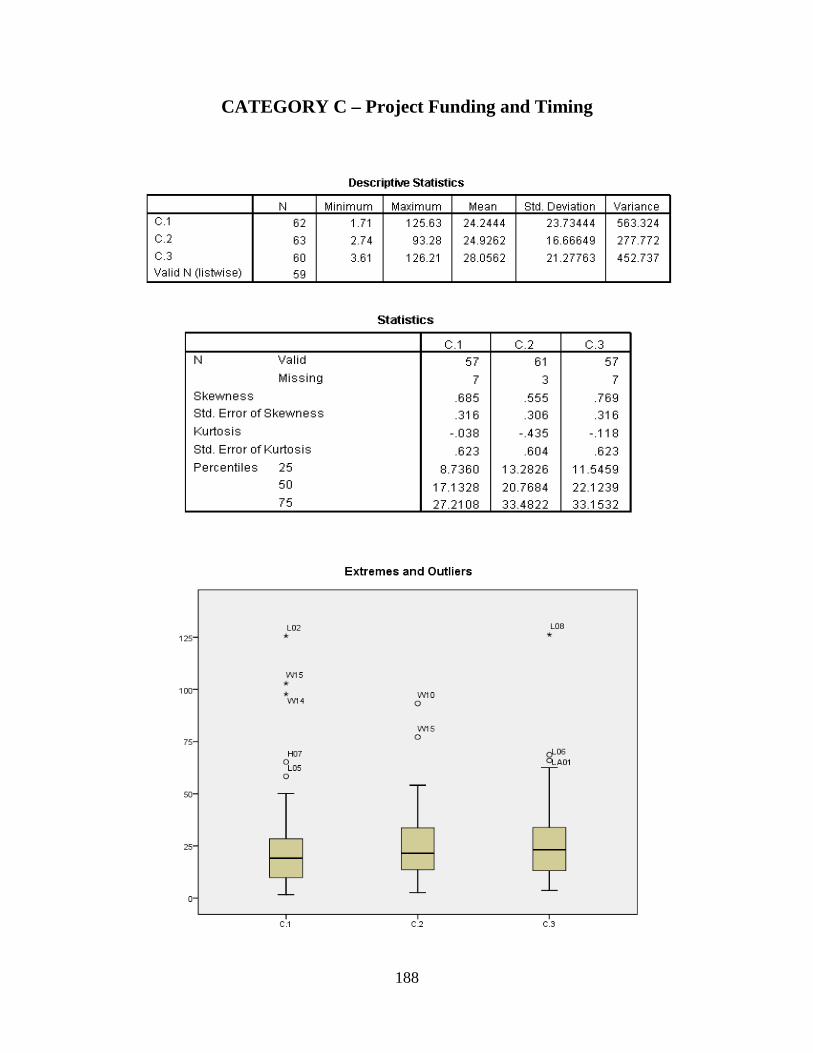
188
CATEGORY C – Project Funding and Timing
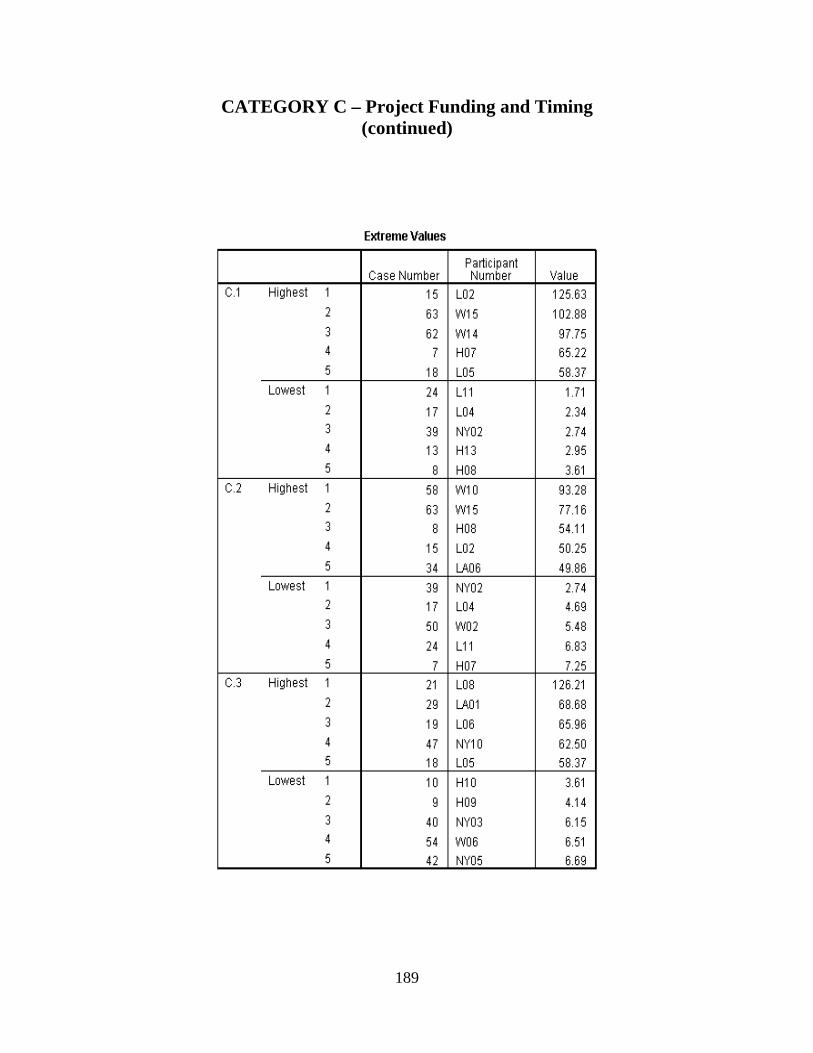
189
CATEGORY C – Project Funding and Timing (continued)

190
CATEGORY D – Project Requirements

191
CATEGORY D – Project Requirements (continued)
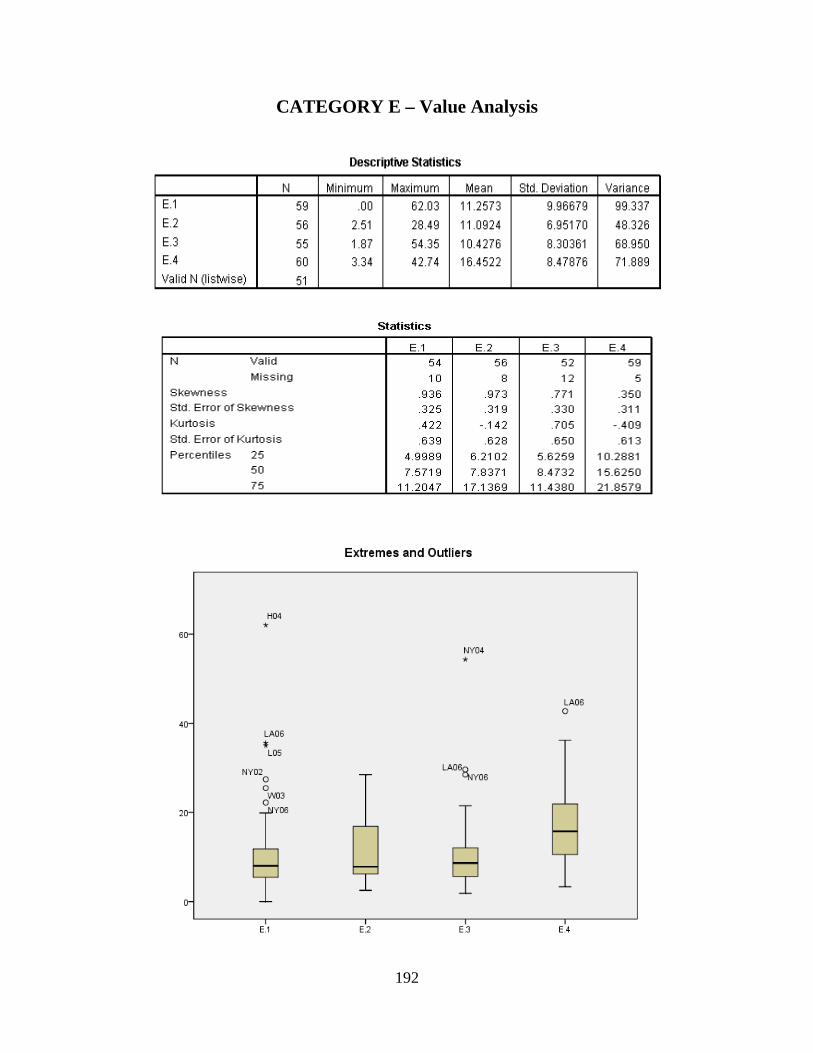
192
CATEGORY E – Value Analysis
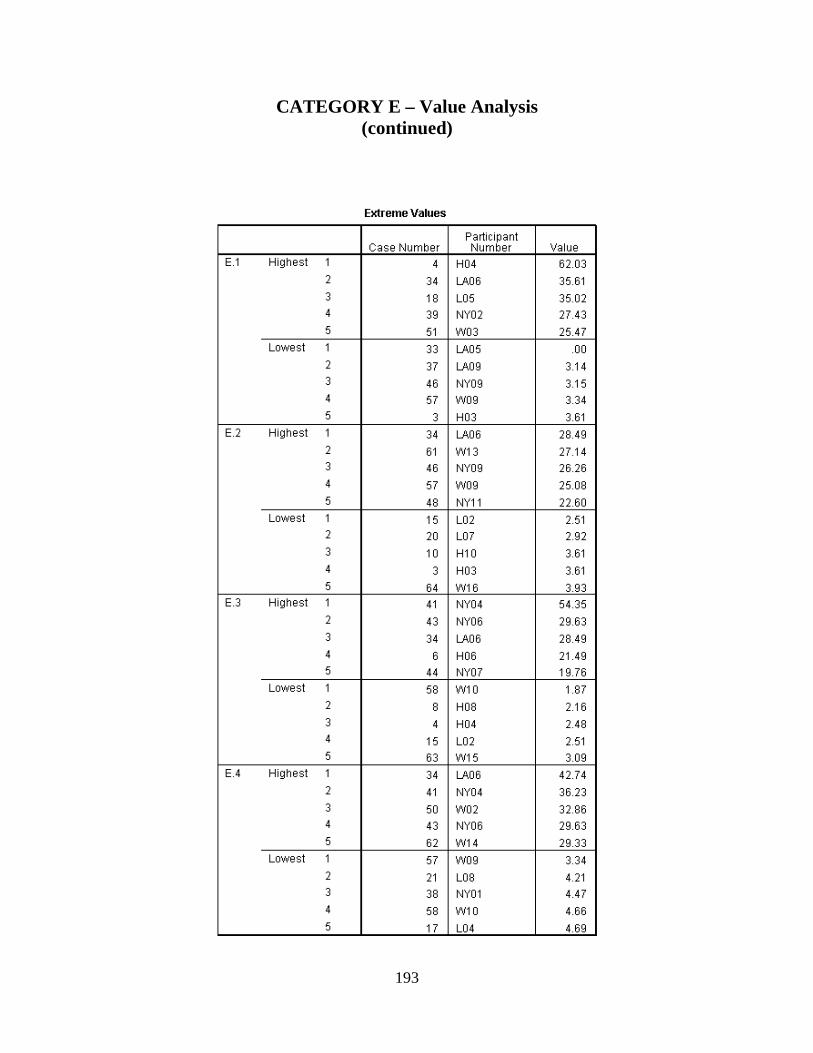
193
CATEGORY E – Value Analysis (continued)
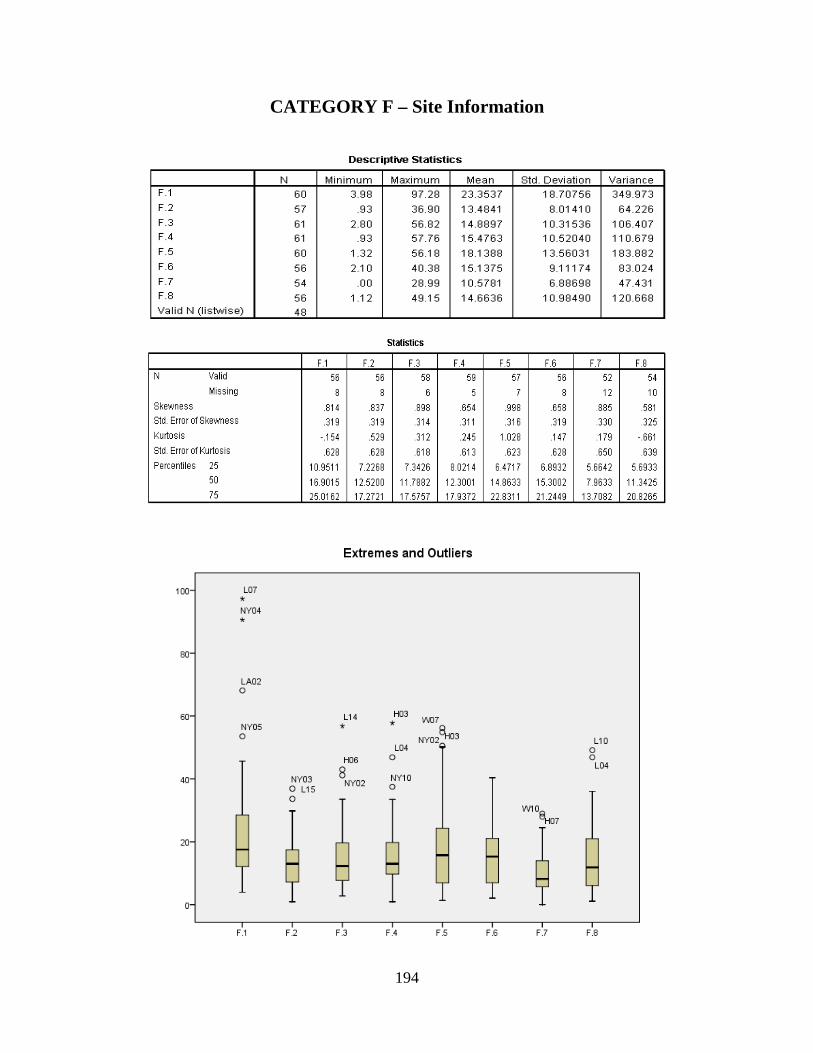
194
CATEGORY F – Site Information

195
CATEGORY F – Site Information (continued)

196
CATEGORY G – Location and Geometry

197
CATEGORY G – Location and Geometry (continued)

198
CATEGORY H – Associated Structures and Equipment

199
CATEGORY H – Associated Structures and Equipment (continued)

200
CATEGORY I – Project Design Parameters

201
CATEGORY I – Project Design Parameters (continued)

202
CATEGORY J – Land Acquisition Strategy

203
CATEGORY J – Land Acquisition Strategy (continued)

204
CATEGORY K – Procurement Strategy
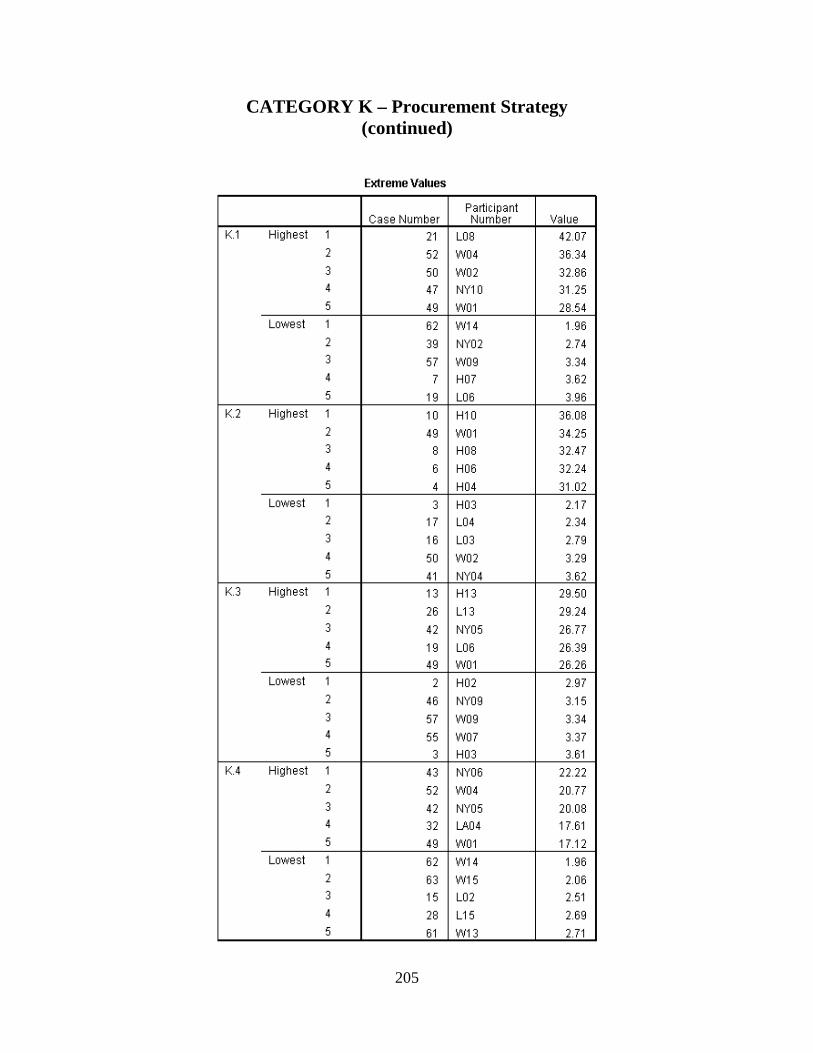
205
CATEGORY K – Procurement Strategy (continued)

206
CATEGORY L – Project Control
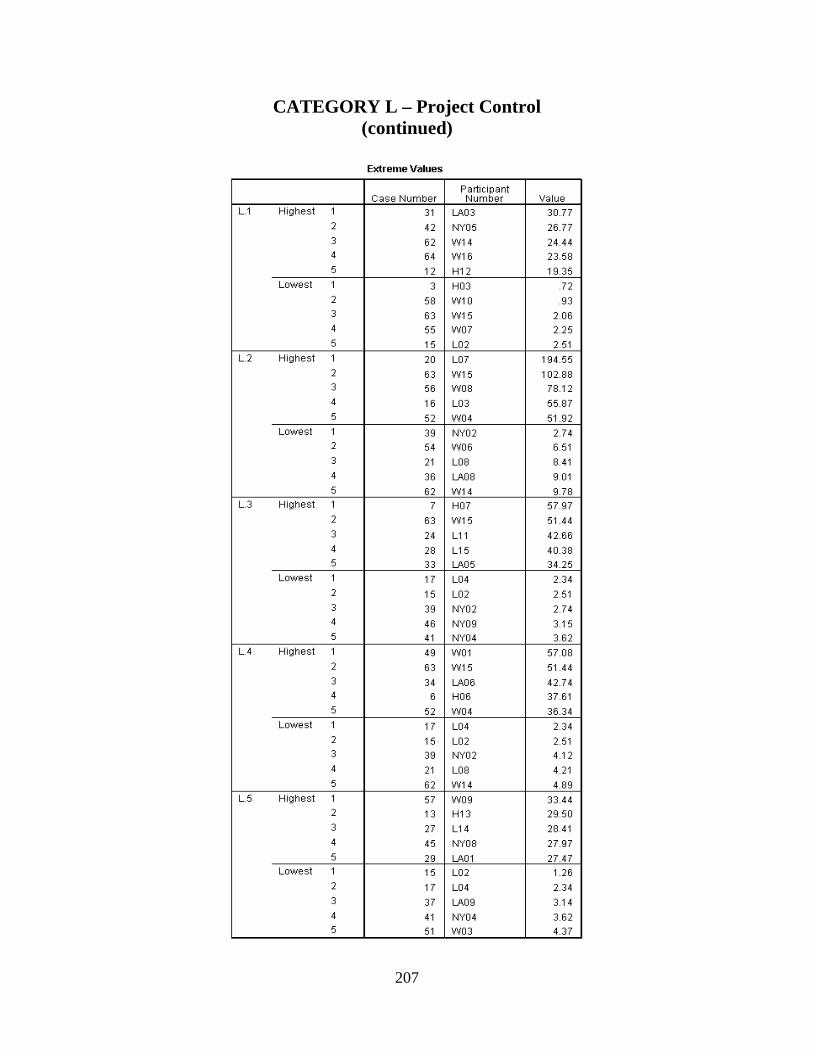
207
CATEGORY L – Project Control (continued)

208
CATEGORY M – Project Execution Plan
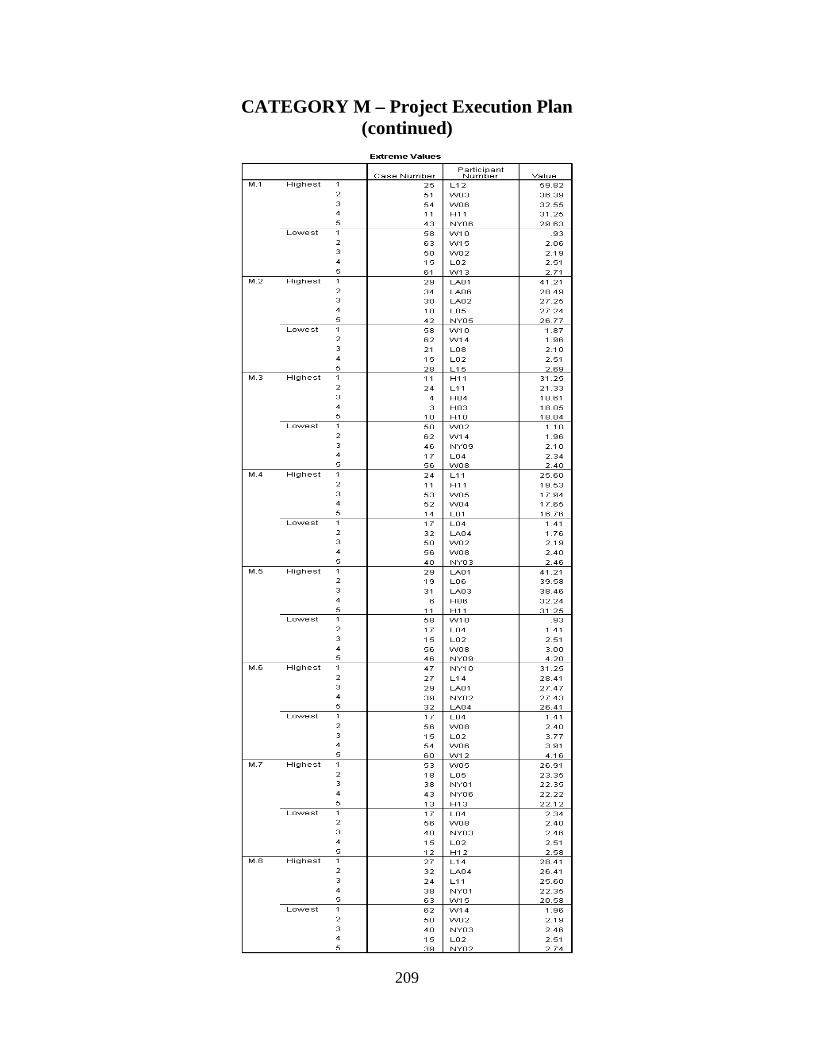
209
CATEGORY M – Project Execution Plan (continued)

210
APPENDIX D
WEIGHTING WORKSHOP EVALUATION FORM

211
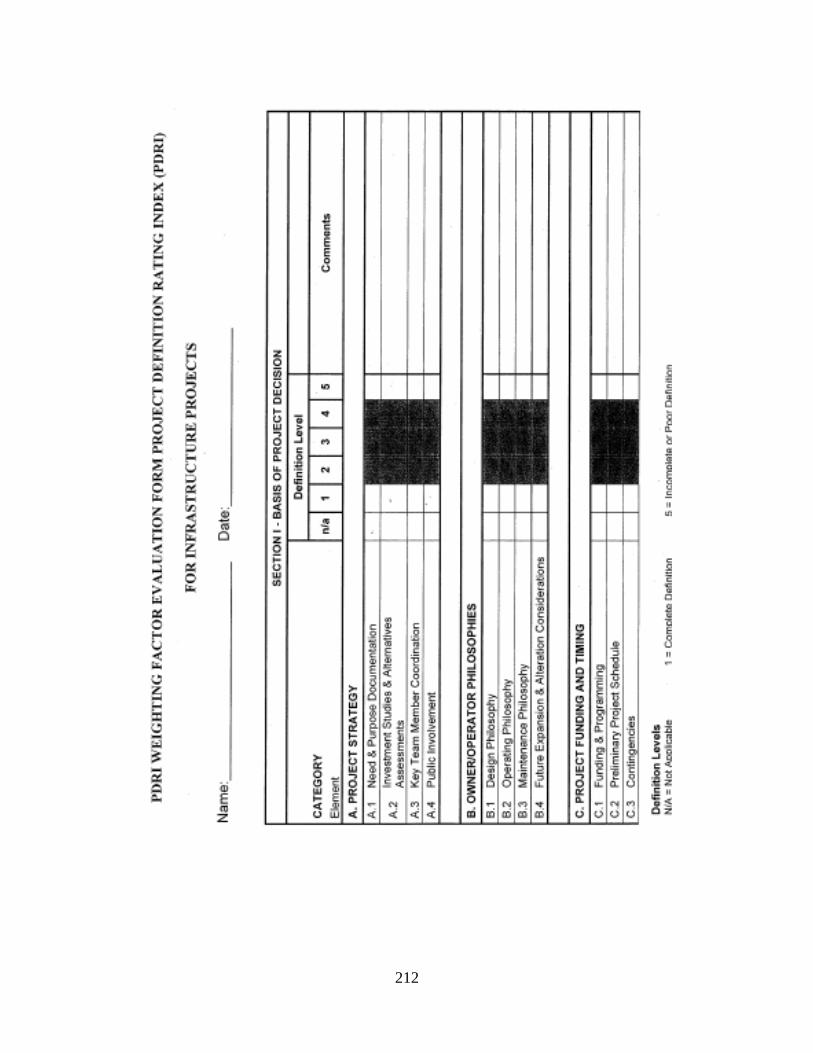
212

213

214
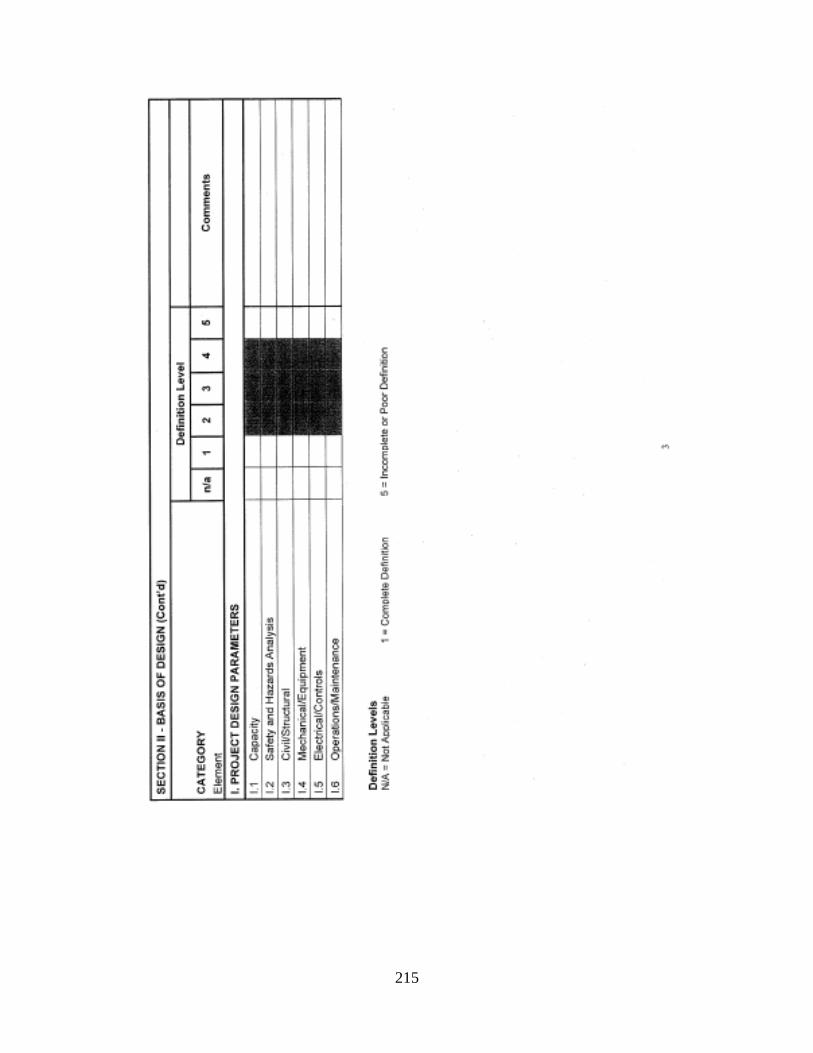
215

216
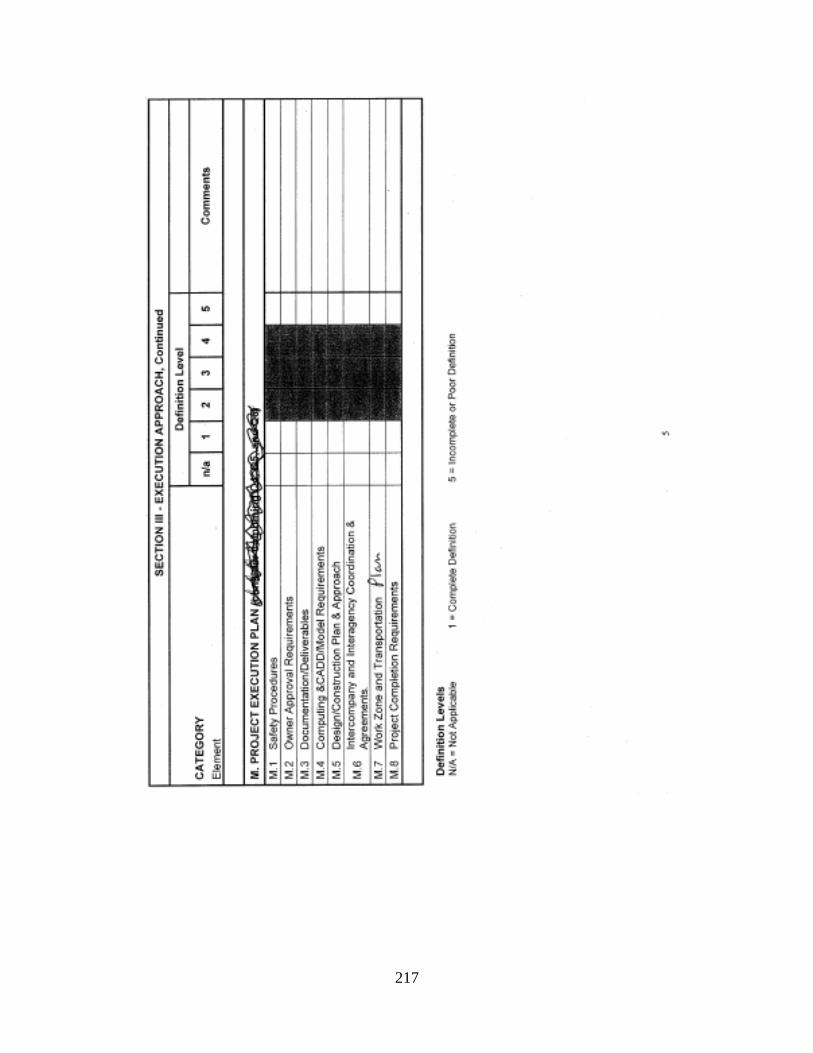
217

218
SUGGESTIONS FOR IMPROVEMENT Name:____________________________ Date:______________________ Please answer the following questions regarding the PDRI. Is the list of 68 elements complete? If not, please list all others that should be added. _____________________________________________________________________________________________________________________________________________________________________________________________________________________________________________________________________________________________________________________________________________________________________________________________________________________________________________ Are any of the elements redundant? If so, please list and provide any recommended changes. _____________________________________________________________________________________________________________________________________________________________________________________________________________________________________________________________________________________________________________________________________________________________________________________________________________________________________________ Are any of the definitions unclear or incomplete? If so, please list and provide any recommended changes. _________________________________________________________________________________________________________________________________________________________________________________________________________________________________________________________________________________________________________________________________________________________________________________________________________________________________________________________________________________________________________________________________________________________________________________________________________________________________________________________________________________________________________________________________________________________________________________________________________________________________________________________________________________________

219
Do you have any other suggestions for improving the PDRI or the instruction sheet? ______________________________________________________________________________________________________________________________________________________________________________________________________________________________________________________________________________________________________________________________________________________________________________________________________________________________

220
APPENDIX E
EXAMPLE OF COMPLETED WEIGHTING WORKSHOP FORM

221
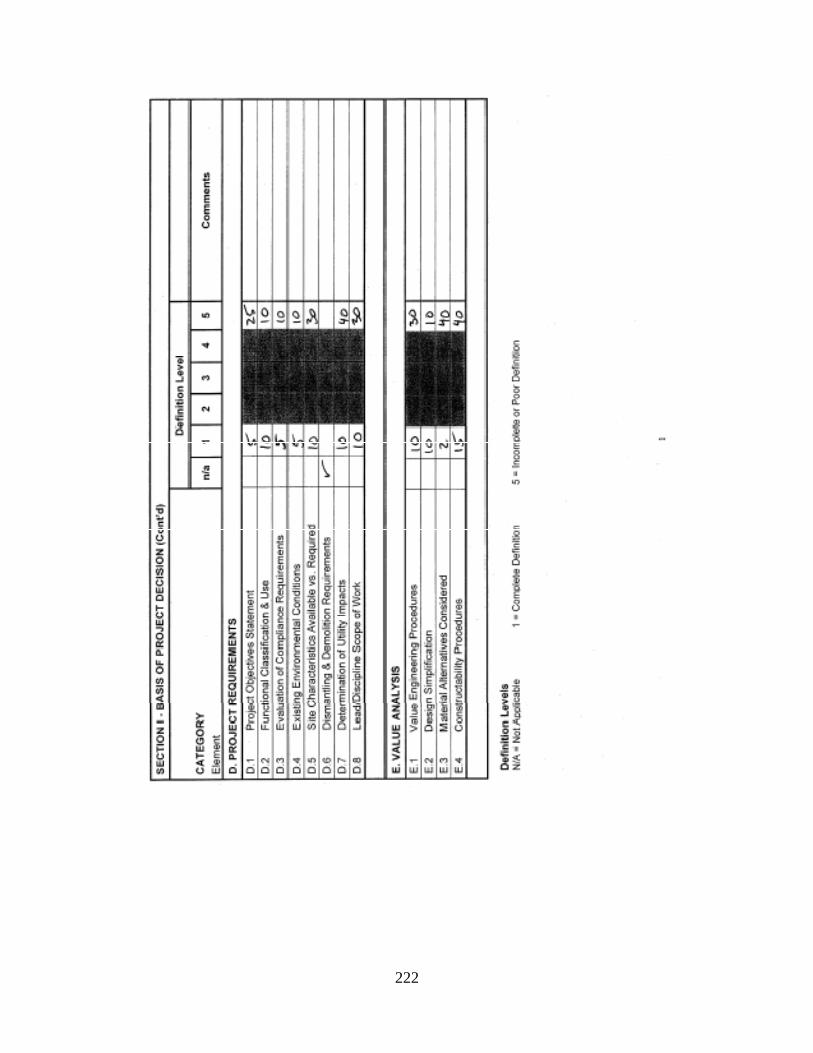
222
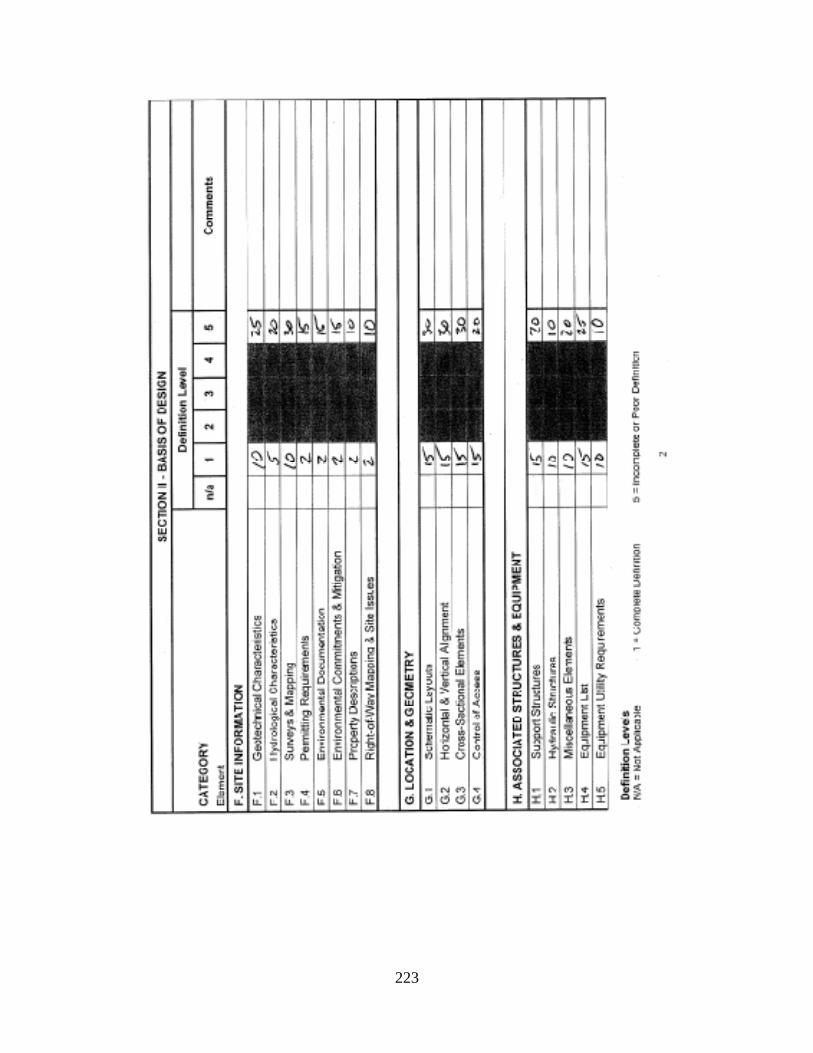
223

224
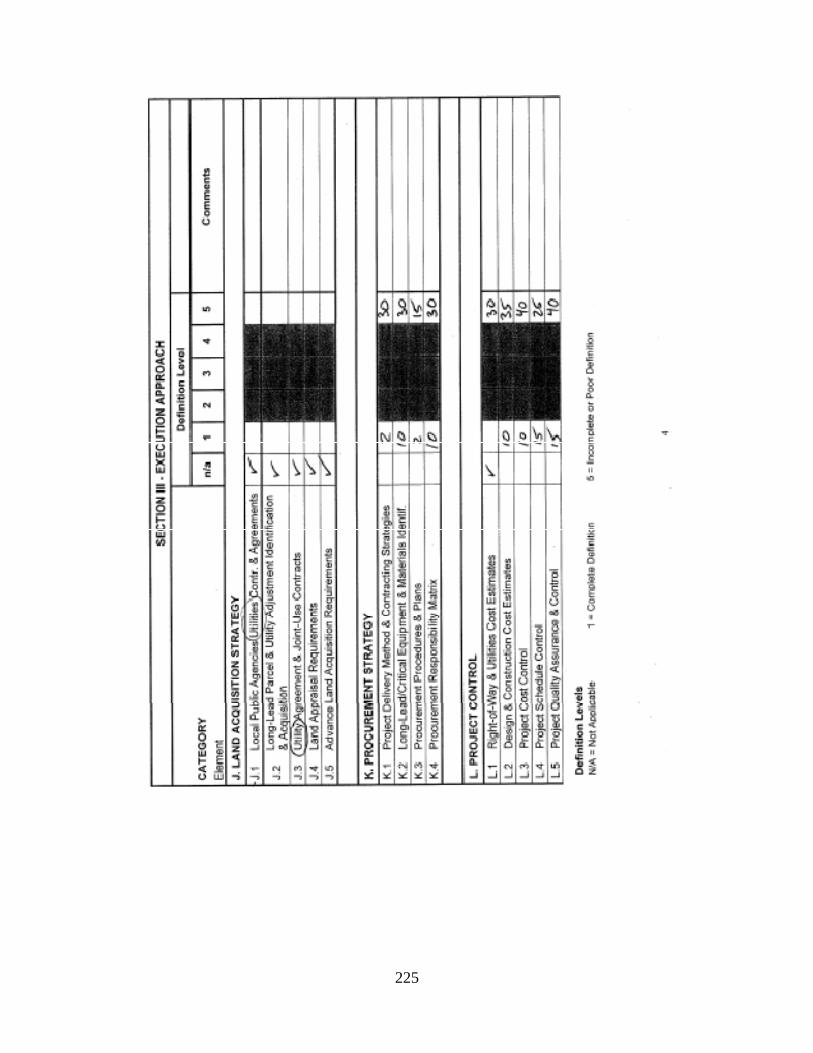
225
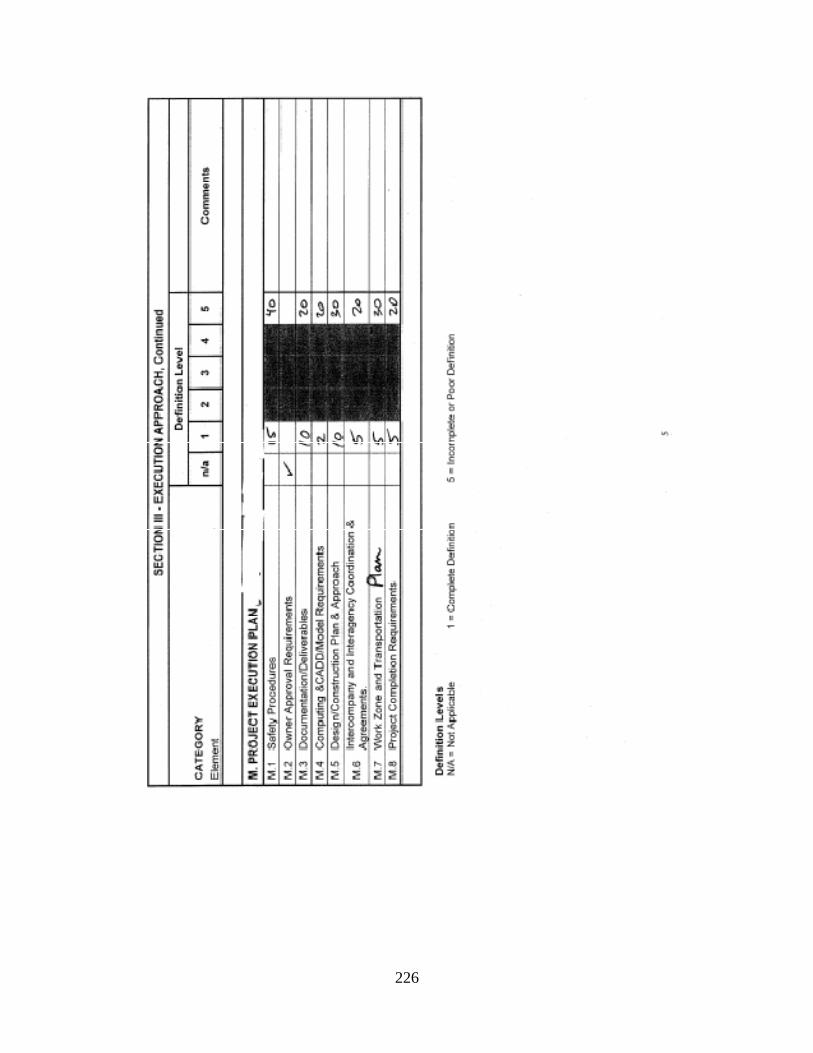
226

227
APPENDIX F
PDRI VALIDATION QUESTIONNAIRE
228
Infrastructure PDRI
Completed Projects
Testing/Validation Project Questionnaire
CII Research Team No. 268
PDRI for Infrastructure
Project Definition Rating Index (PDRI) Questionnaire
A Research Project into the development of scope definition tool for infrastructure projects

229
Date Participant Dear Participant:
The Construction Industry Institute (CII) is sponsoring a research project to
develop a project scope definition tool that maximizes the chance for project success on
infrastructure projects. Part of the research methodology is to identify sources and collect
data for analysis of completed projects.
Specifically, the CII research team is investigating the level of project scope
definition process on projects prior to beginning detailed design (also known as plans,
specifications, and estimates (PS&E)) and construction for various types of infrastructure
projects. The research team has developed a project scope definition tool called the
Project Definition Rating Index (PDRI) from several workshops involving various
owners, design, and construction organizations from both public and private sectors. The
team is now testing this tool on actual projects. The research hypothesis is that the more
complete the project scope definition, the higher probability of project success. The
enclosed questionnaire is designed to test the PDRI by measuring the level of project
scope definition at the end of the front end planning (FEP) phase, and then comparing the
scope definition level to various management success metrics.
Enclosed are survey instruments that will provide information for the identified
sample project. The questionnaire should require between one and three hours to
complete. Ideally, the project should have had a project duration of six months or longer
and been completed within the past three years. We are looking for both successful and
unsuccessful projects(from your perspective), and would like projects that are greater
than $5 million in total project cost, that meet the definition of an infrastructure project as
described in subsequent attached information package.

230
The survey package is color-coded and includes a brief introduction of the PDRI
for infrastructure (blue), PDRI Questionnaire (which includes the Project Score Sheet)
(white), and PDRI Element Descriptions (yellow). Contents of the survey package are
differentiated in colors to assist in your easy identification of each item. Please complete
the white PDRI Questionnaire and pink PDRI scoresheet and return it in PDF format via
email to [email protected] or fax to (480)-965-1769. The rest of the material is
enclosed for your information and does not need to be returned. If you have any
questions in regard to the questionnaire and or the research project in general, please feel
free to contact me at (480) 965-7972, [email protected] or Evan Bingham at 480-
727-6768, [email protected]
CII will be publishing the results of this investigation including conclusions and
recommendations. All of the information gathered will be held in the strictest confidence
with the input only seen and evaluated by the ASU research team. Companies providing
validation data will be listed as a participant in the project and will receive copies of the
research summary when published in 2010. In addition, we will provide feedback to you
in the form of benchmarking your project versus others in the sample once all data have
been analyzed.
Your participation in this effort is appreciated by the research team and the
Construction Industry Institute. You will be making a significant contribution toward the
development and validation of the PDRI for infrastructure projects. The benchmarking
information as well as the PDRI publications provided to you in return should also
directly benefit your future infrastructure projects.
Sincerely,
231
G. Edward Gibson, Jr., Ph.D., P.E.
Programs Chairman and Professor
Del E. Webb School of Construction
School of Sustainable Engineering and the Built Environment
PO Box 870204
Tempe, AZ 85287-0204
Encl. (3)
PDRI for Infrastructure Introduction – Blue front sheet
PDRI for Infrastructure Questionnaire – White
PDRI Scoresheet – Pink front sheet
PDRI Element Descriptions – Yellow front sheet
232
Project Definition Rating Index (PDRI) for Infrastructure
Introduction
The construction industry needs a user-friendly tool to assist in defining project scope and maximizing the chance of project success for infrastructure projects. Like the industrial and building sectors, the infrastructure sector frequently suffers from poor or incomplete project scope definition. Early planning may not be performed well in the infrastructure sector because there is no perceived reason to expend the resources required. A quantitative understanding of scope definition issues during front end planning (FEP) has not been studied. A multi-disciplinary research team at the Construction Industry Institute (CII) representing all the key participants in the project process including owners, engineers and constructors is working to develop a PDRI that is both user friendly and effective. The work completed in this research should significantly enhance the project environment in the infrastructure industry by improving predictability of project parameters, reducing the cost of design and construction, preserving schedule, reducing risk during project execution, improving project team alignment and communication, assuring customer satisfaction, and improving the probability of a successful project.
Although recent CII research has raised the awareness of the process and benefits of FEP, there is still not a publicly available tool for determining the adequacy of scope definition for infrastructure projects. Accordingly, the fundamental objective of this research investigation centers on developing a PDRI for Infrastructure Projects. The format of the tool will be similar to the PDRI for industrial projects (outlined in CII Implementation Resource 113-2) and the PDRI for Building Projects (outlined in CII Implementation Resource 155-2). It is intended to be a general-use, scope definition tool that addresses infrastructure projects involving the transportation of people or freight, energy, and fluids, including but not limited to:
• Highways • Water Distribution • Railways • Levees • Airports • Pipelines • Canals • Electric Transmission & Distribution • Tunnels • Border Security Fencing • Waste Water Collection • Wide Area Networks
233
Notice that a distinguishing feature of all these projects is their horizontal nature (i.e., vectors). Frequently, they also have significant vertical construction components (i.e., nodes). An example would be the waste-water process with a network of sewer lines (vectors), lift stations and a waste water treatment plant (nodes). The PDRI Infrastructure is suitable for the vector components and the PDRI for Buildings or Industrial Projects is suitable for the various nodes. Value-Added Benefits The expected benefits of this effort should be similar to benefits realized by development of the PDRI's for Industrial Projects and Buildings. Results from usage of the PDRI's have indicated an increase in project budget predictability of almost 20 percent on average versus authorization estimate, with similar results for schedule, change orders, and operability. Included in these results are real cost savings of greater than 10 percent per project. With the volume of infrastructure projects constructed each year, the potential for savings through improved capital effectiveness, reduction of disputes, and improved right-of-way acquisition is several billion dollars using the PDRI for better scope definition. Probably the most important benefit of the tool is a better understanding of what constitutes good scope development and correspondingly the improvement of alignment and communication among project stakeholders. Methodology The methodology for producing the PDRI tool was developed and proven in previous research. The final draft of the PDRI for infrastructure projects has already been developed and is currently being evaluated by industry participants. The PDRI score sheet consists of three main sections, which are broken down into 13 categories that are then further broken down into 68 elements. Sections, categories and elements contained in the score sheet are given in the Validation Questionnaire. Approximately 50 pages of detailed descriptions have been developed to support completion of the scope.
Steps remaining in the development effort include: 1. Validating the tool through testing on sample projects 2. Linking scope definition elements in the PDRI to a logic flow diagram 3. Developing publications and deploying to industry
Products of the Research A research report, research summary, and implementation resource of the PDRI for Buildings will be completed in late spring 2010. A CII Annual Conference presentation is anticipated for August 2010. For more information, reference http://www.contruction-institute.org.

234
VALIDATION QUESTIONNAIRE PROJECT DEFINITION RATING INDEX (PDRI)
FOR INFRASTRUCTURE PROJECTS
Construction Industry Institute (CII) Research Team 268
PROJECT BACKGROUND INFORMATION
1.0. Date: ________________ 1.1. Company Name: ___________________________________________________ 1.2. Point of Contact: 1. Name: ______________________________________________________ 2. Title: _______________________________________________________ 3. Address: ___________________________________________________ ___________________________________________________ 4. Tel. No.: _____________________ Fax No.: ____________________ 5. E-mail: ______________________________________________________ 2.0. General Project Information: 1. Project Name: _________________________________________________ 2. Project ID Number (if applicable): ________________________________ 3. In what town or city is the project located? __________________________ In what state or province? ________________________________________ 4. What type of facility is this project? (choose one)

235
[ ] People/Freight Transportation [ ] Fluids Transmission [ ] Energy Transmission 5. What is the name, type and size of the project? (i.e., Jollyville Highway,
Connector, 23.3 mile) ____________________________________________________________________________________________________________________________________________________________________________________________________________________________________________________________________________________________________________________________________________________
6. Was the project new construction or renovation? (if renovation cost is
greater than 50% of total, consider it as a renovation)
[ ] New construction [ ] Renovation
7. Is there anything unique about this project? (e.g., project required relocation of Native American burial site)
Please describe: ______________________________________________________________________________________________________________________________________________________________________________________________________________________________________________________________________________________________________________________________________________________________________________________________________
8. What was the planned execution contracting approach that you used on your project (if known)?
[ ] Design-Build [ ] Design-Bid-Build [ ] Construction-Manager at Risk [ ] Other (please specify) __________________________________ 9. Did the project require significant right-of-way acquisition? [ ] None [ ] Less than 10% of total project cost [ ] 10-30% of total project cost [ ] More than 30% of total project cost 10. Please describe right of way issues encountered (if applicable) __________________________________________________________________________________________________________________________________________________________________________________________________________________________________________________________________________________________________________________________________________________________________________________________________________________________________________________________________________________________________________________________________________________________________

236
2.1. Schedule Information:
1. Please provide the following schedule information (if known):
Planned Actual Item (mm/yy) (mm/yy) Start Date of Detailed Design Detailed Design Start Date of Construction Date of Substantial Completion
Do you have any comments regarding any causes or effects of schedule changes (e.g., special causes, freak occurrences, etc.)? ____________________________________________________________ ____________________________________________________________ ____________________________________________________________
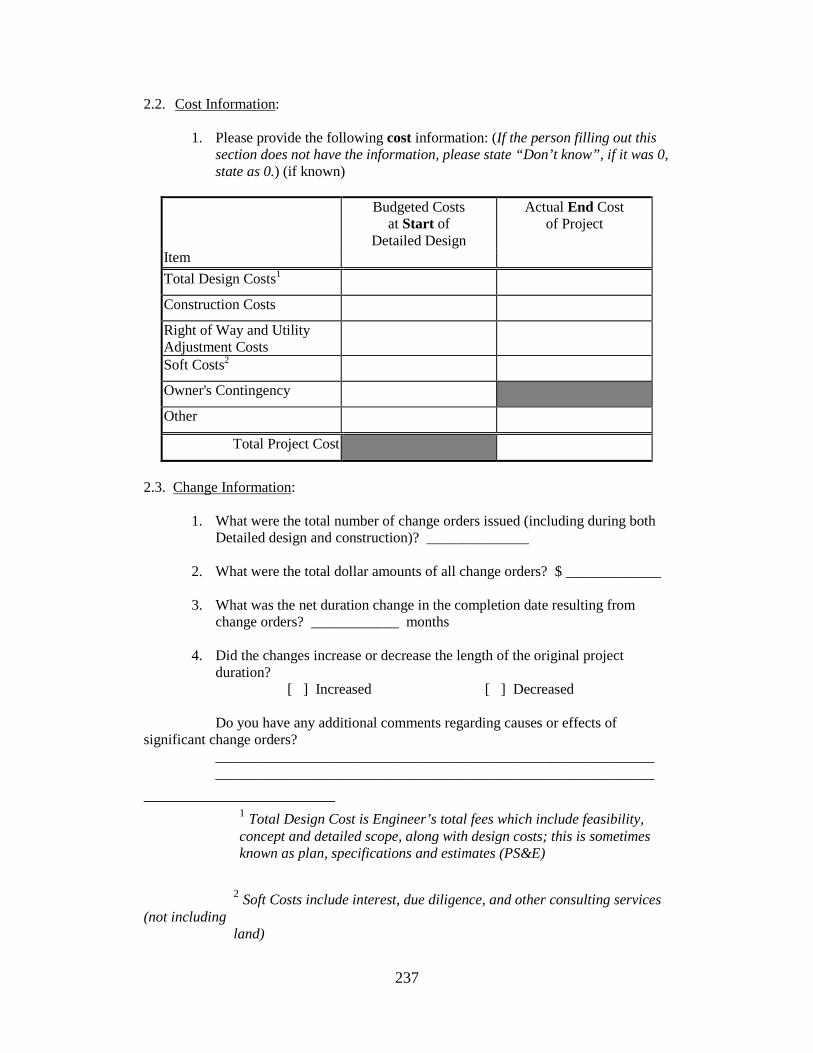
237
2.2. Cost Information:
1. Please provide the following cost information: (If the person filling out this section does not have the information, please state “Don’t know”, if it was 0, state as 0.) (if known)
Budgeted Costs
at Start of Detailed Design
Actual End Cost of Project
Item Total Design Costs1
Construction Costs
Right of Way and Utility Adjustment Costs
Soft Costs2
Owner's Contingency
Other
Total Project Cost
2.3. Change Information:
1. What were the total number of change orders issued (including during both Detailed design and construction)? ______________
2. What were the total dollar amounts of all change orders? $ _____________ 3. What was the net duration change in the completion date resulting from
change orders? ____________ months 4. Did the changes increase or decrease the length of the original project duration? [ ] Increased [ ] Decreased Do you have any additional comments regarding causes or effects of significant change orders? ____________________________________________________________ ____________________________________________________________
1 Total Design Cost is Engineer’s total fees which include feasibility, concept and detailed scope, along with design costs; this is sometimes known as plan, specifications and estimates (PS&E)
2 Soft Costs include interest, due diligence, and other consulting services (not including land)
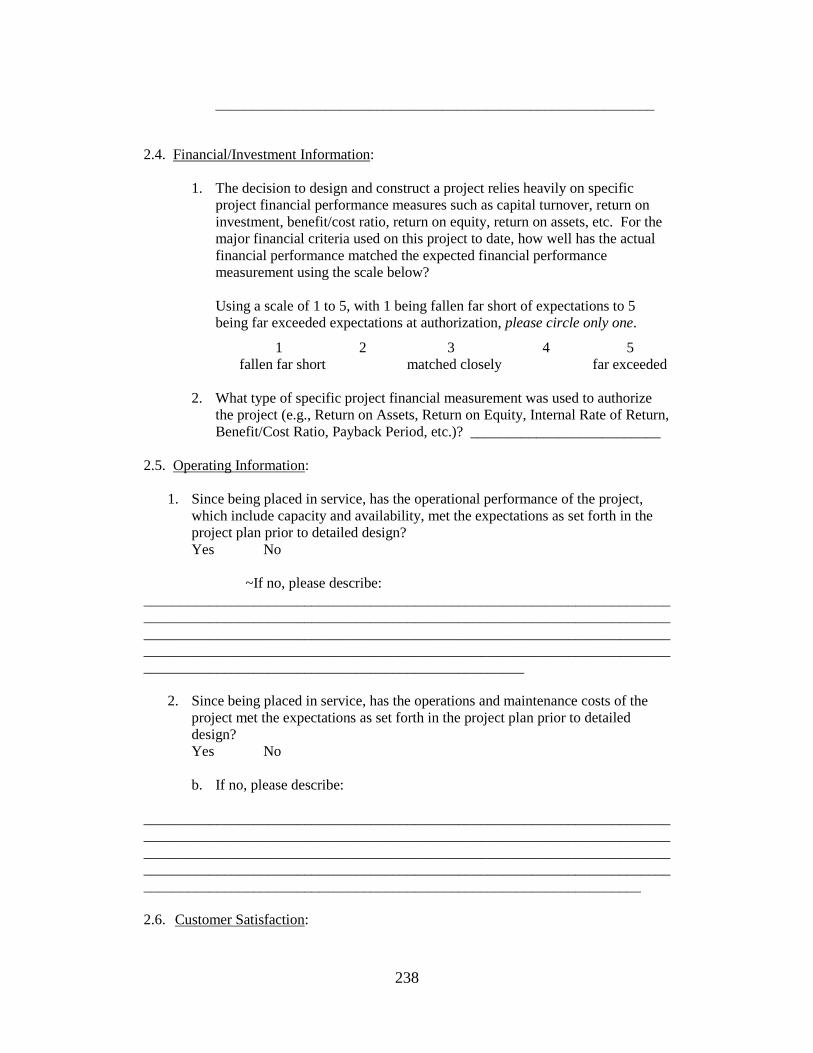
238
____________________________________________________________ 2.4. Financial/Investment Information:
1. The decision to design and construct a project relies heavily on specific project financial performance measures such as capital turnover, return on investment, benefit/cost ratio, return on equity, return on assets, etc. For the major financial criteria used on this project to date, how well has the actual financial performance matched the expected financial performance measurement using the scale below?
Using a scale of 1 to 5, with 1 being fallen far short of expectations to 5 being far exceeded expectations at authorization, please circle only one.
1 2 3 4 5 fallen far short matched closely far exceeded 2. What type of specific project financial measurement was used to authorize
the project (e.g., Return on Assets, Return on Equity, Internal Rate of Return, Benefit/Cost Ratio, Payback Period, etc.)? __________________________
2.5. Operating Information:
1. Since being placed in service, has the operational performance of the project, which include capacity and availability, met the expectations as set forth in the project plan prior to detailed design? Yes No
~If no, please describe: ____________________________________________________________________________________________________________________________________________________________________________________________________________________________________________________________________________________________________________________________________________________
2. Since being placed in service, has the operations and maintenance costs of the project met the expectations as set forth in the project plan prior to detailed design? Yes No b. If no, please describe:
____________________________________________________________________________________________________________________________________________________________________________________________________________________________________________________________________________________________________________________________________________________________________ 2.6. Customer Satisfaction:
239
1. Reflecting on the overall project, rate the success of the project using a scale of 1 to 5, with 1 being very unsuccessful to 5 being very successful: (circle only one) 1 2 3 4 5 Do you have any additional comments regarding customer satisfaction? ______________________________________________________________ ______________________________________________________________ ______________________________________________________________
3.0. Project Rating Information:
Next, please complete the Project Rating Information form located on the next few pages per the instructions below.
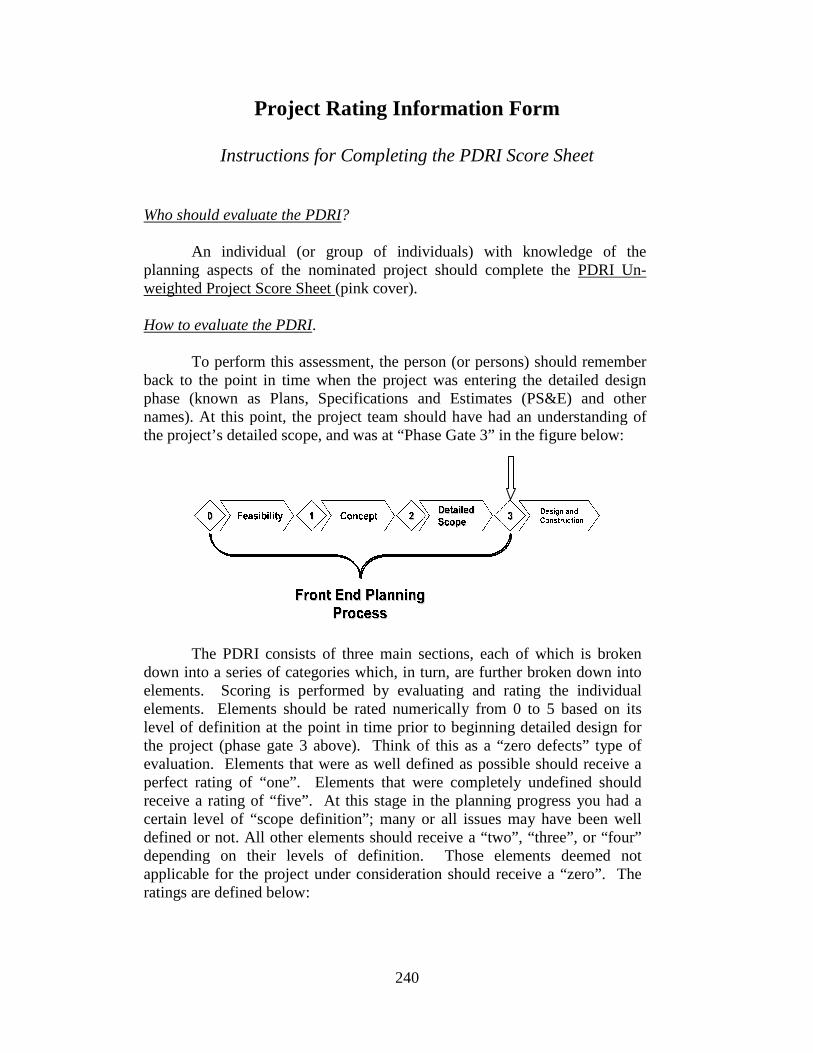
Project Rating Informa
Instructions for Completing the PDRI
Who should evaluate the PDRI
An individual (or groupplanning aspects of the nominated project weighted Project Score Sheet
How to evaluate the PDRI
To perform this assessment, the person (or persons) should
back to the point in timephase (known as Plans, Specifications and Estimates (PS&E) and other names). At this point, the project team should have hadthe project’s detailed scope
The PDRI consists of three main sections, each of which is broken
down into a series of categories which, in turn, are further broken down into elements. Scoring is performed by evaluating and rating the individual elements. Elements should be rated numelevel of definition at the point in time prior to beginning detailed design for the project (phase gate 3 above). Think of this as a “zero defects” type of evaluation. Elements that were as well defined as possible shouldperfect rating of “one”. Elements that were completely undefined should receive a rating of “five”. certain level of “scope definition”defined or not. All other elements should depending on their levels of definition. Those elements deemed not applicable for the project under consideration should receive a “zero”. The ratings are defined below:
240
Project Rating Information Form
Instructions for Completing the PDRI Score Sheet
Who should evaluate the PDRI?
(or group of individuals) with knowledge of the planning aspects of the nominated project should complete the PDRI Unweighted Project Score Sheet (pink cover).
How to evaluate the PDRI.
perform this assessment, the person (or persons) should remember the point in time when the project was entering the detailed design
phase (known as Plans, Specifications and Estimates (PS&E) and other At this point, the project team should have had an understanding of
detailed scope, and was at “Phase Gate 3” in the figure below:
The PDRI consists of three main sections, each of which is broken down into a series of categories which, in turn, are further broken down into elements. Scoring is performed by evaluating and rating the individual elements. Elements should be rated numerically from 0 to 5 based on its level of definition at the point in time prior to beginning detailed design for the project (phase gate 3 above). Think of this as a “zero defects” type of evaluation. Elements that were as well defined as possible should receive a perfect rating of “one”. Elements that were completely undefined should receive a rating of “five”. At this stage in the planning progress you hadcertain level of “scope definition”; many or all issues may have been well
other elements should receive a “two”, “three”, or “four” depending on their levels of definition. Those elements deemed not applicable for the project under consideration should receive a “zero”. The ratings are defined below:
of individuals) with knowledge of the PDRI Un-
remember entering the detailed design
phase (known as Plans, Specifications and Estimates (PS&E) and other an understanding of
Phase Gate 3” in the figure below:
The PDRI consists of three main sections, each of which is broken down into a series of categories which, in turn, are further broken down into elements. Scoring is performed by evaluating and rating the individual
rically from 0 to 5 based on its level of definition at the point in time prior to beginning detailed design for the project (phase gate 3 above). Think of this as a “zero defects” type of
receive a perfect rating of “one”. Elements that were completely undefined should
had a ; many or all issues may have been well
a “two”, “three”, or “four” depending on their levels of definition. Those elements deemed not applicable for the project under consideration should receive a “zero”. The
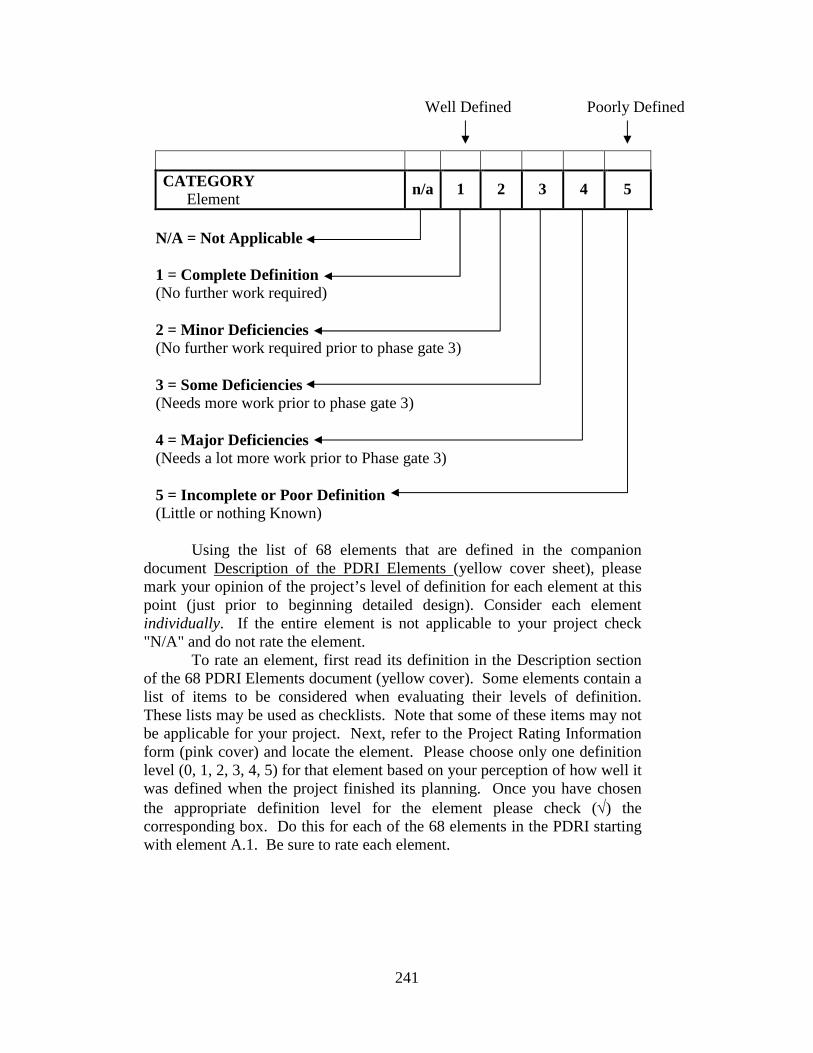
241
CATEGORY Element
n/a 1 2 3 4 5
N/A = Not Applicable 1 = Complete Definition (No further work required) 2 = Minor Deficiencies (No further work required prior to phase gate 3) 3 = Some Deficiencies (Needs more work prior to phase gate 3) 4 = Major Deficiencies (Needs a lot more work prior to Phase gate 3) 5 = Incomplete or Poor Definition (Little or nothing Known)
Using the list of 68 elements that are defined in the companion
document Description of the PDRI Elements (yellow cover sheet), please mark your opinion of the project’s level of definition for each element at this point (just prior to beginning detailed design). Consider each element individually. If the entire element is not applicable to your project check "N/A" and do not rate the element.
To rate an element, first read its definition in the Description section of the 68 PDRI Elements document (yellow cover). Some elements contain a list of items to be considered when evaluating their levels of definition. These lists may be used as checklists. Note that some of these items may not be applicable for your project. Next, refer to the Project Rating Information form (pink cover) and locate the element. Please choose only one definition level (0, 1, 2, 3, 4, 5) for that element based on your perception of how well it was defined when the project finished its planning. Once you have chosen the appropriate definition level for the element please check (√) the corresponding box. Do this for each of the 68 elements in the PDRI starting with element A.1. Be sure to rate each element.
Well Defined Poorly Defined
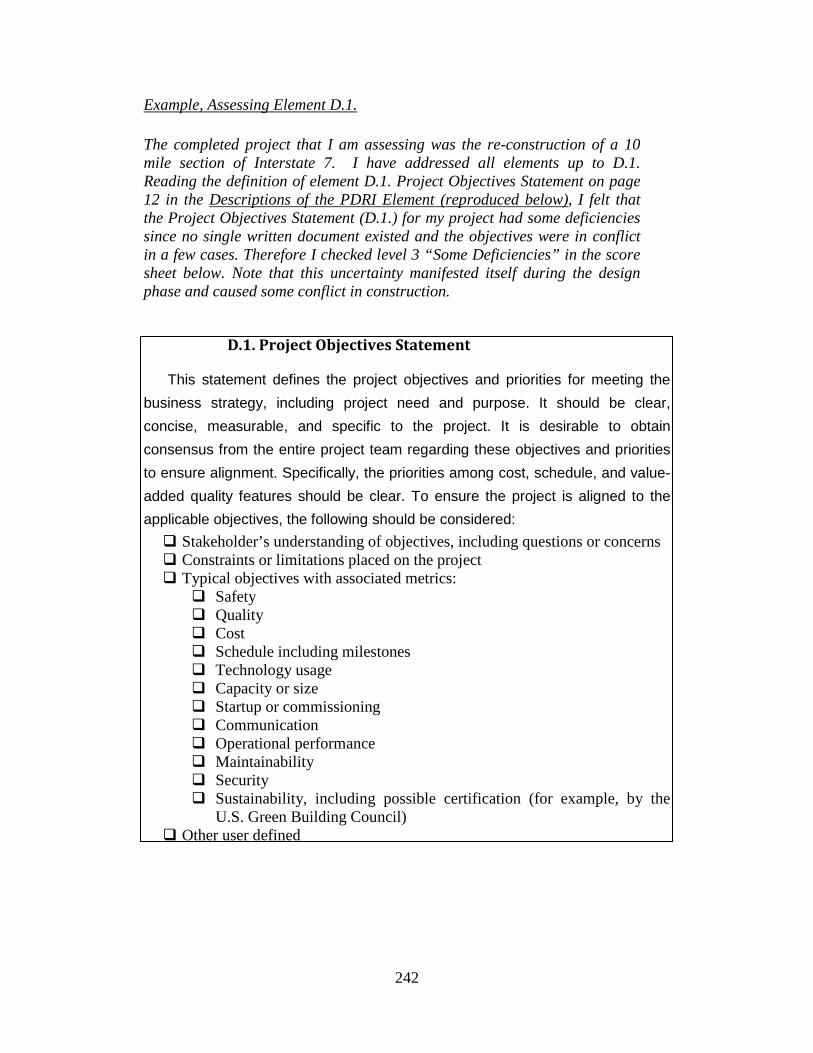
242
Example, Assessing Element D.1.
The completed project that I am assessing was the re-construction of a 10 mile section of Interstate 7. I have addressed all elements up to D.1. Reading the definition of element D.1. Project Objectives Statement on page 12 in the Descriptions of the PDRI Element (reproduced below), I felt that the Project Objectives Statement (D.1.) for my project had some deficiencies since no single written document existed and the objectives were in conflict in a few cases. Therefore I checked level 3 “Some Deficiencies” in the score sheet below. Note that this uncertainty manifested itself during the design phase and caused some conflict in construction.
D.1. Project Objectives Statement
This statement defines the project objectives and priorities for meeting the
business strategy, including project need and purpose. It should be clear,
concise, measurable, and specific to the project. It is desirable to obtain
consensus from the entire project team regarding these objectives and priorities
to ensure alignment. Specifically, the priorities among cost, schedule, and value-
added quality features should be clear. To ensure the project is aligned to the
applicable objectives, the following should be considered:
� Stakeholder’s understanding of objectives, including questions or concerns � Constraints or limitations placed on the project � Typical objectives with associated metrics:
� Safety � Quality � Cost � Schedule including milestones � Technology usage � Capacity or size � Startup or commissioning � Communication � Operational performance � Maintainability � Security � Sustainability, including possible certification (for example, by the
U.S. Green Building Council) � Other user defined
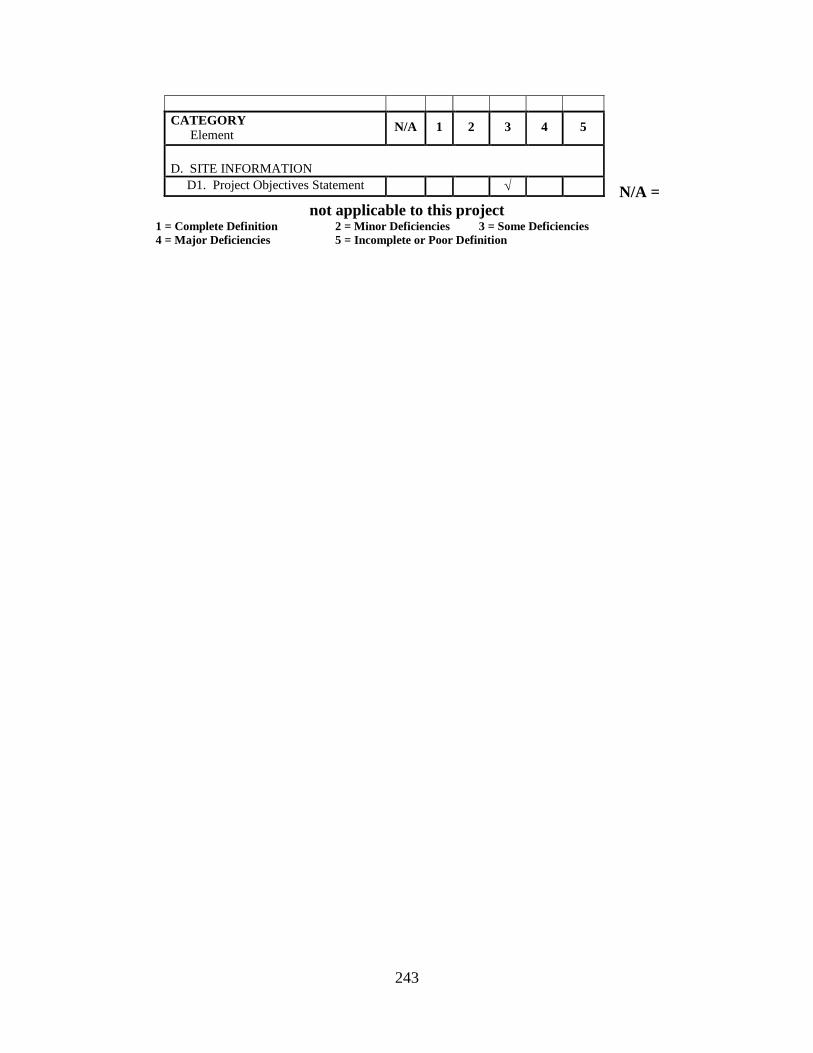
243
N/A = not applicable to this project
1 = Complete Definition 2 = Minor Deficiencies 3 = Some Deficiencies 4 = Major Deficiencies 5 = Incomplete or Poor Definition
CATEGORY Element
N/A 1 2 3 4 5
D. SITE INFORMATION
D1. Project Objectives Statement √
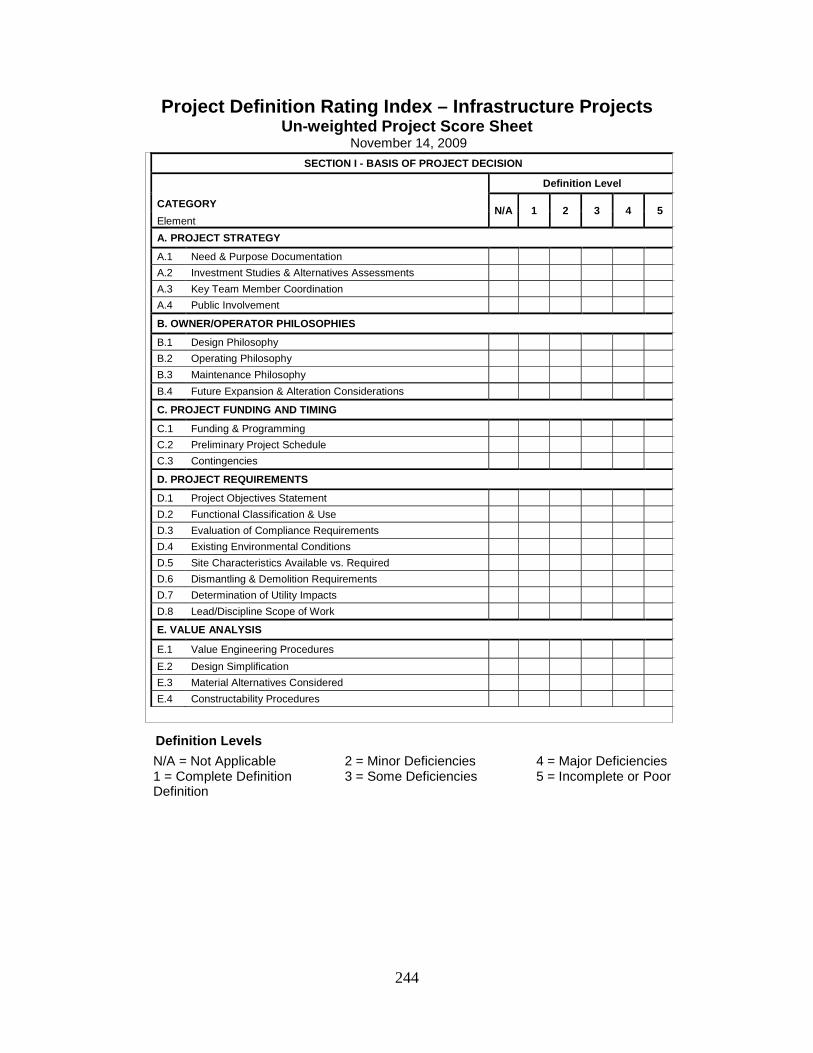
244
Project Definition Rating Index – Infrastructure Pr ojects Un-weighted Project Score Sheet
November 14, 2009
Definition Levels
SECTION I - BASIS OF PROJECT DECISION
Definition Level
CATEGORY N/A 1 2 3 4 5
Element
A. PROJECT STRATEGY
A.1 Need & Purpose Documentation A.2 Investment Studies & Alternatives Assessments A.3 Key Team Member Coordination A.4 Public Involvement
B. OWNER/OPERATOR PHILOSOPHIES
B.1 Design Philosophy B.2 Operating Philosophy B.3 Maintenance Philosophy B.4 Future Expansion & Alteration Considerations
C. PROJECT FUNDING AND TIMING
C.1 Funding & Programming C.2 Preliminary Project Schedule C.3 Contingencies
D. PROJECT REQUIREMENTS
D.1 Project Objectives Statement D.2 Functional Classification & Use D.3 Evaluation of Compliance Requirements D.4 Existing Environmental Conditions D.5 Site Characteristics Available vs. Required D.6 Dismantling & Demolition Requirements D.7 Determination of Utility Impacts D.8 Lead/Discipline Scope of Work
E. VALUE ANALYSIS
E.1 Value Engineering Procedures E.2 Design Simplification E.3 Material Alternatives Considered E.4 Constructability Procedures
N/A = Not Applicable 2 = Minor Deficiencies 4 = Major Deficiencies 1 = Complete Definition 3 = Some Deficiencies 5 = Incomplete or Poor Definition

245
Definition Levels
SECTION II - BASIS OF DESIGN
Definition Level
CATEGORY N/A 1 2 3 4 5
Element
F. SITE INFORMATION
F.1 Geotechnical Characteristics F.2 Hydrological Characteristics F.3 Surveys & Mapping F.4 Permitting Requirements F.5 Environmental Documentation F.6 Environmental Commitments & Mitigation F.7 Property Descriptions F.8 Right-of-Way Mapping & Site Issues
G. LOCATION and GEOMETRY
G.1 Schematic Layouts G.2 Horizontal & Vertical Alignment G.3 Cross-Sectional Elements G.4 Control of Access
H. ASSOCIATED STRUCTURES and EQUIPMENT
H.1 Support Structures H.2 Hydraulic Structures H.3 Miscellaneous Elements H.4 Equipment List H.5 Equipment Utility Requirements
I. PROJECT DESIGN PARAMETERS
I.1 Capacity I.2 Safety & Hazards I.3 Civil/Structural I.4 Mechanical/Equipment I.5 Electrical/Controls I.6 Operations/Maintenance
N/A = Not Applicable 2 = Minor Deficiencies 4 = Major Deficiencies 1 = Complete Definition 3 = Some Deficiencies 5 = Incomplete or Poor Definition

246
Definition Levels
N/A = Not Applicable 2 = Minor Deficiencies 4 = Major Deficiencies 1 = Complete Definition 3 = Some Deficiencies 5 = Incomplete or Poor Definition
SECTION III - EXECUTION APPROACH
Definition Level
CATEGORY N/A 1 2 3 4 5
Element
J. LAND ACQUISITION STRATEGY
J.1 Local Public Agencies Contr. & Agreements
J.2 Long-Lead Parcel & Utility Adjustment Identification & Acquisition
J.3 Utility Agreement & Joint-Use Contracts J.4 Land Appraisal Requirements J.5 Advance Land Acquisition Requirements
K. PROCUREMENT STRATEGY
K.1 Project Delivery Method & Contracting Strategies K.2 Long-Lead/Critical Equipment & Materials Identif. K.3 Procurement Procedures & Plans K.4 Procurement Responsibility Matrix
L. PROJECT CONTROL
L.1 Right-of-Way & Utilities Cost Estimates L.2 Design & Construction Cost Estimates L.3 Project Cost Control L.4 Project Schedule Control L.5 Project Quality Assurance & Control
M. PROJECT EXECUTION PLAN
M.1 Safety Procedures M.2 Owner Approval Requirements M.3 Documentation/Deliverables M.4 Computing & CADD/Model Requirements M.5 Design/Construction Plan & Approach M.6 Intercompany and Interagency Coord. & Agreemnts. M.7 Work Zone and Transportation Plan M.8 Project Completion Requirements
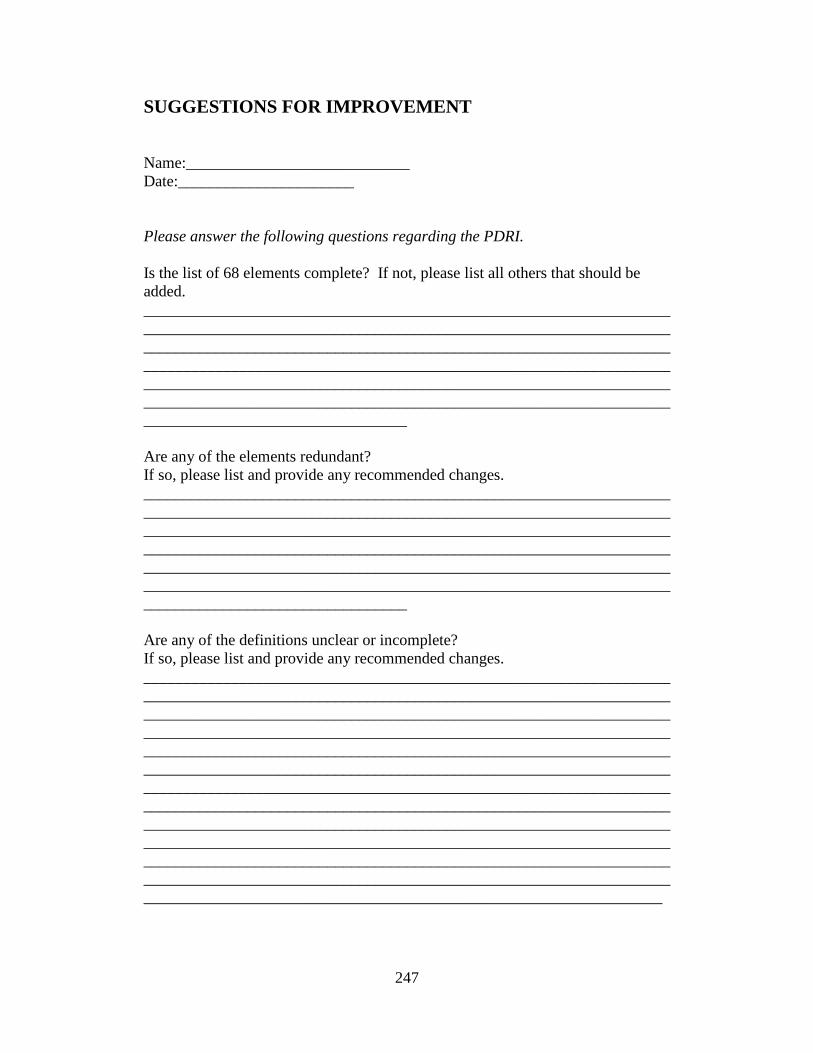
247
SUGGESTIONS FOR IMPROVEMENT Name:____________________________ Date:______________________ Please answer the following questions regarding the PDRI. Is the list of 68 elements complete? If not, please list all others that should be added. _____________________________________________________________________________________________________________________________________________________________________________________________________________________________________________________________________________________________________________________________________________________________________________________________________________________________________________ Are any of the elements redundant? If so, please list and provide any recommended changes. _____________________________________________________________________________________________________________________________________________________________________________________________________________________________________________________________________________________________________________________________________________________________________________________________________________________________________________ Are any of the definitions unclear or incomplete? If so, please list and provide any recommended changes. _________________________________________________________________________________________________________________________________________________________________________________________________________________________________________________________________________________________________________________________________________________________________________________________________________________________________________________________________________________________________________________________________________________________________________________________________________________________________________________________________________________________________________________________________________________________________________________________________________________________________________________________________________________________
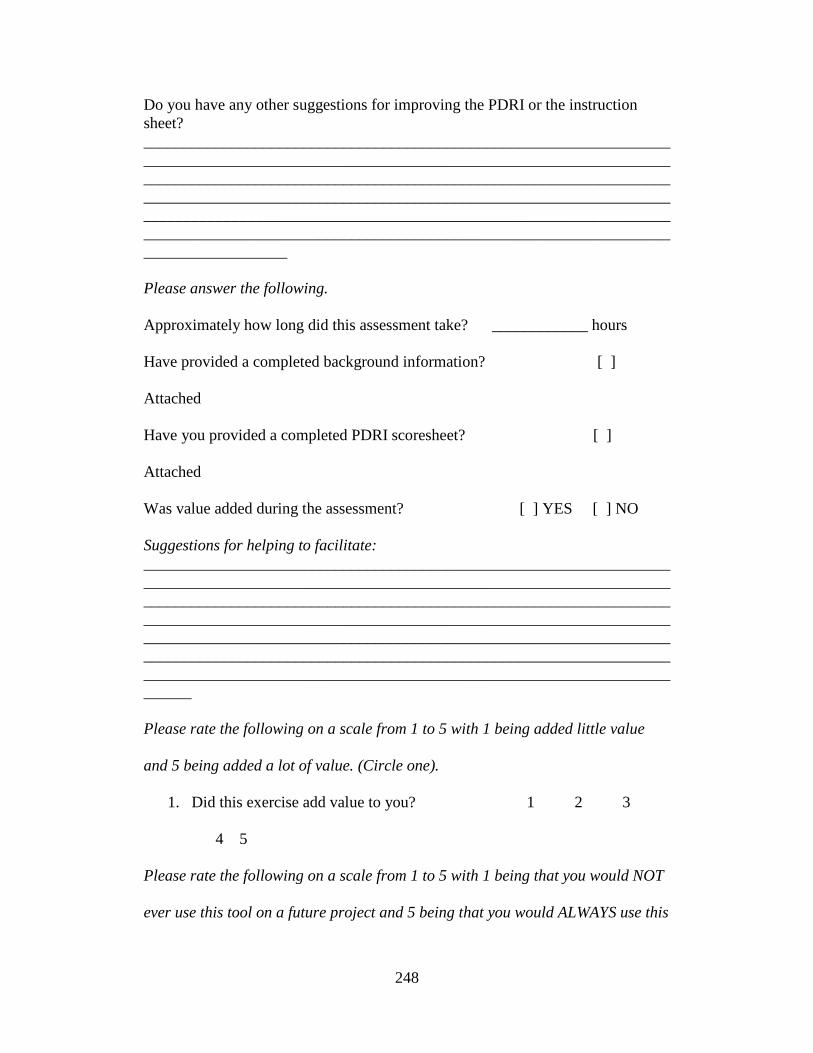
248
Do you have any other suggestions for improving the PDRI or the instruction sheet? ______________________________________________________________________________________________________________________________________________________________________________________________________________________________________________________________________________________________________________________________________________________________________________________________________________________________ Please answer the following.
Approximately how long did this assessment take? ____________ hours
Have provided a completed background information? [ ]
Attached
Have you provided a completed PDRI scoresheet? [ ]
Attached
Was value added during the assessment? [ ] YES [ ] NO
Suggestions for helping to facilitate: ____________________________________________________________________________________________________________________________________________________________________________________________________________________________________________________________________________________________________________________________________________________________________________________________________________________________________________________________________________________ Please rate the following on a scale from 1 to 5 with 1 being added little value
and 5 being added a lot of value. (Circle one).
1. Did this exercise add value to you? 1 2 3
4 5
Please rate the following on a scale from 1 to 5 with 1 being that you would NOT
ever use this tool on a future project and 5 being that you would ALWAYS use this
249
tool on a future project.
2. Would you use this tool on a future project? 1 2 3 4 5
Any other comments: ____________________________________________________________________________________________________________________________________________________________________________________________________________________________________________________________________________________________________________________________________________________________________________________________________________________________________________________________________________________________________________________________________________________________________________________________________________________________________________________________________________________________________________________________________________________________________________________________________________ We gladly welcome your opinions and sincerely request any feedback regarding items that may be unclear, redundant, unnecessary, or left out. If at any time you have question or need help filling out the PDRI score sheet don’t hesitate to call Evan Bingham: (480)-727-6768, cell phone (602)-541-1580. Thank you very much for your time and effort. If you have any questions, please contact:
Dr. G. Edward Gibson, Jr. Chairman, Del E. Webb School of Construction Programs and Sunstate Chair of Construction Mngt and Engrg, Arizona State University, Tempe, AZ 85287. Office: (480)-965-7972 Fax: (480)-965-1769 [email protected] Evan Bingham. Graduate Research Assistant, Arizona State University. (480)-727-6768 [email protected]
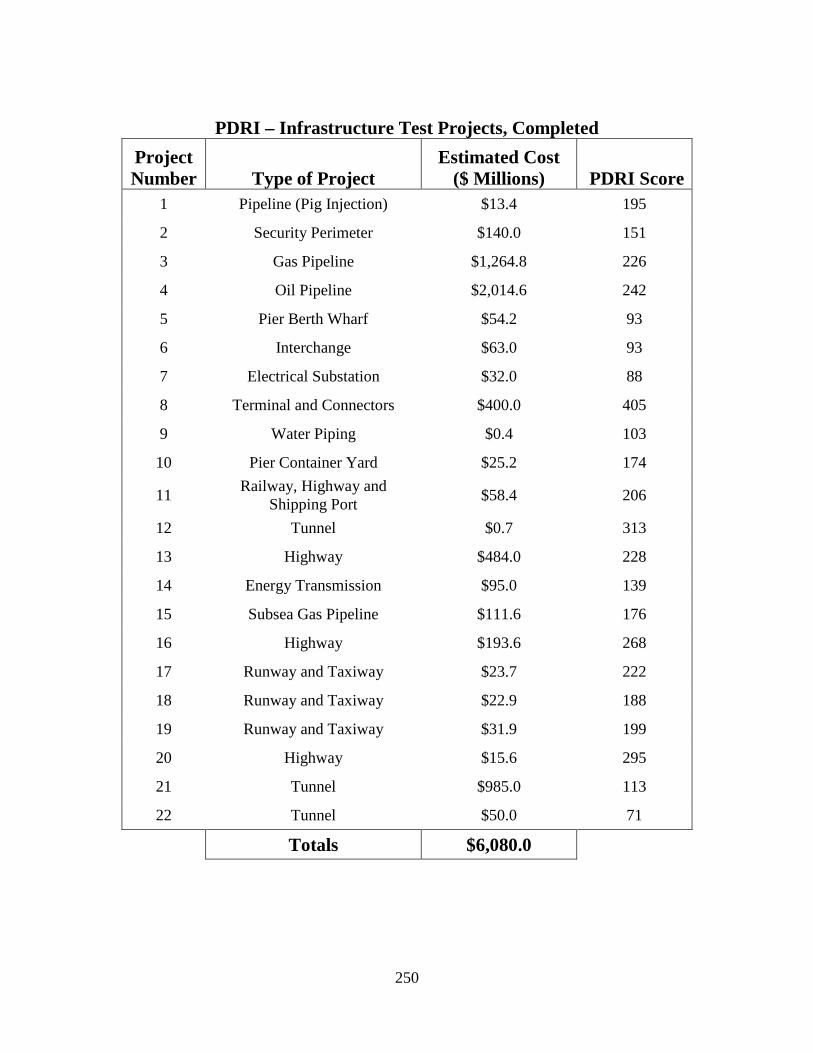
250
PDRI – Infrastructure Test Projects, Completed
Project Number Type of Project
Estimated Cost ($ Millions) PDRI Score
1 Pipeline (Pig Injection) $13.4 195
2 Security Perimeter $140.0 151
3 Gas Pipeline $1,264.8 226
4 Oil Pipeline $2,014.6 242
5 Pier Berth Wharf $54.2 93
6 Interchange $63.0 93
7 Electrical Substation $32.0 88
8 Terminal and Connectors $400.0 405
9 Water Piping $0.4 103
10 Pier Container Yard $25.2 174
11 Railway, Highway and
Shipping Port $58.4 206
12 Tunnel $0.7 313
13 Highway $484.0 228
14 Energy Transmission $95.0 139
15 Subsea Gas Pipeline $111.6 176
16 Highway $193.6 268
17 Runway and Taxiway $23.7 222
18 Runway and Taxiway $22.9 188
19 Runway and Taxiway $31.9 199
20 Highway $15.6 295
21 Tunnel $985.0 113
22 Tunnel $50.0 71
Totals $6,080.0

251
In-Progress PDRI – Infrastructure Test Projects
Project Number Type of Project
Project Cost ($ Millions) PDRI Score
1 Gas Pipeline TBD 142
2 Gas Pipeline $1,407.1 663
3 Steam Pipeline (in utility
vault) $628.0 283
4 Oil Pipeline $100.0 92
Totals $2,135.1


