
1
Development of a SAS® Dashboard to Support
Administrative Data Collection Processes
Marianne Reifschneider and Susan Harris1
U.S. Energy Information Administration
Abstract
The U.S. Energy Information Administration (EIA) collects, analyzes, and disseminates independent and impartial
energy information for multiple audiences and purposes. EIA collects data via more than 50 surveys. As part of
EIA’s survey business process, the survey managers who oversee these surveys regularly monitor data collection via
a series of reports at each stage of the collection and data editing process. The authors developed a dashboard
system to provide survey managers one central location from which to retrieve these reports.
Reports were identified for comparison across different energy data collection programs, to address the survey
business processes, including reports providing data on frame management and on response. The focus of this paper
will be the development of a subset of reports that address common data needs for monitoring response during data
collection. The development process facilitates understanding the challenges which occurred while designing and
building this dashboard system. These challenges included the identification of commonalities and differences in
information needs of different survey staff, the development of common definitions for survey terms across reports,
and the computation of statistics within this common framework.
Introduction
How do you monitor survey processes in an organization with disparate data collection methods, disparate methods
for monitoring survey processes, and disparate terminology both for data collection and monitoring? This is often a
challenge for organizations whose data collection methods grow organically, and whose institutional structure
allows multiple collection instruments and data review systems to develop. The U.S. Energy Information
Administration (EIA), the statistical and analytical agency within the U.S. Department of Energy, is one such
organization. Historically, EIA’s organizational structure was comprised of multiple program offices organized
around different energy sources. This structure supported EIA’s mission of collecting and disseminating energy
data while allowing for the expansion of new data collection and dissemination methods for these data. Each
program office included staff who aided in survey development as well as staff responsible for information
technology support as a part of its team. The structure also encouraged the development of survey language and
performance metrics specialized to each program office rather than standardized across EIA. It also facilitated the
development of disparate data collection methods varied across multiple energy types and disparate methods for
monitoring survey processes and data.
In October 2010, EIA’s organizational structure changed, resulting in the creation of offices defined by function. As
part of this reorganization, survey development support staff moved from each program office into a newly created
office dedicated to all aspects of survey development including questionnaire design, the development of sampling
methodologies, and the development of and survey methodologies. Similarly, staff that coordinated and provided
information technology support for the collection of survey data moved from individual program offices into a new
office dedicated to providing this support EIA-wide. This achieved one of the stated goals of the reorganization:
increasing efficiency by placing staff with similar skill sets into similar work groups. More importantly, it created
offices that could provide targeted support for data collection tools and for data collection monitoring that need not
be program-office specific. Post-reorganization, information technology specialists could partner with multiple
1 The analysis and conclusions contained in this paper are those of the author(s) and do not represent the official
position of the U.S. Energy Information Administration (EIA) or the U.S. Department of Energy.

2
energy offices to continue the development of a unified data collection instrument already underway at EIA. Staff
specialized in survey development could work with multiple program offices to revise or develop new surveys.
Survey development staff could work with program offices to develop EIA-wide metrics with which to monitor
surveys. In fact, all of these possibilities are being realized at EIA.
Survey development specialists now offer survey development support to multiple energy offices. They are working
to develop common survey processes that can be implemented alongside the deployment of the new common data
collection tool. A project is also underway in which survey development specialists are designing metrics that can
aid multiple program offices and program office staff in monitoring survey processes at EIA. As a part of the effort
to design these new metrics, close attention has been paid both to theory from survey methodology and to the
practical application of theory in developing metrics that address the needs of the program office staff who will be
using them. In considering how best to design these metrics we considered four questions: Which survey
processes are we interested in monitoring? Which metrics should be used to monitor these processes? What data
should be used to calculate these metrics? What is the best and most efficient way to communicate these metrics to
program office managers, survey managers and survey staff in program offices? We answer these questions in three
ways. First we use survey methodology research as it can be applied regardless of the survey type, e.g. household or
establishment. Then we use data from our own research conducted as part of the development process to understand
how the survey processes that we have identified are carried out at EIA, and which metrics are used to monitor these
survey processes. Finally we combine best practices from survey methodology and research on survey processes at
EIA to design prototypes of metrics for use EIA-wide. We finally discuss ways to disseminate these metrics,
providing an overview of a prototype dashboard currently in development at EIA for that purpose.
Which Survey Processes are We Interested in Monitoring?
In order to answer the first research question ” What survey processes are we interested in monitoring?” we needed a
comprehensive list of all of the possible processes involved in conducting a survey. We used the survey lifecycle to
represent these processes. There are common elements of each survey lifecycle that occur irrespective of the
method used to conduct the survey (Groves et al., 2004). The survey lifecycle is preceded by the identification of a
topic of interest by researchers. After the topic about which data are collected is identified, the survey lifecycle
begins with a discussion by survey methodologists and researchers about the mode of collection and questionnaire
design. Once a mode of collection has been agreed upon and a questionnaire designed, the questionnaire is
constructed and pretested according to best practices.
The demands of survey development often mean that the linear nature of development requires deviation from the
order in which these steps are presented. However, in theory, the selection of a sampling frame follows the
pretesting of the questionnaire. The sampling frame is populated by the members of the target population who
have a chance to be selected into a survey sample. Next, a subset of the sampling frame is designed and selected.
The subset or sampling frame is the group that will provide the raw data used to construct measurements (Groves et
al., 2004). In some surveys, all units in the sampling frame will be asked to provide these raw data. After the
sample has been designed, the data collection phase begins. This phase combines questionnaire design and the
sample selection. During this stage of the survey lifecycle, survey staff pay close attention to collecting
measurements from as much of the sample as possible. During and after data collection, data are edited and coded
and then compiled into a file for use in publication and analysis. Finally the data undergo post-survey adjustments
to address coverage, sampling, nonresponse or other errors, where appropriate (Groves, et al. 2004). Now that we
have a comprehensive list of potential survey processes, we can begin the process of deciding which of these
processes should be monitored by program office staff.
We did so by identifying staff members who could reasonably be expected to participate in completing the processes
associated with each lifecycle element. For example, researchers are involved in determining a topic about which
data would be collected. Survey methodologists, survey managers, statisticians and researchers might work together
to determine the mode of survey collection and design an optimal questionnaire. Survey methodologists would test
the questionnaire. Survey methodologists and statisticians are involved in designing the sample. Program office
staff are involved in data collection, data editing and coding, and preparing data files for analysis. After completing
this exercise, we identified the survey processes that we were interested in monitoring based on the roles associated
with those processes.

3
In this case, our goal was to aid program office survey staff in monitoring survey processes. Thus we eliminated any
processes from contention that were not associated with program office survey staff. This left only the processes
involved in data collection, data editing and coding, and the preparation of a data file for analysis. Using this logic
we selected metrics that would aid these staff in monitoring processes associated with data collection. These
metrics should be informed by the types of errors associated with each of the processes in the survey lifecycle that
are to be monitored.
Which Metrics Should Be Used to Monitor these Processes?
Survey methodologists define a set of four quality concepts associated with mismatches that arise between each step
of the survey lifecycle: coverage error, sampling error, nonresponse error, and adjusted error (Groves et al., 2004).
Coverage error occurs when the available sampling frame is not matched perfectly to the target population. One
consequence of coverage error is that the members of the target population not represented in the sampling frame
may be significantly different in some way from the members of the sampling frame (Groves et al., 2004).
Sampling error is attributed to the fact that only a subset of the sampling frame is measured, and the remainder of
the sampling frame is not measured. Sampling error is introduced when measuring a subset of the sampling frame
results in a sample statistic that is significantly different from the sample statistic generated using measurements
from the entire sampling frame (Groves et al., 2004). Nonresponse error relates to the fact that not all of the
members of the sample are successfully measured in a survey. The error is introduced when the distribution of the
values of data collected from respondents differ significantly from the distribution of the values of data collected
from the full sample. During the last step of data collection, adjustments are made to the survey data to account for
coverage, and nonresponse error in the sample data. Adjustment error is the error associated with the variance
between the sample statistic and population parameter as a result of the adjustments made to the data (Groves et al.,
2004). Again we compared the list of errors with the survey processes to which they are most closely associated,
and then selected the errors which metrics should monitor based on their association with the data collection
process. This process identified both adjustment error and nonresponse errors. However, adjustment errors are out
of scope for this project because they involve estimates generated after data collection, and not while collection is in
the field. This led us to select nonresponse error as the primary error that the metrics should be used to measure as
best practice for monitoring data collection practices by survey staff.
In fact, survey methodologists are concerned primarily with nonresponse error during data collection. One way to
monitor nonresponse error is to monitor response and nonresponse closely during collection (Groves et al., 2004).
In the most basic measurement of nonresponse, survey managers count the number of eligible entities who have not
responded to the survey. Methodologists and survey managers alike can also monitor the response rate, or the
number of entities who respond divided by the total number of entities in the sample or frame (Petroni et al., 2004).
This is the first metric that we decided to include based on the multi-stage decision making-process that incorporates
best practices from survey methodology. Understanding who will use the metric, and what their roles are during the
survey lifecycle is the first step. Identifying errors that are associated with these same survey processes will suggest
appropriate metrics for measuring these errors is the next step. However, the process must also account for the type
of data collection being conducted- be it a household survey or an establishment survey. Because our goal was to
develop metrics for use at EIA, and EIA primarily collects establishment data, we also considered unique features of
establishment surveys that would inform our decision about the metrics that should be used to monitor nonresponse
for establishment surveys.
What Type of Data Does EIA Collect and How Does it Impact Survey Metrics?
EIA collects data primarily about establishments. Establishments are usually defined as “as an economic unit,
generally at a single physical location, where business is conducted or services or industrial operations are
performed” (Federal Committee on Statistical Methodology 1988). Establishment surveys generally include one or
two key data elements that must be captured because these elements are inputs into key economic indicators. In
addition, the population of interest for establishment surveys is often skewed—comprised of a small number of large
establishments and a larger number of small establishments (Willimack, et al 2004). The larger establishments
contribute more to sample estimates than do the many smaller establishments. Because of this, in establishment
surveys large establishments are selected with certainty into the sample to ensure adequate coverage and to
minimize variance in the sample estimate. Since the population of interest in establishment surveys is likely to be
skewed, establishment data also are skewed, as the larger establishments tend to contribute more to the sample
4
estimate than do the smaller establishments. These skewed data suggest an additional metric is necessary to monitor
nonresponse rates in establishment surveys. This metric is the weighted response rate, which provides an estimate
of the percent of a total sample estimate that each company has contributed. This is especially important for
agencies like EIA who employ cut-off sampling as it aids in determining when the sample estimate cut-off has been
reached (Knaub 2008). Now that we have identify unweighted and weighted response rates as the two metrics
which should be used at EIA to monitor nonresponse error during data collection processes, we must identify the
data that will be used to calculate these rates, again first using guidance from survey methodology research. Survey
methodologists often rely on paradata to provide the inputs used to calculate survey metrics.
Where Will the Data Come From to Generate Metrics?
These computer-assisted data collection instruments produce paradata. The term paradata was first used to describe
automatically-generated data about collection processes, but the definition was expanded to include data collected
by interviewers, and by other systems (Couper 1998). Time stamps, call records, and interviewer observations are all
examples of paradata (Kreuter and Casas-Cordero 2010). Paradata are also collected at different times during the
data collection process. For example, call records collected while the interviewer is attempting to reach a designated
case produce paradata such as call outcomes, the time contact was made, and the day that contact was made (Kreuter
and Casas-Cordero 2010). Paradata also include interviewer observations made during the interview itself (Kreuter
and Casas-Cordero 2010). In web-based surveys, paradata refer to the amount of time a respondent spent on each
screen. Paradata collected in web-based surveys also includes the time at which a respondent abandoned the survey,
and missing data items (Couper 1998).
Paradata can be used by survey to monitor survey processes during data collection. Using operational data elements
such as response rates, survey managers can continuously monitor survey progress status updates (Couper and
Lyberg 2005). Operational data elements such as time per unit and cost per unit collected also may be used to
monitor the resources being used to collect the data (Laflamme et al., 2008). Monitoring these elements can aid in
making sure that resources are being allocated efficiently, as well as allowing survey managers to shift resources as
needed to better collect data while the survey is in the field. One drawback to using paradata to calculate these
metrics at EIA, however, are that the majority of the data described above are generated during household surveys
because household surveys are more likely to be administered by interviewers. These interviewers are likely to be
using computer-assisted interview software, and the paradata used are generated by those systems.
However, as we have noted, EIA primarily conducts establishment surveys. These establishment surveys are more
likely to be self-administered because it is assumed that in establishment surveys the data being collected are
measuring data already available in the establishment’s records (Willimack, et al 2004). Thus the extensive amount
of paradata available from household surveys may not be generated for establishment surveys. We hope eventually
to use data output from the web-based collection tool Web-based collection systems may generate paradata on
establishment surveys and survey processes. EIA is currently developing a web-based collection system to unify
collection processes. We hope to use paradata output from this system to calculate these metrics use them to help
survey staff monitor data collection processes at EIA. We’ve now answered three of the four questions we hoped
to address using survey methodology research. We know how to identify the survey processes we wish to monitor
using the survey lifecycle as a framework. We understand how to identify the metrics that should be used to
monitor these processes. We even understand where we might find data to calculate these metrics. But the most
important question – how to communicate these metrics- is not yet answered.
What is the Best and Most Efficient Way to Communicate these Metrics?
One solution currently being used by Statistics Canada is a system designed as a ‘paradata repository’ out of which a
series of standardized reports, customized reports, and data quality indicators are produced (Laflamme et al., 2008).
This system provides real-time monitoring of indicators ranging from collection costs and response rates to
interviewer production and interviewer costs. Another solution is the use of a dashboard to disseminate reports and
indicators to monitor survey processes. A dashboard is “a visual display of the most important information needed
to achieve one or more objectives; consolidated and arranged on a single screen so the information can be monitored
at a glance” (Few 2006). A dashboard was used during the field collection of the Continuous National Survey of
Family Growth, is the development of a reporting application that provides a series of key indicators calculated

5
using paradata. This dashboard is designed to provide real-time data that can be used to monitor a household survey
being collected in the field (Lepkowski et al., 2010).
Even so, we were intrigued by the idea of a dashboard for use at EIA. Research written about the dashboard used to
monitor household data collection suggested that it was an effective way to communicate key indicators to survey
staff quickly, and in a way that would inform collection processes. This suggested to us that we should also pursue
the development of a dashboard for EIA staff that communicated the two nonresponse metrics, unweighted and
weighted response rates. We also thought that our development process would contribute to the literature in
designing efficient reporting mechanisms on data collection processes at statistical agencies.
We brought some knowledge to the development process. We knew that EIA’s organizational structure prior to
2010 allowed program offices to develop their own ways of monitoring surveys, facilitated by in house survey
methods staff, statisticians, applications programmers and IT staff. We also knew from our research that there were
processes that survey staff in these program offices were responsible for monitoring. But we needed to know more
about how EIA survey staff carried out these activities, and as with the metrics defined above, where the data would
come from. We needed answers to these questions: How do EIA survey staff monitor each aspect of data
collection? How do EIA staff monitor nonresponse during data collection? What tools do EIA staff have to monitor
survey processes? Where do the data come from that are used to calculate any existing metrics that EIA staff use to
monitor this process? To answer these questions we conducted a series of semi-structured interviews with EIA
survey staff.
Semi-Structured Interviews at EIA
We conducted these interviews with three of the four EIA Office of Energy Statistics (OES) program offices
responsible for data collection. These offices were: the Office of Electricity, Renewables and Uranium Statistics;
the Office of Oil, Gas, and Coal Supply Statistics; and the Office of Petroleum and Biofuels Statistics. We
excluded a fourth office responsible for collecting data on energy consumption by households, buildings and
manufacturing plants either in concert with outside firms or with other Federal agencies. From these three offices,
we collected data from each of the nine energy teams making up the three offices. We interviewed the program
managers responsible for managing the energy teams; the survey managers responsible for overseeing individual
surveys; and the survey staff—both Federal and contractor—responsible for day-to-day survey operations.
These interviews were conducted with the assistance of Grace O’Neill and Kenneth Pick, both members of the EIA
OES Survey Development Team. The interviews typically lasted one hour. They were conducted separately with
program office managers, survey managers, and survey staff. We separated these staff into groups because each
group performs different survey management tasks during the survey lifecycle. As a result it was probable that each
group monitored data collection processes differently. The survey managers and survey staff were selected to
participate in the interviews based upon recommendations from their program office manager.
Semi-Structured Interview Questions
We designed a protocol for these interviews to learn how each subpopulation monitors monthly surveys; what tools
these groups have to monitor these surveys; and how nonresponse is monitored during data collection. This protocol
is provided in Appendix A: Topic Guide. We first conducted a listing exercise with each group. As part of this
exercise we asked “Which elements of the survey process do you oversee?” and “Are there certain times during the
survey cycle that you review information on specific elements of the survey process?”
In the next part of the Topic Guide, we asked more specifically whether or not each energy group used tools like
reports to monitor their survey or surveys. If each group said that they used reports, we then probed to learn how
each group used these tools to monitor response and to support frames maintenance. We tried to determine which
metrics are used to assess data quality as well as how reports are currently used to support this assessment. We also
included questions about report functionality.
In the next section of the Topic Guide, we asked specifically about frames maintenance and response rates: “How
are you using administrative reports to maintain frames?” and collected specific information on the type of
information available, when during the survey lifecycle the information is available, and how reports are shared
6
between management and staff. Questions about frames maintenance were difficult for most staff to answer, and we
eventually modified the Topic Guide to focus only on monitoring response.
We asked not only about the reports used to monitor response rates for the survey as a whole, but also about
response rates monitored at the entity level, and then about the respondents themselves. We concluded these
interviews by asking about how current reports are accessed, and about how easy they are to understand, asking
specifically: “Again thinking about the frame and response rate information, if you did not know anything about
your respondents – if you were brand new to EIA, what kind of information would you find confusing? What would
you like clarified?” We concluded our interviews by requesting that program office managers, survey managers, and
survey staff provide us with a copy of frequently used reports. A similar topic guide was used to interview each
group to minimize variance in the type of data being collected. The original Topic Guide for these interviews is
provided in Appendix A and reflects our intent to collect data both on response rate monitoring and frames
maintenance.
Data Collection and Analysis
We conducted 32 interviews with 47 EIA Federal staff and contractors over the course of six weeks. Of these 47, 7
were program office managers, 24 were survey managers and 16 were survey staff. They represented all of the
energy program offices that were in scope. After the interviews were completed, we prepared our notes and sent
them to interview participants for their review. We finalized these notes and used them to conduct a thorough
qualitative analysis to answer these questions: How does EIA collect data, and what aspects of collection processes
are survey staff responsible for? What tools do EIA staff have to monitor these survey processes?
We grounded our analysis in four assumptions. We first assumed that some set of survey monitoring processes exist
at EIA. Secondly we assumed that reports exist at EIA that are used to aid in survey monitoring processes. We
assumed that the sample of EIA staff and contractors held sufficient institutional knowledge of these survey
monitoring processes and reports to make our analysis a sound one. We finally assumed that a set of metrics are
defined for establishment surveys that allow us to extrapolate our analysis to metrics for use at EIA.
We conducted our analysis in five steps. We first consolidated the myriad number of observations recorded during
our interviews. We carefully noted common and disparate patterns in data collection methods and in data
processing systems. We then identified survey monitoring practices common to all offices. We observed features
of reports used by the energy groups. We then identified common operational data elements used by the various
energy groups to monitor response and nonresponse, and to conduct nonresponse follow-up. This method for
conducting research and analyzing the outcomes can be generalized and used by any organization that finds itself
with disparate collection and monitoring methods. Our analysis is limited in that the outcomes of the analysis are
applicable to EIA only. While the focus of our interviews were the questions about how EIA staff monitored survey
processes, we quickly learned that before we could understand the processes, we needed to understand the language
that EIA survey staff used to describe the processes. EIA’s survey terminology differs slightly from the language
that survey methodologists use, and so we will briefly discuss this terminology below.
Survey Terminology at EIA
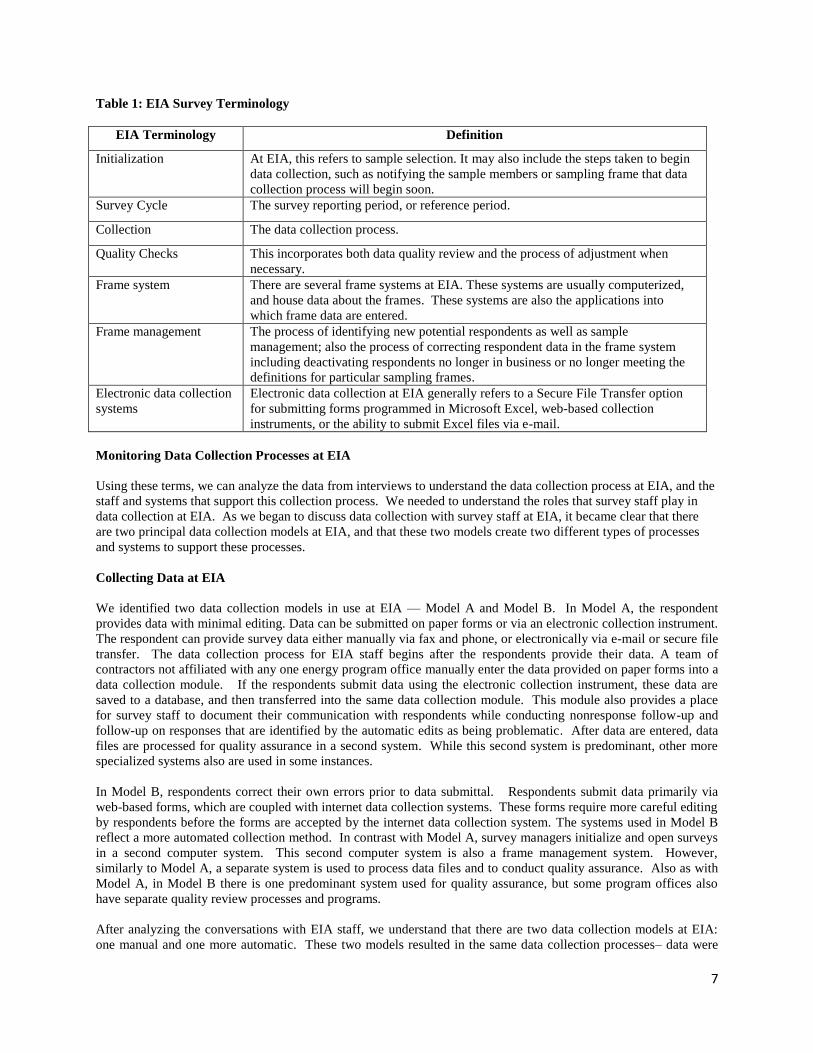
EIA’s survey terminology grew out of the heterogeneous research methods of its staff, which include economists,
engineers, energy experts, statisticians, computer scientists and survey methodologists. We provide a brief list of
terms and definitions commonly used at EIA below. This table provides a crosswalk between the language of
survey methodologists and the terminology used at EIA. These terms describe collection instruments and
computing systems.
7
Table 1: EIA Survey Terminology
EIA Terminology Definition
Initialization At EIA, this refers to sample selection. It may also include the steps taken to begin
data collection, such as notifying the sample members or sampling frame that data
collection process will begin soon.
Survey Cycle The survey reporting period, or reference period.
Collection The data collection process.
Quality Checks This incorporates both data quality review and the process of adjustment when
necessary.
Frame system There are several frame systems at EIA. These systems are usually computerized,
and house data about the frames. These systems are also the applications into
which frame data are entered.
Frame management The process of identifying new potential respondents as well as sample
management; also the process of correcting respondent data in the frame system
including deactivating respondents no longer in business or no longer meeting the
definitions for particular sampling frames.
Electronic data collection
systems
Electronic data collection at EIA generally refers to a Secure File Transfer option
for submitting forms programmed in Microsoft Excel, web-based collection
instruments, or the ability to submit Excel files via e-mail.
Monitoring Data Collection Processes at EIA
Using these terms, we can analyze the data from interviews to understand the data collection process at EIA, and the
staff and systems that support this collection process. We needed to understand the roles that survey staff play in
data collection at EIA. As we began to discuss data collection with survey staff at EIA, it became clear that there
are two principal data collection models at EIA, and that these two models create two different types of processes
and systems to support these processes.
Collecting Data at EIA
We identified two data collection models in use at EIA — Model A and Model B. In Model A, the respondent
provides data with minimal editing. Data can be submitted on paper forms or via an electronic collection instrument.
The respondent can provide survey data either manually via fax and phone, or electronically via e-mail or secure file
transfer. The data collection process for EIA staff begins after the respondents provide their data. A team of
contractors not affiliated with any one energy program office manually enter the data provided on paper forms into a
data collection module. If the respondents submit data using the electronic collection instrument, these data are
saved to a database, and then transferred into the same data collection module. This module also provides a place
for survey staff to document their communication with respondents while conducting nonresponse follow-up and
follow-up on responses that are identified by the automatic edits as being problematic. After data are entered, data
files are processed for quality assurance in a second system. While this second system is predominant, other more
specialized systems also are used in some instances.
In Model B, respondents correct their own errors prior to data submittal. Respondents submit data primarily via
web-based forms, which are coupled with internet data collection systems. These forms require more careful editing
by respondents before the forms are accepted by the internet data collection system. The systems used in Model B
reflect a more automated collection method. In contrast with Model A, survey managers initialize and open surveys
in a second computer system. This second computer system is also a frame management system. However,
similarly to Model A, a separate system is used to process data files and to conduct quality assurance. Also as with
Model A, in Model B there is one predominant system used for quality assurance, but some program offices also
have separate quality review processes and programs.
After analyzing the conversations with EIA staff, we understand that there are two data collection models at EIA:
one manual and one more automatic. These two models resulted in the same data collection processes– data were

8
collected, edited and compiled. However these models resulted in the development of different systems used to
complete these processes. This is an important distinction because these different systems provide different tools to
monitor data collection processes. These tools are an important component of the question: How do survey staff
monitor survey processes?
In Model A, survey staff run reports during the survey cycle using the same data collection module into which data
are entered. In Model B, survey managers and staff run reports from the cycle and frame management system used
to open survey forms to respondents. Survey managers also directly query Oracle databases for additional
information needed to monitor data collection. Some offices have also developed Excel spreadsheets which are
automatically updated using data from the Oracle databases to monitor key survey variables. Program managers
most often review reports that are summaries prepared by survey staff and survey managers that summarize these
nonresponse reports.
Now that we understand both the types of data collection at EIA, and the resulting processes and systems, we can
ask how data collection processes are monitored at EIA. More precisely we can explore the types of tools available
for monitoring response. During the course of the listing exercise, survey staff mentioned reports that they used for
nonresponse, frames management and for data quality. However, as we learned from survey methodology,
monitoring nonresponse is one of the most important ways to monitor for errors in the data collection process
(Groves et al., 2004). Because of this, the remainder of our analysis focuses on reports used to monitor
nonresponse and aid in carrying out nonresponse follow-up.
Monitoring Nonresponse
We identified three questions that we would need to better understand the how response is monitored at EIA: What
reports are used to monitor nonresponse, and what elements do these reports have in common? How are these
common elements defined? Each energy program office we spoke with uses reports for monitoring nonresponse.
These reports can be categorized by use: guidance on the timing of data collection; nonresponse follow up; and
historical response reports. These offices also maintain schedules that assign dates by which each aspect of the
survey cycle should be completed. Elements of this schedule include the survey titles, the date when the survey
cycle should be opened, and guidance on when staff should follow up with nonrespondents.
Nonresponse reports in both models provide information on response and nonresponse, on contact information, and
on data assurance. Elements of these reports include a list of the current nonrespondents and their contact
information; and the name of the survey staff member responsible for contacting the nonrespondent. These reports
are run throughout the survey cycle, but are run more frequently as the end of the collection ends for the survey
collection cycle, or reference period.
A second report provides more detail on nonresponse while addressing a key challenge in nonresponse monitoring at
EIA: that the response rates monitored by the survey staff are not the same as those monitored by survey managers
and program office managers. This occurs in part because of the ways in which responses are recorded. In Model A,
responses may be entered into the data collection module, but may not yet have been sent to the data assurance
system, meaning that there are different response rates in each of these systems.
This report provides the respondent ID, the submission status of the form, and the mode of transmission of the form.
Additional fields provide data specific to the data collection model. In Model A, for example, this report includes
information on when the data are logged in, and the location of the data – especially a count of respondents whose
data have been entered, but are not counted as respondents in the quality assurance system. In Model B, the
submission status element is populated with paradata specific to internet data collection. In this model, there is an
additional element not present on the nonresponse report from Model A: a weighted response rate for a key indicator
being collected on the form.
Survey managers and staff also use reports to monitor historic response rates, though to a lesser degree than they use
reports to monitor current cycle response rates. One nonresponse report identifies nonrespondents by year,
including their establishment name, and a 12-month history of nonresponse by entity. There are few historic
response rate tables that provide detailed respondent information similar to the current cycle nonresponse reports.
Existing systems and reports make it difficult for survey staff to generate these detailed historic reports. Instead,
9
survey staff must enter the data collection system and generate reports for each survey cycle about which they are
interested. After pulling each report then they must combine them to yield historic response rate report that includes
detailed information about nonrespondents.
In addition to analyzing data collected during interviews to identify reports used for nonresponse, we also used the
interview data to define elements of these reports. We were most interested in how response rates were defined at
EIA because these rates are a very important measure of response. We needed to understand how EIA staff defined
respondents, late respondents and nonrespondents, as the ability to identify these groups would figure prominently in
calculating nonresponse.
Monitoring Nonresponse: Defining Response Rates and Respondents
At EIA, response rates are defined in multiple ways. One response rate is defined as the number of responses at
time of publication divided by the number of eligible entities in the sampling frame. A second definition is the
number of submissions divided by the number of eligible entities in the sampling frame. A third measure of
response is a weighted percent of key indicator received, defined in Model B only.
The second element, equally important in monitoring response, is how program office staff at EIA define a
respondent, a late respondent, and a nonrespondent. Staff have common definitions for late respondents. A late
respondent is one who has not responded by the time and date defined on the survey form. There is some flexibility
because of the need to receive data from large companies, regardless of timeliness. However, there is some
variability in how nonrespondents are defined by survey staff. Most program offices define a nonrespondent as an
entity whose data has not been provided by the time of publication. Others define a nonrespondent as an entity
whose data has not been provided by the due date. Survey staff also defined problematic respondents during the
course of our interviews. For the most part problematic respondents were defined as entities who are chronically
late in responding, who do not respond, or who submit poor quality data repeatedly. The variation in the ways in
which these elements were defined adds yet another challenge to defining a series of common metrics for use EIA-
wide
Monitoring Nonresponse at EIA: Conclusions
The findings from our analysis present two challenges to developing common metrics at EIA. First of all, the
elements currently being used to monitor nonresponse- response rates and counts of respondents – are not
consistently defined at EIA. There is more than one definition for an on time respondent, and there are multiple
definitions for a response rate. The second challenge is that these metrics require data as an input. However, the
two different collection models resulted in multiple data collection processes and systems. This means that there is
no one location from which to collect the data for inputs. The one fortunate outcome of our analysis is that survey
staff monitoring data collection are generally use reports that consist of common elements such as respondents, their
contact information, and their rates of response. However, we still needed to consistently define the metrics, and
identify a common source for the data that would be used as inputs for these metrics.
Developing Prototyped Common Metrics EIA
In order to remove the variation in the definitions of response rates we arbitrarily defined two measures for
monitoring response prior to calculating the prototyped metrics. We acknowledge that there are many metrics that
can be used to measure response, but felt it was important to select only two measures as building blocks for the
calculation of common metrics indicators at EIA. We defined one measure for response rates, and one for weighted
response rates, using the following formulas:

10
Unweighted unit response rate = C/N
Weighted response rate = Σωiyi C/ΣωiyiN
Where: C = the number of responding eligible units
N = the number of eligible units
ωi = the sampling weight for the ith
unit.
yi = a measure of size or a “key” variable for the ith
unit.
For sample surveys N = n, the number of sampling units.
For census surveys ωi =1 for all i.
All response rates calculated and implemented on the prototype dashboard will be defined using these formulas.
Identifying Data Sources
In order to address the challenge of identifying data sources for these metrics given the numerous data collection
systems currently in operation at EIA, we developed a synthetic data set using SAS Enterprise Guide® software to be
used during the development of the prototype dashboard. This has two benefits. First, it allows us to define a data
set structure, data tables, and data elements in a development environment. Second, it defines requirements for the
production version of the tables needed to populate a production quality dashboard. Third, it addresses the concern
that these collection systems may yield different response rates by allowing us to calculate one and only one
response rate for each entity.
Developing a Dashboard Prototype in SAS®
Using both these results from our analysis, and the recommendations that reflect best practices in survey monitoring
metrics, we developed a series of operational data element prototypes using the SAS® Business Intelligence tool.
As discussed, we first developed a set of synthetic data containing raw data on 200 entities. These data included
contact information associated with each entity; response data for each entity in the past 12 months; and an arbitrary
due date for each entity. We used response data for each entity to calculate a response rate following the definition
provided above. We assumed that all units were eligible and that a response received after during the We also
defined a value ‘Total Volume’ that represented the entity’s total volume contributed during the current month as a
percent of the total volume of product in the same reporting month of the previous year. We used this value to
define quartiles, and then assigned a company size value of small, medium, or large depending on the quartile into
which the entities fell. Small companies fell into the lowest quartile, medium companies fell in between the 25th
and 75th
percentiles, and large companies were those companies whose total volume was greater than or equal to the
75th
percentile. This was a purely academic exercise and does not reflect any current EIA methodology or the values
of metrics currently in use at EIA. The total volume estimates and the company size variables were also included in
the synthetic data set.
Using this data set we populated the following reports: 1) a count of response and nonresponse for the current survey
period; 2) detailed contact information for entities who have not responded, including the entity name; contact name;
contact phone number and a contact e-mail address; 3) a trend line showing the response rate for the past twelve
months; 4) a count of response and nonresponse, including detailed contact information, for the past 12 months; 5) a
count of response and nonresponse broken out by company size as a placeholder for a weighted response rate. Each
report is actually a graphic indicator of the statistic, and so we refer to them as indicators. These indicators were
developed using SAS Enterprise Guide® software and SAS
® Enterprise BI Server components. (See Appendix B for
the indicator prototypes.) This is the extent of the development work that has been completed, but the process of
development continues at EIA. While we are encouraged by the early development steps, we acknowledge that
there is still much work to be done. In future steps we will need to address layout and dashboard design, and then
test the dashboard design with program offices. We will also need to document the dashboard system and the
indicators so that the system can be deployed and enhanced as needed in the future.
Conclusion
EIA has disparate data collection systems, data collection methods, and data collection monitoring across energy
groups. This makes it challenging to monitor survey processes in a similar manner across all of these energy groups.

11
We argue that the development of dashboard prototype is a feasible strategy for unifying the survey monitoring
practices at EIA. In so doing, we demonstrate a process that includes qualitative research into data collection
methods, systems, and survey monitoring processes. We also demonstrate that when these research results are
combined with metrics designed to monitor response such as response rates and weighted response rates, the result
is a dashboard prototype that accommodates the needs of the program managers, survey managers and survey staff
while unifying the ways in which these staff members monitor nonresponse. We hope in the future to use
experience gained during the remainder of the development process as a basis for further research. We also plan to
discuss the lessons we have learned from usability testing and how we have used results from this testing to as
improve the dashboard’s aesthetic. We hope our future research will aid others in developing a useful and practical
dashboard for use in establishment surveys.
Acknowledgements
We would like to thank Carol Blumberg, Robert Harper, Grace O’Neill and Richard Reeves as they read and
commented on this article.

12
References
Couper, Mick. (1998) Measuring Survey Quality in a CASIC Environment. In Proceedings of the Section on Survey
Research Methods of the American Statistical Association., pp.41-49.
Couper, Mick and Lars Lyberg. (2005). “The Use of Paradata in Survey Research.” Proceedings of the 55th Session
of the International Statistical Institute, Sydney, Australia 2005. The Hague, The Netherlands: ISI.
Federal Committee on Statistical Methodology. 1988, Quality in Establishment Surveys, Statistical Policy Working
Paper 15. Washington, DC: Office of Management and Budget, accessed online March 2012,
http://www.fcsm.gov/working-papers/wp15.html
Few, Stephen. (2006). Information Dashboard Design: The Effective Visual Communication of Data. Sebastapol,
CA: O’Reilly Media, Inc.
Groves, Robert M., Floyd J. Fowler, Jr., Mick P. Couper, James M. Lepkowski, Eleanor Singer, and Roger
Tourangeau. (2004). Survey Methodology. Hoboken, NJ: John Wiley & Sons, Inc.
Knaub, James R. Jr. (2008) “Cutoff Sampling and Inference For Establishment Surveys: Synopsis with Historical
Context” InterStat, accessed November 2011, http://interstat.statjournals.net/.
Kreuter, Frauke and Carolina Casas-Cordero. (2010). Paradata. Working paper 136, German Council for Social and
Economic Data.
Laflamme, François, Mike Maydan and Andrew Miller. (2008). Using Paradata to Actively Manage Data Collection
Survey Process. Proceedings of the Section on Survey Research Methods of the American Statistical Association,
pp.630-637.
Lepkowski, James, William Axinn, Nicole Kirgis, Brady T. West, Shonda Kruger Ndiaye, William Mosher and
Robert Groves. (2010). Use of Paradata in a Responsive Design Framework to Manage a Field Data Collection.
NSFG Survey Methodology. Working Papers. Report 10-012.
Office of Management and Budget. (2006) Standards and Guidelines for Statistical Surveys. September 2006.
Accessed online March 2012, http://www.whitehouse.gov/omb/inforeg_statpolicy#pr
Petroni, Rita, Richard Sigman, Diane Willimack, Steve Cohen, and Clyde Tucker. (2004). “Response Rates and
Nonresponse in Establishment Surveys – BLS and Census Bureau.” Prepared for the Federal Economic Statistics
Advisory Committee. December 2004.
Willimack, Diane K., Lars Lyberg, Jean Martin, Lilli Japec, and Patricia Whitridge. (2004) “Evolution and
Adaptation of Questionnaire Development, Evaluation and Testing Methods for Establishment Surveys,” In
Methods for Testing and Evaluating Survey Questionnaires, ed. Stanley Presser, Jennifer M. Rothgeb, Mick P.
Couper, Judith L. Lessler, Elizabeth Martin, Jean Martin, and Eleanor Singer. New York: Wiley, pp. 385-407.

13
Appendix A: Topic Guide – Administrative data reports at EIA
Research Objectives
Identify how survey managers and contractors monitor their surveys and survey processes
Determine how survey managers and contractors use administrative data as part of the survey review
process
Identify key report features used in frame maintenance and response rate monitoring;
Develop list of features that can be added and features that should be removed from current reports;
Document any threats to successful data collection and determine if the risk can be mitigated by
information.
Population of Interest
EIA staff members who utilize existing reports or data generated automatically by a reporting system (such
as CUFS, or the DCM) for maintaining frames of monthly surveys.
Four levels of responsibility:
o Team leads (Separate topic guide to be developed)
o Survey managers
o Contractors
o Directors (not interviewed)
Representatives from most of the energy groups (Electric; Oil; Natural Gas; Alternative Fuels; Nuclear;
Coal /Natural Gas, etc.)
Before the Interview
Review the project charter for goals of focus group
Review monthly surveys that each participant works on/with
Materials Needed
Large writing pad for listing exercise
Paper/pen
Note paper
Hard Candy
Length of Interview
90 minutes
14
Part A: Introduction (5 minutes)
A. Moderator Introduction
Topic of Interest: The Survey Development Team (SDT) is trying to learn about the reports EIA uses to monitor the
survey collection process. As a part of this research process, I am meeting with monthly survey managers and
analysts from each energy group to learn more about the information used to monitor the survey cycle and data
collected. I’d also like to learn more about which EIA systems are used to monitor the survey cycle and data
collected. I intend to develop new prototypes of survey output based on what I learn from you. I understand that in
the past there have been varying degrees of resources available to offices for the development of survey reports to
oversee survey processes. I came from an agency with less money than EIA, so I understand how limited resources
can act as a detriment to development of efficient and useful systems. I think that the survey managers at EIA may
have some common needs and I am hoping to develop a set of reports that will address those common needs. To me
this means that these reports incorporate the information that you provide in these meetings, provide relevant
information, and are the best that we can develop given our resource constraints. In the interest of full disclosure, I
also want to let you know that eventually I will be sharing these prototype reports with the directors. The directors
here acknowledge that the technology at EIA is outdated, and that reports are not consistent across all of the offices.
What is good is that the directors understand that they can’t tell me what you all need. I need to understand from
your perspective what you need to manage surveys, so I’m starting the conversations with you first. With that in
mind, let’s get started.
B. Rules of the focus group
a. Informal group discussion, participation is encouraged
b. Promise of anonymity
c. All opinions count
d. Encourage constructive disagreement
e. Emphasize the number of topics to be covered –stay on topic
Part B: How do you monitor the monthly surveys? (15 minutes)
A. Listing exercises:
a. Which elements of the survey process do you oversee? (Examples include frame maintenance,
births/deaths, nonresponse, QA/QC1, etc.)
b. Are there certain times during the survey cycle that you review information on specific elements
of the survey process?
i. Tell me more about what you review when you are overseeing a survey – do you look at
top-level reports, specific data points, or something else?
ii. Can you tell me about a time when you used this information to help you to anticipate a
problem with your data?
iii. Tell me more about what aspects of this information you used to identify the issue.
iv. What have you done in the past when you have identified a problem?
Part C: Do you currently have administrative reports to monitor your survey? (15 minutes)
A. Frame maintenance/response rates
a. In general, how do you assess data quality?
15
b. How do you assess the quality of your survey’s frame?
c. How do you assess the quality of your survey’s response rates?
d. Which reports do you use to tell you about the quality of your survey frame?
What about response rates?
e. Give me an example of how you might use a report to determine the quality of your frame.
f. Can you give me an example of a report that you might use to assess the quality of your response
rates?
g. What format do these reports come in? (Excel, PDF, etc.)
h. Walk me through the steps that you take to get information on the quality of your survey frames
and response rates.
Part D: How are you using administrative reports to maintain frames for your survey? (15 minutes)
Thinking specifically about the information that you described above to tell you about the quality of your
survey frame:
A. At what level is information provided? (Survey level, respondent level, other?)
B. What types of information are available to you?
a. Do you have a way to look at the entire frame?
b. Give me an example of how you have used frame information in the past to identify new
companies that are responding or should be responding to your survey.
c. Tell me how you might use this information to identify a death in the frame or an establishment
that should be removed from the frame.
d. Are there times when you have to use multiple reports to perform a single task?
e. If so, are these reports pulled from more than one system?
f. Tell me a little bit more about how you compile these reports.
C. When during the survey cycle do you look at this information?
a. Which information do you look at frequently to manage your frame?
b. How many times would you say you look at this information per week?
c. Do you look at information from different reports?
d. Which information don’t you look at? Why not?
e. Which information is available that you would like to look at, but do not have the time to?
D. Do you also provide reports to others?
a. If so, who?
b. What kinds of reports do you need to give them?
16
c. Do these reports require you to combine information from different systems as well?
d. Do you provide these reports at a certain time during the survey cycle?
e. Tell me more about the requests that you are given for reports about the survey.
E. Can you tell me about a time when you looked at one (or more than one) of these reports and you just knew
that something was wrong?
a. What information did you use to tip you off?
b. What did you do with the information?
c. Who did you report the problem to?
d. What was the outcome?
Part E: How are you using administrative reports to monitor response rates? (30 minutes)
Thinking specifically about reviewing response rates and the timeliness of respondents:
A. At what level are response rates provided? (Survey level, respondent level, other?)
B. What types of information are available to you?
a. Do you review information for the survey as a whole, for respondents as a whole, or for specific
establishments only?
b. Do response rates reports provide response rates over the course of a week? A month?
c. Do response rates reports provide you information about responses as of a certain date – say the
due date, for example?
d. What other information is provided on these reports? Can you give me examples of what types of
information might be on a response rate report?
C. How many reports on response rates do you review for monthly surveys?
a. Which reports do you look at most often?
b. What would you look at if you had more time to do so?
c. What don’t you look at? Why not?
d. Are there times when you have to use multiple response rates reports to perform a single task?
e. If so, are these reports pulled from more than one system?
f. Tell me a little bit more about how you compile these reports.
D. When during the survey cycle do you look at this information?
a. Tell me about specific points during the cycle that you look at response rates? (Probe: Survey due
date?
b. How many times would you say you look at this information per week?
c. Do you look at information from different reports more than once during the cycle?
17
E. Do you also provide reports on response rates to others?
a. If so, to whom are you providing them?
b. What kinds of reports do you need to give them?
c. Do these reports require you to combine information from different systems as well?
d. Do you provide these reports at a certain time during the survey cycle?
e. Tell me more about the requests that you are given for reports about the survey’s response rates.
Now thinking about administration reports that you review for response rates for the survey as a whole (if
relevant):
A. What statistics do you use to indicate the overall response to the surveys?
B. Can you look at survey response over the course of a week (E.g. response on Monday, response on
Tuesday) in one place?
C. Can you look at the mode of response for each survey?
D. Are you provided with the percent of total product that each survey has collected?
E. Is there some way that you have to access this information in real time (e.g. when you retrieve the
information it is current as of the time you pulled it, rather than of the day before.)
F. Give me an example of a time when you have used response rates to identify an issue with a survey’s
responses.
G. Tell me about a time when you needed to change the way that this information was reported to you or get
more information than was currently available? What did you do?
Now thinking about the data that you review for response rates for an establishment: (if relevant):
A. What do you use to indicate the establishment’s response to the surveys?
B. How do you review this information– can you look at how an establishment responded over the course of a
week (E.g. response on Monday, response on Tuesday) in one place?
C. Does the information tell you about the mode of response for each establishment?
D. Are you provided with the percent of total product that each establishment has reported?
E. Tell me more about how these percents are calculated.
F. Are the reports provided in real time?
G. Give me an example of a time when you have used this information to identify an issue with a survey’s
responses.
H. Tell me about a time when you needed to get more information than was currently available. What did you
do?
Now thinking about the respondents themselves:
A. Are there establishments that are consistently late in responding to your surveys?
B. How do you define consistently late?

18
C. If you had only three dates or times available to review response rates in order to identify establishments
who are consistently late during the survey cycle, which dates would these be? (For example, the survey’s
due date, date that data are required for publication date, some midpoint between the two?)
D. At what points during the survey cycle do you contact respondents who have not yet responded?
Part E: Accessibility of current Administrative reports (10 minutes)
A. Frame maintenance/response rates
a. Again thinking about the frame and response rate information, if you did not know anything about
your respondents – if you were brand new to EIA, what kind of information would you find
confusing? What would you like clarified?
Part F: Wrap Up (5 minutes)
A. Can you provide me with examples of data that you use frequently during the survey management process?
(Screen shots are okay.)
B. Next steps.

19
Appendix B: Indicator Descriptions and Images
Indicator 1: Response Rate, Current Survey Cycle
This indicator provides the unweighted response rate by the due date on the form for the eligible reporting
entities in the sample. This rate is calculated using response data from the synthetic raw data set described
in the article and does not reflect current EIA response rates or methodology.
The indicator also includes a range of acceptable response rates. The range of the indicator provides three
measures: below target (indicated by red on the thermometer); on target (yellow) or above target (green).
The height of the fill line in the thermometer is a visual clue to the viewer of the current response rate.
For this indicator, the ranges are set so that a response rate between 0 and 80 percent is below target; a
response rate between 80 percent and 100 percent is on target, and above 100 percent is above target. The
target rate of 80 percent is chosen as a reminder to survey managers that it may be necessary to conduct an
analysis of nonresponse bias. The Office of Management and Budget strongly encourages surveys with
unweighted response rates below 80 percent to conduct an analysis of nonresponse bias in those surveys
(Office of Management and Budget 2006).
The title of the indicator reflects the survey cycle, or reporting period. In this case the reporting period is
December 2012. The numerical value of the response rate is at the base of the thermometer.

20
Indicator 2: Historic Response Rate
This indicator provides a twelve-month trend line showing the unweighted response rate by the due date on
the form for the eligible reporting entities in the sample. These rates are calculated using response data
from the synthetic raw data set described in the article and do not reflect current EIA response rates or
methodology.
Similar to the indicator showing the unweighted response rate for the current collection cycle, the indicator
also includes a range of acceptable response rates, shown by three lines on the indicator itself. The range of
the indicator provides three measures: below target (indicated by red on the thermometer); on target
(yellow) or above target (green).
For this indicator, the ranges are set so that a response rate between 0 and 0.8 (or 80) percent is below
target; a response rate between 80 percent and 100 percent is on target, and above 100 percent is above
target. The target rate of 80 percent is chosen as a reminder to survey managers that it may be necessary to
conduct an analysis of nonresponse bias. The Office of Management and Budget strongly encourages
surveys with unweighted response rates below 80 percent to conduct an analysis of nonresponse bias in
those surveys (Office of Management and Budget 2006).

21
Indicator 3: Count of Response and Nonresponse, Current Survey Cycle
This indicator provides a count of the number of respondents and nonrespondents for the current survey
cycle period. The number of respondents and nonrespondents will be counted based on the number of
responses received by the survey form due date. Nonrespondents are those entities who are eligible to
report and who did not do so by the close of the survey reporting period.
The indicator is a bar chart, with a bar for the current reporting period showing a count of responses and
nonresponses at the time the form was due.
Associated with this indicator will be a table providing a list of nonrespondents, their EIA ID, and the
contact information (name, phone, e-mail) for the primary survey contact. A measure of company size will
be included in the detailed table.

22
Indicator 4: Count of Response and Nonresponse, 12 months
This indicator provides a count of the number of respondents and nonrespondents for the current survey
cycle period (denoted as survey date in the picture below) as well as the past 11 reporting periods. The
number of respondents and nonrespondents will be counted based on the number of responses received by
eligible entities on the survey form due date.
The indicator will be a bar chart, with a bar for each of the previous reporting periods showing a count of
responses and nonresponses at the time the form was due.
Associated with this indicator will be a table providing a list of nonrespondents for the reporting period
referenced, their EIA ID, and the contact information (name, phone, e-mail) for the primary survey contact.
A measure of company size will be included in the detailed table.
23
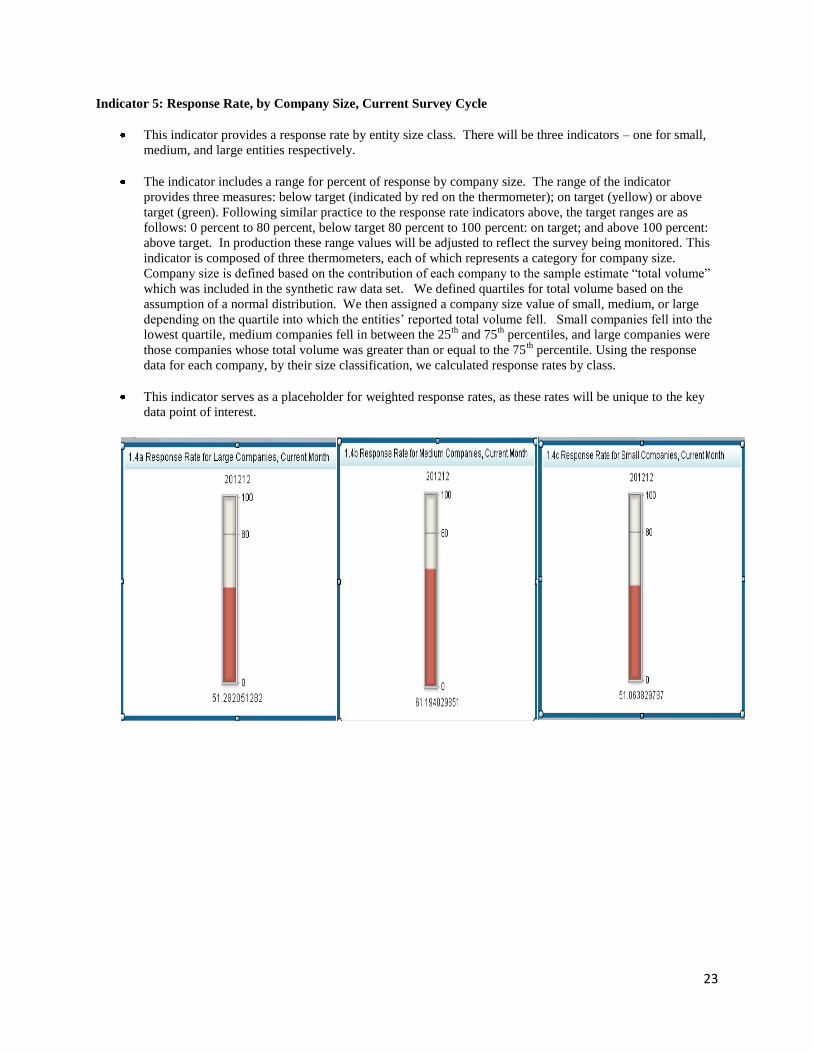
Indicator 5: Response Rate, by Company Size, Current Survey Cycle
This indicator provides a response rate by entity size class. There will be three indicators – one for small,
medium, and large entities respectively.
The indicator includes a range for percent of response by company size. The range of the indicator
provides three measures: below target (indicated by red on the thermometer); on target (yellow) or above
target (green). Following similar practice to the response rate indicators above, the target ranges are as
follows: 0 percent to 80 percent, below target 80 percent to 100 percent: on target; and above 100 percent:
above target. In production these range values will be adjusted to reflect the survey being monitored. This
indicator is composed of three thermometers, each of which represents a category for company size.
Company size is defined based on the contribution of each company to the sample estimate “total volume”
which was included in the synthetic raw data set. We defined quartiles for total volume based on the
assumption of a normal distribution. We then assigned a company size value of small, medium, or large
depending on the quartile into which the entities’ reported total volume fell. Small companies fell into the
lowest quartile, medium companies fell in between the 25th
and 75th
percentiles, and large companies were
those companies whose total volume was greater than or equal to the 75th
percentile. Using the response
data for each company, by their size classification, we calculated response rates by class.
This indicator serves as a placeholder for weighted response rates, as these rates will be unique to the key
data point of interest.


