
i
DESIGN, CONSTRUCTION AND EXPERIMENTAL EVALUATION
OF THE PRODUCTS OF A LOW COST BRIQUETTE MACHINE
FOR RURAL COMMUNITIES IN NIGERIA
BY
SANI, ITODO FIDELIS (B. ENG)
DEPARTMENT OF MECHANICAL ENGINEERING
AHMADU BELLO UNIVERSITY, ZARIA.
NIGERIA
JULY, 2008

ii
DESIGN, CONSTRUCTION AND EXPERIMENTAL EVALUATION OF THE
PRODUCTS OF A LOW COST BRIQUETTE MACHINE FOR RURAL
COMMUNITIES IN NIGERIA
BY
SANI ITODO FIDELIS (B. ENG)
(MSC/ENG/40028/04-05)
A THESIS SUBMITTED TO THE POSTGRADUATE SCHOOL,
AHMADU BELLO UNIVERSITY IN PARTIAL FULFILLMENT FOR THE
AWARD OF MASTER OF SCIENCE IN MECHANICAL ENGINEERING
DEPARTMENT OF MECHANICAL ENGINEERING
AHMADU BELLO UNIVERSITY, ZARIA.
NIGERIA
JULY, 2008

iii
DECLARATION
I declare that this thesis entitled, “DESIGN, CONSTRUCTION AND
EXPERIMENTAL EVALUATION OF THE PRODUCTS OF A LOW COST
BRIQUETTE MACHINE FOR RURAL COMMUNITIES IN NIGERIA” is a record
of my own research work. The information derived from the literature has been duly
acknowledged in the text and a list of references provided. No part of this thesis was
previously presented for another degree or diploma at any university.
SANI, ITODO FIDELIS ____________ ____________
Name of Student SIGN DATE

iv
CERTIFICATION
This project entitled DESIGN, CONSTRUCTION AND EXPERIMENTAL
EVALUATION OF THE PRODUCTS OF A LOW COST BRIQUETTE MACHINE
FOR RURAL COMMUNITIES IN NIGERIA by SANI ITODO FIDELIS meets the
regulations governing the award of the degree of Master in Science of Ahmadu Bello
University, and is approved for its contribution to knowledge and literary presentation.
______________________ ______________
Prof C.O. Folayan Date
Chairman, supervisory committee
______________________ _____________
Dr. D. S. Yawas Date
Member, supervisory committee
_________________________ _____________
Prof. C.O. Folayan Date
Head of Department
__________________________ _____________
Prof. S. K. Nkom Date
Dean, Postgraduate School

v
DEDICATION
This work is joyfully dedicated to my beloved parents, Mr. and Mrs. A. Sani, for their
love, care, guidance, counsel, prayers and encouragement.
It is also dedicated to my brother, Reuben Sani, my sisters, Hauwa Sani, Mrs. Ajuma Isah
and Mrs. Christiana Adaji, for their prayers and encouragement.
Above all, to the Almighty God whose grace has seen me through this course.

vi
ACKNOWLEDGEMENT
My appreciation goes to my supervisors, Prof. C.O Folayan and Dr. D.S. Yawas whose
advice, guidance and interest I had at my disposal at the time I was carrying out this
project. They were source of inspiration and motivation. Thank you sirs.
My profound gratitude goes to my parents Mr. and Mrs. A. Sani and my siblings Ajuma,
Hauwa, Christiana and Reuben. Thank you all for being there for me.
Special thanks to Prof. P.B. Madakson and the entire staff of the department for
contributing in one way or the other in seeing me through my academic pursuit.
I also thank Mr. S.S Modele and Mal. Yahaya of the heat transfer laboratory of Department
of Mechanical Engineering, ABU who helped me with the experiments I had to carry out
in the course of this research.
Gratitude goes to Prof. V.I.O. Ndirika and Mr. S. Ocholi for their encouragement.
I also appreciate the members of 3rd ECWA Samaru - Zaria for all their prayers and
support.
To my course mates, Richard Yaro, Job Eronmosele, Ityona Amber and Talib Ahmadu,
Abdulmumuni Alabi, I say thanks for all the good times we shared as we undertook this
journey together.
I also give special thanks to Mr. Amana Ocholi. He was a constant source of
encouragement in difficult times.
To my numerous wonderful friends for their encouragement. Worthy of mentioning are
Habibu Balarabe, Jacob Akpa, Linda Ahmed, Inikpi Ameh, Ajuma Ameh, Rabi Yusufu,
Abdulmumuni Abdullahi, Elisha Haruna, Simon Idrisu, Ama Barka, Peter Dahwa and

vii
Stanley Mhya you gays have been fantastic. May you all enjoy greater support in your time
of need.
Above all, I would like to deeply appreciate God Almighty for the gift of life and the
privilege of undertaking this course under his love, protection and guidance. To him I owe
everything.

viii
NOMENCLATURE
Ph = Pressure transmitted on material surface (N/m2)
Pcr = Critical load causing rupture on screw (m4)
Pt = Pitch of thread (mm)
Pmin = Minimum pressure required by material (N/m2)
Pb = Bearing pressure of nut (N/m2)
Pmax = Maximum pressure load produced (N/m2)
Pe = Dry mass of pot (g)
Pi = Initial mass of pot and cold water (g)
Pf = Final mass of pot and hot water (g)
P = Level of significance
W = Axial load (N)
Wa = Axial load from minimal pressure (N)
Wmax =Maximum axial load from available screw (N)
Wb = Actual axial load from available screw (N)
w = Deflection (mm)
Wr = Water remaining at the end of water boiling test (g)
Wv = Water vaporized
Mmax= Maximum bending moment
Mh = Force applied by an average person (N)
Mx = Moment about x – axis
Mf = Mass of fuel (Kg)
Mw = Mass of water (2900g)
Mc = Mass of 80mm of cotton thread (0.0035g)
Mfw = Mass of 50mm of fuse wire (0.0023g)
Mθ = Water equivalent of calorimeter (475g)
Mcap = Mass of capsule (g)

ix
MSt = Treatment mean squares
MSε = Error mean squares
M.S = Mean of Squares
m = Mass of an average person (Kg)
dh = Handle diameter (mm)
dm = Mean screw diameter (mm)
d1 = Root screw diameter (mm)
d2 = Nominal screw diameter (mm)
db = Diameter of bolt (mm)
'1d = Minimal screw thread root diameter (mm)
D..F = Degree of freedom
S = Ultimate shear strength (N/m2)
Sc = Specific fuel consumption
SSt = Treatment sum of squares
SST = Total sum of squares
SSε = Error sum of squares
S.S = Sum of squares
Aa = Area over which pressure is applied (m2)
A1 = Bearing area of one thread (m2)
A2 = Projected area of nut (m2)
Lh = Length of Handle (mm)
Ls = Screw length (mm)
L = Lead of Thread (mm)
Th = Torque on screw thread (Nm)
Ti = Initial temperature of water (oC)
Tf = Final temperature of water (oC)
= Torsional shear stress (N/m2)
max = Maximum shear stress (N/m2)

x
t = Value form the t-table
tp = Thickness of plate (mm)
Ft = Tangential force necessary to turn the screw (N)
fi = Initial mass of fuel (g)
ff = Final mass of fuel (g)
fm = Mass of wood that was used to bring the water to boil (g)
fd = Equivalent dry wood consumed (g)
F = Freedom
Cp.w = Specific heat capacity for water (4.2J/goC)
Cc = Specific heat capacity of cotton (17539J/g)
Cfw = Heat value for fuse wire (1402.243J/g)
Ccap = Heat value of capsule (18836J/g)
H = Height of nut (mm)
Hf = Calorific value of fuel (KJ/Kg)
HL = Latent heat of evaporation of water (2260J/g)
Qf = Heat liberated by fuel (KJ)
Qw+c = Heat absorbed by water and calorimeter (KJ)
u = Ultimate tensile strength of material (N/m2)
σn = Direct stress (N/m2)
σ1,2 = Principal stress (N/m2)
max = Maximum bending stress (N/m2)
R = Normal reaction between Screw and Nut (N)
Rb = Burning rate
r = Number of block (Number of test)
Δ = Temperature rise in calorimeter (oC)

xi
ΔT = Temperature difference in water boiling test (oC)
ΔC = Weight of fuel ash (g)
B.M = Bending moment (Nm)
Π = pi
N = Factor of Safety
c = Width over which pressure is applied (mm)
Ø = Friction angle
µ = Coefficient of friction
= Thread helix angle
k = Number of treatment (Fuel samples)
E = Modulus of Elasticity (N/m2)
I = Moment of inertia (m-4)
b = Length of cover plate (mm)
D = Flexural rigidity of plate
g = Acceleration due to gravity (9.81m/s2)
= Thermal efficiency

xii
ABSTRACT
The decreasing availability of fuel wood, coupled with the ever rising prices of kerosene
and cooking gas in Nigeria draws attention to consider alternative sources of energy for
domestic and cottage level industrial use in the country. This research work was conducted
to design and construct a low cost briquette machine for rural communities in Nigeria. It
involved the modification of the existing CINVA RAM press and evaluation of the
products produced. Selected agricultural residues (i.e. rice straw and rice husk), saw dust
residue of softwood and a combination of 50% rice husk + 50% saw dust by weight with
30% optimum cassava starch by weight as binder were used to produce briquettes.
Performance characteristics were evaluated for the briquettes produced based on average
fuel efficiency, burning rate and specific fuel consumption. Calorific value of 16,577KJ/Kg
was obtained for rice straw briquette, 14,396KJ/Kg for rice husk briquette, 15,547KJ/Kg
for sawdust briquette, 17,529KJ/Kg for 50% rice husk + 50% saw dust briquette and
12,378KJ/Kg for firewood (Parkia biglobosa). The average fuel efficiency, burning rate
and specific fuel consumption values of 10.68%, 1.10Kg/hr, 0.3g/g, 22.42%, 0.83Kg/hr,
0.13g/g, 15.40%, 1.03Kg/hr, 0.26g/g, 18.52%, 0.93Kg/hr, 0.16g/g and 12.29%, 1.62Kg/hr,
0.36g/g were obtained for rice straw briquette, rice husk briquette, saw dust briquette, 50%
rice husk + 50% saw dust briquette and firewood respectively. Statistical analysis using the
least square differences in comparison to each of the fuel samples average performances
showed that rice husk briquette had the most outstanding thermal performance.

xiii
TABLE OF CONTENTS
TITLE PAGE . . . . . . . . ii
DECLARAION . . . . . . . . iii
CERTIFICATION . . . . . . . . iv
DEDICATION . . . . . . . . v
ACKNOWLEDGEMENT . . . . . . . vi
NOMENCLATURE . . . . . . . . viii
ABSTRACT . . . . . . . . . xii
TABLE OF CONTENTS . . . . . . . xiii
CHAPTER ONE
1.0 Introduction . . . . . . . . 1
1.1 Problem Statement . . . . . . . 2
1.2 Agricultural and wood Residues . . . . . 3
1.2.1 Particle board and straw board production . . . . 4
1.2.2 Biogas production by anaerobic decay of organic materials . . 4
1.2.3 Gasification . . . . . . . . 5
1.2.4 Biomass Combustion . . . . . . . 6
1.2.5 Briquetting . . . . . . . . 7
1.2.6 Ruminant Feeding . . . . . . . 7
1.2.7 Construction of village level grain storage structure . . . 7
1.2.8 Regulation and reduction of geothermal temperature . . 8
1.3 Justification of Research . . . . . . 8
1.4 Existing Briquetting Techniques . . . . . 10
xiv
1.4.1 Wu-Presser . . . . . . . . 10
1.4.2 Earth Rams . . . . . . . . 10
1.4.3 Tube-Presses . . . . . . . . 11
1.4.4 Screw Presser . . . . . . . . 12
1.4.5 Hydraulic Press . . . . . . . 12
1.4.6 Piston Press . . . . . . . . 13
1.4.7 Pelletizer . . . . . . . . 13
1.4.8 Heat Die Extrusion Screw Press . . . . . 14
1.5 Objectives of study . . . . . . . 15
CHAPTER TWO
2.0 Literature Review . . . . . . . 16
2.1 Research and Development Efforts in the Use of Agricultural Residues
as Energy Source for Cooking Purpose Using Low Cost Technique . 16
2.2 Review of Previous Research Work on Briquette making Raw Materials 22
2.3 Review of Previous Research Work on Residue Energy Potential . 24
2.4 Review of Previous Studies on Binding of Briquettes . . 25
2.5 Review of Research Work on Calorific Values of Some Briquettes . 27
CHAPTER THREE
3.0 Machine Design and Construction Processes. . . . 30
3.1 Material . . . . . . . . 30
3.2 Design Considerations . . . . . . 30
3.3 Description of Parts and Functions . . . . . 31
3.3.1 The Main Frame and Mould . . . . . . 31

xv
3.3.1.1 Function . . . . . . . . 31
3.3.2 The Base Ram. . . . . . . . 32
3.3.2.1 Function . . . . . . . . 32
3.3.3 The Connecting Link Mechanism and Power Screw . . . 32
3.3.3.1 Function . . . . . . . . 32
3.4 Design Analysis . . . . . . . 32
3.4.1 The Handle . . . . . . . . 32
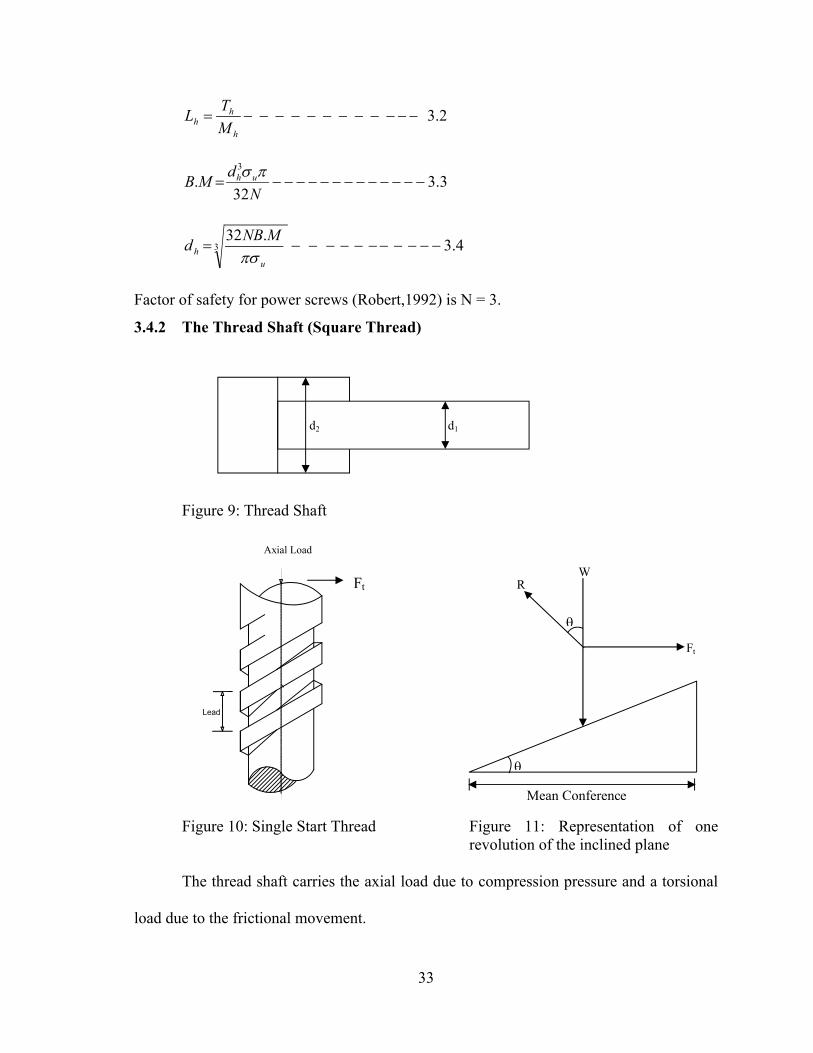
3.4.2 The Thread Shaft (Square Thread) . . . . . 33
3.4.3 Bearings . . . . . . . . 35
3.4.4 Nut . . . . . . . . . 36
3.4.5 The Cover Plate . . . . . . . 36
3.4.6 Coupling Bolt for Installation . . . . . . 37
3.5 Design Calculations . . . . . . . 38
3.6 Construction of Machine . . . . . . 45
3.7 Pallets (Aluminum Foil) . . . . . . 50
3.8 Coupling of Components . . . . . . 50
3.9 Method of Operating the Briquette Press . . . . 51
3.9.1 Filling Mould with Material . . . . . . 51
3.9.2 Compression Stroke . . . . . . . 52
3.9.3 Ejection Stroke . . . . . . . 52
3.9.4 Maintenance and Repair . . . . . . 53
3.10 Briquette Production . . . . . . . 53
3.10.1 Material . . . . . . . . 53
3.10.2 The Binder: Cassava Flour . . . . . 53

xvi
3.10.3 Preparation and Production of Briquettes from Residues . . 54
CHAPTER FOUR
4.0 Tests and Results . . . . . . . 56
4.1 Tests . . . . . . . . . 56
4.2 Determination of Calorific Value . . . . . 56
4.2.1 Equipments used for the Calorific value test . . . . 56
4.2.2 Test Procedure Carried Out . . . . . . 56
4.3 The Water Boiling Test (WBT) . . . . . 59
4.3.1 Introduction . . . . . . . . 59
4.3.2 Equipments used in the Boiling Water Test . . . . 60
4.3.3 Variables . . . . . . . . 60
4.3.3.1 Fuel Samples . . . . . . . . 60
4.3.3.2 Stove . . . . . . . . . 61
4.3.3.3 Pot . . . . . . . . . 61
4.3.3.4 Lid . . . . . . . . . 61
4.3.3.5 Power Control . . . . . . . . 62
4.3.3.6 Environment . . . . . . . . 62
4.4. Experimental Phases Process . . . . . . 62
4.4.1 Phase 1: High Power (Cold start) . . . . . 62
4.4.2 Phase 2: High Power (Hot start) . . . . . 63
4.4.3 Phase 3: Low Power (Simmering) . . . . . 64
4.5 Analysis . . . . . . . . 64
4.5.1 Definition of terms . . . . . . . 64

xvii
4.5.2 Statistical Analysis . . . . . . . 65
4.5.3 Analysis of Variance (ANOVA) . . . . . 66
4.6 Calorific value of fuel samples . . . . . 67
4.6.1 Average Thermal Efficiency ( in %) for Fuel Samples . . 68
4.6.2 Average Burning Rate for Fuel Samples . . . . 68
4.6.3 Average Specific Consumption for Fuel samples . . . 69
4.6.4 Boiling Time . . . . . . . . 70
CHAPTER FIVE
5.0 Discussion of Results . . . . . . . 75
5.1 Introduction . . . . . . . . 75
5.2 Performance of the Briquetting Screw Press . . . . 75
5.3 Performance of Fuel Samples . . . . . . 76
5.3.1 Rice Straw Briquettes . . . . . . . 76
5.3.2 Rice Husk Briquettes . . . . . . . 77
5.3.3 Saw Dust Briquettes . . . . . . . 78
5.3.4 50% Rice Husk + 50%Saw Dust Briquettes . . . . 79
CHAPTER SIX
6.0 Summary, Conclusion and Recommendation. . . . 81
6.1 Summary . . . . . . . . 81
6.2 Conclusion . . . . . . . . 82
6.3 Recommendation . . . . . . . 83
REFERENCES . . . . . . . . 84
APPENDICES . . . . . . . . 88
WORKING DRAWINGS . . . . . . . 114

xviii
LIST OF TABLES
Table 1.1: Nigeria’s renewable energy resources . . . 1
Table 2.1: Calorific Value and Ash Content of Various Fuels . . 27
Table 2.2: Typical Ultimate analysis of briquetted fuels by weight (%). 28
Table 3.1 Construction Processes . . . . . 45
Table 4.1: The ANOVA table . . . . . . 66
Table 4.2: Result of Values for Bomb Calorimeter Test on Fuel Samples 70
Table 4.3: Average Values of Thermal efficiency of Fuel Samples . 71
Table 4.4: Analysis of variance for thermal efficiency of fuel samples . 71
Table 4.5: Average Values of Burning Rate of Fuel Samples . . 72
Table 4.6: Analysis of Variance for Burning Rate of Fuel Samples . 72
Table 4.7: Average Values for Specific Fuel Consumption
of Fuel Samples . . . . . . 73
Table 4.8: Analysis of Variance for Specific Fuel Consumption of
Fuel Samples . . . . . . . 73
Table 4.9: Results of Fuel Samples Boiling point Time and
Simmering Duration . . . . . . 74
Table 5.1 Bill of Quantity . . . . . . 80

xix
LIST OF FIGURES
Figure 1: Biogas energy route . . . . . . 5
Figure 2: Gasification process . . . . . . 6
Figure 3: The Wu-presser . . . . . . 10
Figure 4: Combustaram . . . . . . . 11
Figure 5: Tube Press . . . . . . . 11
Figure 6: Screw presser in use . . . . . . 12
Figure 7: Piston Press . . . . . . . 13
Figure 8: Heated die extrusion screw press . . . . 14
Figure 9: Thread Shaft . . . . . . . 33
Figure 10: Single Start Thread . . . . . . 33
Figure 11: Representation of 1 revolution of the inclined plane . 33
Figure 12: Cover Plate . . . . . . . 36
Figure 13: Temperature versus Time graph for Bomb Calorimeter
Test of Rice Straw Briquette . . . . . 106
Figure 14: Temperature versus Time graph for Bomb Calorimeter
Test of Rice Husk Briquettes . . . . . 106
Figure 15: Temperature versus Time graph for Bomb Calorimeter
Test of Sawdust Briquette . . . . . 107
Figure 16: Temperature versus Time graph for Bomb Calorimeter
Test of 50% Saw dust/50% Rice husk . . . 107
Figure 17: Temperature versus Time graph for Bomb Calorimeter
Test of Firewood . . . . . . 108

xx
Figure 18: Graph of Water Boiling Test 1 (cold start) of fuel samples . 109
Figure 19: Graph of Water Boiling Test 1 (hot start) of fuel samples . 109
Figure 20: Graph of Water Boiling Test 2 (cold start) of fuel samples . 110
Figure 21: Graph of Water Boiling Test 2 (hot start) of fuel samples . 110
Figure 22: Graph of Water Boiling Test 3 (cold start) of fuel samples . 111
Figure 23: Graph of Water Boiling Test 3 (hot start) of fuel samples . 111
Figure 24: Thermal Efficiency (%) of Fuel Samples . . . 112
Figure 25: Burning rate of Fuel Samples . . . . . 113
Figure 26: Fuel Consumption (g/g) of Fuel Samples . . . 114

xxi
LIST OF PLATES
Plate I: Manually operated briquetting machine . . . 21
Plate II: Carbonated sawdust briquette . . . . . 22
Plate III: Coal dust briquette . . . . . . 22
Plate IV: Aluminum Foil (pallet) . . . . . 50
Plate V: Fully assembled briquetting press . . . . 51
Plate VI: Mould before filling . . . . . . 51
Plate VII: Filling mould with prepared residue . . . . 51
Plate VIII: Position for compression . . . . . 52
Plate IX: Inside mould after compression . . . . 52
Plate X: Ejected briquettes . . . . . . 52
Plate XI: Briquette removing from divider . . . . 52
Plate XII: Briquettes drying in the sun . . . . . 52
Plate XIII: Crushed Rice Straw . . . . . . 54
Plate XIV: Rice Straw Briquette . . . . . . 55
Plate XV: Rice Husk Briquette . . . . . . 55
Plate XVI: 50% Saw Dust + 50% Rice Husk Briquette . . . 55
Plate XVII: Saw Dust Briquette . . . . . . 55

xxii
APPENDICES
Appendix A Weight of Fuel Samples for Bomb Calorimeter Test . .. 88
Appendix B Temperature Readings with Time of Bomb Calorimeter
Test for Fuel Samples . . . . . . 89
Appendix C Sample Calculation for Determining Calorific Value
for Fuel Samples Using Rice Straw Briquette Sample . 90
Appendix D Water Boiling Test Values for Rice Straw Briquettes . 91
Appendix E Water Boiling Test Values for Rice Husk Briquettes . . 92
Appendix F Water Boiling Test Values for Saw Dust Briquettes . . 93
Appendix G Water Boiling Test Values for 50% Saw Dust +
50% Rice Husk . . . . . . 94
Appendix H Water Boiling Test Values for Firewood . . . 95
Appendix I Experimental Results of Water Boiling 1
(Cold start) for Fuel Samples . . . . . 96
Appendix J Experimental Results of Water Boiling Test 1
(Hot start) for Fuel Samples . . . . . 97
Appendix K Experimental Results of Water Boiling Test 2
(Cold start) for Fuel Samples. . . . . 98
Appendix L Experimental Results of Water Boiling Test 2
(Hot start) for Fuel Samples . . . . . 99
Appendix M Experimental Results of Water Boiling Test 3
(Cold start) for Fuel Samples . . . . . 100
Appendix N Experimental Results of Water Boiling Test 3

xxiii
(Hot start) for Fuel Samples . . . . . 101
Appendix O The t-Distribution: Fractiles . . . . . 102
Appendix P 5 Per cent points of the F-distribution . .. . 103
Appendix Q 1 Per cent points of the F-distribution . . . 104
Appendix R Graphs . . . . . . . . 105
Appendix S Charts of Fuel Performance . . . . . 111

xxiv
DRAWINGS
Drawing no.1 Isometric View Briquette Screw Press . . 115
Drawing no.2 Sectional View . . . . . 116
Drawing no.3 Assembled Briquette Screw Press . . . 117
Drawing no.4 Isometric View Sub Assembly of Frame . . 118
Drawing no.5 Frame Base Coupler . . . . . 119
Drawing no.6 Bearing Guide . . . . . . 120
Drawing no.7 Frame Vertical Support (RHS) . . . 121
Drawing no.8 Mould Seat . . . . . . 122
Drawing no.9 Frame Reinforcement . . . . . 123
Drawing no.10 Frame Vertical Support (LHS) . . . 124
Drawing no.11 Base Reinforcement . . . . . 125
Drawing no.12 Orthographic of Frame . . . . 126
Drawing no.13 Mould . . . . . . . 127
Drawing no.14 Sub Assembly of Cone Rod with Base . . 128
Drawing no.15 Base Plate . . . . . . 129
Drawing no.16 Cone Rods . . . . . . 130
Drawing no.17 Cone Rods with Base Plate . . . . 131
Drawing no.18 Pressure Plate . . . . . . 132
Drawing no.19 Sub Assembly of Cover . . . . 133
Drawing no.20 Cover Compression Plate . . . . 134
Drawing no.21 Pipe . . . . . . . 135
Drawing no.22 Cover Plate . . . . . . 136

xxv
Drawing no.23 Mould Handle . . . . . . 137
Drawing no.24 Bearing Housing . . . . . 138
Drawing no.25 Mould Cover . . . . . . 139
Drawing no.26 Isometric View Sub Assembly of Connecting Linkage 140
Drawing no.27 Linkage Arm . . . . . 141
Drawing no.28 Linkage Coupler . . . . . 142
Drawing no.29 Orthographic of Connecting Linkage . . . 143
Drawing no.30 Isometric View Sub Assembly of Ram Base . . 144
Drawing no.31 Ram Arm . . . . . . 145
Drawing no.32 Base Ram Coupler . . . . . 146
Drawing no.33 Ram Plate . . . . . . 147
Drawing no.34 Coupler Reinforcement . . . . 148
Drawing no.35 Arm Reinforcement . . . . . 149
Drawing no.36 Ram Base . . . . . . 150
Drawing no.37 Isometric View Sub Assembly of Mould Divider . 151
Drawing no.38 Dividers . . . . . . 152
Drawing no.39 Divider Interlocker . . . . . 153
Drawing no.40 Mould Divider. . . . . . 154
Drawing no.41 Screw Handle . . . . . . 155
Drawing no.42 Orthographic of Pivot Shaft . . . . 156
Drawing no.43 Ejection Shaft . . . . . . 157
Drawing no.44 Screw Thread Shaft . . . . . 158

1
CHAPTER ONE
INTRODUCTION
Approximately 2000 million people world wide; most rural people and many urban
as well, all depend on wood fuels as their main or sole source of energy to cook their food
and keep warm. Nine-tenths of all the wood harvested annually is used for energy; “it
accounts for over two-thirds of total energy consumption in 24 tropical countries of which
16 are least-developed countries” (Rodas, 1981).
The demand for fuel wood is expected to have risen to about 213.4x10³ metric
tones, while the supply would have decreased to about 28.4x10³ metric tones by the year
2030 (Adegbulugbe, 1994).
In Nigeria, the Energy Commission of Nigeria (ECN) recently (2005) reported that
Nigeria’s fossil led economy is under severe pressure and gave data of potential renewable
energy for utilization including crop residue as shown in table 1.1 below.
Table 1.1: Nigeria’s renewable energy resources
Energy Source Capacity
Hydropower, large scale 10,000MW
Hydropower, small scale 734MW
Fuel wood 13,071,464 hectares (forest land)
Animal waste 61 million tones/yr
Crop Residue 83 million tones/yr
Solar Radiation 3.5 – 7.0 kW/m2-day
Wind 2-4 m/s (annual average)
Source: ECN (2005)

2
1.1 Statement of Problem
As wood fuel supplies diminish, the people who depend on wood fuels are
suffering increase in physical or economic burdens in maintaining even a minimal daily
fuel supply. The use of firewood and misuse of the existing energy resources (agricultural
residues) is creating human and environmental crisis in developing countries which is
resulting in deforestation. Traditionally, wood in form of fuel wood, twigs and charcoal
has been the major source of renewable in Nigeria, accounting for about 51% of the total
annual energy consumption; the other sources of energy include natural gas (5.2%),
hydroelectricity (3.1%), and petroleum products (41.3%) (Akinbami, 2001).
In many developed and developing countries, the forest covers at least 25% of the
total land area, the minimum level required by international standard. The first indicative
forest inventory project completed in Nigeria in 1977 put reserved forest at approximately
10% of the total land area. Between 1976 and 1990, deforestation proceeded at an average
rate of 400,000 ha. per annum, in 1981-1985 at 3.48% while in 1986-1990 it was 3.57%
including some forest reserves. The FAO concluded that if this rate was maintained, the
remaining forest in Nigeria would disappear by the year 2020. The degradation and
depletion of the forest reserve base has major effects on other sectors of the economy. The
disappearance of forest cover leads to erosion, soil degradation and unfavorable
hydrological changes (Government of Nigeria, 1997).
The decreasing availability of fuel wood, coupled with the ever rising prices of
kerosene and cooking gas in Nigeria, draw attention to the need to consider alternative
sources of energy for domestic and cottage level industrial use in the country
(Olorunnisola, 2007). Such energy sources should be renewable and should be accessible

3
to the poor. As rightly noted by Stout and Best (2001), a transition to a sustainable energy
system is urgently needed in the developing countries such as Nigeria. This should, of
necessity, be characterized by a departure from the present subsistence energy level usage
which is based on decreasing firewood resources, to a situation where human and farming
activities would be based on sustainable and diversified energy forms.
The realization that deforestation and wood fuel shortages are likely to become
pressing problems in many countries has turned attention to other types of biomass fuel.
Agricultural residues are, in principle, one of the most important of these. They arise in
large volumes and in the rural areas which are often subject to some of the worst pressures
of wood shortage (Eriksson and Prior 1990). If one or more efficient method of using the
abundant agricultural and wood residues could be developed on a large scale the energy
situation could be sustainable and the deforestation problem could be controlled.
The lack of capital among most house holds in the rural communities makes it
difficult to move from either firewood or charcoal, to a more advanced energy sources
where small initial capital investment can be used. Hence, the substitute of these fuels
requires a minimal capital investment, be as cheap and accessible as charcoal and
firewood. At the same time be environmentally sustainable.
1.2 Agricultural and wood residues
Large quantities of agricultural and wood residues are generated yearly in
developing countries but they are neither managed nor utilized efficiently. Agricultural
residues which are freely available are often discarded or burned as wastes. They occur in
large amounts and have the potential to be an important industrial input for fuel production
in briquette forms, particle board and straw board for furniture making, biogas fuel,

4
gasification, biomass combustion, ruminant feeding, absorbent for industrial effluents
treatment, grain storage structure and regulation/reduction of geothermal temperature.
The procedures for manufacturing these products are described briefly below;
1.2.1 Particle board and straw board production.
Wood residues resulting from furniture making industries or stalks like cotton
stalks after harvesting cotton are either grounded into particles for particle board or steam
heated to breakdown the residues into fibers for medium density fiberboard, then dried to
lower moisture content. After the fiber is dried, it is blended with wax, a synthetic resin
such as urea formaldehyde, and other addictives, and formed into mats. The mats are
processed in large presses that use heat and pressure to cure the resin and form the products
into sheets or boards. Primary finishing steps of particle and medium density fiber board
include cooling or hot stacking, grinding, trimming/cutting and sanding. Secondary steps
include fooling, painting, laminating and edge finishing. Straw boards are made from straw
and bagasses, which undergo the same production procedure as particle board production.
They are used for making doors, furniture and cabinets (Gary and Rajiva, 2001).
1.2.2 Biogas production by anaerobic decay of organic materials.
Anaerobic reactors are generally used for the production of methane biogas, from
manure (human and animal waste) and agricultural residues. They utilize mixed
methanogenic bacterial cultures which are characterized by defined optimal temperature
ranges for growth. These mixed cultures allow digesters to be operated over a wide range
i.e. above 0oC up to 60oC. When functioning well, the bacteria convert about 90% of the
feedstock energy content into biogas containing about 55% methane, which is a readily

5
useable energy source for cooking and lighting. Fig.1 below shows the route path of biogas
energy production.
Figure 1: Biogas energy route Source: Elizabeth, et al, (1999)
1.2.3 Gasification.
Gasification is the process involving the burning of biomass fuels (human, animal
and agricultural wastes) at very high temperatures with a limited supply of oxygen so that
the burning process is only partially completed (Elizabeth et al, 1999). High temperatures
and a controlled environment lead to virtually all the raw materials being converted to gas.
This takes place in two stages. In the first stage, the biomass is partially combusted to form
producer gas and charcoal. In the second stage, the carbon dioxide (CO2) and water (H2O)
produced in the first stage is chemically reduced by the charcoal, forming carbon
monoxide (CO) and hydrogen (H2). The composition of the gas is 18% to 20% H2 gas
equal portion of CO, 2% to 3% methane (CH4), 8% to 10% CO2 and the rest nitrogen.
These stages are spatially in the gasifiers. Gasifiers require temperature of about 800oC and
is carried out in closed-top or open top gasifiers. These gasifiers can be operated at
AnaerobicDigestion
Methane
Digester Sludge Heating and lighting
Mechanical powerManure/Soil Conditioner
Animal waste Human/municipal wastes
Agricultural or crop wastes
Industrial Carbonaceous waste
Electrical power

6
atmospheric pressure or higher. The producer gas can be burned directly in processes
which normally use oil fired boilers. It can be burned in ovens, kilns and driers to replace
fuels otherwise, used in this equipment. The gas can also be cleaned and used to run an
engine for generating electricity.
Figure 2: Gasification process. Source: Vannbush, (2006)
1.2.4 Biomass Combustion.
Biomass fuel (agricultural residue) is burned in a furnace or boiler. The heat is used
to produce high pressure steam. This steam is introduced into a steam turbine where it
flows over a series of aerodynamic turbine blades, causing the turbine to rotate. The
turbine shares a common shaft with an electric generator so as the steam flows it causes the
turbine to rotate, the electric generator is turned and electricity is produced. Also it can be
used to produce hot water for goods processing.

7
1.2.5 Briquetting.
This involves the densification process of loose organic materials, such as rice
husk, sawdust and coffee husk aiming at improving handling and combustion
characteristics. There are two principal methods of briquetting, with or without a binder.
The binder technology is used where low pressure presses are employed to produce
briquette. Binders are added to this process to improve mechanical strength and also allow
dry materials to be briquetted using low pressure techniques as simple block presses or
extrusion presses. The binderless technology is a high pressure technique which produces
briquettes from fine dry particle size materials without a binder being added. Three types
of press are commonly used. Piston press, pelletizers and screw extrusion presses.
Briquettes are burned the same way as wood and can be used directly in open fires,
gasifiers, boilers, furnaces and kilns.
1.2.6 Ruminant Feeding.
Fibrous agricultural residues such as rice straw, sugarcane tops, cassava leaf,
soyabean-straw, peanut vines and sweet potato vines are important component of the feed
base for ruminant livestock particularly in areas where land grazing is limited and pasture
growth is seasonal (Dixon, 1985).
1.2.7 Construction of village level grain storage structure.
Agricultural residues could be used to construct village level grain storage
structure, called rhumbu which may be thatched, mud or underground pit. Thatched
rhumbus are commonly found in the north-Eastern parts of Nigeria. They are cylindrical in
shape with floors made of wooden grass stems or fibers and overhanging conical roof
made with straws or grass. The structure normally is supported on low wooden structure or

8
by stones. The wall is provided with tension rings in two or three positions using local rope
material. Mud rhumbus are found in Zaria and Sokoto towns in Nigeria. They are circular
in cross section and supported on stone pieces or pillars which are about 25-50cm above
the ground. The floor is made of wood and plastered with mud; the roof is conical and
made of thatch. Underground pits are found in the Sahel part of the Sudan savanna Zone
where water table is low. The pit is either round or square is 2-3m deep and 1.5-3m in
diameter or square. The pit is lined with straw mat (Zare) with corn husk padding or
insulation is provided at the bottom of the pit, it is covered with a polyethylene or metal
sheet, then a layer of husk and finally with layers of laterite (Olumeko and Igbeka, 1996).
1.2.8 Regulation and reduction of geothermal temperature.
In animal structures agricultural residues such as groundnut shells, maize husk or
sawdust of 6mm particles are spread on the floors of poultry houses, horse stables and
goat/sheep pens to serve as an absorbent material to keep the structure dry and the animals
away from cold floors.
1.3 Justification of Research
The abundantly available agricultural and wood residues can efficiently be used for
resolving energy problems to a significant extent by adopting proper measures.
Olorunnisola (2002) states that of the various types of biomass processing technologies
that are being considered, and for which there are currently potentially viable local markets
for in the country, which include biomass combustion, gasification and
briquetting/pelletizing it is evident that none of these alternatives can compete with the low
capital investment that is required; with the briquetting technology. Several kinds of
agricultural residues can be utilized properly by densifying loose residues to produce a

9
compact product of different sizes. Briquetting is essentially a mechanical process
requiring investment in equipment and training to ensure a product of reasonable quality
that will perform the task for which it is intended. Russell, (1997) considered that
briquetting is often seen as a relatively high-cost high-pressure technology, and that it is
possible to use a low-cost low-pressure technique to produce acceptable briquettes.
For rural communities the most suitable briquetting methods are those which are based
on available waste and building materials. The manufacturing should be done in locally
made hand operated presses and the briquettes held together mainly by a binder.
Briquette making saves trees and prevents problems like soil erosion and
desertification by providing an alternative to burning wood for heating and
cooking.
Briquetting substitutes agricultural waste like hulls, husk, corn stocks, grass, leaves
and other garbages for a valuable resource.
Briquetting engenders many micro enterprise opportunities making the presses
from locally available materials, supplying materials, supplying materials and
making the briquettes, selling and delivering the briquettes.
The availability of briquette as an alternative fuel to replace firewood can also
improve the living conditions of the rural women and children, who spend most of
their time collecting firewood instead of engaging in other income generating
activities or attending school.

10
1.4 Existing Briquetting Techniques
1.4.1 Wu-Presser
The Wu-presser was developed by the Washington University. It is constructed
from either metal or wooden parts as shown in figure 3 below.
Figure 3: The Wu-presser Source: Legacy Foundation (2003)
The Wu-presser presses briquettes in three steps shown in the illustration above. Each step
will press with increasing pressure. This takes advantage of the non-linear force to distance
property of briquetting pressing.
1.4.2 Earth Rams
Presses currently in use for making stabilized earth blocks might be modified to
make briquettes. The Combustaram, similar to the CINVA-Ram and Tersaram, is
commercially available or can be manufactured locally, see figure 4 below. The lever arm
is put in the open position, feed stock is poured into the molds and the lever is then quickly
pushed up, over the top of the press, and down. This movement positions the lever over the
top of the press and compresses the briquettes on the downward stroke.
11
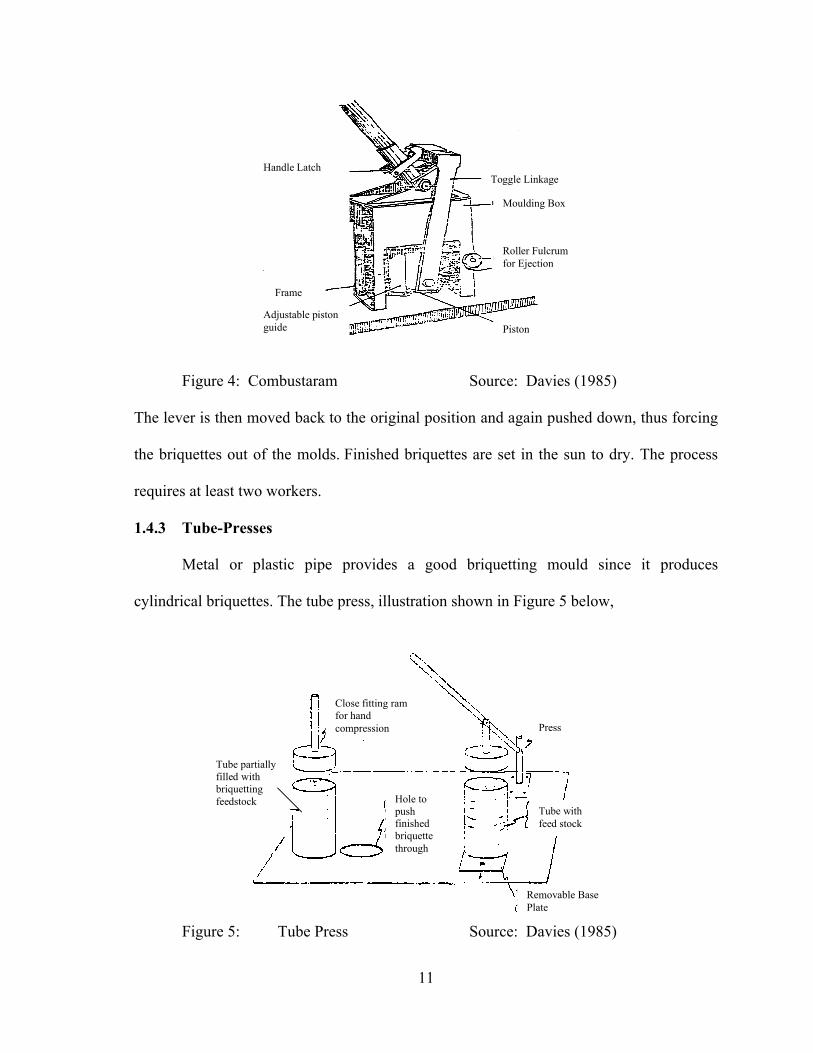
Figure 4: Combustaram Source: Davies (1985)
The lever is then moved back to the original position and again pushed down, thus forcing
the briquettes out of the molds. Finished briquettes are set in the sun to dry. The process
requires at least two workers.
1.4.3 Tube-Presses
Metal or plastic pipe provides a good briquetting mould since it produces
cylindrical briquettes. The tube press, illustration shown in Figure 5 below,
Figure 5: Tube Press Source: Davies (1985)
Moulding Box
Roller Fulcrumfor Ejection
Adjustable piston guide
Handle LatchToggle Linkage
Tube with feed stock
Press
Removable Base Plate
Hole to push finished briquette through
Close fitting ram for handcompression
Tube partially filled with briquetting feedstock
Frame
Piston

12
consist of a tube mounted vertically on a platform and a close fitting ram used for
compaction. The basic design can be varied considerably, as the figure indicates. Feed
stock is poured into the tube and compressed with the ram. The tube is then positioned
over a hole (or a slide is removed) below the tube exposing a hole and the briquette is
pushed through. Briquettes are then dried in the sun before storage and use.
1.4.4 Screw Presser
The screw presser makes briquettes in upright cylinders. The raw material is
compressed by lowering a metal disc which is moved vertically by a screw that is turned
by hand. The screw press is most commonly made of metal as shown in figure 6 below.
Figure 6: Screw presser in use. Source: Olle and Olof (2006)
1.4.5 Hydraulic Press
These machines operate by hydraulic pressure acting upon a piston that extrudes
the material through a longitudinal die. The machine operates rather slowly which
minimizes the wave rates. However, they operate at much lower pressures and the
briquette quality is of lower density. They are typically used for low outputs of 40kg/hr but
can be made to achieve up to 80kg/hr.

13
1.4.6 Piston Press
These machine works best with dry (15% moisture content maximum) cellulose
material, which is fed into a compression chamber. A reciprocating piston then forces the
material through a tapered die to form a long briquette as shown in figure 7 below.
Typically flywheel drive machines produce between 300kg and 500kg of briquettes per
hour.
Figure 7: Piston Press Source: Bhattacharya et al, (1984)
The machine can achieve a service life of between 500 hours and 1000 hours using
relatively clean material such as sawdust. Use of agricultural wastes containing high levels
of silica (sand) will reduce the operating hours considerably. The initial cost of this type of
machine is high and the briquettes are prone to breaking.
1.4.7 Pelletizer
Pellet presses have dies with small diameter (usually about 30mm). The machine
has a number of dies arranged as holes bored in a thick steel disk or ring. The material is
forced into the dies by means of a ram, perpendicular to the centerline of the dies. The

14
main force applied results in shear stresses in the material which often is favorable to the
final quality of the material. The pellets are cut to lengths normally about one or two times
the diameter (Eriksson and Prior, 1990). Pelletizers can produce up to 1000kg of pellets
per hour but require high initial capital investment and high energy input.
1.4.8 Heat Die Extrusion Screw Press
The heat die extrusion screw press is an industrial machine for producing briquettes
(see figure 8 below). It consists basically of an electric motor, a hopper, a die heater and
muff, and the screw which densifies the raw material.
Figure 8: Heated die extrusion screw press Source: Bhattacharya et al, 1984
The electric motor drives the briquetting screw, which is housed inside the die,
through a V-belt and pulley arrangement. Biomass raw material is fed to the screw through
the hopper. The electric die-heater softens the lignin in the raw material as it passes
through the die which acts as a binding material. A smoke trapping system traps and
removes the smoke from the vicinity during the briquetting process. Besides the cost of the
Electric Motor
Die Heater
Hopper
Muff

15
investment, the machine has a cost for the electricity consumed. Another cost is the screw
that gets worn and has to be replaced frequently.
1.5 Objectives of study
The objective of this project is to:
Design and construct a simple, low cost briquette machine which can be used in
rural communities.
Test the design briquette machine using selected agricultural residues (sawdust, rice
husk, rice straw) with cassava starch as binder.
Evaluate the calorific value of briquetted residues.
Compare calorific value and performance with firewood.
16
CHAPTER TWO
LITERATURE REVIEW
According to Grover and Mishra (1996), briquetting is one of the several
agglomeration techniques which are broadly characterized as densification technologies.
Agglomeration of residues is done with the purpose of making them more dense for their
use in energy production. Raw materials for briquetting includes waste from wood
industries, loose biomass and other combustible waste products. On the basis of
compaction, the briquetting technologies can be divided into:
1. High pressure compaction,
2. Medium pressure compaction with heating device,
3. Low pressure
Eriksson and Prior (1990), stated that if the material is compacted with low to
moderate pressure (0.2-5MPa), then the space between particles is reduced. Increasing the
pressure will at certain state particular to each material, collapse the walls of the cellulose
constituent (primary structural component of plant cell walls), thus approaching the
physical, or dry mass, density of the material. The pressures required to achieve such high
densities are typically in excess of 100MPa.
2.1 Research and Development Efforts in the Use of Agricultural Residues as
Energy Source for Cooking Purpose Using Low Cost Technique
Russell (1977) carried out a study of a simple briquette making technique which
was developed in Sri Lanka to produce corrugated briquette sheets made from coir. A
small amount of binder, lime, is mixed with the wet coir which is then placed into a
tobacco bailing box in alternate layers between sheets of corrugated metal until the box is

17
full. Pressure is exerted on the layers, pressing water out of the material and also helping a
chemical reaction to occur between the coir and the binder. After the briquettes have been
formed it requires drying for a number of days before being used. The resulting briquettes
can be cut easily or broken along the corrugation to produce small logs.
Vogler (1986) technically assesses some simple sawdust briquetting techniques in
which various attempts have been made to devise methods by which people in rural areas
can use sawdust to make briquettes. The simplest idea, for areas where dung is shaped by
hand and sun dried for use as fuel, is that the dung cake will burn longer if wood ash is
added. He found that most efforts have been devoted to making simple briquetting
machines.
Lardinois and Klundert (1993) stated that the use of organic waste as cooking fuel
in both rural and urban areas is not new. In seventeenth century England, the rural poor
often burned dried cow dung because of acute shortage of wood fuel due to widespread
deforestation. And they went further saying that during the two world wars, households in
many European countries made their own briquettes from socked newspaper and other
combustible domestic waste using simple lever operated press.
Kartha and Leach (2001) carried out a study using modern bioenergy to reduce
rural poverty. Good results were obtained by adapting presses for bricks or earth blocks in
briquetting wood and agricultural wastes.
Adegoke (2001) pointed out, that results of a recent study in the Mechanical
Engineering Department of the Federal University of Technology, Akure, have shown that
sawdust mixed with certain biomass materials of appropriate grain sizes and in certain
proportions have improved calorific values. This mixture of the sawdust and the biomass

18
materials are compressed using a specially developed briquetting machine and the
briquettes dried either directly in the sun or in an oven. When burned in internally lined
stoves, heat a loss to the environment is much reduced, a lot of cooking energy is obtained
from a relatively small amount of the sawdust briquettes.
The Forest Products Research and Development Institute (2002) second prize
winner in the mechanical inventions category in 1984 developed a carbonizer, simple, low-
cost machine. It has a rectangular trough, hopper, charcoal receiver, swing-type metal plate
cover and fire box. The briquetting machine is a simple energy- and money-saving device
used in converting charcoal fines from sawdust, rice hull, coconut coir dust and other
carbonaceous fine materials into charcoal briquettes for industrial uses. It consists of
molds, plungers, top sliding platen, common lever, fulcrum, steel plates where the molds
are welded, with a casing assembly.
Fernando, (2002), developed a technology for small scale briquetting, oriented to
briquetting agricultural waste and basically all kinds of burnable wastes. He achieved very
interesting and exciting results in his aim to find an alternative to the costly extruder
machine. He designed and operated his own machine based on the very principle of the
world wide known CINVA RAM machine, for producing compressed earth blocks. With a
pressure of around 3 – 7 MPa using a lever to apply a compressive force through a piston
he pressed the biomass into a briquette, shaped like an ordinary 6cm x 13cm x 24cm brick.
Inegbenebor (2002) compressed fibrous agricultural and wood waste materials with
suitable adhesive into briquettes in a compressing machine, which was designed and
constructed for this purpose. Nine samples of fibrous waste materials were prepared into
different categories: - (100% saw-dust, 100% rice-husk, and 50-50% rice-husk/sawdust),

19
using starch as adhesive for category A, while category B employs gum Arabic as adhesive
and category C used bentonite as adhesive. The results from a water boiling test (WBT),
involving comparison of the burning abilities of the solid fuel briquettes and fire wood of
the same quantity (200 grams) in boiling 1.5liters of water. Results showed that the solid
fuel briquettes bound with each of the three adhesives; boiled water within a period of 14
to 22 minutes. While, firewood boiled the same quantity of water within a period of 22 to
27 minutes. The open flame test showed that the solid fuel briquettes bound with starch
burnt with bluish yellow flame with little black smoke. The solid fuel briquettes bound
with gum Arabic and bentonite burnt with yellow flame with moderate black smoke.
Olorunnisola (2004) carried out, a study involving experimental production of
briquettes from chopped rattan strands mixed with cassava starch paste. Samples of rattan
strands of mixed species (Laccosperma secundiforum and Eresmopatha macrocarpa) were
collected from a furniture workshop in Ibadan, Oyo State, Nigeria. The strands, having an
average moisture content of 12% and an average dimension of 630 mm (length) by 4.0 mm
(width) and 1.8 mm (thickness), were reduced to 25 mm (length) by 4.0 mm (width) and
1.8 mm (thickness) particles by manual shearing. They were subsequently mixed with
cassava starch at six proportions by weight, i.e. 50%, 100%, 150%, 200%, 250%, and
300%. It was observed that the minimum proportion by weight of cassava starch required
for briquette formation was 200%. Compression experiments were performed using a
simple tabletop closed - end die piston press fitted with both a pressure and a dial gauge. It
was concluded that stable briquettes could be formed from rattan strands mixed with
cassava starch paste.

20
Bello (2005) carried out a research project in processing of agricultural residues
into briquettes as fuels for cooking purposes in the department of agricultural engineering,
Ahmadu Bello University, Zaria in which she produced briquettes from agricultural
residues using gum Arabic as her binder and evaluated their performance characteristics
based on fuel efficiency, cooking efficiency, boiling time and fuel consumption rate
respectively. Her briquettes were produced using a manual hand press used in making coal
briquettes in Amil Nigeria Limited in Kaduna State.
Murugappa Chettiar Research Centre (2005) is carrying out a research project
based on income generation through biomass charcoal briquetting work being
implemented at Kanathur and Thiruvidanthai villages in India where casuarinas leaf litter
is available abundantly as waste biomass. The moisture, ash, volatile matter and fixed
carbon content and biochemical properties of the biomass viz; cellulose, hemicellulose,
lignin, crude fiber, content have been estimated. The selected biomass has been carbonized
at different temperatures ranging from 200oC to 400oC and the charcoal yield determined.
Also, a hand operated biomass briquetting mould, have been fabricated with locally
available materials to prepare the charcoal briquettes for its ultimate analysis.
Energy Commission of Nigeria and United Nations Development Programme
(2005) stated that several machines have been developed in Nigeria for briquettes
production, including a single cylinder extrusion machine that transforms rice, millet and
sawdust husk to briquettes at 13kg of briquettes/hour. There are, however, only two small-
scale companies in Nigeria situated in Ogun and Kaduna states which produce and market
sawdust briquettes. The locally produced briquette has 6 to 7 times more energy content

21
per kg than un-briquetted biomass. Today, most work on biomass briquetting is confined to
University Research and Development centers.
Olorunnisola (2007) undertook a study to investigate the properties of fuel
briquettes produced from a mixture of a municipal solid waste and an agricultural residue,
i.e., shredded waste paper and hammer milled coconut husk particles. Briquettes were
manufactured using a manually-operated closed – end die piston press (see plate I) at an
average pressure of 1.2 x 10 3 N/m2 using four coconut husk: waste paper mixing ratios (by
weight), i.e., 0:100; 5: 95; 15: 85; and 25: 75. Results obtained showed that briquettes
produced using 100% waste paper and 5:95 waste paper-coconut husk ratios respectively
exhibited the largest (though minimal) linear expansion on drying. While the equilibrium
moisture content of the briquettes ranged between 5.4 % and 13.3%, there was no clearly
discernible pattern in equilibrium moisture content variation with increase in coconut husk
content. A reciprocal relationship was observed between compressed/relaxed density and
relaxation ratio of the briquettes. The mean durability rating of all the briquettes exceeded
95%. It was concluded that stable briquettes could be formed from waste paper mixed with
coconut husk particles.
]
Plate I: Manually operated briquetting machine

22
An industrial visit was made to the only present existing briquetting plant in
Nigeria (AMIL Nigeria Limited) located in Kaduna state in April 2007, to study their
production process. A tour of the plant showed that two well known existing processes are
used in their production. The automated, heat die screw extrusion press for densifying
sawdust, rice straw and corn stalks into carbonated briquettes without the use of binders.
The present worth of the equipment was said to cost five million naira (#5million). The
other process is a manual hand press, consisting of a round hollow cavity with twelve (12)
plungers which is controlled by a foot lever for compacting of coal dust with clay as binder
to form coal briquettes. Due to the erratic energy supply in the country with the cost of
running a generator to power the plant, along with miscellaneous expenses and staff salary
compared to the income generated from the sales of briquettes produced, the company had
been running at a great loss which has made it to fold up for over a year. Plate II and III
show the types of briquette produced by AMIL Company.
Plate II: carbonated sawdust briquette. Plate III: coal dust briquette.
2.2 Review of Previous Research Work on Briquette making Raw Materials
Maih et al (1999) conducted a study on rice husk briquettes at Sylhet, Khulna and
Dinaj Pur districts of Bangladish in order to identify the problems and prospects of using
the briquettes as an alternative fuel for cooking. Rice is the staple food for the people of

23
Bangladish. The total annual production of paddy is about 28million tonne (FAO, 1992)
and about 20% of this (5.6million tonne) is rice husk. The study also concluded that to
prevent environmental hazards caused by rapid deforestation activities, rice husk briquettes
may be introduced as an alternative fuel which is smoke free, less hazardous, high calorific
value and comparatively cheap.
Shakya, et al (2005) stated that agricultural residues like ground nut shells, straws,
tree leaves, grass, rice and maize husks, banana leaves and sawdust can be used for
briquette making. Although some materials burn better than others, the selection of raw
material is usually most dependent in what is easily available in the surrounding area of
where the briquettes are made. The briquettes can consist of a blend between several
different raw materials. However to use agricultural residues efficiently for energy
production, a detailed knowledge of its physical and chemical properties are required.
These properties, more specifically average and variation in elemental compositions, are
also essential for modeling and analyzing of energy conversion processes Table 1 below
shows the analysis of some agricultural residues.
Olle and Olof (2006) stated that lot of different materials can be used for briquette
making, for example agricultural residues like ground nut shells, straw, tree leaves, grass,
rice and maize husks and banana leaves. It is also possible to use already processed
materials such as paper, saw dust and charcoal fines. Although some materials burn better
than others, the selection of raw material is usually most dependent on what is easily
available in the surrounding areas of where the briquettes are made. They further stated
that, briquette can consist of a blend between many different raw materials. The
inflammability is not the only thing that matters when the raw material is being selected.

24
Another important characteristic is its ability to bond together, when compressed. For these
reasons fibre-rich materials are good.
2.3 Review of Previous Research Work on Residue Energy Potential
Tropical Development and Research Institute (1983) suggested from a survey in
1979, worldwide, that “about 250million tons of sawdust and over 400million tons of other
wood residues were produced”. The report also noted that about 60% of this material arose
in developing countries and whereas in the USA up to 80% of this waste was utilized, in
developing countries large quantities of these materials remain unused.
Eriksson and Prior (1990) technically assessed that one of the major world crops,
rice, has about 25% of the crop in the form of husk which amounts to about 100 million
tons of residue. On a smaller scale, world production of groundnuts is about 10 million
tons of which about 45% is shell. In general though there are crops with both higher and
lower residue yields, it is reasonable to assume that about 25% of any dry agricultural
feedstock is a residue.
Larry (1993) reported that the U.S. Forest Service estimates national forest wastes
at, one billion dry tons. In Minnesota alone, 7.2 million tons of wood residues are available
every year for fuel. Hennepin County in Minnesota (part of the seven-county metropolitan
Twin Cities area) produces almost 5,000 tons per day of burnable paper garbage. This
waste could be effectively converted to briquette fuel that would provide 80 billion Btus of
heat energy daily. This 80 billion Btus of daily untapped heat energy is equivalent to that
produced by 500,000 gallons of fuel oil, which, at $.90 per gallon, would cost $450,000
per day, or $3.15 million per week.

25
A Study by Wanamukonya and Jenkins (1994) highlighted the potential of
briquette biomass as a potential fuel to be utilized in Kenya. Biomass burning accounts for
85% of Kenya’s energy consumption, growing demand and lack of resources have created
the need for alternative energy resources. This study found the utilization of waste from
over 400 sawmills through the briquetting process could supply about 63,000 tons of
combustible material to help toward growing energy demands.
Center for Environment and Development in Africa (1997) reported that the timber
trade in southern Nigeria is highly commercial with over 500 saw mills. Sapele, a coastal
town in Delta State is the centre of the timber trade and has over 70 sawmills. The African
timber and plywood company, Sapele, is the biggest wood industry in Nigeria. There is
also the Epe Sawmill located at Epe on the shores of the Lekki lagoon. All this sawmills
generate large amount of saw dust waste which are not utilized efficiently.
European Biomass Industry Association (2000) produced a newsletter that
disseminated information on biomass (agricultural residues) resources as potentially the
world's largest and most renewable energy source, with an annual terrestrial biomass yield
of 220 billion oven-dry tonnes. In the European Union (EU), biomass currently supplies
3.5 percent of energy, representing 45 million tonne. Looking ahead to 2010-2015, the
possible energy supply from biomass in the EU is estimated at 130 million tonne.
2.4 Review of Previous Studies on Binding of Briquettes
Reineke (1964) carried a research into the binding action of some agricultural
residues and came out with the finding that granular materials require no added binder
because they are self bonding when briquetted at elevated temperatures. At temperatures
above the minimal plastic temperature (325oF for wood), the elastic strains set up in the
26
material under briquetting pressure are completely relieved and the particle surfaces come
together into intimate contact. Cohesion of the interfaces, interlocking of broomed out
fibrous parts of the particles, and a possible adhesion of the heat softened lignin (the
natural bonding agent between the wood fibers), all contribute to a binding action that
imparts satisfactory strength to briquettes after they have cooled under pressure.
Eriksson and Prior (1990) stated that binding agent is necessary to prevent the
compressed material from springing back and eventually returning to its original form.
This agent can either be added to the process or, when compressing ligneous material, be
part of the material itself in the form of lignin. Lignin, or sulphuric lignin, is a constituent
in most agricultural residues. It can be defined as a thermo plastic polymer, which begins
to soften at temperatures above 100°C and is flowing at higher temperatures. The softening
of lignin and its subsequent cooling while the material is still under pressure is the key
factor in high pressure briquetting. It is a physico-chemical process related largely to the
temperature reached in the briquetting process and the amount of lignin in the original
material.
Lardinois and Klundert (1993) suggested that the raw material of a briquette must
bind during compression; otherwise, when the briquette is removed from the mould, it will
crumble. Improved cohesion can be obtained with a binder but also without, since under
high temperature and pressure, some materials such as wood bind naturally. A binder must
not cause smoke or gummy deposits, while the creation of excess dust must also be
avoided. Two different sorts of binders may be employed. Combustible binders are
prepared from natural or synthetic resins, animal manure or treated, dewatered sewage
sludge. Non-combustible binders include clay, cement and other adhesive minerals.

27
Although combustible binders are preferable, non-combustible binders may be suitable if
used in sufficiently low concentrations. For example, if organic waste is mixed with too
much clay, the briquettes will not easily ignite or burn uniformly. Suitable binders include
starch (5 to 10%) or molasses (15 to 25%) although their use can prove expensive.
2.5 Review of Research Work on Calorific Values of Some Briquettes
Barnard (1985) gave an indication of the variations of ash content and calorific
value for a number of agricultural residues as shown in table 2.1 and said there were
discrepancies in the calorific values from different sources, probably due to inaccurate
testing procedures.
Table 2.1: Calorific Value and Ash Content of Various Fuels
Source: Barnard, (1985)
Material Ash Content %
Higher Calorific Value MJ/kg (oven dry)
Material Ash Content%
Higher Calorific ValueMJ/kg(oven dry)
Alfalfa straw 6.0 18.4 Olive pits 3.2 21.4
Almond shell 4.8 19.4 Pigeon pea stalks 2.0 18.6
Cassava stem - 18.3 Rice straw - 15.2
Coconut shell 0.8 20.1 " 19.2 15.0
Coconut husk 6.0 18.1 Rice husks - 15.3
Cotton stalks 17.2 15.8 " 16.5 15.5
" 3.3 17.4 " 14.9 16.8
Groundnut shells
- 19.7 Soybean stalks - 19.4
" 4.4 20.0 Soybean stalks - 19.4
Maize stalks 6.4 18.2 Sunflower straw - 21.0
" 3.4 16.7 Walnut shells 1.1 21.1
Maize cobs 1.5 18.9 Wheat straw - 18.9
" 1.8 17.4 " 8.5 17.2

28
Krist and Wentink (1985) gave ultimate analysis and the proximate analysis of
some typical briquettes as shown in table 2.2.
Table 2.2: Typical Ultimate analysis of briquetted fuels by weight (%)
Source: Krist and Wentink, (1985)
Eriksson and prior (1996) acknowledged that of the most important characteristics
of a fuel is its calorific value, that is the amount of energy per kg it gives off when burned.
Although briquettes, as with most solid fuels, are priced by weight or volume, market
forces will eventually set the price of each fuel according to its energy content. However,
the production cost of briquettes is independent of their calorific value as are the
transportation and handling costs. They went further stating that the calorific value can
thus be used to calculate the competitiveness of a processed fuel in a given market
situation. There is a range of other factors, such as ease of handling, burning characteristics
etc, which also influence the market value but calorific value is probably the most
important factor.
Material H C O Ash Calorific Value (net) MJ/kg
Rice husk 5.50 40.4 34.5 19.8 15.1(13.8)
Corn stover 6.05 47.1 43.5 3.40 18.6(17.2)
Cotton stalks 5.99 47.1 43.9 3.16 19.0(17.2)
Black coffee husks 5.10 47.8 36.0 8.90 18.6(17.5)
Cow dung 5.18 31.6 37.8 19.3 11.4(10.2)

29
Review of previous research works carried out to provide the rural communities
with a briquetting machine revealed that most of the low cost low pressure briquette
machines focused on producing a single briquette in one operation. None of these
machines have been successful in the market because of their low output with time spent in
producing briquettes which cannot compensate for the demand for energy (firewood) in the
rural homes. Use of briquettes in Nigeria is zero because of the cost of imported
briquetting machines and adequate research work not conducted in the country to find
alternative machines.
Above all, the need to identify a technology which can be successful in the Third
world marginalized communities; like Nigeria, where the high pressure mechanized
process have not been successful, infrastructure is weak, supply of raw material is
inconsistent in quantity and the market populations are widely dispersed over areas which
are difficult to access brought about this project. This project is aimed at re-designing the
most popular existing low cost low pressure technology (Cinva Ram Press) to produce
multiple briquettes in one operation, in order to meet the demand for fuel in the rural
community, to save trees and prevent soil erosion. Having in mind that the machine can be
produced in the areas of local need by local citizen, with no technical skills and the
community would have little cash flow and the local market would be price driven in their
fuel price decision.

30
CHAPTER THREE
MACHINE DESIGN AND CONSTRUCTION PROCESSES
3.1 Material
When selecting materials for a machine, first consideration is what materials are
suitable for the product, the way the product will be made, method of construction and cost
are all vital elements. The material selected for construction of this briquette press is
medium carbon steel of 0.3% carbon which has high strength, good ductility and moderate
hardness. It has good machinability to be formed into shape and is readily available in the
market. These are properties suitable for a press material. In the design approach it is
ensured that the stress level is below the yield point (456x106N/m2) to ensure safety. My
design was done based on the following consideration and analysis.
3.2 Design Considerations
The manually operated briquetting screw press is designed to the following
specifications;
(i) Pressure to be applied should be within a range of 0.2MPa and 10MPa on the
material,
(ii) Base ram area (Ab) = 104mm x 266mm,
(iii) Torque handle for screw thread = 1000mm.
The screw briquette press is a modification of the CINVA-RAM press use for making
building blocks. It is modified to produce ten pieces of stabilized briquettes of 260mm
long, 48mm wide and 48mm thick with a vertical hole of 10mm diameter passing through
the central axis of the briquette length.

31
The basic screw press design has the power to magnify input forces to compact
materials using only a factor of the force ordinarily needed. The goal in this design is to
design an efficient briquetting screw press capable of compacting within a pressure of
0.2MPa to 10MPa. The press will be manually operated and have at least 40mm
compression stroke from the bottom and 100mm from the top. The design will be
transportable, storable and have a removable handle see drawing no.1.
3.3 Description of Parts and Functions
The Screw briquette press consists of three main parts;
(i) The main frame and the mould,
(ii) The base ram,
(iii) The connecting link mechanism and power screw.
3.3.1 The Main Frame and Mould
This main frame is made from 75mm x 10mm flat bars and 50mm x 50mm angle
bars of various length all welded together to produce a rectangular shape of dimension
620mm x 386mm x 224mm. The upper parts of the frame that form the mould is made
from a 10mm thick mild steel plate formed into a box shape.
3.3.1.1 Function
The mould has the following functions;
(i) The chamber where the compression of the material occur,
(ii) It gives the press its essence,
(iii) It affords the briquettes its basic three dimensional shape.

32
3.3.2 The Base Ram
The base ram is made of 8mm thick mild steel plate. It carries 10 rods of 10mm
diameter and 268mm length, which are used to make holes through the briquettes.
3.3.2.1 Function
The base ram plate acts as;
(i) The piston during the compression process,
(ii) It is used to eject the briquettes from the mould.
3.3.3 The Connecting Link Mechanism and Power Screw
The connecting link is made of 75mm x 12mm flat bar. It serves as a mechanism
for converting a relatively small force into heavy pressure. The power screw is a
mechanism used in transmitting force/pressure.
3.3.3.1 Function
(i) Compression: pushes the base ram plate for an upward stroke, this transmits an
enormous force which facilitates compaction of the material.
(ii) Ejection; to remove the briquette from the mould.
3.4 Design Analysis
In any compacting operation, the compression force which is the axial load (w) is
given by (Abbott, 1984)
1.3a
aa A
WP
3.4.1 The Handle
This is the mechanism through which torque is applied to turn the screw thread.
Assuming a person can apply an average of Mh(N) intermittently with the arm;
Mass of an average person (Olle and Olof, 2006) is m = 50kg.
33
2.3h
hh M
TL
3.332
.3
N
dMB uh
4.3.32
3 u
h
MNBd
Factor of safety for power screws (Robert,1992) is N = 3.
3.4.2 The Thread Shaft (Square Thread)
Figure 9: Thread Shaft
Figure 10: Single Start Thread Figure 11: Representation of onerevolution of the inclined plane
The thread shaft carries the axial load due to compression pressure and a torsional
load due to the frictional movement.
Ft
Axial Load
d2 d1
RW
Ft
Mean Conference

34
For pure compression (Patel and Panda, 1968), an estimate of screw root diameter
can be made from.
5.34
21
max N
dW u
From fig. 10,
6.32
21
dd
dm
From fig. 11,
7.3tan 1
Coefficient of friction between thread and nut for square thread screw (Robert,
1992) is µ = 0.5
erenceMeanCircmf
Leadtan
8.3tan md
L
Like all screw threads, square thread is in effect an inclined plane wrapped round a
cylinder. The effort is applied in a direction at right angles to the direction of the load.
Problems involving the square thread such as the lifting/compressing mechanism can be
calculated using the equation.
9.3tan bt WF
Torque applied to turn the screw;
10.32
mth
dFT
The maximum stress in the screw may be estimated by considering load and torque
on bear cylinder.

35
Torsional shear stress;
11.316
31
d
Th
Direct shear;
12.34
21
d
Wbn
The principal stresses are given as;
13.3421 22
2,1
nn
The maximum shear stress is given as;
14.3421 22
max n
When the screw is longer than 8 times the root diameter it must be considered as
column. Long columns are dealt with using the Euler equation.
From the Euler’s formula of critical load for slender column of uniform cross section
(Spotts, 1988)
15.32
2
s
crL
P
3.4.3 Bearings
Bearings are devices that allow part of a machine to turn smoothly. The bearings to
be used for the support are determined by the diameter of the shaft that will pass through
its bore. Friction between moving parts cannot be eliminated entirely, but it can be reduced
effectively by using some form of ball bearings. Ball bearings are mounted on both ends of
the pivot shaft to easy rotation. The bearings are placed in such a way to have very low

36
x
MxMx
contact stress and not to carry any form of load in this design. The bearings are lubricated
with grease.
3.4.3 Nut
Sufficient bearing surface must be provided between threads of screws and nuts to
prevent the bearing pressure from being too high.
16.342
1221 ddA
If H represents the height of the nut, then area available (Jegede, 1999);
17.312
tP
HAA
Load = project area x bearing pressure
18.32 bPAW
3.4.5 The Cover Plate
The cover plate covers the mould and it acts as a piston which compresses the
material in the mould.
Figure 12: Cover Plate
y
b
W
c

37
Bending of the plate takes place in one direction only i.e. x – direction as shown in
figure 12. From the equation of deflection and associated boundary conditions, minimum
thickness of required cover plate can be obtained as (Jegede 1999)
19.34
4
D
W
dx
wd b
Boundary condition
000 bxxbxx dx
dw
dx
dww
x
w
Maximum bending moment (Mmax) is given as;
20.312
5 2
max bW
M b
21.32
5
12
12
2
2
3
max
max
b
b
b
b
t
bW
t
tM
22.32
5
max
2
NbWt b
b
3.4.6 Coupling Bolt for Installation
Force to be resisted by frame foot is equal to the torsional force of the shaft which
is transformed into static load by the bearing during operation and is equal to the axial load
(w). This force will be transmitted to the number of bolts used to hold the frame rigidly in
position. Number of bolts required = 4
Force on each bolt = 23.34 bW
Let db = diameter of each bolt,
24.34
4
s
NWd b
b

38
3.5 Design Calculations
S/N Initial Data Calculations Results
1 The Handle
Lh = 1000mm = 1m
m = 50kg
Assuming a person can apply an average
force of M (N) intermittently with the arm.
M = mg
= 50 x 9.81
=490.5N
h
hh M
TL
hhh MLT
= 1 x 490.5
= 490.5Nm Th = 490.5Nm
2610456
mN
u
N = 3
The handle diameter is given by (equation
3.3)
332
u
hh
NTd
mm
m
32
02798.010456
35.490323
6
dh = 32mm
2 The Screw
a = 0.266m
c = 0.104m
Area over which pressure is applied
Aa = a × c
= 0.266m x 0.104m
= 0.027664m2 Aa = 0.028m2

39
Pmin = 0.2 x 10⁶N/m2
26 /10456 mNu
N = 3
d1 = 46mm
d2 = 48mm
Wa = PminAa
= 0.2 x 10⁶ N/m2x 0.028 m2
= 5,600N
From equation 3.5
u
a NWd
41
m3
6
10849.6
10456
356004
From calculation d'1 = 6.8mm is the minimal
screw thread root diameter required to apply
the minimal pressure of 0.2 x 10⁶N/m2 over
the design area choice of screw thread would
be larger than calculated d1 to give more
pressure for compression.
Available screw thread has d1 = 46mm, d2 =
48mm, Ls = 7mm which would be used for
compression.
Maximum axial load from available screw
thread.
From equation 3.5
N
dW u
4
21
max
Wa = 5,600N
d'1 = 7mm

40
N609,25234
10456046.0 62
From equation 3.6
2
21 dddm
mm
mmmm
472
4846
Wmax = 253,000N
dm = 47mm
µ = 0.15
L = Pt = 7mm
Th = 490.5Nm
dm = 47mm
053.8
071.2
From equation 3.7
1tan
0
1
53.8
15.0tan
From equation 3.8
md
L
tan
0474.0tan47
7tan
0
1
71.2
0474.0tan
Axial load produced by available handle is
(equation 3.10)
tan2m
bh
dWT
053.8
071.2

41
Wb = 105KN
A = 0.028m2
53.871.2tan2
047.05.490 bW
NWb 028,105
Maximum pressure which can be produced
(equation 3.1)
a
b
A
WP max
26
3
/1075.3
028.0
10105
mN
Torsional shear stress (equation 3.11)
31
16
d
Th
26
3
/1066.25
046.0
5.49016
mN
Direct stress (equation 3.12)
2
1
4
d
Wbn
26
2
3
/102.63
046.0
101054
mN
Principal stress (equation 3.13)
22
2,1 421
nnn
NWb 000,105
26max /1075.3 mNP
26 /107.25 mN
26 /102.63 mNn

42
Ls = 300mm
d1 = 46mm
77.362.632
1
46.812.6321
7.2542.632.6321
2
1
22
26262
26261
/1022.13/1050
/1013.9/1033.72
mNormN
mNormN
Maximum stress (equation 3.14)
26
22
22max
/1073.40
7.2542.6321
421
mN
n
Stress are within safe limit
Buckling load (equation 3.15)
2
2
s
crL
P
The screw is shorter than 8 times the root
diameter, so it is not considered as a column.
26
262
26
261
/1022.13
/1050
/1013.9
/1033.72
mN
ormN
mN
ormN
26max /1073.40 mN
3 The Nut
d1 = 0.046m
d2 = 0.048m
From equation 3.16 available thread area of
screw is given by
21
221 4
ddA

43
H = 30mm
Pt = 7mm
24
22
1048.1
046.0048.04
m
From equation 3.17 area of the nut is given by
tP
HAA 1
2
24
4
1034.6
7
1048.130
m
Bearing pressure on nut as given by equation
3.18
2A
WP bb
26
4
3
/1061.165
1034.6
10105
mN
Within safe limit
242 1034.6 mA
26 /1061.165 mNPb
4 Cover Plate
b = 0.124m
= 456 x 106N/m2
Wb = 105 x 103N
Thickness of cover plate (equation 3.22)
u
bb
NbWt
25 2
mm
m
15.5
1015.5
104562
3124.0101055
3
6
23
mmtb 5

44
5 Coupling Bolt
Wb = 105 x 103N
S = 380 x 106N/m2
N = 3
The diameter of the coupling bolt from
equation 3.24 is
S
NWd b
b 44
0162.0103804
31010546
3
m
mmdb 16sizeM 20

45
3.6 Construction of Machine
Construction of the briquette screw press was carried out at JODA steel
engineering works, line Zomo along Samaru road. The construction was carried out using
the available necessary equipments such as the Oxygen-acetylene gas to cut the plates that
are thicker than 4mm, drilling machine to bore holes, measuring tape to take
measurements, tri-square to check the angles, hack saw for cutting, vice for holding the
work piece, electric hand grinder for leveling cuts and welding machine with electrodes to
join the parts. And the construction was done to specification as in the drawings.
Construction details are shown on drawing numbers 1 to 44.
Table 3.1 Construction Processes
S/No. Component Material Construction Process Equipments
Used
1 Frame Mild steel angle
iron
(50mmx50mm)
Flat bar
(10mmx75mm)
It was constructed by
cutting the angle iron
and flat bar into various
sizes and joining them
together as specified in
drawing 4 to 12.
Measuring tape,
vice, hacksaw,
welding
machine,
electrodes, tri-
square and
drilling
machine.
2 Mould 10mm thick
mild steel plate
The plate was cut into
two sizes of
104mmx344mm and
Measuring tape,
tri-square, steel
ruler, Oxygen-

46
286mmx344mm and
joined together as
specified in drawings no.
13.
acetylene gas,
lighter welding
machine and
electrodes.
3 Cone Rod with
Base
8mm thick mild
steel plate.
10mm diameter
mild steel rod of
1000mm
(4pieces).
It was constructed by
cutting a 8mm plate into
a size of 104mm by
266mm and 10 holes of
10mm bore. The steel
rods were cut into
10pieces of 268mm, one
end of all the 10 pieces
were grind and they were
assembled as specified in
drawings no. 14 to 17.
Measuring tape,
tri-square, steel
ruler, Oxygen
acetylene gas,
lighter, welding
machine,
electrodes, vice,
hacksaw,
drilling
machine and
hand grinder.
4 Pressure Plate 6mm thick mild
steel plate
The plate was cut into a
size of 104mm by
266mm and 10 holes of
11mm were bored
through as specified in
drawings no. 18.
Hack saw,
measuring tape,
drilling
machine and
hand grinder.
5 Mould Cover 10mm thick
mild steel plate.
The 10mm thick plate
was cut into a size of
Vice, Oxygen-
acetylene gas,

47
6mm thick mild
steel plate.
4mm mild steel
plate.
25mm internal
diameter
galvanized pipe
of 2mm thick.
72mm internal
diameter steel
pipe of 6mm
thick.
124mm by 286mm. The
galvanized pipe was cut
into 10pieces of 100mm
lengths. The 4mm plate
was cut into 2pieces of
size 10mm by 15mm.
The 6mm plate was cut
into 10pieces of size
46mm by 46mm and
12mm holes bore
through each of them.
15mm length was cut out
of the steel pipe to house
a ball bearing. All the cut
out pieces were joined
together as specified in
drawings 19 to 25
lighter, hack
saw, tri-square,
measuring tape,
drilling
machine,
welding
machine and
electrodes.
6 Connecting
Linkage
12mm by
75mm flat bar
The flat bar was cut into
various appropriate
lengths and joined
together as specified in
drawings 26 to 29.
Hack saw, vice,
measuring tape,
welding
machine and
electrodes.
7 Base Ram 8mm thick mild The plate was cut into Measuring tape,

48
steel plate. appropriate various sizes
and joined together as
specified in drawings no
30 to 36.
tri-square,
Oxygen-
acetylene gas,
lighter, welding
machine and
electrodes
8 Mould divider 4mm thick mild
steel plate
The mild steel plate was
cut into four sizes of
104mm by 260mm and a
groove cut along their
axis up to their mid
point. A 260mm by
266mm size was also cut
and four grooves cut
through from one end of
the 266mm length up to
its mid point and the cut
plates interlocked and
joined together. as in
drawings no. 37 to 40
Hack saw,
Oxygen-
acetylene gas,
lighter,
measuring tape,
welding
machine,
electrodes and
tri-square.
9 Handle 25mm diameter
mild steel rod
The steel rod was cut
into a length of 400mm
and 0.5mm turned from
Lathe machine,
hack saw, vice
and measuring

49
one end through a length
of 300mm on the lathe
machine as specified in
drawing no. 41.
tape.
10 Pivot Shaft 25mm diameter
mild steel rod
224mm was cut out of
the mild steel length and
2holes of 5mm drilled
through close to the two
ends as in drawing no.
42.
Hack saw,
measuring tape,
vice and
drilling
machine.
11 Ejection Shaft 18.75mm
diameter mild
steel rod
A length of 244mm was
cut from the 18.75mm
diameter rod as in
drawing no. 43.
Hack saw,
measuring tape,
and vice
12 Screw Thread
Shaft
48mm outer
diameter mild
steel square
thread
From a purchased square
thread of outer diameter,
7mm pitch, thread length
of 300mm and shaft
length of 100mm a hole
of 25mm was bore
through 50mm from the
shaft end as in drawing
no. 44.
Drilling
machine

50
3.7 Pallets (Aluminum Foil)
Aluminum foils used in printing press were obtained in the size of 300mm by
500mm and cut into rectangular sizes of 146mm by 260mm with a scissors. The cut pieces
(ten in number) were folded into a U-shape at 48mm from the shorter edges along the both
longer sides see Plate IV.
Plate IV: Aluminum Foil (pallet)
3.8 Coupling of Components
The mould was placed on the frame; the edges of the mould were properly aligned
with that of the frame and weld together. The two bushings were weld to the outer surface
hole of the base ram, one on each side to avoid rocking of the ram during operation and the
cone rod base plate was weld onto the surface of the base ram and edges grind with a hand
girder. The base ram whole unit was placed into the mould by holding the rods with cane
when lifting. Two (205) ball bearing were placed to face the base ram hole, one on each
side from outside the frame with the two girders on the frame acting as railing for the
bearing. The connecting linkage was placed over the mould and frame with its holes in-line
with that of the bearings and the base ram. Holding the connecting linkage in the vertical
position the coupling shaft was passed through the holes and a 5mm concrete nail was
force fitted into the coupling shaft. The 75mm outer diameter nut which was purchased
along with the screw thread shaft was placed in the gap at the top end of the connecting

51
linkage and weld to the connecting linkage, and then the screw thread shaft was screwed
through the nut see plate V.
Plate V: Fully assembled briquetting press
3.9 Method of Operating the Briquette Press
The machine is bolted to a plank of wood 1000mm x 300mm x 250mm through the
holes on the base of the frame and raised on a floor of height 100mm and area 1000mm by
1000mm or bolted to a concrete floor prepared for the press usage.
3.9.1 Filling Mould with Material
In the vertical position, the screw thread handle is pulled back to rest the
connecting linkage against the ejecting shaft. Aluminum foils used by printing press are
cut and folded into the shape of each sections of the mould to act as pellets. The prepared
residue is filled into the mould and rammed slightly with a 18.75mm plastic pipe, making
sure that the corners are properly filled see Plate VI and VII.
Plate VI: Mould before filling Plate VII: Filling mould with prepared residue

52
3.9.2 Compression Stroke
The mould is covered and the screwed thread brought back to the vertical position
over the cover. With the handle the screwed thread is turned to align into the cover bearing
to push down the cover and pull up the base ram through the connecting linkage until full
compression is achieved, see Plate VIII and IX.
Plate VIII: Position for compression Plate IX: Inside mould after compression
3.9.3 Ejection Stroke
The screw thread is swung back over the mould to the same position as during
filling. The mould cover is removed and the screw thread is depressed further by pulling
and jerking the connecting linkage with the screw thread handle until the briquette is
completely out of the mould and connecting linkage is held in this ejection position until
the briquettes are removed from the press. The briquettes are separated from the mould
divider with the aluminum foils acting as pallets using a flat steel plate or an old steel ruler
and dried in the sun, see Plate X to XII.
Plate X: Ejected briquettes Plate XI: Removing Briquette Plate XII: Briquettes drying in the sunfrom divider

53
3.9.4 Maintenance and Repair
The inside of the mould, pressure plate, mould divider, aluminum foils and under
surface of the cover must be kept clean after each day’s operation.
All moving parts and wearing parts (rollers, screw thread and roller guide on frame)
should be well lubricated with heavy oil or grease to insure smooth operation and
cut down on wears.
The pins which secure the pivot shaft, base ram, connecting linkage and rollers
should be replaced when broken by the largest nail available.
3.10 Briquette Production
3.10.1 Material
The materials used in the production of the briquettes include;
Rice husk
Rice straw
Saw dust
Cassava starch
Water
3.10.2 The Binder: Cassava Flour
Cassava flour is made from a tropical root crop cassava. The crop is quite robust, it
can be easily grown in infertile soil, and additionally can withstand drought and other
climatic changes. When boiled with water, cassava flour can be made into a porridge-like
food product. In its cooked state, cassava flour makes an excellent, combustible binder.
The binding by starch occurs after drying.

54
3.10.3 Preparation and Production of Briquettes from Residues
Residues of sawdust, rice husk and rice straw were used in the production of
briquettes. Dried rice straws were obtained from the field and pounded in a mortar with a
pestle then crushed with bare hands to smaller size and sieved through a 5mm sieve to
suitable, smaller and uniform size, see Plate XIII.
Plate XIII: Crushed Rice Straw
Samples of one (1) kilogram of rice husk, rice straw, saw dust, combine 0.5kg fine
sawdust and 0.5kg rice husk were, each, measured into separate bowls and labeled A,B,C
and D respectively. In a bowl, 0.5litre of cold water was combined to 0.25kg of cassava
flour and mixed in a pot of 2.5litre of boiling water. When the water was boiling, the
cassava flour with water mixture, was gradually stirred in. The temperature of the stove
heating the mixture was kept constant throughout the process and the mixture continuously
stirred for 5 to 10 minutes, until it was slightly lumpy and rather viscous.
The cooked starch was poured into bowl ‘A’ containing the rice husk residue and
mixed thoroughly with bare hands, until the mixture had a thick consistency that feels
moist, but does not easily flow. Some of the mixture was formed into a ball that holds its
shape without falling apart indicating the correct amount of starch binder was added. The
same binder preparation and material mix process was carried out on samples B, C and D.
The fabricated briquetting press was used in the production of the briquettes with the
folded Aluminum foils inserted into each of the mould cavities. The mixed residue was

55
filled into the mould cavities and ram slightly with an 18.75mm PVC pipe to compress and
make sure the corners were properly filled. The mould cover was placed over the residue,
compressed, ejected and dried on a flat surface or platform in the sun.
Production and drying of the briquettes was done during the harmattan season. It
took a maximum of seven days to achieve a constant dry weight during drying. Plate XIV
to XVII shows the briquette types produced.
Plate XIV: Rice Straw Briquette Plate XV: Rice Husk Briquette
Plate XVI: 50% Saw Dust + Plate XVII: Saw Dust Briquette50% Rice Husk Briquette

56
CHAPTER FOUR
TESTS AND RESULTS
4.1 Tests
4.2 Determination of Calorific Value
The calorific value for the briquettes samples and firewood sample were
determined using a Mahler – cook bomb calorimeter in the heat transfers laboratory of
Mechanical Engineering department in Ahmadu Bello University Zaria.
4.2.1 Equipments used for the Calorific value test
(i) Mahler – cook bomb calorimeter and accessories.
(ii) Oxygen cylinder in mobile trolley with valves and pressure gauge assembly for
changing the bomb.
(iii) Special vice and spanner.
(iv) Thermometer 0 – 100oC by 0.1oC and magnifying eye piece.
(v) Stanton balance model CB3
(vi) Empty gelatin capsules
(vii) Pipette (1ml)
(viii) Cotton thread
(ix) Stop clock
(x) Ignition fuse wire
4.2.2 Test Procedure Carried Out
a. Pieces of each of the various briquettes and of firewood were ground and sieved
through a 250μm sieve.

57
b. Five empty gelatin capsules were measured on the balance then various samples of
the sieved introduced into the lower half of the capsules and covered immediately
and weighed.
c. The bomb calorimeter interior was cleared before starting and 1ml of distilled water
pipetted into the bomb.
d. The gelatin capsule with the sample was uncovered.
e. A length of 6cm fuse wire was folded into two and the folded end placed into the
capsule, then re-covered back with the two wire ends outside the capsule.
f. The two wire ends were connected across the terminals of the bomb along with
some cotton thread and the capsule set into the crucible.
g. The bomb was carefully closed using the special vise and spanner, then connected
to the oxygen bottle and charged with oxygen carefully up to 25 to 30 atms.
h. 2900gms of water at temperature 3oC below room temperature was added to the
calorimeter vessel and the bomb submerged into it, without the electrical terminals
in it. The bomb was carefully put in place, the electrical connections made and
checked to ensure no oxygen leakage.
i. The thermometer and stirrer were arranged so that they do not touch the bomb or
the vessel then the stirrer switched on.
j. When the temperature was noticed to be rising steadily and the stirrer had been
running for at least 2minutes, a series of readings at one minute interval were taken
for 5 minutes. At the end of the 5 minutes, the firing circuit was closed for two
seconds and the bomb isolated for 20 seconds.

58
k. The one minute reading was continued until the temperature passed through the
maximum and the temperature started dropping.
l. After five minutes, five temperatures drop reading were taken, the bomb was
removed, inserted in the vise and the pressure released slowly and uniformly over a
period of one minute by unscrewing the check value short distance and pressing
down.
m. The bomb was opened, observed for proper combustion, rinsed out, cleaned and
dried. This test procedure was carried out for all the various samples
The calorific value was calculated for the fuel samples as analyzed below;
Heat energy liberated by the fuel (Adegoke 1999) is given by:
Qf = MfHf - - - - - - - - - - - - - - - - - - - - - - - - - - - - - - - - - - - 4.1
Heat absorbed by water and calorimeter (Institute of Petroleum, 1960) is given as:
Qw+c = (Mw + Mθ)CwΔ= MfHf + losses - - - - - - - - - - - - - - - 4.2
The energy equation used to determine the calorific value is given below.
(Mw + Mθ)CwΔ = MfHf + McCc + MfwCfw + McapCcap - - - - - 4.3
Where;
MfHf = (Mw + Mθ)CwΔ - McCc - MfwCfw - McapCcap
The readings obtained from the bomb calorimeter test in appendix B was used to
plot graphs of temperature against time for all the fuel samples to determine the
temperature differences, in figure 13 to 17.
Sixty percent (60%) of the temperature rise for each curve, which is between the
time of ignition and the time at which the temperature rise became a maximum was
calculated and marked to cut the curves toward the maximum temperature in a vertical

59
position. Tangential lines were drawn from the curve of the temperature rise and
temperature fall to touch the 60% line drawn. From the points in which the lines met each
other horizontal lines were drawn to touch the vertical axis of the graphs and readings of
the temperatures were made to obtain the actual temperature rise from the graphs for the
fuel samples according to Gary (2002).
4.3 The Water Boiling Test (WBT)
4.3.1 Introduction
What is interesting concerning the energy content of a briquette is how much of the
energy in the briquette that can be actually be used. If the same test is performed on each
briquette and firewood, a good comparison can be made. The test is called the Water
Boiling Test and it will be used for comparing:
• The briquettes with each other
• The briquettes with firewood
The modified version of the WBT, which was developed for the Shell Household
Energy Programme based on the procedures proposed by VITA (1985) and Baldwin
(1987) was used in this work. It consists of three phases.
1) In the first phase, I began with the stove at room temperature and using a pre-weighed
bundle of wood to boil a measured quantity of water in a standard pot. I then replaced
the boiled water with a fresh pot of cold water to perform the second phase of the test.
2) In the second phase which is the high power test with hot start, water is boiled
beginning with a hot stove in order to identify differences in performance between a
stove when it is cold and when it is hot.

60
3) The third phase which is the simmering test, the second phase test is continued using a
pre-weighed bundle of wood, simmering the water at just below boiling for a measured
period of time (45 minutes).
This third step simulates the long cooking of legumes or pulses that is common.
4.3.2 Equipments used in the Boiling Water Test
Thermometer (0 – 100oC range)
Scale of 10kg capacity and 10gram accuracy
Timer (Digital stop clock)
Pot of diameter 18cm, 10cm deep and water holding capacity of 2.5kg
1.7litres of clean water for every test
Dust pan for transferring ash
Metal tray to hold ash for weighing
Heat resistant gloves
Air dried fuel samples
4.3.3 Variables
4.3.3.1 Fuel Samples
Fuel samples of similar size of average dimension 260mm x 50mm x 50mm were
used for the test in order to minimize variation due to fuel differences. This size is in
accordance to Olle and Olof (2006) who states that: the type and size of fuelwood can
affect the outcome of the stove performance tests. In order to minimize the variation that is
potentially introduced by variations in fuel characteristics VITA (1985) recommends
taking the following precautions:

61
Use only wood that has been thoroughly air-dried. Drying is accelerated by
ensuring wood is stored in a way that allows air to circulate through it.
Different sizes of wood have different burning characteristics. While stove
users may not have the ability to optimize fuel size, use only similar sizes of
wood to minimize this source of variation throughout the world.
The central hole in the briquettes helps the air to pass through, which makes the
combustion much more efficient. The wood species used for this experiment as firewood
was Parkia biglobosa.
4.3.3.2 Stove
For this test the 3-stone open fire which is the most widely used within most homes
was used. The stove consists of three stones placed on the ground, forming at the edges a
triangle, which holds the pot 14cm above the ground. Underneath the pot fuel wood is
pushed in from different angles.
4.3.3.3 Pot
Aluminum pot of 300g, weight, 18cm diameter, and 10cm depth of capacity 2.5kg
was used for the test. Before the test, the pot was scrubbed clean, both inside and outside.
It was dried before each test.
4.3.3.4 Lid
The water boiling tests were conducted without a lid. This was in accordance with
Baldwin (1987) who states that lid should not be used for the WBT because it does not
affect the transfer of heat from the stove to the pot and it has little impact on the result of
the test.

62
4.3.3.5 Power Control
Due to the lack of adequate turn - down ability of the 3-stone stove to maintain a
desired temperature without the fire going out, the minimum amount of fuel sample
necessary to keep the fire from dying completely was used in all the test.
4.3.3.6 Environment
I carried out the test during the harmattan period of the year indoor.
4.4 Experimental Phases Process
4.4.1 Phase 1: High Power (Cold start)
a. The timer was prepared, but not started until the fire was started.
b. The empty pot was placed on the scale and water was filled into the pot 32 full to
give the total weight of the pot and water together as 2kg. The weight of the pot
with the water was recorded.
c. A thermometer was placed into the pot to take the initial water temperature and
recorded.
d. Pre-measured recorded fuel sample was placed in the stove and fire was started
using kerosene as the starting material.
e. As the fire was started the pot containing the water was placed on the stove.. The
timer was started and readings of the water temperature were taken at two and half
minutes intervals.
f. The fire was controlled by means of bringing the water in the pot rapidly to boil
without waste of the fuel used.
g. When the water in the pot reached the boiling temperature as shown by the
thermometer, rapidly the following were done:

63
(i) The time the water in the pot reached the local boiling point was recorded
along with the temperature.
(ii) All fuel sample were removed from the stove and the flames extinguished
by blowing the ends and knocking all loose ash off the ends of the fuel into
the container for collecting the ash for weighing.
(iii) The unburnt fuel, removed from the stove was weighed and the weight
recorded.
(iv) The pot with hot water was weighed and the weight recorded.
(v) The ash from the stove was extracted and weighed with the ash knocked off
the fuel and the weight recorded.
The second phase of the test, high power (hot start) was continued within 10 minutes after
the completion of the first test high power (cold start) on the same stove.
4.4.2 Phase 2: High Power (Hot start)
a. The timer was reset, but not started until the fire was started.
b. The pot was refilled with 1.7kg of fresh cold water which was 32 full of the pot to
give a total weight of the pot and water together as 2kg. The weight of the pot with
water and water’s initial temperature were recorded.
c. The fire was rekindled using kerosene.
d. As the fire was started the pot was placed on the stove with the water. The timer
was started and readings of the temperature were taken at every two and half
minute intervals.
e. When the boiling temperature was reached, the following were done rapidly:

64
(i) The unburnt fuels were removed from the fire and the loose ash knocked
into the stove. The unburnt fuels were weighed and returned into the stove
immediately. The weight was recorded.
(ii) The water temperature was taken and recorded.
(iii) The pot with the water was weighed and returned on the stove and the
weight recorded.
4.4.3 Phase 3: Low Power (Simmering)
The hot start high power test was continued with the flame reduced and the water
simmered for additional 45minutes at a temperature between 3oC – 4oC below the boiling
temperature using minimal amount of fuel. When the 45minutes was reached, the
following were done rapidly:
a. All fuel sample were removed from the stove and the flame extinguished by
blowing on the ends and knocking all loose ash off the ends of the fuel into the
container for collecting the ash for weighing.
b. The un-burnt fuel, removed from the stove was weighed and the weight recorded.
c. The pot with water was weighed and the weight recorded.
d. The ash from the stove was extracted and weighed with the ash knocked off the
fuel and the weight recorded.
4.5 Analysis
4.5.1 Definition of terms
fm = fi – ff - - - - - - - - - - - - - - - - - - - - - - - - - - 4.4
fd = fi – ff - ΔC - - - - - - - - - - - - - - - - - - - - - - - 4.5
Wv = Pi – Pf - - - - - - - - - - - - - - - - - - - - - - - - 4.6

65
Wr = Pf - Pe - - - - - - - - - - - - - - - - - - - - - - - - 4.7
Δ = tf - ti - - - - - - - - - - - - - - - - - - - - - - - - - 4.8
ΔT = Tf - Ti - - - - - - - - - - - - - - - - - - - - - - - - 4.9
The fuel sample outputs to be analyzed include:
-Thermal efficiency: This is the ratio of the work done by heating and evaporating water
to the energy of the fuel consumed. This is given by (Prasad et al, 1983)
fm
fiLifeiwp
Hf
ppHTTppC
)()()(. - - - - - - - - 4.10
Rb - Burning Rate: This is a measure of the rate of wood consumption while bringing the
water to a boil. It is calculated by dividing the equivalent dry wood consumed by the time
of the test.
if
mb tt
fR
- - - - - - - - - - - - - - - - - - - - - - - - - - - - - - 4.11
SC- Specific fuel consumption: This is a measure of the amount of wood required to
produce one gram of boiling water or maintain one gram of boiling water within 3oC of the
boiling point.
ef
d
pp
fSC
- - - - - - - - - - - - - - - - - - - - - - - - - - - - - 4.12
4.5.2 Statistical Analysis
The statistical tool used for the analysis of this work is the analysis of variance
based on the two way classification method with the t -distribution and F-distribution table
at 5% and 1% significance level in appendix O, P and Q respectively. This statistical tool
was used to compare the briquette samples thermal efficiency, burning rate and boiling

66
time with that of firewood and among themselves in order to determine whether there is
any significant difference in their average performance values.
4.5.3 Analysis of Variance (ANOVA)
The total variation is partitioned into two sources of variation-treatment and
experimental error variation. The relative size of the two variations is used to indicate
whether the observed difference among experimental values is significant or due to chance.
The observed difference is said to be significant if the treatment variation is
sufficiently higher than the experimental error variation (Rao et al, 1966).
The ANOVA table is a useful means of analysis of variance. Table 4.1 below
shows a format of the ANOVA table.
Table 4.1: The ANOVA table
Source of variation D.F S.S M.S F
Treatment (fuel sample) k – 1 SStt
t MSk
SS
)1( MS
MSt
Error (r - 1)k SSε
MSkr
SS
)1(
Total kr-1 SST
The treatment mean squares MSt and the error mean square MSε each gives an
independent unbiased estimate of the population variance. This is true only if the means
are equal i.e. if the null hypothesis is true. But if the null hypothesis is false, the treatment
mean square will be larger than the error mean square. This ratio of treatment mean square
to error mean square, enable one to determine if there are differences between the

67
treatments (fuel samples). Thus, by comparing the computed F-value, to the tabled F-
value, I can reject or accept the null hypothesis at a given significant level.
If the calculated F-value in the ANOVA table is greater than the critical value from
the F-table, the null hypothesis of equal means is rejected at a given significant level.
Otherwise, I fail to reject.
Once the null hypothesis is rejected, it becomes necessary to compare means using
any of the following methods: Least Significant Difference (LSD) and Duncan’s multiple
range test.
Least Significant Difference (LSD) was used in this experiment. It is defined by
n
MStLSD 2
- - - - - - - - - - - - - - - - - - - - - - - 4.13
A comparison is made between any two means and the LSD value. If it is larger,
then the means are significantly different at a given significant level.
The preliminary data and calculations obtained from the evaluation of the fuel
samples during the Water Boiling Test are given in appendix D to N and table 4.2 to 4.8
respectively.
4.6 Calorific value of fuel samples
Using equation 4.3 with the data obtained from the bomb calorimeter test given in
appendix A and temperature rise values obtained from figure 13 to 17 the calorific values
of the fuel samples were estimated and summarized in table 4.2, using the procedure in
appendix C. These values were used to evaluate the performance parameters of the fuel
samples in terms of efficiency, burning rate and specific fuel consumption and represented
with bar charts in appendix S.

68
4.6.1 Average Thermal Efficiency for Fuel Samples
The average thermal efficiencies of the various fuel samples were estimated using
equation 4.10 with data obtained from the WBT in appendix I to N, for high power (cold
start), high power (hot start) and low power (simmering) which can be seen in table 4.3.
Analysis of variance (ANOVA) for the average thermal efficiencies distribution of
the fuel samples are shown in table 4.4. Comparison of the average thermal efficiencies of
each the briquettes with the least square difference value (0.3) computed in table 4.4,
showed that rice husk briquette (22.42%) with the highest thermal efficiency was
significantly different from rice straw briquette (10.68%) and firewood (12.29%). This
difference was highly significant at P = 0.01. However, this difference there was not
significant from sawdust briquette (15.40%) and 50% rice husk + 50% saw dust briquette
(18.52%), because the difference between the average thermal efficiencies of the briquettes
was less than the least square difference value. Also, 50% rice husk + 50% saw dust
briquette (18.52%) showed that there was significant difference from rice straw briquette
(10.68%) and fire wood (12.29%). This difference was significant at P = 0.5.
4.6.2 Average Burning Rate for fuel samples.
The average burning rates values for all five fuel samples at high power (cold start),
high power (hot start) and low power (simmering) and their means are shown in table 4.5.
The analysis of variance (ANOVA) for the average burning rate of the fuel samples
is shown in table 4.6.Comparison of the performance between the average burning rate of
the briquettes with the least square difference value (0.68) computed and analyzed in table
4.6, showed that rice husk briquette (0.83kg/hr) with the lowest burning rate was
significantly different from fire wood (1.62kg/hr). This difference was significant at P =

69
0.05. However, not significantly different from 50% rice husk + 50% sawdust briquette
(0.93kg/hr), sawdust briquette (1.03kg/hr) and rice straw briquette (1.10kg/hr). Since, the
differences between the average burning rate of the briquettes were less than the least
square difference value.
4.6.3 Average Specific Consumption for Fuel samples
The average specific fuel consumption for all five fuel samples at high power (cold
start), high power (hot start) and low power (simmering) and their means are shown in
table 4.7.
The analysis of variance (ANOVA) for the average specific fuel consumption of
the fuel samples is shown in table 4.8. Comparison of the performance between the
average specific fuel consumption of the briquettes with the least square difference value
(0.21) computed and analyzed in table 4.8 showed that rice husk briquette (0.13g/g) with
the lowest specific fuel consumption was significantly different from fire wood (0.36g/g).
This difference was significant at P = 0.05. However, not significantly different from 50%
rice husk + 50% sawdust briquette (0.16g/g), sawdust briquette (0.26g/g) and rice straw
briquette (0.30g/g). Since, the differences between the average burning rates of the
briquettes were less than the least square difference value.
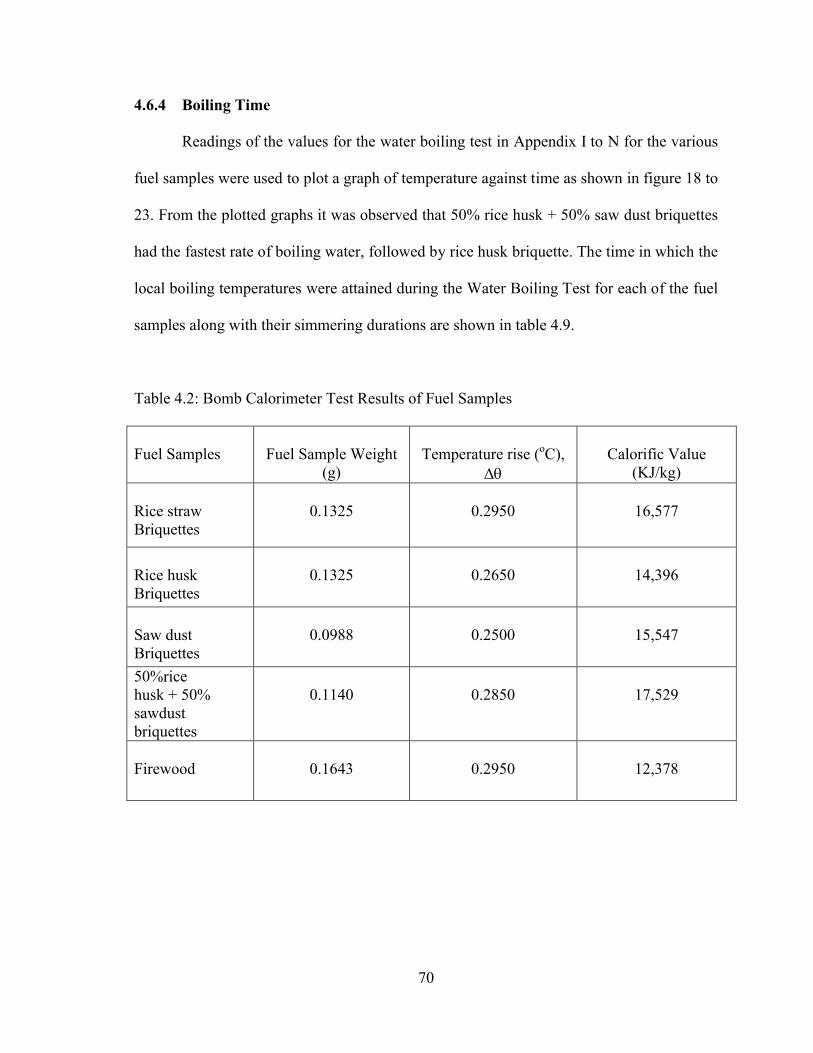
70
4.6.4 Boiling Time
Readings of the values for the water boiling test in Appendix I to N for the various
fuel samples were used to plot a graph of temperature against time as shown in figure 18 to
23. From the plotted graphs it was observed that 50% rice husk + 50% saw dust briquettes
had the fastest rate of boiling water, followed by rice husk briquette. The time in which the
local boiling temperatures were attained during the Water Boiling Test for each of the fuel
samples along with their simmering durations are shown in table 4.9.
Table 4.2: Bomb Calorimeter Test Results of Fuel Samples
Fuel Samples Fuel Sample Weight (g)
Temperature rise (oC), Δ
Calorific Value (KJ/kg)
Rice strawBriquettes
0.1325 0.2950 16,577
Rice huskBriquettes
0.1325 0.2650 14,396
Saw dustBriquettes
0.0988 0.2500 15,547
50%ricehusk + 50% sawdust briquettes
0.1140 0.2850 17,529
Firewood 0.1643 0.2950 12,378

71
Table 4.3: Average Values of Thermal efficiency of Fuel Samples
Fuel samples High power (cold)
High power (hot)
Low power(simmering)
Total Mean
Rice straw briquettes % 11.33 10.43 10.27 32.03 10.68
Rice Husk briquettes % 24.60 25.39 17.26 67.25 22.42
Saw dust briquettes % 16.91 15.39 13.90 46.20 15.40
50% rice husk + 50% saw dust briquettes %
20.92 21.06 13.59 55.57 18.52
Firewood % 11.70 13.10 12.07 36.87 12.29
Table 4.4: Analysis of variance for thermal efficiency of fuel samples
Source D.F S.S M.S F F(0.05) F(0.01) LSD(0.05) LSD(0.01)
Fuel sample
4 320.23 80.06 5.29 3.48 5.99 0.21 0.30
Error 10 151.42 15.14
Total 14 471.65

72
Table 4.5: Average Values of Burning Rate of Fuel Samples.
Fuel samples High power (cold)
High power (hot)
Low power(simmering)
Total Mean
Rice straw briquettes(kg/hr)
1.07 1.39 0.85 3.31 1.10
Rice Husk briquettes(kg/hr)
0.90 1.00 0.58 2.48 0.83
Saw dust briquettes(kg/hr)
1.15 1.26 0.69 3.10 1.03
50% rice husk + 50%saw dust briquettes
(kg/hr)
1.23 0.96 0.60 2.79 0.93
Firewood (kg/hr) 2.16 1.75 0.95 4.86 1.62
Table 4.6: Analysis of Variance for Burning Rate of Fuel Samples
Source D.F S.S M.S F F(0.05) F(0.01) LSD(0.05) LSD(0.01)
Fuel sample
4 1.13 0.28 2.00 3.48 5.99 0.68 0.97
Error 10 1.39 0.14
Total 14 2.52

73
Table 4.7: Average Values for Specific Fuel Consumption of Fuel Samples
Fuel samples High power (cold)
High power (hot)
Low power(simmering)
Total Mean
Rice straw briquettes (g/g) 0.23 0.25 0.41 0.89 0.30
Rice Husk briquettes (g/g) 0.09 0.08 0.22 0.39 0.13
Saw dust briquettes (g/g) 0.18 0.20 0.41 0.79 0.2650% rice husk + 50% saw dust briquettes (g/g) 0.11 0.06 0.31 0.48 0.16
Firewood (g/g) 0.26 0.29 0.52 1.07 0.36
Table 4.8: Analysis of Variance for Specific Fuel Consumption of Fuel Samples
Source D.F S.S M.S F F(0.05) F(0.01) LSD(0.05) LSD(0.01)
Fuel sample
4 0.11 0.03 2.14 3.48 5.99 0.21 0.30
Error 10 0.14 0.014
Total 14 0.25
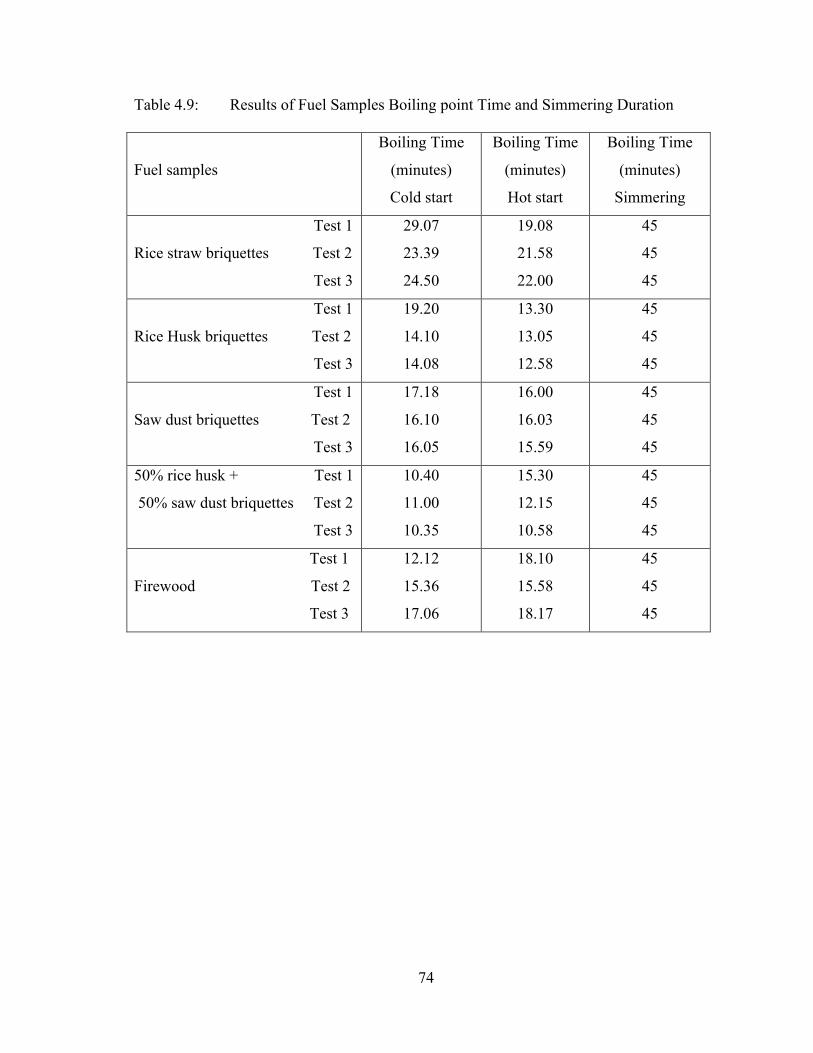
74
Table 4.9: Results of Fuel Samples Boiling point Time and Simmering Duration
Fuel samples
Boiling Time
(minutes)
Cold start
Boiling Time
(minutes)
Hot start
Boiling Time
(minutes)
Simmering
Test 1
Rice straw briquettes Test 2
Test 3
29.07
23.39
24.50
19.08
21.58
22.00
45
45
45
Test 1
Rice Husk briquettes Test 2
Test 3
19.20
14.10
14.08
13.30
13.05
12.58
45
45
45
Test 1
Saw dust briquettes Test 2
Test 3
17.18
16.10
16.05
16.00
16.03
15.59
45
45
45
50% rice husk + Test 1
50% saw dust briquettes Test 2
Test 3
10.40
11.00
10.35
15.30
12.15
10.58
45
45
45
Test 1
Firewood Test 2
Test 3
12.12
15.36
17.06
18.10
15.58
18.17
45
45
45

75
CHAPTER FIVE
DISCUSSION OF RESULTS
5.1 Introduction
The briquette screw press performs the function for which it was designed. It works
based on the principle of the Cinva ram machine to compress residues into briquette form.
When the machine was tested to produce briquettes it produced satisfactory briquettes. The
products were tested to determine their performance. The overall conclusion can be shown
that briquettes can be used as alternative fuel to firewood.
5.2 Performance of the Briquetting Screw Press
The designed screw briquetting press performed well in compacting of the selected
residue samples into the desired shapes. It was discovered that the aluminum foils which
act as pallets for the briquettes could be used for up to a week before they are due for a
change. But if the constructed mould and cover dimensions are not in conformity with the
drawing details it would cause constant damages to the aluminum foils, which would call
for replacement frequently and add to the cost of briquette production. With two workers
an average of 240 to 320 briquettes can be produced a day (eight working hours) if
proper/careful removal of the briquettes are done to reduce the number of briquettes
damaged by crumbling.
In a study involving experimental production of briquettes from chopped rattan
strands mixed with cassava starch paste Olorunnisola (2004), obtained a minimum
proportion of 200% by weight of cassava starch for briquette formulation using a simple
table top close - end die piston press. Whereas, in this research, for every one kilogram of

76
each residue a minimum proportion of 30% cassava starch was required for satisfactory
binding of the briquettes using the designed briquetting press.
5.3 Performance of Fuel Samples
5.3.1 Rice Straw Briquettes
Briquetting the prepared rice straw residue into the required shape took 20minutes
for one compression, ejection to removal cycle. Separating the briquettes from the mould
and pallet while wet was easy. The shape was retained without crumbling, cracks and
breakages. Less starch binder was used in comparison with other residues.
The calorific value 16,577KJ/kg from the bomb calorimeter test performed on the
rice straw briquette was found to be 8.3% higher than its residue value 15,300KJ/kg given
by Barnard (1985) in table 2.2. It was observed that there was significant drop in the
average thermal efficiency of the rice straw briquette (10.68%) when compared to
firewood (12.29%), the average burning rate of the rice straw (1.10kg/hr) with specific fuel
consumption (0.30g/g) was discovered to be lower than that of firewood average burning
rate (1.62kg/hr) with specific fuel consumption (0.36g/g). But it was discovered from the
ANOVA table that it had no significance compared to firewood.
The rice straw briquette burnt slowly with whitish smoke producing high ash
quantity.
From the Water Boiling Test plot of temperature versus time in figures 19 to 24 it
was observed that the rice straw briquettes took the longest time to boil the measured
quantity of water to its local boiling point.

77
5.3.2 Rice Husk Briquettes
Briquetting the prepared rice husk material into shape took an average of
25minutes for the production cycle process. During the production there was little
difficulty in the separation of the briquettes from the divider. A lot of care had to be taken
to remove the briquettes for drying because in the process some broke, some crumbled at
the edges and some developed cracks while, those that were not affected came out perfect.
The briquettes had to be left to dry on the pallets for two hours before they could be turned
over for the pallets to be removed, unlike that of the rice straw which came off
immediately after separation from the divider.
The calorific value of 14,396KJ/kg obtained for the rice husk briquette from the
bomb calorimeter test was found to be 0.4% less than mean calorific value obtained by
Krist and Wentink (1985) as 14,450KJ/kg in table 2.2.
From the water boiling test, result of the average thermal efficiency of 22.42% with
a burning rate of 0.83kg/hr and specific fuel consumption of 0.13g/g for the rice husk
briquette showed that it had a better performance than that of firewood of average thermal
efficiency of 12.29% with a burning rate of 1.62kg/hr and specific fuel consumption of
0.36g/g. The ANOVA result showed the rice husk briquette to be significant in replace of
firewood. The water boiling time observed between 13 to 16minutes was in the same range
with what was obtained by Inegbenebor (2002) as 14 to 22minutes. The burning of the
briquette was rapid and steady with little white smoke.
From the Water Boiling Test the plot of temperature versus time in figures 19 to 24
showed that the rice husk briquettes had the second fastest rate of bringing the measured
quantity of water to its local boiling point obtained as 96�C.

78
5.3.3 Saw Dust Briquettes
Briquetting the prepared saw dust material into shape took an average of
25minutes for the production cycle process. During the production there was little
difficulty in the separation of the briquettes from the divider. A lot of care had to be taken
to remove the briquettes for drying because in the process some got broken, some
crumbled at the edges and some developed cracks while, those that were not affected came
out perfect. The briquettes had to be left to dry on the pallets for two hours before they
could be turned over for the pallets to be removed.
The calorific value of 15,547KJ/kg obtained from the bomb calorimeter test with an
average thermal efficiency of 15.40%, burning rate of 1.03kg/hr and specific fuel
consumption of 0.26g/g for the saw dust briquette from the water boiling test showed that
it had a better performance than that of firewood of average thermal efficiency of 12.29%
with a burning rate of 1.62kg/hr and specific fuel consumption of 0.36g/g. But from the
ANOVA result it was discovered not to be significant in comparison to firewood. The
water boiling time observed between 15 to 17minutes was in agreement with what was
obtained by Inegbenebor (2002) as 14 to 22minutes. The burning of the briquette was very
rapid and steady with little white smoke and it produced red hot charcoal.
From the Water Boiling Test the plot of temperature versus time in figures 19 to 24
showed that the saw dust briquettes takes a longer time to boil the same quantity of water
when compared to Rice straw, 50% Rice husk + 50%Saw dust briquettes and firewood.

79
5.3.4 50% Rice Husk + 50%Saw Dust Briquettes
Briquetting of the prepared mixture into shape was quite easy and it took an
average of 20minutes for the production cycle process. In the separation of the briquettes
from the divider the cracks, crumbling and breakages were less.
The calorific value of 17,529KJ/kg obtained was the highest of the samples. From
the water boiling test result of the average thermal efficiency of 18.52% with a burning rate
of 0.93kg/hr and specific fuel consumption of 0.16g/g for the briquette showed that it had a
better performance than that of firewood of average thermal efficiency of 12.29% with a
burning rate of 1.62kg/hr and specific fuel consumption of 0.36g/g. From the ANOVA
result it was discovered to be significant to replace firewood. The water boiling time
observed between 10 to 13minutes was not in range with what was obtained by
Inegbenebor (2002) as 14 to 22minutes. The burning of the briquette was rapid, steady
with very little white smoke and it produced red hot charcoal.
From the Water Boiling Test the plot of temperature versus time in figures 19 to 24
showed that 50% Rice husk + 50%Saw dust briquettes had the fastest rate of bringing the
measured quantity of water to a local boiling point as compared to the other fuel samples.
Charts summarizing the fuel samples performance parameters can be seen in
Appendix S.

80
Table 5.1 Bill of Quantity
S/N o Material Dimensions (mm) Quantity Cost =N=
1 10mm Plate 820x580 1 3000.00
2 8mm Plate 530x390 1 1500.00
3 6mm Plate 260x210 1 600.00
4 4mm Plate 800x260 1 1500.00
5 1m, 1” Galvanized pipe 1000 length 1 500.00
6 1m, 10mm rod 1000 length 5 800.00
7 Printing Aluminum Foil 300x500 5 50.00
8 10mm Flat bar 3500 length 1 3000.00
9 2”x2” Flat bar 3500 length 1 3000
10 3m, 12mm Flat bar 2,150 length 1 3500.00
11 Power Screw 300 length 1 600.00
12 Three Quarter Shaft 224 length 1 80.00
13 1” Shaft 624 length 1 250.00
14 205 Bearing 2 100.00
15 207 Bearing 1 50.00
16 Workmanship +
Painting
15,000.00
17 Total Cost 33,280

81
CHAPTER SIX
Summary, Conclusion and Recommendation
6.1 Summary
This research into briquette production for rural communities is a broad and
challenging task. This research sought to design a local low cost briquetting press to
produce briquettes with selected residues and determine their performance. The variation
in the briquette performance was investigated.
The popular known CINVA-RAM press use in making earth ram bricks was
considered and modified to a suitable briquette machine press. Briquettes were produced
from rice husk, rice straw, saw dust and combination of saw dust and rice straw using
starch as binder. Calorific values of the produced briquettes were determined using the
bomb calorimeter and their performance was determined using the Water Boiling Test
(WBT). For the WBT three tests were carried out on each of the four types of briquette and
firewood using the open three stone stove. The test consisted of three phases i.e. high
power (cold start), high power (hot start) and low power (simmering) as recommended by
VITA (1985) and Baldwin (1987) to cater for variabilities.
Readings of the tests were taken down and analyzed to determine thermal
efficiency, burning rate and specific fuel consumption of the briquettes compared to
firewood under the same test. These readings were analyzed statistically using Analysis of
Variance (ANOVA) and Least Significant Difference (LSD) to determine their
significance compared to firewood and performance compared to each other. These results
were discussed.
82
6.2 Conclusion
The set goal: design and construction of a briquetting machine was achieved, it was
not without limitation. Separation of the briquettes from the divider after compression was
not straight forward as expected, it had to be done with care to avoid damages on the
briquettes. The high cost of the parts and workmanship was due to the machine, been a
project, a lot of materials were wasted and great attention had to be given to the
construction to get it working and achieve its aim. The briquetting machine could go for
half the cost in producing it; sixteen thousand six hundred and forty naira only
(=N=16,640) if commercialized. In spite of it’s limitation, in separating the briquettes from
the mould, it is imperative that what has been achieved so far out weighs most existing
design of this kind, because it offers production of more briquettes within the same time
with others which produce one briquette at a time.
Among the briquette types produced rice husk briquette proved to be the most
outstanding. It had the highest average thermal efficiency (22.42%), the lowest average
burning rate (0.83kg/hr) and the lowest average specific fuel consumption (0.13g/g), which
was significantly better than that of firewood in the three stone open fire stove.
The cost of the machine is within the reach of a lot of families in the rural
communities and if commercialized the cost could go for far less the price of production in
this project. This machines design if set in production can be used to address the issue of
deforestation in the country and provide jobs to youths in the communities.

83
6.4 Recommendation
The following recommendations are suggested:
1) Designing a more effective way of removing the briquettes from the mould
instead of using the aluminum foils as pallets.
2) The height of mould should be reduced to produce more stabilized briquettes.
3) Performance of these residue briquettes produced from these press should be
tested on other popular stoves such as the metal stoves and clay stoves.
4) A mixture of combined rice straw and other residues should be formed into
briquette and investigate if it could have improved performance.
5) An alternative cheaper binder which will produce finer output briquettes should
be source for.

84
REFERENCES:
Abbot, A.I. (1984). Ordinary Level physics. 4th edition. London, PP. 95 – 97.
Adegbulugbe, (1994). Bioenergy for Development – Technical and EnvironmentalDimensions. FOA Environmental and Energy Series No 13.
Adegoke, C.O. (1999). A Preliminary Investigation of Sawdust as High Grade Solid Fuel. Nigerian Journal of Renewable Energy. Vol. 9. Pp. 103
Adegoke, C.O. (2001). Waste to Waste; Sawdust Briquettes as Case Study. PaperPresented at the Mechanical Division of Nigerian Society of EngineersConference. Ibadan
Akinbami, J.F.K. (2001). Renewable Energy Resources and Technologies in Nigeria:Present Situation, Future Prospects and Policy Framework. Migration andAdaptation Strategies for Global Changes 6: pp. 155 – 181.
Baldwin, S.F. (1987). Biomass Stoves. Engineering Design Development and Dissemination, Volunteers in Technical Assistance (VITA) Arlington.
Barnard, C. (1985). The use of Agricultural Residues as Fuel. AMBIO; XIV: 4 – 5.
Bello, A.W. (2005), Processing of Agricultural Residues into Briquettes as Fuel forCooking Purposes. BSc Project. Department of Agricultural Engineering.Ahmadu Bello University. Zaria.
Bhattacharya, S.C. et al. (1984). Densification of Biomass Residues in Asia. Bioenergy 84,Volume III. Elsevier Applied Science Publishers.
Centre for Environment and Development in Africa, (1997) CEDA. Coastal Profile ofNigeria.
Davis, M. C. (1985). Understanding briquetting. Technical paper, No. 31. Published by Volunteers in Technical Assistance (VITA). ISBN: 0-86619-233-6 Virginia USA.
Dixon, R. M. (1985). Ruminant Feeding Systems Utilizing Fibrous Agricultural Residues.International Development Program of Australian Universities and Colleges.Australia.
Elizabeth, M., Schulte, B., and Smallegange, L. (1999). Energy Efficiency of Small andMedium Scale Enterprise. Intermediate Technology Publications in Associationwith the United Nations Development Fund for Women (UNIFEM) andTOOLConsult. The Netherlands.
Energy Commission of Nigeria, ECN, (2005). Energy master plan; Executive summary.

85
Energy Commission of Nigeria and United Nations Development Programme. (2005).Renewable Energy Master Plan. Final Draft Report, Energy Commission ofNigeria ECN & UNDP. November 2005
Eriksson, S. and Prior, M. (1990). The briquetting of Agricultural wastes for fuel. FAO.Rome. Italy.
European Biomass Industry Association, (2000). EUBIA newsletter, FAO CorporateDocument Repository.
FAO. (1992). Food and Agriculture Organization year book.
Fernando, M. (2002). “Binding Machines” (alternatives).www.crest.org/discussion/stoves/200210/msg00082.html
Forest Products Research and Development Institute. (2002) Sawdust Carbonizer andManual Briquettor. Department of Science and Technology. Forest products Technoflow Series. FPRDI publication. Series 2.www.community.uplb.edu.ph/fprdi/publications/techflow/tf2briquettor.htm
Gary, D. and Rajiva, D. (2001). Particle Board and Medium Density Fiberboard. GreenSeal. Choose Green Report. USA.
Gary, L.B. (2002). The Oxygen Bomb Calorimeter. University of Misseuri-Rolla. USA
Government of Nigeria (1997). Introduction provided by the government of Nigeria to theUnited Nations Commission on Sustainable Development, 5th section 7 – 25 April1997. New York. United Nations Department of Policy Coordination andSustainable Development.
Grover, P.D. and Mishra. (1996). Biomass briquetting technology and practices. RegionalWood Energy Development Programme in Asia, GCP/RAS/154/NET. FAO of the United Nations.
Igbeka, J. C. and Olumeko, D. O. (1996). Village Level Grain Storage Practices in Nigeria.Agricultural Mechanization in Asia, Africa and Latin America (AMA). Vol. 27,No.1. Pg 25.
Inegbenebor, A.O. (2002), Production of Solid Fuel Briquettes from Agricultural andWood Waste (sawdust and rice husk). African Journal of Science and Technology. Vol. 3 No. 2. Pp118 – 122.
Institute of Petroleum (1960). Standards for Petroleum and its Products. Part 1. Pp.115 -127.
86
Jegede S. O. (1999). The Design and Construction of a Manual Operated Press forBlanking Operation. BSc Project. Department of Mechanical Engineering.Ahmadu Bello University. Zaria.
Kartha, S. and Leach, G. (2001). Using Modern Bioenergy to Reduce Rural poverty.Stockholm Environment Institute.
Krist, S. and Wentink. (1985). Ultimate Analysis and the Proximate Analysis of SomeTypical Briquettes.www.cookstove.net/local-resource/agriculture/-waste.html
Lardinois, I and Klundert, A. (1993). Organic Waste Options for Small – Scale ResourceRecovery. Waste Consultants. The Netherlands.
Larry, D. (1993). Biomass Energy; State of the Technology Present Obstacles and FuturePotential. A report for: United States Department of Energy Conservation andRenewable Energy Office of Energy Related Inventions.
Legacy Foundation. (2003). Fuel Briquette press kit. A construction manual.
Mac, C. D. (1985). Understanding Briquetting. Technical Paper #31. Volunteers inTechnical Assistance.
Miah, A., Huda, D. and Baqui, M. A. (1999). Rice Husk Briquette as Alternative Fuel inBangladesh. Agricultural Mechanization in Africa and Latin America (AMA). Vol. 30, No. 2. Pp 63 – 68.
Murugappa Chettiar Research Centre. (2006) MCRC. Applying Science and Technologyfor Solving Societal Problems Scheme for Committed Young Professionals.Department of Science and Technology. Annual report 2006-2007.
Olle, F. and Olof, N. (2006). Biomass Briquettes in Malawi, Degree Project, Departmentof Management and Engineering, Institute of Technology, Linkoping University,Malawi.
Olorunnisola, A.O. (2002). Assessment of some critical factors influencing BiofuelProduction Systems Research, Development and Adoption in Nigeria. AmericanSociety of Agricultural and Biological Engineers, St Joseph, Michigan.
Olorunnisola, A.O. (2004). Briquetting of rattan furniture waste. Journal of Bamboo andRattan. Brill Academic publishers. ISSN 1569-1594. Vol. 3, No. 2. pp 139-149.
Olorunnisola, A.O. (2007). Production of fuel briquettes from waste paper and coconutHusk Admixture. Agricultural Engineering International. The CIGR E journal. EE 06 006. Vol. IX.
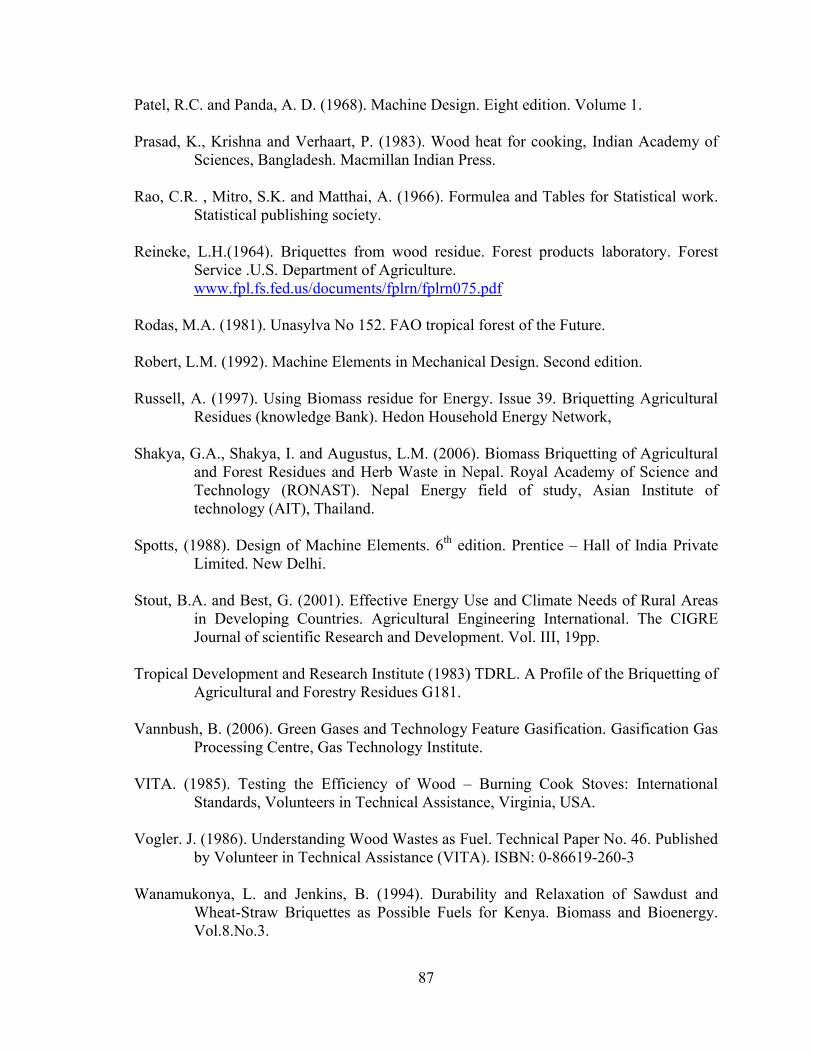
87
Patel, R.C. and Panda, A. D. (1968). Machine Design. Eight edition. Volume 1.
Prasad, K., Krishna and Verhaart, P. (1983). Wood heat for cooking, Indian Academy ofSciences, Bangladesh. Macmillan Indian Press.
Rao, C.R. , Mitro, S.K. and Matthai, A. (1966). Formulea and Tables for Statistical work.Statistical publishing society.
Reineke, L.H.(1964). Briquettes from wood residue. Forest products laboratory. ForestService .U.S. Department of Agriculture. www.fpl.fs.fed.us/documents/fplrn/fplrn075.pdf
Rodas, M.A. (1981). Unasylva No 152. FAO tropical forest of the Future.
Robert, L.M. (1992). Machine Elements in Mechanical Design. Second edition.
Russell, A. (1997). Using Biomass residue for Energy. Issue 39. Briquetting AgriculturalResidues (knowledge Bank). Hedon Household Energy Network,
Shakya, G.A., Shakya, I. and Augustus, L.M. (2006). Biomass Briquetting of Agriculturaland Forest Residues and Herb Waste in Nepal. Royal Academy of Science andTechnology (RONAST). Nepal Energy field of study, Asian Institute of technology (AIT), Thailand.
Spotts, (1988). Design of Machine Elements. 6th edition. Prentice – Hall of India PrivateLimited. New Delhi.
Stout, B.A. and Best, G. (2001). Effective Energy Use and Climate Needs of Rural Areasin Developing Countries. Agricultural Engineering International. The CIGREJournal of scientific Research and Development. Vol. III, 19pp.
Tropical Development and Research Institute (1983) TDRL. A Profile of the Briquetting ofAgricultural and Forestry Residues G181.
Vannbush, B. (2006). Green Gases and Technology Feature Gasification. Gasification GasProcessing Centre, Gas Technology Institute.
VITA. (1985). Testing the Efficiency of Wood – Burning Cook Stoves: InternationalStandards, Volunteers in Technical Assistance, Virginia, USA.
Vogler. J. (1986). Understanding Wood Wastes as Fuel. Technical Paper No. 46. Publishedby Volunteer in Technical Assistance (VITA). ISBN: 0-86619-260-3
Wanamukonya, L. and Jenkins, B. (1994). Durability and Relaxation of Sawdust andWheat-Straw Briquettes as Possible Fuels for Kenya. Biomass and Bioenergy.Vol.8.No.3.
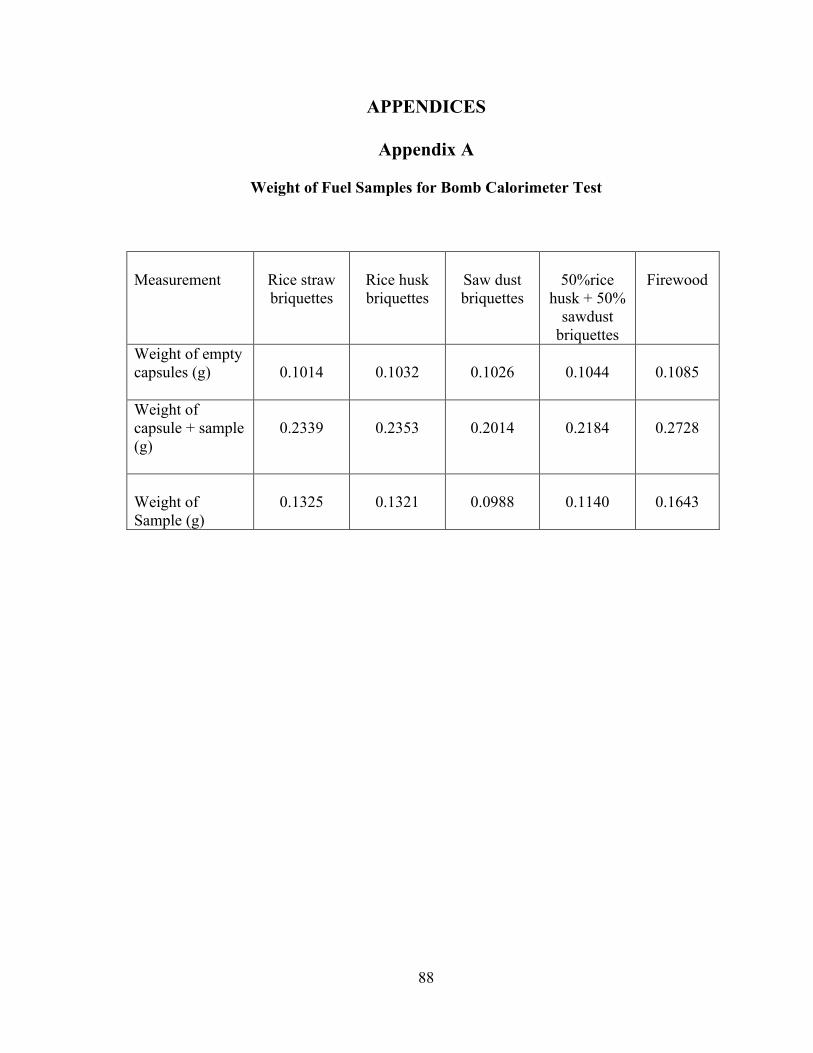
88
APPENDICES
Appendix A
Weight of Fuel Samples for Bomb Calorimeter Test
Measurement Rice strawbriquettes
Rice huskbriquettes
Saw dustbriquettes
50%ricehusk + 50%
sawdustbriquettes
Firewood
Weight of empty capsules (g) 0.1014 0.1032 0.1026 0.1044 0.1085
Weight of capsule + sample (g)
0.2339 0.2353 0.2014 0.2184 0.2728
Weight of Sample (g)
0.1325 0.1321 0.0988 0.1140 0.1643

89
Appendix B
Temperature Readings with Time of Bomb Calorimeter Test for Fuel Samples
Time (minute)
Rice Straw BriquettesTemp.(oC)
Rice Husk BriquettesTemp.(oC)
Saw Dust BriquettesTemp.(oC)
50% Saw Dust + 50% Rice HuskTemp.(oC)
FirewoodTemp.(oC)
0 2.35 2.80 1.13 1.08 1.80
1 2.36 2.80 1.13 1.10 1.84
2 2.37 2.80 1.14 1.10 1.85
3 2.38 2.80 1.14 1.11 1.87
4 2.39 2.81 1.15 1.12 1.88
5 2.40 2.81 1.15 1.13 1.90
6 2.41 2.81 1.15 1.14 1.91
7 2.50 2.91 1.25 1.14 1.91
8 2.56 2.98 1.31 1.15 2.02
9 2.60 3.00 1.34 1.16 2.08
10 2.65 3.03 1.36 1.27 2.12
11 2.66 3.04 1.37 1.35 2.15
12 2.67 3.05 1.38 1.38 2.17
13 2.68 3.05 1.39 1.39 2.18
14 2.69 3.06 1.40 1.40 2.18
15 2.70 3.06 1.40 1.42 2.18
16 2.70 3.06 1.40 1.43 2.18
17 2.70 3.06 1.40 1.45 2.18
18 2.70 3.06 1.40 1.47 2.18
19 2.69 3.06 1.40 1.47 2.18
20 2.69 3.06 1.40 1.48 2.17
21 2.68 3.05 1.39 1.50 2.17
22 2.67 3.05 1.39 1.50
23 2.67 3.04 1.50
24 2.67 3.04 1.49
25 1.48
26 1.48

90
Appendix C
Sample Calculation for Determining Calorific Value for Fuel Samples Using
Rice Straw Briquette Sample
Temperature rise, Δ for rice straw briquette from figure 13 was obtained as
0.295oC and tabulated in table 4.2.
Using the value of Δ obtained in table 4.2 and the value of the fuel sample weight
obtained in appendix A, the calorific value of the briquette sample can be calculated using
equation 4.3 as:
kgKJH
H
M
CMCMCMCMMH
f
capcapfwfwccww
/577,161325.0
)836,181014.0()2.402,10023.0()7539,10035.0(295.02.4)4752900(
)(

91
Appendix D
Water Boiling Test Values for Rice Straw Briquettes
COLD START HOT START SIMMERING
fi
0.65 0.70 0.50
0.70 0.80 0.80
0.80 0.70 0.70
ff
0.25 0.20 0.05
0.25 0.30 0.30
0.10 0.05 0.05
Pi
2 2 2
2 2 2
1.90 1.85 1.85
Pf
1.85 1.90 1.85
1.90 1.85 1.85
1.40 1.40 1.35
fm
0.40 0.50 0.45
0.45 0.50 0.50
0.60 0.65 0.65
C 0.100 0.075 0.100
0.100 0.075 0.100
0.200 0.150 0.200
fd
0.300 0.425 0.350
0.350 0.425 0.400
0.400 0.500 0.450
Ti
21.0 21.5 21.0
20.5 22.0 22.0
96 96 96
Tf
96 96 96
96 96 96
92 92 92
T
75 74.5 75
75.5 74 74
- 4 - 4 - 4
13.16 9.12 11.70
10.3 10.5 10.5
11.10 9.30 10.40
Rf
0.83 1.28 1.10
1.42 1.39 1.36
0.80 0.87 0.87
SSc
0.19 0.27 0.23
0.22 0.27 0.26
0.36 0.45 0.43

92
Appendix E
Water Boiling Test Values for Rice Husk Briquettes
COLD START HOT START SIMMERING
fi
0.70 0.65 0.60
0.70 0.65 0.60
0.70 0.65 0.60
ff
0.45 0.40 0.40
0.45 0.45 0.40
0.25 0.20 0.20
Pi
2 2 2
2 2 2
1.90 1.85 1.90
Pf
1.80 1.90 1.90
1.90 1.85 1.90
1.40 1.40 1.40
fm
0.25 0.25 0.20
0.25 0.20 0.20
0.45 0.45 0.40
C 0.10 0.10 0.10
0.10 0.10 0.10
0.20 0.20 0.20
fd
0.15 0.15 0.10
0.20 0.10 0.10
0.25 0.25 0.20
Ti
22 23 23
23 23 24
96 96 96
Tf
96 96 96
96 96 96
93 93 93
T
74 73 73
73 73 72
- 3 - 3 - 3
27.19 20.17 25.89
20.71 29.82 25.67
17.13 15.40 19.27
Rf
0.78 1.06 1.85
1.12 0.92 0.95
0.60 0.60 0.53
SSc
0.10 0.09 0.07
0.13 0.06 0.06
0.23 0.23 0.38

93
Appendix F
Water Boiling Test Values for Saw Dust Briquettes
COLD START HOT START SIMMERING
fi
0.65 0.60 0.70
0.50 0.60 0.60
0.65 0.70 0.65
ff
0.30 0.30 0.40
0.15 0.25 0.20
0.10 0.20 0.10
Pi
2 2 2
2 2 2
1.90 1.85 1.90
Pf
1.85 1.85 1.90
1.90 1.85 1.90
1.35 1.35 1.40
fm
0.35 0.30 0.30
0.35 0.35 0.30
0.55 0.50 0.55
C 0.05 0.05 0.05
0.05 0.05 0.05
0.1 0.1 0.1
fd
0.30 0.30 0.25
0.30 0.35 0.30
0.45 0.40 0.45
Ti
21 22 22
22 21 22
96 96 96
Tf
96 96 96
96 96 96
93 93 93
T 75 74 74
74 75 74
- 3 - 3 - 3
16.04 18.56 16.14
13.83 16.04 16.29
12.90 14.29 12.98
Rf
1.22 1.12 1.12
1.31 1.31 1.15
0.73 0.67 0.67
SSc
0.19 0.27 0.13
0.19 0.23 0.19
0.43 0.38 0.41

94
Appendix G
Water Boiling Test Values for 50% Saw Dust + 50% Rice Husk
COLD START HOT START SIMMERING
fi
0.60 0.40 0.40
0.45 0.50 0.45
0.50 0.60 0.60
ff
0.4 0.2 0.15
0.25 0.30 0.25
0.05 0.15 0.15
Pi
2 2 2
2 2 2
1.90 1.90 1.90
Pf
1.90 1.85 1.85
1.90 1.90 1.90
1.40 1.45 1.40
fm
0.20 0.20 0.25
0.20 0.20 0.20
0.45 0.45 0.45
C 0.05 0.05 0.05
0.05 0.05 0.05
0.10 0.10 0.10
fd
0.15 0.15 0.20
0.10 0.10 0.10
0.35 0.35 0.35
Ti
22.5 23.0 24.0
24 23 24
96 96 96
Tf
96 96 96
96 96 96
93 93 93
T 73.5 73 72
72 73 72
- 3 - 3 - 3
21.36 24.49 16.90
28.08 28.08 28.08
14.07 12.64 14.07
Rf
1.15 1.09 1.45
0.78 0.99 1.13
0.60 0.60 0.60
SSc
0.09 0.10 0.20
0.06 0.06 0.06
0.32 0.30 0.32

95
Appendix H
Water Boiling Test Values for Firewood
COLD START HOT START SIMMERING
fi
0.8 0.7 1.0
1.0 0.8 0.8
0.8 0.8 0.8
ff
0.20 0.20 0.55
0.55 0.25 0.30
0.05 0.10 0.10
Pi
2.0 2.0 2.0
2.0 2.0 2.0
1.90 1.85 1.85
Pf
1.90 1.90 1.90
1.90 1.85 1.85
1.35 1.40 1.40
fm
0.60 0.50 0.45
0.45 0.55 0.50
0.75 0.70 0.70
C 0.1 0.1 0.1
0.05 0.05 0.05
0.15 0.15 0.15
fd
0.50 0.40 0.35
0.40 0.50 0.45
0.60 0.55 0.55
Ti
22 24 25
25 25 24
96 96 96
Tf
96 96 96
96 96 96
93 93 93
T
74 72 71
71 71 72
- 3 - 3 - 3
10.1 11.9 13.1
13.1 12.4 13.8
13.2 11.5 11.5
Rf
2.97 1.95 1.58
1.49 2.12 1.65
1.00 0.93 0.93
SSc
0.31 0.25 0.22
0.25 0.32 0.29
0.57 0.39 0.39

96
Appendix I
Experimental Results of Water Boiling Test One (Cold start) for Fuel Samples
Time (min)
Rice strawBriquette Temp. (oC)
Rice huskBriquette Temp. (oC)
Saw dustBriquette Temp. (oC)
50%Saw dust + 50%Rice husk mixture Briquette Temp. (oC)
FirewoodTemp. (oC)
0 26.5 22.0 21.0 24.5 22.0
2.5 39.0 42.0 41.0 50.0 45.0
5.0 51.0 54.0 52.0 68.0 54.0
7.5 55.0 65.0 64.0 84.0 65.0
10.0 62.0 73.0 74.0 93.0 73.0
12.5 69.0 80.0 82.0 96.0 80.0
15.0 72.0 87.0 89.0 95.0 87.0
17.5 80.0 92.0 96.0 96.0 92.0
20.0 84.0 96.0 96.0
22.5 89.0
25.0 93.0
27.5 95.0
30.0 96.0

97
Appendix J
Experimental Results of Water Boiling Test 1 (Hot start) for Fuel Samples
Time (min) Rice strawBriquette Temp. (oC)
Rice huskBriquette Temp. (oC)
Saw dustBriquette Temp. (oC)
50%Saw dust + 50%Rice husk mixture Briquette Temp. (oC)
FirewoodTemp. (oC)
0 20.5 24.0 22.0 24.0 23.0
2.5 43.0 49.0 48.0 47.0 49.0
5.0 64.0 63.0 59.0 62.0 65.0
7.5 72.0 80.0 70.0 70.0 79.0
10.0 82.0 86.0 78.0 78.0 87.0
12.5 88.0 96.0 85.0 87.0 94.0
15.0 92.0 96.0 94.0 95.0 96.0
17.5 94.0 96.0 96.0
20.0 96.0

98
Appendix K
Experimental Results of Water Boiling Test 2 (Cold start) for Fuel Samples
Time (min) Rice strawBriquette Temp. (oC)
Rice huskBriquette Temp. (oC)
Saw dustBriquette Temp. (oC)
50%Saw dust + 50%Rice husk mixture Briquette Temp. (oC)
FirewoodTemp. (oC)
0 21.5 23.0 21.0 23.0 23.0
2.5 43.0 41.0 41.0 47.0 41.0
5.0 54.0 53.0 52.0 65.0 53.0
7.5 61.0 67.0 64.0 85.0 67.0
10.0 70.0 79.0 74.0 93.0 79.0
12.5 78.0 89.0 82.0 96.0 89.0
15.0 82.0 96.0 89.0 96.0
17.5 89.0 96.0
20.0 93.0
22.5 95.0
25.0 96.0

99
Appendix L
Experimental Results of Water Boiling Test 2 (Hot start) for Fuel Samples
Time (min) Rice strawBriquette Temp. (oC)
Rice huskBriquette Temp. (oC)
Saw dustBriquette Temp. (oC)
50%Saw dust + 50%Rice husk mixture Briquette Temp. (oC)
FirewoodTemp. (oC)
0 23.0 24.0 21.0 23.0 23.0
2.5 40.0 47.0 45.0 45.0 47.0
5.0 59.0 63.0 60.0 67.0 63.0
7.5 70.0 79.0 71.0 86.0 79.0
10.0 78.0 85.0 77.0 91.0 85.0
12.5 83.0 93.0 87.0 96.0 93.0
15.0 87.0 96.0 93.0 96.0
17.5 93.0 96.0
20.0 95.0
22.5 96.0

100
Appendix M
Experimental Results of Water Boiling Test 3 (Cold start) for Fuel Samples
Time (min)
Rice strawBriquette Temp. (oC)
Rice huskBriquette Temp. (oC)
Saw dustBriquette Temp. (oC)
50%Saw dust + 50%Rice husk mixture Briquette Temp. (oC)
FirewoodTemp. (oC)
0 21.0 23.0 22.0 24.0 23.0
2.5 38.0 44.0 43.0 49.0 44.0
5.0 49.0 56.0 57.0 68.0 56.0
7.5 58.0 69.0 66.0 85.0 69.0
10.0 69.0 80.0 75.0 94.0 80.0
12.5 74.0 90.0 86.0 96.0 90.0
15.0 80.0 96.0 91.0 96.0
17.5 89.0 96.0
20.0 93.0
22.5 95.0
25.0 96.0

101
Appendix N
Experimental Results of Water Boiling Test 3 (Hot start) for Fuel Samples
Time (min)
Rice strawBriquette Temp. (oC)
Rice huskBriquette Temp. (oC)
Saw dustBriquette Temp. (oC)
50%Saw dust + 50%Rice husk mixture BriquetteTemp. (oC)
FirewoodTemp. (oC)
0 23.0 24.0 22.0 24.0 24.0
2.5 43.0 49.0 45.0 47.0 49.0
5.0 60.0 63.0 59.0 68.0 63.0
7.5 70.0 80.0 71.0 85.0 80.0
10.0 76.0 86.0 79.0 90.0 86.0
12.5 88.0 96.0 87.0 96.0 96.0
15.0 89.0 93.0
17.5 92.0 96.0
20.0 95.0
22.5 96.0

102
APPENDIX OThe t-Distribution: Fractiles
p v 0.975 0.995 0.9995 0.95 0.99 0.999 0.60 0.70 0.75 0..80 0.90
1 2 3 4 5
6 7 8 9 10
11 12 13 14 15
16 17 18 19 20
21 22 23 24 25
26 27 28 29 30
40 60 80 100 ∞
12.706 63.657 636.619 4.303 9.925 31.598 3.182 5.841 12.924 2.776 4.604 8.610 2.571 4.032 6.869
2.447 3.707 5.959 2.365 3.499 5.408 2.306 3.355 5.041 2.262 3.250 4.781 2.228 3.169 4.587
2.201 3.106 4.437 2.179 3.055 4.318 2.160 3.012 4.221 2.145 2.977 4.140 2.131 2.947 4.073 2.120 2.921 4.015 2.110 2.898 3.965 2.101 2.878 3.922 2.093 2.861 3.883 2.086 2.845 3.850
2.080 2.831 3.819 2.074 2.819 3.792 2.069 2.807 3.767 2.064 2.797 3.745 2.060 2.787 3.725
2.056 2.779 3.707 2.052 2.771 3.690 2.048 2.763 3.674 2.045 2.756 3.659 2.042 2.750 3.646
2.021 2.704 3.551 2.000 2.660 3.460 1.990 2.639 3.416 1.984 2.626 3.390 1.960 2.576 3.291
6.314 31.821 318.309 2.920 6.965 22.327 2.353 4.541 10.213 2.132 3.747 7.173 2.015 3.365 5.893
1.943 3.143 5.208 1.895 2.998 4.785 1.860 2.896 4.507 1.833 2.821 4.297 1.812 2.764 4.144
1.796 2.718 4.025 1.782 2.681 3.930 1.771 2.650 3.852 1.761 2.624 3.787 1.753 2.602 3.733
1.746 2.583 3.686 1.740 2.567 3.646 1.734 2.552 3.610 1.729 2.539 3.579 1.725 2.528 3.552
1.721 2.518 3.527 1.717 2.508 3.505 1.714 2.500 3.485 1.711 2.492 3.467 1.708 2.485 3.450
1.706 2.479 3.435 1.703 2.473 3.421 1.701 2.467 3.408 1.699 2.462 3.396 1.697 2.457 3.385
1.684 2.423 3.307 1.671 2.390 3.232 1.664 2.374 3.195 1.660 2.364 3.174 1.645 2.326 3.090
.325 .727 1.000 1.376 3.078
.289 .617 .816 1.061 1.886
.277 .584 765 .978 1.638
.271 .569 .741 .941 1.533
.267 .559 .727 .920 1.476
.265 .553 .718 .906 1.440 .263 .649 .711 .896 1.415 .262 .546 .706 .889 1.397 .261 .543 .703 .883 1.383 .260 .542 .700 .879 1.372
.260 .540 .697 .876 1.363 .259 .539 .695 .873 1.356 .259 .538 .694 870 1.350 .258 .537 .692 .868 1.345 .258 .536 .691 .866 1.341
.258 .535 .690 .865 1.337 .257 .534 .689 .863 1.333 .257 .534 .688 .862 1.330 .257 .533 .688 .861 1.328 .257 .533 .687 .860 1.325
.257 .532 .686 .859 1.323 .256 .532 .686 .858 1.321 .256 .532 .685 .858 1.319 .256 .531 .685 .857 1.318 .256 .531 .684 .856 1.316
.256 .531 .684 .856 1.315 .256 .531 .684 .855 1.314 .256 .530 .683 .855 1.313 .256 .530 .683 .854 1.311 .256 .530 .683 .854 1.310
.255 .529 .681 .851 1.303 .254 .527 .679 .848 1.296 .254 .527 .678 .846 1.292 .254 .526 .677 .845 1.290 .253 .524 .674 .842 1.282
2 sided test 1 sided test
5% 1% 0.1% 10% 2% 0.2%
2.5% 0.5% 0.05% 5% 1% 0.1%
Levels of significance
deciles and quartiles
Source: Roa et al
Note: 1. v represents the degree of freedom. 2.For any given p in the top row, the table provides the value of tp such that the probability of t being
less than tp is equal to p. For p<0.5; tp = -t (1-p), t0.50 being zero always. 3.For obtaining a critical value of │t│ for a two-sided or of t for upper-sided test refer to the entry
corresponding to the chosen level of significance indicated in the last row, and the relevant degrees of freedom. For one-sided tests using the lower tail, the critical value is the same as that for the upper tail with the sign changed.

103
Appendix P
5 PER CENT POINTS OF THE F-DISTRIBUTION
1 = 1 2 3 4 5 6 7 8 10 12 24
1 =1 161.4 199.5 215.7 224.6 230.2 234.0 236.8 238.9 241.9 243.9 249.0 254.3
2 18.5 19.0 19.2 19.2 19.3 19.3 19.4 19.4 19.4 19.4 19.5 19.5 3 10.13 9.55 9.28 9.12 9.01 8.94 8.89 8.85 8.79 8.74 8.64 8.53 4 7.71 6.94 6.59 6.39 6.26 6.16 6.09 6.04 5.96 5.91 5.77 5.63
5 6.61 5.79 5.41 5.19 5.05 4.95 4.88 4.82 4.74 4.68 4.53 4.36 6 5.99 5.14 4.76 4.53 4.39 4.28 4.21 4.15 4.06 4.00 3.84 3.67 7 5.59 4.74 4.35 4.12 3.97 3.87 3.79 3.73 3.64 3.57 3.41 3.23 8 5.32 4.46 4.07 3.84 3.69 3.58 3.50 3.44 3.35 3.28 3.12 2.93 9 5.12 4.26 3.86 3.63 3.48 3.37 3.29 3.23 3.14 3.07 2.90 2.71
10 4.96 4.10 3.71 3.48 3.33 3.22 3.14 3.07 2.98 2.91 2.74 2.54 11 4.84 3.98 3.59 3.36 3.20 3.09 3.01 2.95 2.85 2.79 2.61 2.40 12 4.75 3.89 3.49 3.26 3.11 3.00 2.91 2.85 2.75 2.69 2.51 2.30 13 4.67 3.81 3.41 3.18 3.03 2.92 2.83 2.77 2.67 2.60 2.42 2.21 14 4.60 4.74 3.34 3.11 2.96 2.85 2.76 2.70 2.60 2.53 2.35 2.13
15 4.54 3.68 3.29 3.06 2.90 2.79 2.71 2.64 2.54 2.48 2.29 2.07 16 4.49 3.63 3.24 3.01 2.85 2.74 2.66 2.59 2.49 2.42 2.24 2.01 17 4.45 3.59 3.20 2.96 2.81 2.70 2.61 2.55 2.45 2.38 2.19 1.96 18 4.41 3.55 3.16 2.93 2.77 2.66 2.58 2.51 2.41 2.34 2.15 1.92 19 4.38 3.52 3.13 2.90 2.74 2.63 2.54 2.48 2.38 2.31 2.11 1.88
20 4.35 3.49 3.10 2.87 2.71 2.60 2.51 2.45 2.35 2.28 2.08 1.84 21 4.32 3.47 3.07 2.84 2.68 2.57 2.49 2.42 2.32 2.25 2.05 1.81 22 4.30 3.44 3.05 2.82 2.66 2.55 2.46 2.40 2.30 2.23 2.03 1.78 23 4.28 3.42 3.03 2.80 2.64 2.53 2.44 2.37 2.27 2.20 2.00 1.74 24 4.26 3.40 3.01 2.78 2.62 2.51 2.42 2.36 2.25 2.18 1-98 1.73
25 4.24 3.39 2.99 2.76 2.60 2.49 2.40 2.34 2.24 2.16 1.96 1.71 26 4.23 3.37 2.98 2.74 2.59 2.47 2.39 2.32 2.22 2.15 1.95 1.69 27 4.21 3.35 2.96 2.73 2.57 2.46 2.37 2.31 2.20 2.13 1.93 1.67 28 4.20 3.34 2.95 2.71 2.56 2.45 2.36 2.29 2.19 2.12 1.91 1.65 29 4.18 3.33 2.93 2.70 2.55 2.43 2.35 2.28 2.18 2.10 1.90 1.64
30 4.17 3.32 2.92 2.69 2.53 2.42 2.33 2.27 2.16 2.09 1.89 1.62 32 4.15 3.29 2.90 2.67 2.51 2.40 2.31 2.24 2.14 2.07 1.86 1.59 34 4.13 3.28 2.88 2.65 2.49 2.38 2.29 2.23 2.12 2.05 1.84 1.57 36 4.11 3.26 2.87 2.63 2.48 2.36 2.28 2.21 2.11 2.03 1.82 1.55 38 4.10 3.24 2.85 2.62 2.46 2.35 2.26 2.19 2.09 2.02 1.81 1.53
40 4.08 3.23 2.84 2.61 2.45 2.34 2.25 2.18 2.08 2.00 1.79 1.51 60 4.00 3.15 2.76 2.53 2.37 2.25 2.17 2.10 1.99 1.92 1.70 1.39 120 3.92 3.07 2.68 2.45 2.29 2.18 2.09 2.02 1.91 1.83 1.61 1.25 3.84 3.00 2.60 2.37 2.21 2.10 2.01 1.94 1.83 1.75 1.52 1.00
Source Rao et al (1966)

104
Appendix Q
1 PER CENT POINTS OF THE F-DISTRIBUTION
1 = 1 2 3 4 5 6 7 8 10 12 24
1 =1 4052 5000 5403 5625 5764 5859 5928 5981 6056 6106 6235 6366
2 98.5 99.0 99.2 99.2 99.3 99.3 99.4 99.4 99.4 99.4 99.5 99.5 3 34.1 30.8 29.5 28.7 28.2 27.9 27.7 27.5 27.2 27.1 26.6 26.1 4 21.2 18.0 16.7 16.0 15.5 15.2 15.0 14.8 14.5 14.4 13.9 13.5
5 16.26 13.27 12.06 11.39 10.97 10.67 10.46 10.29 10.05 9.89 9.47 9.02 6 13.74 10.92 9.78 9.15 8.75 8.47 8.26 8.10 7.87 7.72 7.31 6.88 7 12.25 9.55 8.45 7.85 7.46 7.19 6.99 6.84 6.62 6.47 6.07 5.65 8 11.26 8.65 7.59 7.01 6.63 6.37 6.18 6.03 5.8 5.67 5.28 4.86 9 10.56 8.02 6.99 6.42 6.06 5.80 5.61 5.47 5.26 5.11 4.73 4.31
10 10.04 7.56 6.55 5.99 5.64 5.39 5.20 5.06 4.85 4.71 4.33 3.91 11 9.65 7.21 6.22 5.67 5.32 5.07 4.89 4.74 4.54 4.40 4.02 3.60 12 9.33 6.93 5.95 5.41 5.06 4.82 4.64 4.50 4.30 4.16 3.78 3.36 13 9.07 6.70 5.74 5.21 4.86 4.62 4.44 4.30 4.10 3.96 3.59 3.17 14 8.86 6.51 5.56 5.04 4.70 4.46 4.28 4.14 3.94 3.80 3.43 3.00
15 8.86 6.36 5.42 4.89 4.56 4.32 4.14 4.00 3.80 3.67 3.29 2.87 16 8.53 6.23 5.29 4.77 4.44 4.20 4.03 3.89 3.69 3.55 3.18 2.75 17 8.40 6.11 5.18 4.67 4.34 4.10 3.93 3.79 3.59 3.46 3.08 2.65 18 8.29 6.01 5.09 4.58 4.25 4.01 3.84 3.71 3.51 3.37 3.00 2.57 19 8.18 5.93 5.01 4.50 4.17 3.94 3.77 3.63 3.43 3.30 2.92 2.49
20 8.10 5.85 4.94 4.43 4.10 3.87 3.70 3.56 3.37 3.23 2.86 2.42 21 8.02 5.78 4.87 4.37 4.04 3.81 3.64 3.51 3.35 3.27 2.80 2.36 22 7.95 5.72 4.82 4.39 3.99 3.76 3.59 3.45 3.26 3.18 2.75 2.31 23 7.88 5.66 4.76 4.26 3.94 3.71 3,54 3.41 3.21 3.07 2.70 2.26 24 7.82 5.61 4.72 4.22 3.90 3.67 3.50 3.36 3.17 3.03 2.66 2.21
25 7.77 5.57 4.68 4.18 3.86 3.63 3.46 3.32 3.13 2.99 2.62 2.17 26 7.72 5.53 4.64 4.14 3.82 3.59 3.42 3.29 3.09 2.96 2.58 2.13 27 7.68 5.49 4.60 4.11 3.78 3.56 3.39 3.26 3.06 2.93 2.55 2.10 28 7.64 5.45 4.57 4.07 3.75 3.53 3.36 3.23 3.03 2.90 2.52 2.06 29 7.60 5.42 4.54 4.04 3.73 3.50 3.33 3.20 3.00 2.87 2.49 2.03
30 7.56 5.39 4.51 4.02 3.70 3.47 3.30 3.17 2.98 2.84 2.47 2.01 32 7.50 5.34 4.46 3.97 3.65 3.43 3.26 3.13 2.93 2.80 2.42 1.96 34 7.45 5.29 4.42 3.93 3.61 3.39 3.22 3.09 2.90 2.76 2.38 1.91 36 7.40 5.25 4.38 3.89 3.58 3.35 3.18 3.05 2.86 2.72 2.35 1.87 38 7.35 5.21 4.34 3.86 3.54 3.32 3.15 3.02 2.83 2.69 2.32 1.84
40 7.31 5.18 4.31 3.83 3.51 3.29 3.12 2.99 2.80 2.66 2.29 1.80 60 7.08 4.98 4.13 3.65 3.34 3.12 2.95 2.82 2.63 2.50 2.12 1.60 120 6.85 4.79 3.95 3.48 3.17 2.96 2.79 2.66 2.47 2.34 1.95 1.38 6.63 4.61 3.78 3.32 3.02 2.80 2.64 2.51 2.32 2.18 1.79 1.00
Source Rao et al (1966)

105
APPENDIX R
GRAPHS
Fig 13: Temperature versus Time graph for Bomb CalorimeterTest of Rice Straw Briquette
Fig 14: Temperature versus Time graph for Bomb CalorimeterTest of Rice Husk Briquettes

106
Fig 15: Temperature versus Time graph for Bomb CalorimeterTest of Sawdust Briquette
Fig 16: Temperature versus Time graph for Bomb CalorimeterTest of 50% Saw dust + 50% Rice husk

107
Fig 17: Temperature versus Time graph for Bomb CalorimeterTest of Firewood

108
Fig 18: Graph of Water Boiling Test 1 (cold start) of fuel samples
Fig 19: Graph of Water Boiling Test 1 (hot start) of fuel samples

109
Fig 20: Graph of Water Boiling Test 2 (cold start) of fuel samples
Fig 21: Graph of Water Boiling Test 2 (hot start) of fuel samples

110
Fig 22: Graph of Water Boiling Test 3 (cold start) of fuel samples
Fig 23: Graph of Water Boiling Test 3 (hot start) of fuel samples
111
Appendix S
Charts of Fuel Performance
Figure 24: Thermal Efficiency of Fuel Samples (%)
30
High Power (Cold)
High Power (Hot)
Lower Power (Simmering)
5
10
15
20
25
50%Rice Husk +50%Saw Dust
0
Rice Straw
Rice Husk
Saw Dust
Fire Wood
Fuel Samples
Eff
icie
ncy
(%
)

112
Low Power (Simmering)
0
0.5
1
1.5
2
2.5
Rice Straw
Rice Husk
Saw Dust
50%Rice Husk+50%SawDust
Fire Wood
Fuel Samples
Bu
rnin
g R
ate
(Kg/
hr)
High Power (Cold)
High Power (Hot)
Figure 25: Burning rate of Fuel Samples (Kg/hr)

113
Fuel Samples
Fu
el C
onsu
mp
tion
(g/
g)
Lower Power (Simmering)
Figure 26: Fuel Consumption (g/g) of Fuel Samples
0.1
0.2
0.3
0.4
0.5
0.6
High Power (Cold)
High Power (Hot)
0
Rice Straw Rice Husk Saw Dust 50%Rice Husk+
50%Saw DustFire Wood

114
WO
RK
ING
DR
AW
ING
S O
F
BR
IQU
ET
TIN
G S
CR
EW
PR
ES
S
(DR
AW
ING
NO
. 1 –
44)
AL
L D
IME
NS
ION
S I
N M
ILL
IME
TR
ES


