Denitrification in the well-oxygenated NW Pacific Denitrification in the well-oxygenated NW Pacific marginal seasmarginal seas
Lynne D. Talley, Pavel Tishchenko*
Scripps Institution of Oceanography, La Jolla, CA
*Pacific Oceanological Institute, Vladivostok
Nitrate/phosphate ratios (N*) indicating denitrification on nearly the same scale as in the tropical denitrification zones
Presence of measurable deep nitrite in turbid bottom layers, relation to extremes of N*
Japan Sea - interesting, but isolated source of denitrification
Okhotsk Sea - major major source to upper/intermediate Pacific
Bering Sea - source to intermediate/deep Pacific
Sedimentary process, impact on oxygen consumption
Gruber and Sarmiento (1997): N*
Jahnke and Jackson (1987), Christensen et al (1987), Janhke et al (1990): sediment effects on large-scale oxygen and carbon distribution
Anderson and Sarmiento (1994): sedimentary denitrification rates
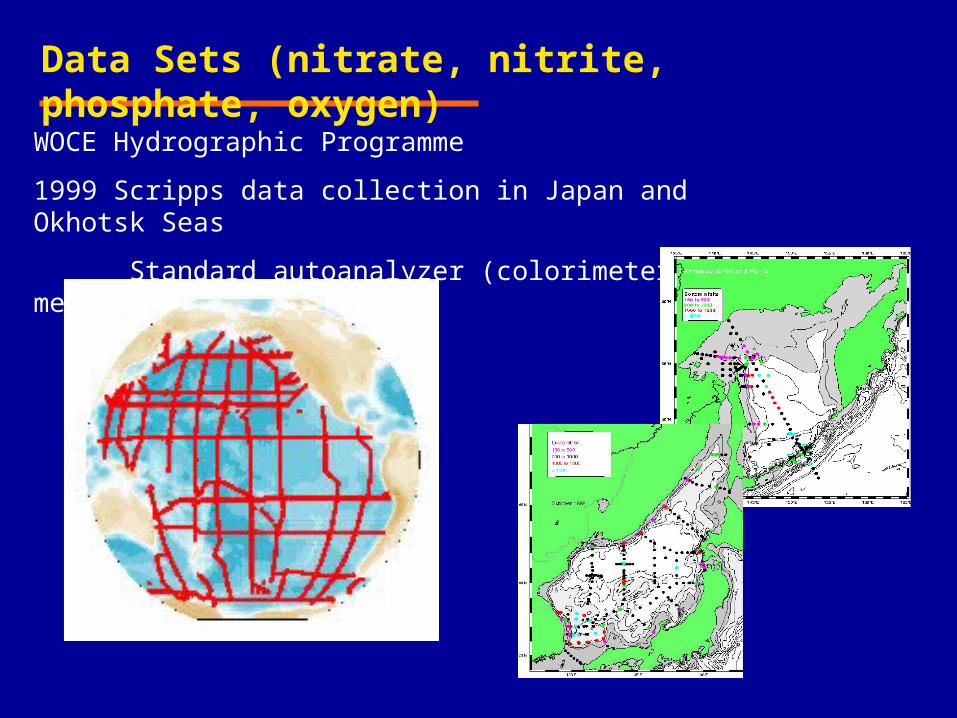
Data Sets (nitrate, nitrite, phosphate, oxygen)
WOCE Hydrographic Programme
1999 Scripps data collection in Japan and Okhotsk Seas
Standard autoanalyzer (colorimeter) method
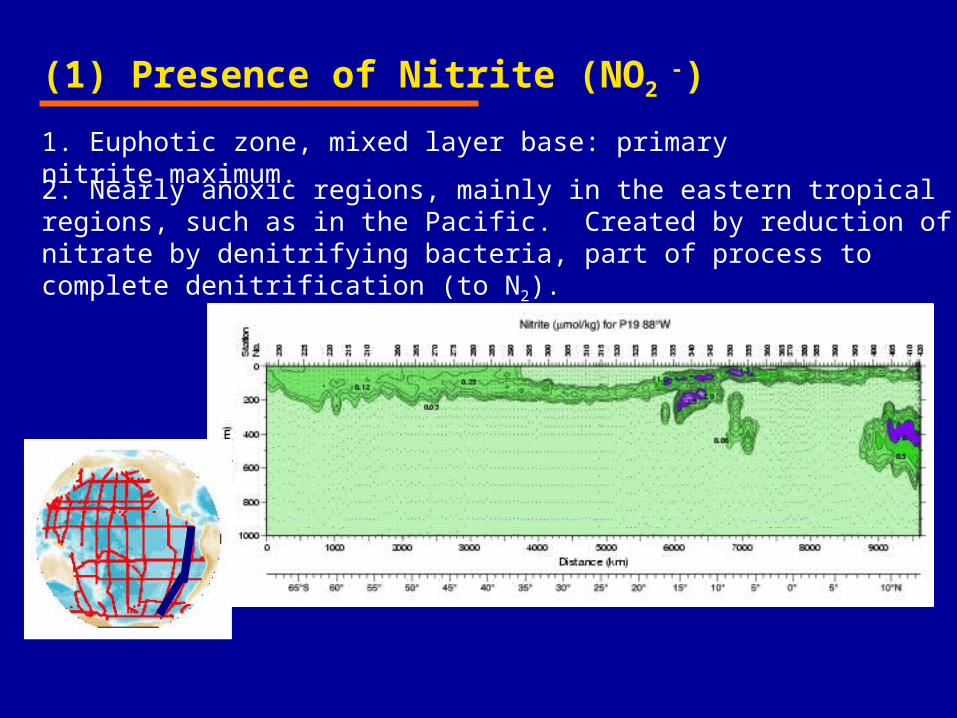
(1) Presence of Nitrite (NO2 -)
1. Euphotic zone, mixed layer base: primary nitrite maximum.
2. Nearly anoxic regions, mainly in the eastern tropical regions, such as in the Pacific. Created by reduction of nitrate by denitrifying bacteria, part of process to complete denitrification (to N2).

(1) Presence of Nitrite (NO2 -) (cont.)
3. Sediment processes: coupled denitrification and nitrification. Large-scale effect is of denitrification.
Existence of deep NO2- (in turbid bottom
boundary layer): sediment-water interface is wide.
Nitrification (oxidation) could occur in upper sediment interface, producing NO2
- , using ammonium from decay of organic matter. Denitrification (reduction) farther down, net downward flux of NO3
- out of
water column and into sediments.

(2) Use of N* to demonstrate denitrification
Denitrification can be measured using N* (Gruber and Sarmiento, 1997) (distance from Redfield ratio N:P line)
N* values greater than zero indicate nitrogen fixation.
N* values less than zero indicate denitrification.
-16 -14 -12 -10 -8 -6 -4 -2 0 2 4-7000
-6000
-5000
-4000
-3000
-2000
-1000
0
N*
Depth
Japan/East Sea (blue), Okhotsk Sea (red), Bering Sea and N. Pac (green)
Dep
th
N*
0 5 10 15 20 25 30 35 40 450
0.5
1
1.5
2
2.5
3
3.5
Nitrate
Japan/East Sea (blue), Okhotsk Sea (red), Bering Sea and N. Pac (green), Tsushima St. (black)
Ph
osp
hat
eP
ho
s ph
a te
NitrateNitrate
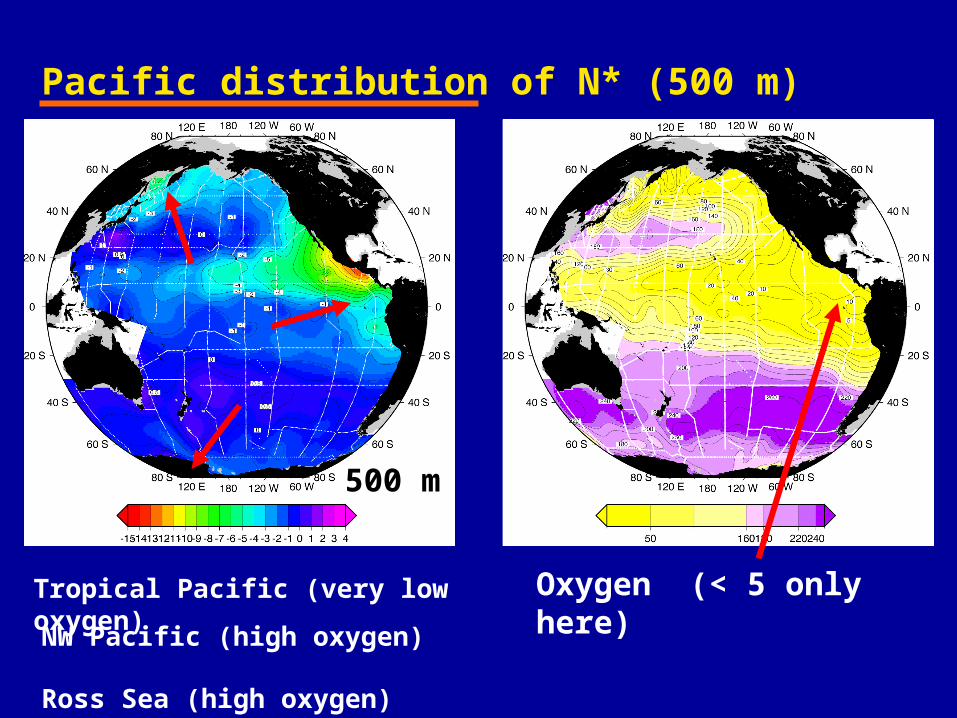
Pacific distribution of N* (500 m)
500 m
NW Pacific (high oxygen)
Ross Sea (high oxygen)
Tropical Pacific (very low oxygen) Oxygen (< 5 only here)

Pacific distribution of N* (2000 m)
2000 m
Bering Sea (medium oxygen)
Tropical Pacific (medium oxygen) Oxygen (>50 everywhere)
Note well-oxygenated Japan Sea

N* (Gruber & Sarmiento)
Pacific WOCE
Nitrification N*>0
Denitrification Denitrification N* < 0N* < 0
Figure prepared by P. Robbins

NW Pacific distribution of N*
300 m
1000 m
2000 m
High values south of subarctic front.
Spread of low values into NW corner.
Japan Sea: high in newer waters in center, lower around edges
Okhotsk Sea: low off northern shelves

Presence of nitrite (all color dots) on bottom (JES, OS) or deep (Bering)
Measurable NO2 - > 0.004 mol/kg
Standard autoanalyzer, colorimetric procedure (SIO/ODF WOCE quality). (Much smaller quantities are measured with other specialized techniques.)
These are well-oxygenated basins -> bottom sediment process causing denitrification

Japan Sea Oxygen Nitrite
Nitrite far below the euphotic zone, together with lowered O2
1400 m
NONO2 2 ~ 0~ 0 High O2
N*
NO2 > 0
NONO2 2 >> 0>> 0
Somewhat lower O2
(205 mol/kg)

Profiles in the Ulleung Basin
Bottom boundary layer: nitrite enhancement, O2 depletion, NO3 depletion, N* suggesting denitrification, high turbidity (water full of sediment)

Japan Sea: Mid-depth oxygen minimum
Ulleung Basin, Yamato Rise, Japan Basin
Primorye, HokkaidoPrimorye, Hokkaido
Lower oxygen along margins
Is there a link to sedimentary processes? (There is no CFC minimum, and no CFC signature in the bottom boundary layers)

Japan Sea: bottom nitrite
1000 to 1500 m
> 1500 mBottom nitrite
At (a) depths below 300 m around all margins, and (b) > 1000 m in the southwest

Sediment composition
High percentage of organic carbon in the sediments in the Ulleung Basin and around the margins (Likht et al.) - coinciding with occurrence of deep nitrite. High percentages are similar to (greater than) percentages found in Washington coast sediment measurements that showed denitrification (Devol, 1991)
Organic carbon > 2%
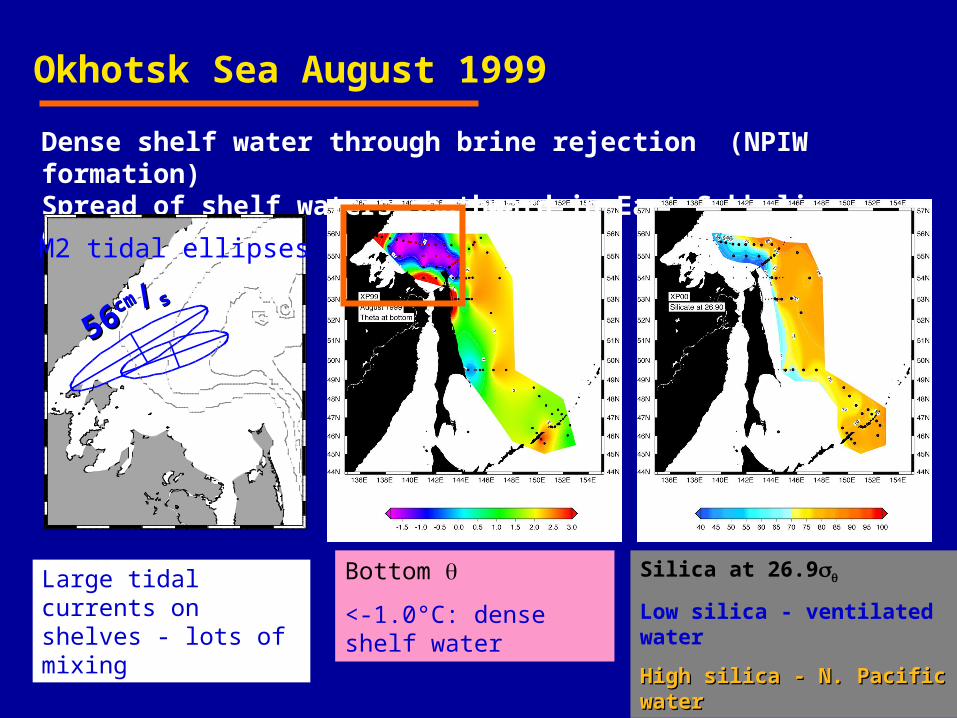
Okhotsk Sea August 1999
Silica at 26.9
Low silica - ventilated water
High silica - N. Pacific High silica - N. Pacific waterwater
Bottom
<-1.0°C: dense shelf water
Dense shelf water through brine rejection (NPIW formation) Spread of shelf waters southward in East Sakhalin Current
136oE 138oE 140oE 142oE 144oE
53oN
54oN
58oN
55oN
56oN
57oN
5656cmcm // ss
M2 tidal ellipses
Large tidal currents on shelves - lots of mixing

Okhotsk Sea Nitrite and N*
N*Nitrite1000 to 1500 m
> 1500 m
N*

Bering Sea Nitrite and N*
We had a more limited data set: WOCE section only shown here.
Nitrite occurs to 400 m.
Deep nitrite only at Aleutians
Low N* throughout,
very low at bottom.
Greater impact than Okhotsk on Pacific distribution at greater depths
Nitrite N*
1500 m
3800 m Aleutians
Bering Sea
400 m
500-1000 m
1000 to 1500 m

N:P ratio in the NW Pacific marginal seas
0 5 10 15 20 25 30 35 40 450
0.5
1
1.5
2
2.5
3
3.5
Nitrate
Japan/East Sea (blue), Okhotsk Sea (red), Bering Sea and N. Pac (green), Tsushima St. (black)
Ph
osp
hat
eP
ho
s ph
a te
Japan/East Sea and Tsushima Strait
Okhotsk Sea
Bering Sea
NitrateNitrate
Excursion left of line -> denitrification; right of line -> N fixation.

N* in the NW marginal seas
Sig
ma
0
N*
-16 -14 -12 -10 -8 -6 -4 -2 0 2 4-28
-27
-26
-25
-24
-23
-22
N*
Potential density sigma 0
Japan/East Sea (blue), Okhotsk Sea (red), Bering Sea and N. Pac (green), Tsushima St. (black)
Denitrification in Japan/East Sea below the shallow pycnocline
-16 -14 -12 -10 -8 -6 -4 -2 0 2 4-7000
-6000
-5000
-4000
-3000
-2000
-1000
0
N*
Depth
Japan/East Sea (blue), Okhotsk Sea (red), Bering Sea and N. Pac (green)
Dep
th
N*
Denitrification in upper Okhotsk Sea is most pronounced.
Deeper denitrification most pronounced in Bering Sea: note split around Aleutians (lower N* inside Bering Sea)
Okhotsk Sea,
Bering Sea
Japan Sea
Tsushima Strait
Lower N* is more denitrified (zero is the Redfield ratio nitrate:phosphate line)

Conclusions
Signature of sedimentary denitrification is clear in the Okhotsk, Bering and Japan Seas
Presence of deep nitrite is shown in Japan and Okhotsk Seas: active turbid sediment/water interface (eddies, tides). Suggestion of deep nitrite in Bering - need more nutrient data
Japan Sea: useful for rate calculations because of isolation
Coincidence of oxygen minimum, nitrite presence, low N*, and unperturbed CFCs suggests role of sediments in producing oxygen minimum layer. Could perhaps generalize this to the N. Pacific.
Okhotsk Sea: major impact on N. Pacific N:P ratio (North Pacific Intermediate Water - above 1000 m)
Bering Sea: impact on mid-depth N. Pacific N:P ratio

Japan Sea denitrification rate (VERY ROUGH)
Inflow at Tsushima Strait: N* = + 1.5
Nitrate surplus of Tsushima Strait: + 2 mol/kg
Waters below pycnocline: N* ~ -3.2
Nitrate deficit for subpycnocline waters: - 4 mol/kg
6 mol/kg denitrification loss
Turnover time: 20 to 50 years
Denitrification rate:
(6 mol/kg )(1027 kg/m3)(3000m)/50 yrs = 0.4 mol / m2 yr
Oxygen utilization rate from oxygen deficit compared with nitrate deficit in the bottom boundary layer: ~ 10 mol / m2 yr


