
© 2009 International Monetary Fund January, 2010
IMF Country Report No. 10/11
Democratic Republic of the Congo: Statistical Appendix This paper was prepared based on the information available at the time it was completed on November 30, 2009. The views expressed in this document are those of the staff team and do not necessarily reflect the views of the government of the Democratic Republic of the Congo or the Executive Board of the IMF. The policy of publication of staff reports and other documents by the IMF allows for the deletion of market-sensitive information.
Copies of this report are available to the public from
International Monetary Fund ● Publication Services 700 19th Street, N.W. ● Washington, D.C. 20431
Telephone: (202) 623-7430 ● Telefax: (202) 623-7201 E-mail: [email protected] ● Internet: http://www.imf.org
International Monetary Fund Washington, D.C.

INTERNATIONAL MONETARY FUND
THE DEMOCRATIC REPUBLIC OF THE CONGO
Statistical Appendix Prepared by Brian Ames, Simona Bovha-Padilla, Giovanni Callegari, Abdikarim Farah and
Hostland Douglas
Approved by the African Department
November 30, 2009
Contents Page Basic Data ..................................................................................................................................2 Statistical Tables 1. GDP by Sector at Market Prices, 2003–08 .................................................................4 2. GDP by Sector at 2000 Prices, 2003–08 .....................................................................5 3. GDP by Sector at 2000 Prices, 2003–08 .....................................................................6 4. Distribution of GDP by Sector at 2000 Prices, 2003–08 ............................................7 5. GDP Deflators by Sector, 2003–08 ............................................................................8 6. Components of Aggregate Demand and Saving, 2003–08 .........................................9 7. Selected Indicators of Production, 2003–08 .............................................................10 8. Manufacturing Output, 2003–08 ...............................................................................11 9. Retail Prices of Petroleum Products, 2003–March 2009 ..........................................12 10. Production and Consumption of Electricity and Water, 2003–08 ............................13 11. Consumer Price Index for Kinshasa, 2003–October 2009........................................14 12. Central Government Operations, 2003–08 ...............................................................15 13. Central Government Revenue, 2003–08 ...................................................................16 14. Central Government Expenditure, 2003–08 .............................................................17 15. Government Labor Force and Wage Bill, 2003–06 ..................................................18 16. Wage Scale, 2003–06................................................................................................19 17. Sectoral Distribution of State-Owned Enterprises ....................................................20 18. Monetary Survey, 2003–08 .......................................................................................22 19. Central Bank Accounts, 2003–08 .............................................................................23 20. Balance Sheet of Commercial Banks, 2003–08 ........................................................24 21. List of Commercial Banks ........................................................................................25 22. Distribution of Commercial Banks’ Credits by Sector, 2003–08 .............................26 23. Developments in the Commercial Banking System, 2003–08 .................................27 24. Balance of Payments Summary, 2003–08 ................................................................28 25. Composition of Commodity Exports, 2003–08 ........................................................29 26. Composition of Imports, 2003–08 ............................................................................30 27. Foreign Trade Indicators, 2003–08 ...........................................................................31 28. Summary of the Tax System, 2009 ...........................................................................32
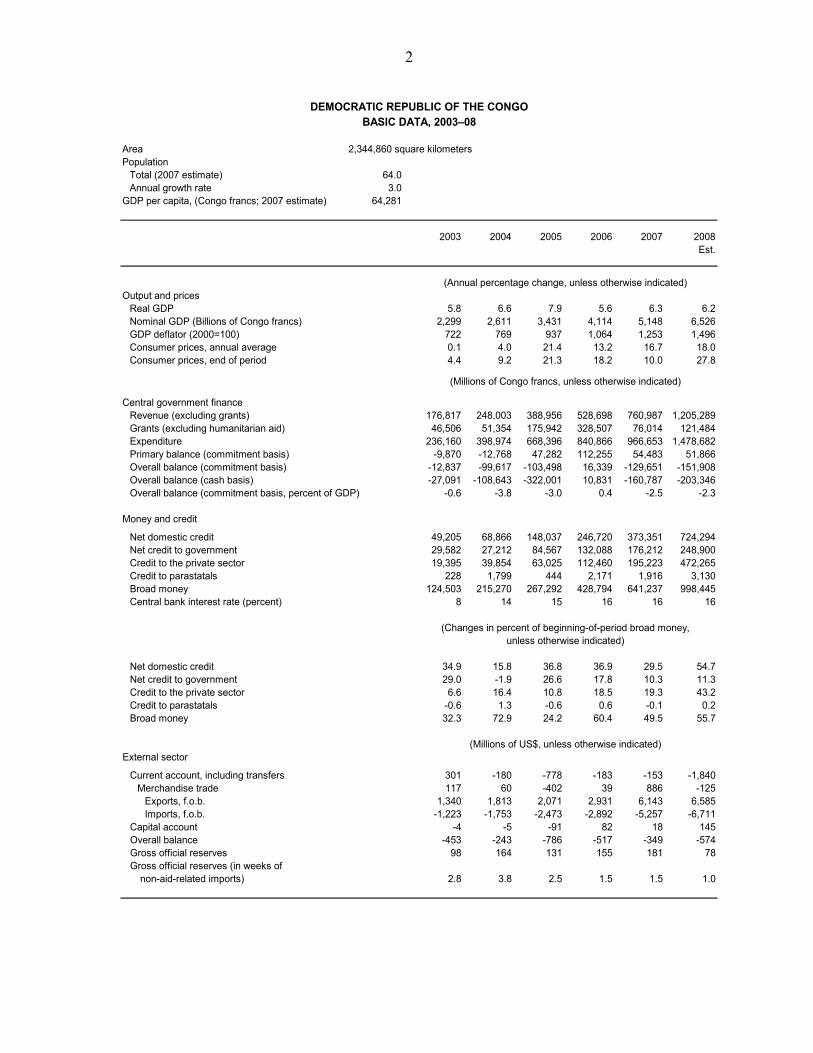
2
Area 2,344,860 square kilometersPopulation
Total (2007 estimate) 64.0Annual growth rate 3.0
GDP per capita, (Congo francs; 2007 estimate) 64,281
2003 2004 2005 2006 2007 2008Est.
Output and pricesReal GDP 5.8 6.6 7.9 5.6 6.3 6.2Nominal GDP (Billions of Congo francs) 2,299 2,611 3,431 4,114 5,148 6,526GDP deflator (2000=100) 722 769 937 1,064 1,253 1,496Consumer prices, annual average 0.1 4.0 21.4 13.2 16.7 18.0Consumer prices, end of period 4.4 9.2 21.3 18.2 10.0 27.8
Central government financeRevenue (excluding grants) 176,817 248,003 388,956 528,698 760,987 1,205,289Grants (excluding humanitarian aid) 46,506 51,354 175,942 328,507 76,014 121,484Expenditure 236,160 398,974 668,396 840,866 966,653 1,478,682Primary balance (commitment basis) -9,870 -12,768 47,282 112,255 54,483 51,866Overall balance (commitment basis) -12,837 -99,617 -103,498 16,339 -129,651 -151,908Overall balance (cash basis) -27,091 -108,643 -322,001 10,831 -160,787 -203,346Overall balance (commitment basis, percent of GDP) -0.6 -3.8 -3.0 0.4 -2.5 -2.3
Money and credit
Net domestic credit 49,205 68,866 148,037 246,720 373,351 724,294Net credit to government 29,582 27,212 84,567 132,088 176,212 248,900Credit to the private sector 19,395 39,854 63,025 112,460 195,223 472,265Credit to parastatals 228 1,799 444 2,171 1,916 3,130Broad money 124,503 215,270 267,292 428,794 641,237 998,445Central bank interest rate (percent) 8 14 15 16 16 16
Net domestic credit 34.9 15.8 36.8 36.9 29.5 54.7Net credit to government 29.0 -1.9 26.6 17.8 10.3 11.3Credit to the private sector 6.6 16.4 10.8 18.5 19.3 43.2Credit to parastatals -0.6 1.3 -0.6 0.6 -0.1 0.2Broad money 32.3 72.9 24.2 60.4 49.5 55.7
External sector
Current account, including transfers 301 -180 -778 -183 -153 -1,840Merchandise trade 117 60 -402 39 886 -125
Exports, f.o.b. 1,340 1,813 2,071 2,931 6,143 6,585Imports, f.o.b. -1,223 -1,753 -2,473 -2,892 -5,257 -6,711
Capital account -4 -5 -91 82 18 145Overall balance -453 -243 -786 -517 -349 -574Gross official reserves 98 164 131 155 181 78Gross official reserves (in weeks of
non-aid-related imports) 2.8 3.8 2.5 1.5 1.5 1.0
DEMOCRATIC REPUBLIC OF THE CONGOBASIC DATA, 2003–08
(Annual percentage change, unless otherwise indicated)
(Millions of US$, unless otherwise indicated)
(Changes in percent of beginning-of-period broad money,unless otherwise indicated)
(Millions of Congo francs, unless otherwise indicated)

3
Democratic Republic of the Congo: Basic Data, 2003–08 (concluded)
2003 2004 2005 2006 2007 2008Est.
Exchange rates
CGF/USD (level, average) 405 398 474 468 516 563USD/CGF (level, end-of-period) 0.003 0.002 0.002 0.002 0.002 0.002USD/CGF (end-of-period) 2.6 -16.1 -6.4 1.3 -9.2 -8.4Nominal effective exchange rate 1 -21.7 -12.1 -17.6 1.3 -15.5 -11.7Real effective exchange rate 1 -13.5 -10.4 -2.0 11.7 -3.1 -0.7
External public debt
Total, including IMF 12,963 12,775 12,706 12,895 13,425 13,149Of which: multilateral institutions 4,975 4,836 4,805 4,757 4,712 4,625
official bilateral creditors 6,910 6,821 6,713 6,552 6,273 5,985Scheduled debt service (Percent of exports
of goods and services) 29.5 21.1 14.2 14.6 11.3 14.0
Social indicators 2 (Percent, unless otherwise indicated)
Life expectancy at birth (years) 42 ... 46 46 45 ...Infant mortality rate (per 1,000 live births) 129 ... 129 ... 161 ...
Gross primary school enrollment rate (1998–2002)Male 52 51 ... ... 68 ...Female 47 46 ... ... 54 ...
Immunization rate (percent between 12–23 months)Measles 54 64 70 73 79 ...Diphtheria 49 64 73 77 87 ...
Sources: Congolese authorities; World Bank; UNICEF; and IMF staff estimates.1 Annual averages. Minus sign indicates depreciation.2 Data for 2003 from UNICEF. Data prior to 2003 from World Bank.
(Millions of US$, unless otherwise indicated)
(Annual percentage changes; unless otherwise indicated)

4
2003 2004 2005 2006 2007 2008
Est.
Primary sector 1,349,242 1,488,615 1,975,724 2,276,026 2,819,782 3,525,431Agriculture, forestry, livestock, hunting, and fishing 1,150,558 1,204,337 1,503,946 1,757,914 2,118,393 2,574,207Mining 1 198,683 284,278 471,778 518,112 701,389 951,224
Secondary sector 286,290 348,577 478,463 568,416 692,737 838,875 Manufacturing 122,294 159,995 209,520 235,464 288,074 352,522 Construction and public works 93,605 120,390 184,053 233,317 286,433 353,137 Electricity and water 70,391 68,192 84,891 99,635 118,229 133,215
Tertiary sector 620,237 721,121 910,593 1,187,085 1,532,650 2,036,871Wholesale and retail trade 355,057 395,877 536,141 650,678 856,577 1,146,193Transport and communications 84,584 99,016 137,818 173,233 223,847 288,552Trade and commerce 95,782 110,807 145,139 176,634 220,480 272,576Public administration and other services 84,815 115,422 91,496 186,540 231,746 329,551
GDP at factor cost 2,255,768 2,558,314 3,364,781 4,031,527 5,045,169 6,401,177
Import duties and taxes 42,887 52,581 65,752 82,454 103,004 124,806
GDP at market prices (Billions of Congo francs) 2,298,656 2,610,895 3,430,533 4,113,980 5,148,173 6,525,983(Annual percentage change) 20 14 31 20 25 27
Sources: Congolese authorities; and IMF staff estimates.1 Including processing of minerals.
Table 1. Democratic Republic of the Congo: GDP by Sector at Market Prices, 2003–08(Millions of Congo francs; unless otherwise indicated)

5
2003 2004 2005 2006 2007 2008Est.
Primary sector 181,592 188,804 199,003 204,252 210,531 221,273Agriculture, forestry, livestock, hunting, and fishing 143,292 144,220 148,359 153,176 158,154 162,914Mining 1 38,300 44,584 50,644 51,076 52,377 58,358
Secondary sector 33,551 40,431 46,788 50,755 53,335 54,928Manufacturing 12,235 15,175 16,029 16,172 16,996 17,454Construction and public works 18,460 22,610 28,069 31,776 33,483 34,755Electricity and water 2,856 2,646 2,690 2,807 2,857 2,718
Tertiary sector 97,414 104,679 113,781 124,129 137,962 151,475Wholesale and retail trade 56,675 59,908 65,444 71,300 80,630 90,548Transport and communications 15,781 17,563 19,801 22,271 24,708 26,783Trade and commerce 18,500 20,002 21,582 23,200 24,812 26,003Public administration and other services 6,458 7,206 6,954 7,357 7,812 8,141
GDP at factor cost 312,079 332,499 358,005 377,337 399,795 423,400
Import duties and taxes 6,262 6,980 8,237 9,365 11,101 12,771
GDP at market prices 318,341 339,479 366,242 386,702 410,896 436,171(Annual percentage change) 5.8 6.6 7.9 5.6 6.3 6.2
Sources: Congolese authorities; and IMF staff estimates.1 Including processing of minerals.
Table 2. Democratic Republic of the Congo: GDP by Sector at 2000 Prices, 2003–08(Millions of Congo francs)

6
2003 2004 2005 2006 2007 2008Est.
Primary sector 3.5 4.0 5.4 2.6 3.1 5.1Agriculture, forestry, livestock, hunting, and fishing 1.2 0.6 2.9 3.2 3.3 3.0Mining 1 13.2 16.4 13.6 0.9 2.5 11.4
Secondary sector 11.1 20.5 15.7 8.5 5.1 3.0Manufacturing -3.3 24.0 5.6 0.9 5.1 2.7Construction and public works 23.8 22.5 24.1 13.2 5.4 3.8Electricity and water 8.3 -7.4 1.7 4.3 1.8 -4.9
Tertiary sector 8.0 7.5 8.7 9.1 11.1 9.8Wholesale and retail trade 3.5 5.7 9.2 8.9 13.1 12.3Transport and communications 27.8 11.3 12.7 12.5 10.9 8.4Trade and commerce 6.2 8.1 7.9 7.5 6.9 4.8Public administration and other services 14.4 11.6 -3.5 5.8 6.2 4.2
GDP at factor cost 5.5 6.5 7.7 5.4 6.0 5.9
Import duties and taxes 22.2 11.5 18.0 13.7 18.5 15.0
GDP at market prices 5.8 6.6 7.9 5.6 6.3 6.2
Sources: Congolese authorities; and IMF staff estimates.1 Including processing of minerals.
Table 3. Democratic Republic of the Congo: GDP by Sector at 2000 Prices, 2003–08(Annual percentage change)

7
2003 2004 2005 2006 2007 2008
Est.
Primary sector 57.0 55.6 54.3 52.8 51.2 50.7Agriculture, forestry, livestock, hunting, and fishing 45.0 42.5 40.5 39.6 38.5 37.4Mining 1 12.0 13.1 13.8 13.2 12.7 13.4
Secondary sector 10.5 11.9 12.8 13.1 13.0 12.6Manufacturing 3.8 4.5 4.4 4.2 4.1 4.0Construction and public works 5.8 6.7 7.7 8.2 8.1 8.0Electricity and water 0.9 0.8 0.7 0.7 0.7 0.6
Tertiary sector 30.6 30.8 31.1 32.1 33.6 34.7Wholesale and retail trade 17.8 17.6 17.9 18.4 19.6 20.8Transport and communications 5.0 5.2 5.4 5.8 6.0 6.1Trade and commerce 5.8 5.9 5.9 6.0 6.0 6.0Public administration and other services 2.0 2.1 1.9 1.9 1.9 1.9
GDP at factor cost 98.0 97.9 97.8 97.6 97.3 97.1
Import duties and taxes 2.0 2.1 2.2 2.4 2.7 2.9
Sources: Congolese authorities; and IMF staff estimates.1 Including processing of minerals.
Table 4. Democratic Republic of the Congo: Distribution of GDP by Sector at 2000 Prices, 2003–08(Percent of GDP)

8
2003 2004 2005 2006 2007 2008
Est.
Primary sector 743 788 993 1,114 1,339 1,593Agriculture, forestry, livestock, hunting, and fishing 803 835 1,014 1,148 1,339 1,580Mining 1 519 638 932 1,014 1,339 1,630
Secondary sector 853 862 1,023 1,120 1,299 1,527Manufacturing 1,000 1,054 1,307 1,456 1,695 2,020Construction and public works 507 532 656 734 855 1,016Electricity and water 2,464 2,577 3,155 3,549 4,138 4,902
Tertiary sector 637 689 800 956 1,111 1,345Wholesale and retail trade 626 661 819 913 1,062 1,266Transport and communications 536 564 696 778 906 1,077Trade and commerce 518 554 673 761 889 1,048Public administration and other services 1,313 1,602 1,316 2,535 2,967 4,048
GDP deflator (at factor cost) 723 769 940 1,068 1,262 1,512
Import duties and taxes 685 753 798 880 928 977
GDP deflator (at market prices) 722 769 937 1,064 1,253 1,496(Annual percentage change) 13.0 6.5 21.8 13.6 17.8 19.4
Sources: Congolese authorities; and IMF staff estimates.1 Including processing of minerals.
Table 5. Democratic Republic of the Congo: GDP Deflators by Sector, 2003–08(2000 = 100)

9
2003 2004 2005 2006 2007 2008Est.
Consumption 2,070 2,382 3,350 3,766 4,384 6,078Government 145 201 387 524 549 804Nongovernment 1,925 2,181 2,963 3,242 3,834 5,274
Gross investment 281 333 474 545 940 1,433Government 62 72 114 134 121 244Nongovernment 219 261 360 411 819 1,189
Net exports of goods and services -52 -105 -393 -197 -175 -985Exports 601 789 1,146 1,555 3,372 4,003Imports 653 894 1,539 1,752 3,547 4,988
GDP at market prices 2,299 2,611 3,431 4,114 5,148 6,526Net income from abroad 1 23 -309 -437 -470 -635 -1,321Net current transfers 1 407 392 488 708 821 1,231Gross national disposable income 2,729 2,694 3,481 4,352 5,334 6,436Gross national saving 403 262 105 460 861 397
Government 16 101 242 244 117 245Nongovernment 387 161 -136 216 744 152
Current account, including transfers 122 -72 -369 -86 -79 -1,036
Consumption 90.0 91.2 97.6 91.5 85.1 93.1Government 6.3 7.7 11.3 12.7 10.7 12.3Nongovernment 83.8 83.5 86.4 78.8 74.5 80.8
Gross investment 12.2 12.8 13.8 10.6 18.3 22.0Government 2.7 2.8 3.3 2.6 2.4 3.7Nongovernment 9.5 10.0 10.5 10.0 15.9 18.2
Net exports of goods and services -2.3 -4.0 -11.5 -4.8 -3.4 -15.1Exports 26.1 30.2 33.4 37.8 65.5 61.3Imports 28.4 34.2 44.9 42.6 68.9 76.4
Net income from abroad 1.0 -11.8 -12.7 -5.4 -12.3 -20.2Net current transfers 17.7 15.0 14.2 8.4 15.9 18.9Gross national disposable income 118.7 103.2 101.5 103.0 103.6 98.6Gross national saving 17.5 10.0 3.1 8.9 16.7 6.1
Government 0.7 3.9 7.0 4.7 2.3 3.7Nongovernment 16.8 6.2 -4.0 4.2 14.4 2.3
Current account, including transfers 5.3 -2.7 -10.8 -2.1 -1.5 -15.9
Sources: Congolese authorities; and IMF staff estimates.1 Including debt relief.
(Billions of Congo francs, unless otherwise indicated)
(In percent of GDP)
Table 6. Democratic Republic of the Congo: Components of Aggregate Demand and Saving, 2003–08

10
2003 2004 2005 2006 2007 2008Est.
Mineral productionCopper 16 19 26 36 237 335
GECAMINES 9 8 16 24 24 23GECAMINES partners 7 11 10 12 213 312
Cobalt 8 10 8 11 41 42Cement 315 417 521 519 530 411Diamonds (millions of carats) 26,981 29,516 35,207 28,540 28,270 20,947
Industrial 7,840 7,870 8,368 2,510 1,047 801Artisanal 19,141 21,646 26,839 26,030 27,223 20,146
Crude oil (millions of barrels) 9 10 9 9 9 8Gold (kilograms) 819 1,202 2,244 230 122 150
Agricultural productionPalm oil 13 13 18 13 16 8Palm kernel oil 1 1 0 0 0 1Robusta coffee 1 1 2 4 8 10Arabica coffee 2 2 4 4 5 4Cocoa 1 1 1 0 1 1Rubber 3 3 6 3 7 …
ForestryLogs 61 93 108 134 213 141Sawn timber 20 35 30 32 36 39
TransportationPort activities (cargo handling) 1,458 1,811 2,071 2,183 2,330 2,287
Sources: Congolese authorities; and IMF staff estimates.
Table 7. Democratic Republic of the Congo: Selected Indicators of Production, 2003–08
(Thousands of tons, unless otherwise indicated)
(Thousands of cubic meters)

11
Table 8. Democratic Republic of the Congo: Manufacturing Output, 2003–08
2003 2004 2005 2006 2007 2008Est.
Food processing Maize flour 13 14 14 14 15 15 Wheat flour 154 185 184 186 179 184 Sugar 74 81 89 91 94 96 Milk 63 57 61 61 63 65 Sweets ... ... ... ... ... ... Butter 1,240 685 ... ... ... ... Animal food 26 25 22 21 22 0 Cigarettes (millions of boxes) 2,462 2,922 3,087 3,048 3,433 3,536 Beer (in millions of liters) 157 203 252 301 295 304 Soft drinks (in millions of liters) 99 130 156 162 130 140
Industrial production Steel 158 145 110 104 110 113 Nonferrous metal 5 5 5 5 5 5
Metal products 187 175 217 241 178 183
Industrial chemicals Explosives 32 30 28 26 27 ... Soaps 17 19 21 24 8 25 Paints, veneer, and enamel 92 101 117 129 39 41 Acetylene 14 8 13 10 7 19 Tires (in thousands of units) 45 49 50 53 55 56
Nonmetallic Cement 331 402 511 530 539 411 Crushed stones 203 205 210 217 230 237 Bottles (in thousands of units) 21 19 19 18 19 21 Oil refinery 0 0 0 0 0 0
Textiles and shoes Cotton fabrics 1,291 263 1,079 852 267 ... Printed fabrics 4,277 4,730 8,514 6,411 5,616 ... Shoes (in thousands of pairs) 2,930 3,393 5,878 1,432 21,178 21,814 Blankets (in thousands of units) 14 14 15 12 12 13
Light industrial productionMetallic furniture 821 616 615 572 763 786Shovels and spades 21 22 23 23 22 23
Transport equipment Shipbuilding 1 3 3 2 4 4 Ship repairs 28 30 28 21 27 28
Sources: Congolese authorities; and IMF staff estimates.
(Thousands of tons, unless otherwise indicated)
(Thousands of square meters, unless otherwise indicated)
(Thousands of units)
(Units)

12
Table 9. Democratic Republic of the Congo: Retail Prices of Petroleum Products, 2003– March 2009 1
(Congo francs per liter )
West region East region West region East region West region East region
2003 313 317 282 310 289 2982004 324 318 284 293 319 3132005 411 486 406 479 409 4842006
January 441 534 439 530 440 532February 441 534 439 530 440 532March 441 534 439 530 440 532April 442 547 439 542 441 545May 451 600 446 590 449 595June 460 600 456 590 458 595July 460 600 456 590 458 595August 489 555 473 545 487 546September 490 554 474 544 488 544October 490 554 474 544 488 544November 505 578 486 572 497 575December 510 585 490 580 500 585
2007January 510 585 490 580 500 585February 510 585 490 580 500 585March 510 585 490 580 500 585April 510 585 490 580 500 585May 580 585 490 580 500 585June 550 635 540 635 545 635July 535 620 525 615 530 620August 535 620 525 615 530 620September 535 620 525 615 530 620October 535 620 525 615 530 620November 610 670 590 660 720 605December 610 670 590 660 720 605
2008January 610 670 590 660 720 605February 675 749 655 735 671 744March 675 749 655 735 671 744April 705 780 680 765 700 775May 790 870 760 850 785 860June 825 855 795 835 820 845July 825 940 795 910 820 930August 825 940 795 910 820 930September 760 860 730 850 750 855October 760 860 730 850 750 855November 665 760 580 745 660 750December 640 750 565 745 635 745
2009January 640 750 565 745 635 745February 665 840 585 810 655 835March 665 840 585 810 655 835
Source: Congolese authorities.1 End-of-period prices.
Premium Gasoline Kerosene Diesel Oil

13
Electricity and Water, 2003–08
2003 2004 2005 2006 2007 2008Est.
Electricity 1
Total production 5,980 6,922 7,128 7,633 7,543 7,495Hydroelectric plants 5,973 6,914 7,119 7,624 7,534 7,486Power stations 7 8 9 9 9 9
Net domestic consumption # 2,893 3,058 3,596 4,507 4,636 5,201
Exports 1,230 1,598 1,707 1,190 1,359 674
Imports 27 21 21 22 21 22
Losses 1,884 2,287 1,846 1,958 1,569 1,642
Water 2
Total production 212 202 226 235 242 236
Domestic consumption 116 134 134 141 139 146
Memorandum items:Electricity subscribers 332,829 353,720 374,611 443,844 512,416 535,604
Average monthly consumption(Kilowatt–hours) 724 720 800 846 754 809
Water subscribers 433,830 445,754 457,678 465,788 479,762 494,154Average monthly consumption
(Cubic meters) 22 25 24 25 24 25
Source: Congolese authorities.1 Société Nationale d'Electricité (SNEL).2 Régie de Distribution d'Eau (REGIDESO).
(Millions of kilowatt-hours)
(Millions of cubic meters, unless otherwise indicated)
Table 10. Democratic Republic of the Congo: Production and Consumption of

14
Table 11. Democratic Republic of the Congo: Consumer Price Index for Kinshasa, 2003–October 2009(Index, August 1995 = 100)
General Inflation 1
Food Rent Clothing Other Index O-p-p Y-o-y Y-t-d
2003 2 423,156 511,283 825,580 697,670 509,754 0.1 4.4 4.4
2004 2 435,200 537,398 859,292 740,379 530,619 4.1 9.5 9.5
2005 2 546,165 622,109 930,811 892,191 644,137 0.6 21.3 21.3
2006 2 697,790 736,670 1,077,902 1,083,425 798,297 0.2 18.2 18.2
2007 2 762,946 817,241 1,128,393 1,213,632 877,842 0.7 10.0 10.0
2008January 775,694 831,727 1,132,624 1,225,731 890,292 1.4 9.7 1.4February 784,511 843,878 1,141,033 1,239,080 900,455 1.1 8.9 2.6March 792,255 855,805 1,146,550 1,249,994 909,302 1.0 8.2 3.6April 810,361 875,826 1,151,285 1,275,926 928,590 2.1 9.3 5.8May 843,104 919,527 1,162,434 1,338,618 967,778 4.2 12.5 10.2June 882,780 978,547 1,198,010 1,391,320 1,012,533 4.6 18.2 15.3July 913,598 1,022,487 1,205,500 1,440,341 1,047,674 3.5 23.4 19.3August 927,356 1,038,038 1,207,907 1,442,131 1,058,750 1.1 24.3 20.6September 935,353 1,047,391 1,209,400 1,433,129 1,063,235 0.4 24.1 21.1October 933,195 1,076,941 1,210,340 1,441,585 1,067,736 0.4 23.9 21.6November 942,304 1,127,521 1,219,001 1,448,062 1,082,049 1.3 24.2 23.3December 976,422 1,222,749 1,248,221 1,459,472 1,119,878 3.5 27.6 27.6
2009January 1,051,070 1,284,389 1,271,571 1,484,137 1,180,297 5.4 32.6 5.4February 1,121,902 1,342,421 1,316,949 1,541,155 1,245,378 5.5 38.3 11.2March 1,193,615 1,429,152 1,396,510 1,578,222 1,312,648 5.4 44.4 17.2April 1,282,100 1,541,655 1,458,776 1,682,792 1,406,405 7.1 51.5 25.6May 1,310,162 1,512,031 1,473,914 1,713,896 1,426,454 1.4 47.4 27.4June 1,293,023 1,443,880 1,462,546 1,705,288 1,404,221 -1.6 38.7 25.4July 1,309,562 1,441,731 1,464,798 1,712,323 1,415,589 0.8 35.1 26.4August 1,340,503 1,504,954 1,500,477 1,755,781 1,453,726 2.7 37.3 29.8September 1,395,080 1,633,261 1,530,306 1,814,199 1,518,097 4.4 42.8 35.6October 1,468,301 1,746,423 1,554,183 1,895,408 1,638,006 7.9 53.4 46.3
Source: Congolese authorities.1 O-p-p = over-previous-period i.e. monthly inflation; Y-o-y = year-on-year i.e. twelve-month inflation; Y-t-d = year-to-date i.e. change in prices from the beginning-of-the-year.2 Indices are for end-of-period.

15
2003 2004 2005 2006 2007 2008Est.
Total revenue and grants 223,323 299,357 564,898 857,205 837,001 1,326,773Total revenue 176,817 248,003 388,956 528,698 760,987 1,205,289
Income and profit taxes 34,401 53,076 54,763 128,774 161,371 253,100Taxes on goods and services 52,149 72,071 107,218 146,301 192,774 282,866Taxes on international trade 53,549 83,818 119,554 163,805 239,333 342,528
Import duties and taxes 48,411 77,464 110,408 154,045 230,596 326,240Export duties and taxes 5,137 6,354 9,146 9,759 8,737 16,288
Other revenue 36,717 39,038 107,421 89,818 167,509 326,795Grants 46,506 51,354 175,942 328,507 76,014 121,484
Expenditure 236,160 398,974 668,396 840,866 966,653 1,478,682Wages and salaries 57,104 93,223 146,776 218,898 300,984 452,220Goods and services 94,377 119,855 143,842 133,194 203,685 277,694Transfers and subsidies 19,867 26,590 43,937 87,102 111,730 226,871Interest payments 1 2,967 86,849 150,780 95,916 184,134 203,775Exceptional expenditure 0 398 97,071 171,706 45,034 74,417Investment 61,756 72,059 113,878 134,050 121,085 243,706Net lending 89 0 0 0 0 0
Overall balance (commitment) -12,837 -99,617 -103,498 16,339 -129,651 -151,908Primary balance (commitment) -9,870 -12,768 47,282 112,255 54,483 51,866
Change in arrears 4,176 -1,350 -203,238 -6,587 -11,258 -15,607Central bank operating result -18,430 -19,076 -15,102 -20,072 -19,878 -35,831
Overall balance (cash) -27,091 -108,643 -322,001 10,831 -160,787 -203,346
Financing 27,091 108,643 322,001 -10,831 160,787 203,346Domestic financing (net) 27,751 215 261,077 43,521 48,562 58,690External financing 48,258 65,961 85,059 -127,974 155,361 119,359Residual financing gap/errors and omissions -48,918 42,467 -24,135 73,622 -43,136 25,297
Memorandum items:
Revenue (excl. grants) / total expenditure 74.9 62.2 58.2 62.9 78.7 81.5Wage bill / revenue (excl. grants) 32.3 37.6 37.7 41.4 39.6 37.5
Sources: Congolese authorities; and IMF staff estimates.1 Scheduled interest payments excluding interest on arrears.
(Millions of Congo francs)
Table 12. Democratic Republic of the Congo: Central Government Operations, 2003–08
(Percent)

16
Table 13. Democratic Republic of the Congo: Central Government Revenue, 2003–08
2003 2004 2005 2006 2007 2008Est.
Total revenue (excl. grants) 176,817 248,003 388,956 528,698 760,987 1,205,289
Taxes on income and profits 34,401 53,076 54,763 128,774 161,371 253,100 Corporations and enterprises 16,944 32,087 26,465 79,076 89,408 147,790 Individuals 14,604 18,324 24,243 40,756.5 58,107.3 85,601.0 Dividends and interest 0 0 2 4 30 27 Rental income 1,189 1,373 1,988 2,176 0 2,198 Other 1,665 1,291 2,065 6,762 13,826 17,484
Taxes on goods and services 52,149 72,071 107,218 146,301 192,774 282,866 Turnover taxes 31,827 49,466 79,573 110,056 150,917 221,628 Domestic turnover tax 22,603 32,817 52,315 67,532 110,251 147,816 Turnover tax on imports 9,224 16,650 27,257 42,524 40,665 73,811 Selective excises 19,945 22,207 27,067 35,543 40,406 59,431 Beer 5,854 6,640 6,791 13,804 16,911 26,771 Tobacco products 5,617 6,247 6,519 11,040 11,985 20,146 Other excises 8,473 9,320 13,757 10,699 11,510 12,514
Others 377 398 579 702 1,451 1,807
Taxes on international trade 53,549 83,818 119,554 163,805 239,333 342,528 Import duties and taxes 48,411 77,464 110,408 154,045 230,596 326,240 Import duties 47,461 75,483 107,984 154,009 230,549 326,168 Statistical tax, penalties 951 1,981 2,424 36 47 72 Export duties and taxes 5,120 6,325 9,039 9,630 8,679 16,288 Export duties 3,690 4,397 6,820 5,586 6,796 11,100 Turnover tax 458 344 2 0 0 0 Statistical tax, penalties 971 1,584 2,217 4,045 1,883 5,188 Others 18 28 107 129 58 0
Other revenue 36,717 39,038 107,421 89,818 167,509 326,795
Taxes on income and profits 19.5 21.4 14.1 24.4 21.2 21.0 Taxes on goods and services 29.5 29.1 27.6 27.7 25.3 23.5 Taxes on international trade 30.3 33.8 30.7 31.0 31.5 28.4 Other revenue 20.8 15.7 27.6 17.0 22.0 27.1
Total revenue (excl. grants) 7.7 9.5 11.3 12.9 14.8 18.5 Taxes on income and profits 1.5 2.0 1.6 3.1 3.1 3.9 Taxes on goods and services 2.3 2.8 3.1 3.6 3.7 4.3 Taxes on international trade 2.3 3.2 3.5 4.0 4.6 5.2 Other revenue 1.6 1.5 3.1 2.2 3.3 5.0
Memorandum item:GDP (Millions of Congo francs) 2,298,656 2,610,895 3,430,533 4,113,980 5,148,173 6,525,983
Sources: Congolese authorities; and IMF staff estimates.
(Millions of Congo francs)
(Percent of total)
(Percent of GDP)

17
Table 14. Democratic Republic of the Congo: Central Government Expenditure, 2003–08
2003 2004 2005 2006 2007 2008Est.
(Millions of Congo francs)
Total budget expenditure 236,160 398,974 696,283 840,866 966,653 1,478,682
Wages and salaries 57,104 93,223 146,776 218,898 300,984 452,220Goods and services (incl. off-budget) 94,377 119,855 143,842 133,194 203,685 277,694Transfers and subsidies 19,867 26,590 43,937 87,102 111,730 226,871Interest on domestic debt 2,967 7,592 17,761 22,921 28,721 34,225Interest on external debt 1 0 79,257 133,020 72,995 155,413 169,550Exceptional expenditure 0 398 97,071 171,706 45,034 74,417Investment 61,756 72,059 113,878 134,050 121,085 243,706Net lending 89 0 0 0 0 0
(Percent of total)
Wages and salaries 24.2 23.4 21.1 26.0 31.1 30.6Goods and services (incl. off-budget) 40.0 30.0 20.7 15.8 21.1 18.8Transfers and subsidies 8.4 6.7 6.3 10.4 11.6 15.3Interest on domestic debt 1.3 1.9 2.6 2.7 3.0 2.3Interest on external debt 0.0 19.9 19.1 8.7 16.1 11.5Exceptional expenditure 0.0 0.1 13.9 20.4 4.7 5.0Investment 26.2 18.1 16.4 15.9 12.5 16.5Net lending 0.0 0.0 0.0 0.0 0.0 0.0
(Percent of GDP)
Wages and salaries 2.5 3.6 4.3 5.3 5.8 6.9Goods and services (incl. off-budget) 4.1 4.6 4.2 3.2 4.0 4.3Transfers and subsidies 0.9 1.0 1.3 2.1 2.2 3.5Interest on domestic debt 0.1 0.3 0.5 0.6 0.6 0.5Interest on external debt 0.0 3.0 3.9 1.8 3.0 2.6Exceptional expenditure 0.0 0.0 2.8 4.2 0.9 1.1Investment 2.7 2.8 3.3 3.3 2.4 3.7Net lending 0.0 0.0 0.0 0.0 0.0 0.0
Memorandum item:GDP (Millions of Congo francs) 2,298,656 2,610,895 3,430,533 4,113,980 5,148,173 6,525,983
Sources: Congolese authorities; and IMF staff estimates.1 Scheduled interest payments excluding interest on arrears.

18
2003 2004 2005 2006
Total number of government employeesCivil servants 533,960 599,553 576,533 611,393 Army 182,553 318,227 352,271 244,259 Police 60,000 92,318 114,286 103,803
Wage bill 54.0 94.9 136.1 234.3Civil servants 26.0 52.0 88.0 142.0Members of political institutions 6.3 10.5 16.9 31.9Army 17.1 24.9 23.4 41.0Police 4.6 7.5 7.8 19.4
Annual change in government employees 34.2 12.3 -3.8 6.0Annual change in the wage bill 23.6 75.7 43.4 72.2
Source: Congolese authorities.
Table 15. Democratic Republic of the Congo: Government Labor Force and Wage Bill, 2003–06
(Annual percentage change)
(Billions of Congo francs)

19
2003 2004 2005 2006
Public sector (without transport allowances)Category 1 7,980 7,980 7,980 7,980 Category 2 7,341 7,341 7,341 7,341 Category 3 6,703 6,703 6,703 6,703 Category 4 6,463 6,463 6,463 6,463 Category 5 5,745 5,745 5,745 5,745 Category 6 3,830 3,830 3,830 3,830 Category 7 3,020 3,020 3,020 3,020 Category 8 2,394 2,394 2,394 2,394 Category 9 1,995 1,995 1,995 1,995 Category 10 1,676 1,676 1,676 1,676 Category 11 1,436 1,436 1,436 1,436 Category 12 798 798 798 798
Public sector (with transport allowances)Category 1 12,420 17,182 17,182 17,182 Category 2 11,781 16,543 16,543 16,543 Category 3 11,143 15,905 15,905 15,905 Category 4 10,903 15,665 15,665 15,665 Category 5 10,185 14,947 14,947 14,947 Category 6 8,270 13,032 13,032 13,032 Category 7 7,460 12,222 12,222 12,222 Category 8 6,834 11,596 11,596 11,596 Category 9 6,435 11,197 11,197 11,197 Category 10 6,116 10,878 10,878 10,878 Category 11 5,876 10,638 10,638 10,638 Category 12 5,238 10,000 10,000 10,000
Source: Congolese authorities.
Table 16. Democratic Republic of the Congo: Wage Scale, 2003–06
(Millions of Congo francs)

20
Enterprise Acronym Activity
Mining1. Générale des Carrières et des Mines GECAMINES Mining2. Sté de devpt Indust. & Min. du Congo SODIMICO Gold mining3. Off. Mines d'Or de Kilo-Moto OKIMO Mining4. Entreprise Minière de Kisenge EMK'Mn Mining5. Centre d'Expertise, d'Evaluation et C.E.E.C Diamond certifying agency
de Certification des substances minières
Energy6. La Congolaise des hydrocarbures COHYDRO Oil7. Régie de Distribution d'eau REGIDESO Water company8. Société Nationale d'Electricité SNEL Electricity company
Industry9. Société d'Exploit. Sidérurgique SOSIDER Steel company10. Sté Africaine d'Explosifs AFRIDEX Explosives company
Agriculture, forestry, and livestock11. Cacaoyer de Bulu CACAOCO Cocoa12. Palmeraies de Gosuma PALMECO Palm oil13. Caisse de Stabilisation Cotonnière CSCO Cotton board14. Office National du Café ONC Coffee board15. Office National d'Elevage ONDE Husbandry16. Cotonnière du Congo COTONCO Cotton company17. Complexe Sucrier de Lotokila CSL Sugar company18. Réserves Stratégiques Générales R.S.G.
Transport19. Lignes Aériennes Congolaises LAC National airline20. Cie Maritime du Congo CMDC Maritime transport21. Sté National; de Chemin de Fer du Congo SNCC Railways22. Sté de Chemin de Fer des Uélés CFU Railways23. Office National de Transports ONATRA Transport24. Régie des Voies Aériennes RVA Airport security25. Régie des Voies Maritimes RVM Maritime transport26. Régie des Voies Fluviales RVF Waterways management27. City-Train CITYTRAIN Transport
Post and telecommunications28. Office Congolais de Postes et Télécommunications OCPT Telecommunications29. Agence Congolaise de Presse ACP Press agency30. Radio Télévision Nationale Congolaise RTNC Broadcasting31. Régie Nationale de Télécom par Satélite RENATELSAT Telecommunications
Financial and social security32. Caisse Générale d'Epargne du Congo CADECO Savings institution33. Office de Gest° Dettes Publiques OGEDEP Debt management agency34. Sté Nationale d'Assurances SONAS Insurance35. Institut Nat. De Sécurité Sociale INSS Social security36. Office des Douanes et Acciises OFIDA Customs administration37. Fonds des Promotions de l'Industrie FPI Promotion of industrial activity
Table 17. Democratic Republic of the Congo: Sectoral Distribution of State-Owned Enterprises

21
Enterprise Acronym Activity Service38. Office de Gestion de Frêt Maritime OGEFREM Maritime freight agency39. Office des Petites et Moyennes Entrep. OPEC Small enterprises agency40. Office des Biens Mal Acquis OBMA Agency managing recovered properties41. Office Congolais de Contrôle OCC Standard control agency42. Office National de Tourisme ONT Tourism agency43. Régie National d'Approvi.et d'Impr. RENAPI Office supply44. Hôtel Karavia KARAVIA Hotel
Commerce45. Foire Internationale de Kinshasa FIKIN Trade promotion
Construction46. Office des Routes OR Road maintenance47. Office des Voiries et Drainage OVD Sewage
Medical48. Fonds National Médico-Sanitaire FONAMES Health Fund
Recherche49. Institut National des Statistiques INS Statistics institute50. Institut Nat. d'Etudes & Rech. Agro INERA Research institute51. Télédétection par Satélite METELSAT Survey by satelite
Conservation de la Nature52. Inst. Congolais de Conserv de la nature ICCN Conservation of environment 53. Inst. des Jardins Zoo. & Botan. Congo IJZBC Zoo and botanical institute54. Inst.des Musées Nationaux du Congo IMNC Museum institute
Formation55. Institut National de Préparation Professionnelle INPP Training institute
Source: Congolese authorities.
(concluded)Table 17. Democratic Republic of the Congo: Sectoral Distribution of State-Owned Enterprises

22
2003 2004 2005 2006 2007 2008Est.
Net foreign assets -258,995 -281,772 -273,877 -304,708 -172,601 -210,999
Net domestic assets 389,113 503,998 550,989 744,932 831,435 1,252,376Net domestic credit 49,205 68,866 148,037 246,720 373,351 724,294
Net credit to government 29,582 27,212 84,567 132,088 176,212 248,900Credit to the private sector 19,395 39,854 63,025 112,460 195,223 472,265Credit to parastatals 228 1,799 444 2,171 1,916 3,130
Other items, net 339,908 435,133 402,952 498,211 458,084 528,082
Broad money (M2) 124,503 215,270 267,292 428,794 641,237 998,445
Narrow money (M1) 72,110 117,078 138,893 212,690 300,273 392,484Currency in circulation 63,148 101,467 119,935 181,886 233,253 304,568Demand deposits 8,962 15,611 18,958 30,804 67,020 87,916
Quasi money 52,393 98,192 128,399 216,104 340,964 605,961Time deposits in domestic currency 321 362 381 429 2,500 1,306Foreign currency deposits 52,071 97,830 128,018 215,675 338,464 604,656
Import deposits 5,616 6,956 9,819 11,430 17,597 42,932
Net foreign assets -39.0 -18.3 3.7 -11.5 30.8 -6.0
Net domestic assets 72.2 92.3 21.8 72.6 20.2 65.6Net domestic credit 34.9 15.8 36.8 36.9 29.5 54.7
Net credit to government 29.0 -1.9 26.6 17.8 10.3 11.3Credit to the private sector 6.6 16.4 10.8 18.5 19.3 43.2Credit to parastatals -0.6 1.3 -0.6 0.6 -0.1 0.2
Other items, net 37.3 76.5 -14.9 35.6 -9.4 10.9
Broad money (M2) 32.3 72.9 24.2 60.4 49.5 55.7Narrow money (M1) 15.1 36.1 10.1 27.6 20.4 14.4
Currency in circulation 14.2 30.8 8.6 23.2 12.0 11.1Demand deposits 0.9 5.3 1.6 4.4 8.4 3.3
Quasi money 17.2 36.8 14.0 32.8 29.1 41.3Time deposits in domestic currency 0.2 0.0 0.0 0.0 0.5 -0.2Foreign currency deposits 17.0 36.8 14.0 32.8 28.6 41.5
Import deposits 0.9 1.1 1.3 0.6 1.4 4.0
Memorandum items:
Velocity (GDP/ broad money) 18.5 12.1 12.8 9.6 8.0 6.5Net foreign assets (US$ Millions) -695.3 -634.5 -635.0 -630.9 -343.2 -331.0
Of which : central bank -791.6 -782.7 -829.6 -854.8 -662.6 -609.1
Source: Congolese authorities.
broad money, unless otherwise indicated)
Table 18. Democratic Republic of the Congo: Monetary Survey, 2003–08
(Millions of Congo francs)
(Annual change in percent of beginning-of-period

23
2003 2004 2005 2006 2007 2008Est.
Net foreign assets -294,888 -347,579 -357,785 -433,605 -333,265 -390,062Foreign assets 36,414 104,915 56,589 77,783 90,864 49,733Foreign liabilities 331,302 452,494 414,374 511,388 424,129 439,794
Net domestic assets 370,038 470,261 495,988 644,919 621,728 773,772Net domestic credit 42,490 52,163 123,247 178,823 206,618 295,189
Net credit to government 36,900 38,382 103,278 163,131 198,728 272,446Gross credit to government 60,984 150,513 158,578 175,608 202,164 273,281Government deposits 42,490 52,163 55,300 12,477 3,435 3,998
Credit to commercial banks 3,901 12,604 19,964 14,771 4,403 19,714Credit to parastatals 0 0 0 1 1 1Credit to the private sector 1,689 1,176 5 919 3,485 3,028
Other items, net 327,549 418,098 372,741 466,096 415,110 478,584
Assets = Liabilities 410,122 551,540 519,925 684,651 708,479 867,901
Monetary base 75,151 122,684 138,203 211,313 288,463 383,705Currency in circulation 65,897 105,889 123,794 185,334 243,785 320,274
In bank vaults 2,748 4,421 3,859 3,448 10,532 15,706Outside banks 63,148 101,467 119,935 181,886 233,253 304,568
Banks' deposits 1,476 5,790 5,261 18,415 38,740 56,226Parastatals' deposits 86 193 89 207 417 678Private sector deposits 270 53 78 117 615 914
Foreign currency deposits 3,964 6,071 5,620 4,424 1,946 2,705
Import deposits 3,459 4,688 3,361 2,818 2,960 2,908
Source: Congolese authorities.
Table 19. Democratic Republic of the Congo: Central Bank Accounts, 2003–08
(Millions of Congo francs)
24
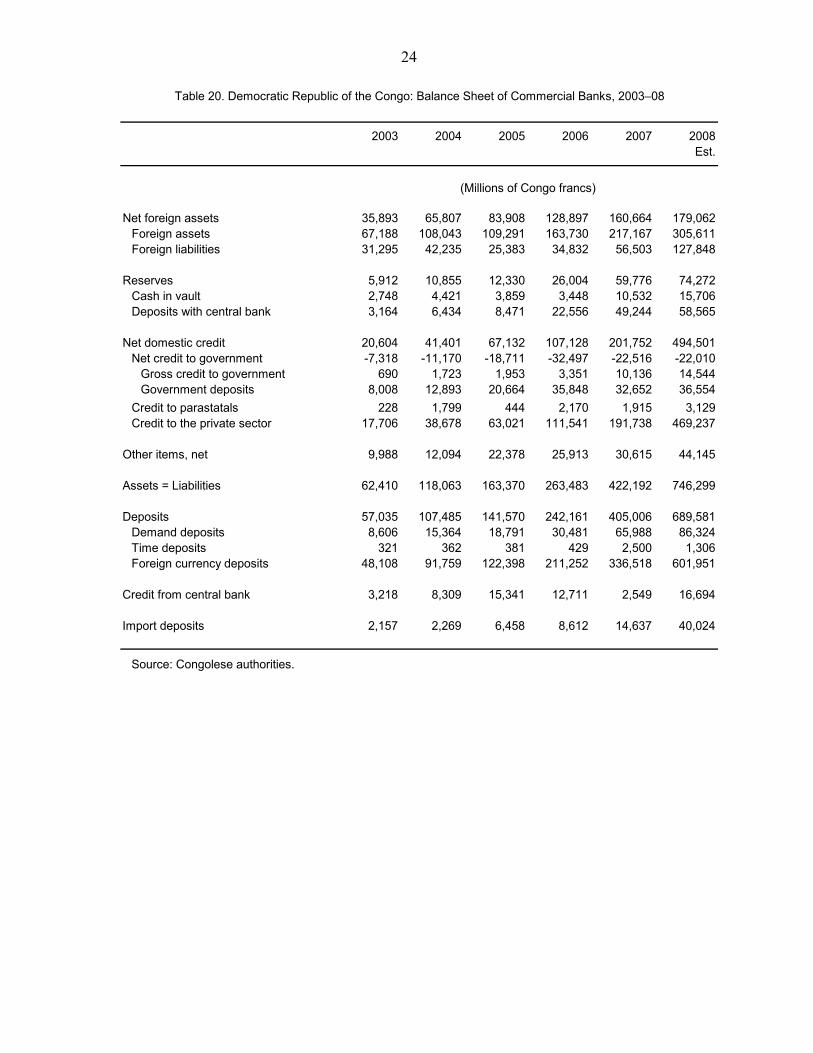
2003 2004 2005 2006 2007 2008Est.
Net foreign assets 35,893 65,807 83,908 128,897 160,664 179,062Foreign assets 67,188 108,043 109,291 163,730 217,167 305,611Foreign liabilities 31,295 42,235 25,383 34,832 56,503 127,848
Reserves 5,912 10,855 12,330 26,004 59,776 74,272Cash in vault 2,748 4,421 3,859 3,448 10,532 15,706Deposits with central bank 3,164 6,434 8,471 22,556 49,244 58,565
Net domestic credit 20,604 41,401 67,132 107,128 201,752 494,501Net credit to government -7,318 -11,170 -18,711 -32,497 -22,516 -22,010
Gross credit to government 690 1,723 1,953 3,351 10,136 14,544Government deposits 8,008 12,893 20,664 35,848 32,652 36,554
Credit to parastatals 228 1,799 444 2,170 1,915 3,129Credit to the private sector 17,706 38,678 63,021 111,541 191,738 469,237
Other items, net 9,988 12,094 22,378 25,913 30,615 44,145
Assets = Liabilities 62,410 118,063 163,370 263,483 422,192 746,299
Deposits 57,035 107,485 141,570 242,161 405,006 689,581Demand deposits 8,606 15,364 18,791 30,481 65,988 86,324Time deposits 321 362 381 429 2,500 1,306Foreign currency deposits 48,108 91,759 122,398 211,252 336,518 601,951
Credit from central bank 3,218 8,309 15,341 12,711 2,549 16,694
Import deposits 2,157 2,269 6,458 8,612 14,637 40,024
Source: Congolese authorities.
Table 20. Democratic Republic of the Congo: Balance Sheet of Commercial Banks, 2003–08
(Millions of Congo francs)

25
Table 21. Democratic Republic of the Congo: List of Commercial Banks
Date of establishment
Capital and reserves (US$
Millions) GovernmentPrivate sector
(domestic)Private sector
(foreign)
Market share, 2006
Number of branches,
2006
1 Banque Commerciale du Congo (BCDC) 3/1/90 17,849 26 49 26 24 112 Afriland First Bank Congo Démocratique 3/3/05 660 0 6 94 1 13 Banque Congolaise 7/6/94 16,957 10 39 51 15 144 Banque Internationale pour l’Afrique au Congo (BIAC) 5/24/05 5,370 0 0 100 9 65 Procrédit BankCongo 8/10/05 3,321 0 0 100 3 26 Banque Internationale de Crédit (BIC) 11/30/70 7,083 0 0 100 11 57 Citigroup 1/1/70 4,902 0 0 100 8 18 Access Bank ex Banque Privée du Congo 6/7/05 0 10 90 0 19 Rawbank 11/21/01 12,413 0 14 86 7 310 Stanbic Bank 3/21/93 5,998 0 0 100 15 111 Trust Mechant Bank 12/12/03 8,874 0 0 100 7 412 Société Financière de Banque 1 9/8/06 3,000 0 4 96 0 …13 Mining Bank Congo 1 7/13/06 1,500 0 0 100 0 …14 Invest Bank Congo 1 7/13/06 2,000 0 12 88 0 …15 Solidaire Banque Internationale 5/12/06 2,000 0 28 72 0 …16 La Cruche Banque 12/12/05 1,600 0 100 0 0 …17 First International Bank (FIB) 9/28/07 … 0 3.5 96.5 … …18 Ecobank Congo 9/28/07 … 0 0.2 99.8 … …
Source: Congolese authorities.1 Licensed but not yet operational banks.
Involvement (Percent of capital)

26 Corrected: 2/26/10
2003 2004 2005 2006 2007 2008Est.
Agriculture 2,130 3,480 5,728 7,458 8,459 18,476Mining 3,879 5,298 4,341 10,059 15,185 20,723Manufacturing 4,247 5,123 4,374 7,794 9,639 27,130Construction 821 2,339 2,361 2,136 7,637 8,407Energy 185 1,405 123 4,903 3,955 9,751Transports 1,973 2,497 11,632 12,859 18,687 36,510Distribution 4,571 6,966 12,547 18,408 23,534 77,785Trade ... ... ... 244 284 1,455
Imports ... ... ... 242 269 828Exports ... ... ... 2 14 628
Other 8,265 16,089 22,519 62,538 112,300 291,658Total 26,071 43,197 63,625 126,399 199,679 491,896
Agriculture 8.2 8.1 9.0 5.9 4.2 3.8Mining 14.9 12.3 6.8 8.0 7.6 4.2
Manufacturing 16.3 11.9 6.9 6.2 4.8 5.5
Construction 3.1 5.4 3.7 1.7 3.8 1.7
Energy 0.7 3.3 0.2 3.9 2.0 2.0
Transportation 7.6 5.8 18.3 10.2 9.4 7.4
Distribution 17.5 16.1 19.7 14.6 11.8 15.8
Trade … … … 0.2 0.1 0.3Imports … … … 0.2 0.0 0.2Exports … … … … … …
Other 31.7 37.2 35.4 49.5 56.2 59.3
Source: Congolese authorities.
Table 22. Democratic Republic of the Congo: Distribution of Commercial Banks' Credits by Sector, 2003–08
(Millions of Congo francs)
(Percent of total)

27
2003 2004 2005 2006 2007 2008Est.
Assets of commercial banking system 67,188 108,043 109,291 163,730 217,167 305,611Loans of commercial banks 31,295 42,235 25,383 34,832 56,503 127,848
Deposits of commercial banks 57,035 107,988 141,570 238,518 405,006 690,867Congo francs 8,927 16,198 19,172 29,867 68,488 89,303Foreign exchange 48,108 91,790 122,398 208,651 336,518 601,564
(Percent of GDP)
Assets of commercial banking system 2.9 4.1 3.2 4.0 4.2 4.7Loans of commercial banks 1.4 1.6 0.7 0.8 1.1 2.0
Deposits of commercial banks 2.5 4.1 4.1 5.8 7.9 10.6
(Percent per annum)
Lending ratesCentral Bank of the Congo
Rediscount 8 14 29 40 23 40Money market 8 14 34 50 28 43Advances 15 18 34 50 28 43
Commercial banksShort-term credit 28 28 63 48 41 44Medium-term credit 28 28 63 48 41 44
Memorandum items:Broad money (Billions of Congo francs) 125 215 267 429 641 998
Percent of GDP 5 8 8 10 12 15Currency in circulation (Billions of Congo francs) 63 101 120 182 233 305
Percent of GDP 3 4 3 4 5 5Percent of broad money 51 47 45 42 36 31
Nominal GDP (Billions of Congo francs) 2,299 2,611 3,431 4,114 5,148 6,526
Source: Congolese authorities.
Table 23. Democratic Republic of the Congo: Developments in the Commercial Banking System, 2003–08
(CGF Millions, end of period)
28
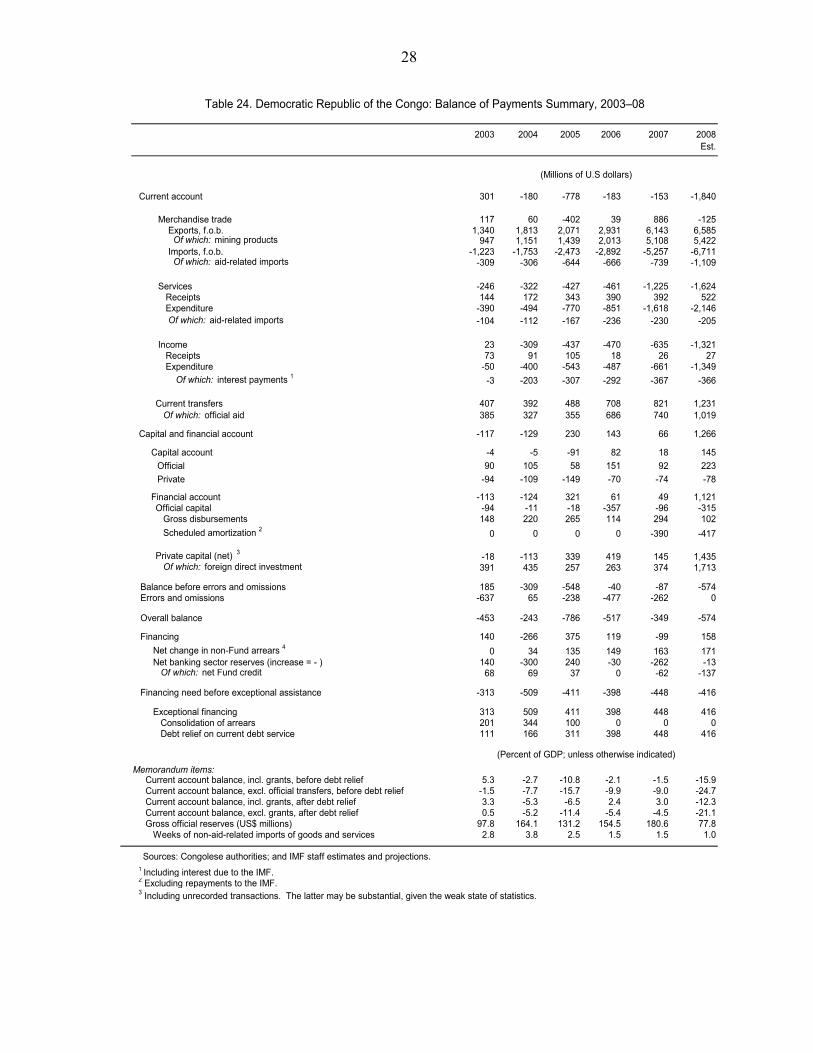
2003 2004 2005 2006 2007 2008Est.
Current account 301 -180 -778 -183 -153 -1,840
Merchandise trade 117 60 -402 39 886 -125 Exports, f.o.b. 1,340 1,813 2,071 2,931 6,143 6,585 Of which: mining products 947 1,151 1,439 2,013 5,108 5,422 Imports, f.o.b. -1,223 -1,753 -2,473 -2,892 -5,257 -6,711 Of which: aid-related imports -309 -306 -644 -666 -739 -1,109
Services -246 -322 -427 -461 -1,225 -1,624 Receipts 144 172 343 390 392 522 Expenditure -390 -494 -770 -851 -1,618 -2,146 Of which: aid-related imports -104 -112 -167 -236 -230 -205
Income 23 -309 -437 -470 -635 -1,321 Receipts 73 91 105 18 26 27 Expenditure -50 -400 -543 -487 -661 -1,349 Of which: interest payments 1 -3 -203 -307 -292 -367 -366
Current transfers 407 392 488 708 821 1,231 Of which: official aid 385 327 355 686 740 1,019
Capital and financial account -117 -129 230 143 66 1,266
Capital account -4 -5 -91 82 18 145Official 90 105 58 151 92 223Private -94 -109 -149 -70 -74 -78
Financial account -113 -124 321 61 49 1,121 Official capital -94 -11 -18 -357 -96 -315 Gross disbursements 148 220 265 114 294 102 Scheduled amortization 2 0 0 0 0 -390 -417
Private capital (net) 3 -18 -113 339 419 145 1,435 Of which: foreign direct investment 391 435 257 263 374 1,713
Balance before errors and omissions 185 -309 -548 -40 -87 -574 Errors and omissions -637 65 -238 -477 -262 0
Overall balance -453 -243 -786 -517 -349 -574
Financing 140 -266 375 119 -99 158 Net change in non-Fund arrears 4 0 34 135 149 163 171 Net banking sector reserves (increase = - ) 140 -300 240 -30 -262 -13 Of which: net Fund credit 68 69 37 0 -62 -137
Financing need before exceptional assistance -313 -509 -411 -398 -448 -416
Exceptional financing 313 509 411 398 448 416 Consolidation of arrears 201 344 100 0 0 0 Debt relief on current debt service 111 166 311 398 448 416
Memorandum items: Current account balance, incl. grants, before debt relief 5.3 -2.7 -10.8 -2.1 -1.5 -15.9 Current account balance, excl. official transfers, before debt relief -1.5 -7.7 -15.7 -9.9 -9.0 -24.7 Current account balance, incl. grants, after debt relief 3.3 -5.3 -6.5 2.4 3.0 -12.3 Current account balance, excl. grants, after debt relief 0.5 -5.2 -11.4 -5.4 -4.5 -21.1 Gross official reserves (US$ millions) 97.8 164.1 131.2 154.5 180.6 77.8 Weeks of non-aid-related imports of goods and services 2.8 3.8 2.5 1.5 1.5 1.0
Sources: Congolese authorities; and IMF staff estimates and projections.1 Including interest due to the IMF.2 Excluding repayments to the IMF.3 Including unrecorded transactions. The latter may be substantial, given the weak state of statistics.
Table 24. Democratic Republic of the Congo: Balance of Payments Summary, 2003–08
(Millions of U.S dollars)
(Percent of GDP; unless otherwise indicated)

29
2003 2004 2005 2006 2007 2008Est.
Total exports, f.o.b. 1,340 1,813 2,071 2,931 6,143 6,585Of which : parallel exports 289 341 290 221 248 207
Volume (2002 = 100) 100 116 108 139 243 233Unit value (2002 = 100) 124 145 178 197 235 263 Copper 19 60 113 869 2,040 2,333 Volume (thousands of tons) 11 22 29 123 279 335 Unit value (US$ per ton) 1,808 2,708 3,885 7,072 7,132 6,963 Cobalt 102 250 260 373 2,310 2,523 Volume (thousands of tons) 4 5 15 11 36 42 Unit value (US$ per ton) 23,883 54,346 17,862 34,385 64,586 59,415
Gold 1 10 10 6 3 9 17 Volume (tons) 1 1 0 0 1 1 Unit value (US$ millionsdollars per ton) 11 13 14 16 17 27
Diamonds 1 816 828 1,060 884 836 702 Volume (millions of carats) 34 33 39 37 37 27 Unit value (US$ per carat) 24 25 27 24 23 20 Crude oil 251 360 453 579 612 783 Volume (millions of barrels) 9 10 9 9 9 8 Unit value (US$ per barrel) 27 36 49 61 70 95
Coffee 1 13 16 20 46 52 59 Volume (thousands of tons) 11 14 5 13 16 15 Unit value (US$ per ton) 1,095 1,195 4,215 3,413 3,196 3,828
Other exports 130 288 159 178 284 169
Sources: Congolese authorities; and IMF staff estimates.1 Includes parallel-market exports.
Table 25. Democratic Republic of the Congo: Composition of Commodity Exports, 2003–08
(Values in US$ Millions; volumes and unit values as indicated)

30
2003 2004 2005 2006 2007 2008Est.
Imports, total Value, f.o.b. 1,223 1,753 2,473 2,892 5,257 6,711 Volume index (2002 = 100) 104 137 182 208 332 387 Unit value index (2002 = 100) 114 124 132 135 153 168
Oil products Value, f.o.b. 75 130 316 486 571 778 Volume index (2002 = 100) 124 160 281 360 382 381 Unit value index (2002 = 100) 116 154 214 257 285 389
Non-oil Value, f.o.b. 1,148 1,623 2,157 2,405 4,686 5,933 Volume index (2002 = 100) 57 76 98 111 183 215 Unit value index (2002 = 100) 114 122 125 123 132 142
Aid-related imports 309 306 644 666 594 1,042Non-aid-related imports 915 1,447 1,829 2,226 4,663 5,669
Imports Oil 6.1 7.4 12.8 16.8 10.9 11.6 Non-oil 93.9 92.6 87.2 83.2 89.1 88.4
Aid-related imports 25.2 17.5 26.1 23.0 11.3 15.5Non-aid-related imports 74.8 82.5 73.9 77.0 88.7 84.5
Sources: Congolese authorities; and IMF staff estimates.
Table 26. Democratic Republic of the Congo: Composition of Imports, 2003–08
(Percent of total imports)
(Values in US$ Millions; volumes and unit values as indicated)

31
2003 2004 2005 2006 2007 2008Est.
Merchandise exports
Value, U.S. dollars 124 145 178 197 235 263 (percent change) 24.4 16.9 22.5 10.3 19.8 11.5
Volume index 100 116 108 139 243 233 (percent change) 0.1 15.7 -3.4 28.3 75.0 -3.9
Unit values, U.S. dollars 124 145 178 197 235 263 (percent change) 24.4 16.9 12.4 10.3 19.8 11.5
Merchandise imports
Value, U.S. dollars 119 170 240 280 510 651 (percent change) 18.7 43.3 20.6 16.9 81.8 27.6
Volume 104 137 182 208 332 387 (percent change) 4.2 31.9 12.7 14.6 59.7 16.5
Unit values, U.S. dollars 114 124 132 135 153 168 (percent change) 13.9 8.7 8.1 2.0 9.6 9.6
Terms of trade 109 118 135 146 153 156 (percent change) 9.3 7.6 4.0 8.1 5.2 1.7
Sources: Congolese authorities; and IMF staff estimates.
Table 27. Democratic Republic of the Congo: Foreign Trade Indicators, 2003–08
(Index, 2002 = 100, unless otherwise indicated)
32
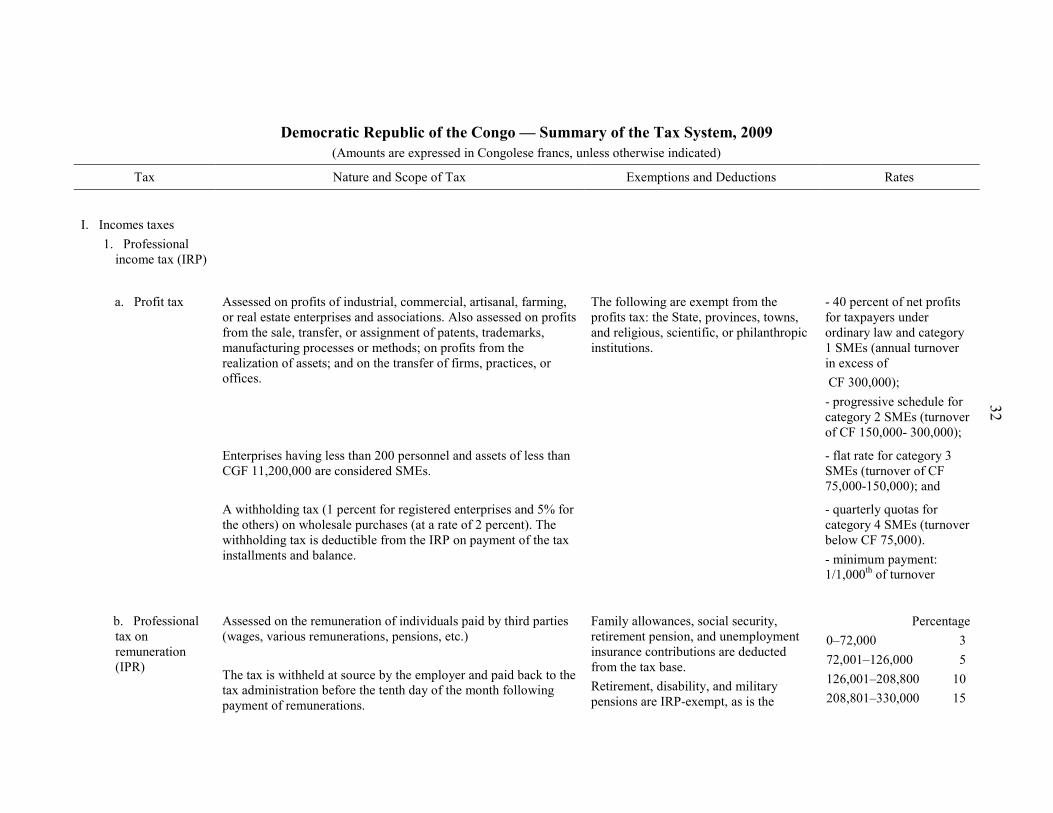
Democratic Republic of the Congo — Summary of the Tax System, 2009 (Amounts are expressed in Congolese francs, unless otherwise indicated)
Tax Nature and Scope of Tax Exemptions and Deductions Rates
I. Incomes taxes 1. Professional
income tax (IRP)
a. Profit tax Assessed on profits of industrial, commercial, artisanal, farming, or real estate enterprises and associations. Also assessed on profits from the sale, transfer, or assignment of patents, trademarks, manufacturing processes or methods; on profits from the realization of assets; and on the transfer of firms, practices, or offices.
The following are exempt from the profits tax: the State, provinces, towns, and religious, scientific, or philanthropic institutions.
- 40 percent of net profits for taxpayers under ordinary law and category 1 SMEs (annual turnover in excess of CF 300,000); - progressive schedule for category 2 SMEs (turnover of CF 150,000- 300,000);
Enterprises having less than 200 personnel and assets of less than CGF 11,200,000 are considered SMEs.
- flat rate for category 3 SMEs (turnover of CF 75,000-150,000); and
A withholding tax (1 percent for registered enterprises and 5% for the others) on wholesale purchases (at a rate of 2 percent). The withholding tax is deductible from the IRP on payment of the tax installments and balance.
- quarterly quotas for category 4 SMEs (turnover below CF 75,000). - minimum payment: 1/1,000th of turnover
b. Professional tax on remuneration (IPR)
Assessed on the remuneration of individuals paid by third parties (wages, various remunerations, pensions, etc.) The tax is withheld at source by the employer and paid back to the tax administration before the tenth day of the month following payment of remunerations.
Family allowances, social security, retirement pension, and unemployment insurance contributions are deducted from the tax base. Retirement, disability, and military pensions are IRP-exempt, as is the
Percentage 0–72,000 3 72,001–126,000 5 126,001–208,800 10 208,801–330,000 15
33
Democratic Republic of the Congo — Summary of the Tax System, 2009 (Amounts are expressed in Congolese francs, unless otherwise indicated)
Tax Nature and Scope of Tax Exemptions and Deductions Rates
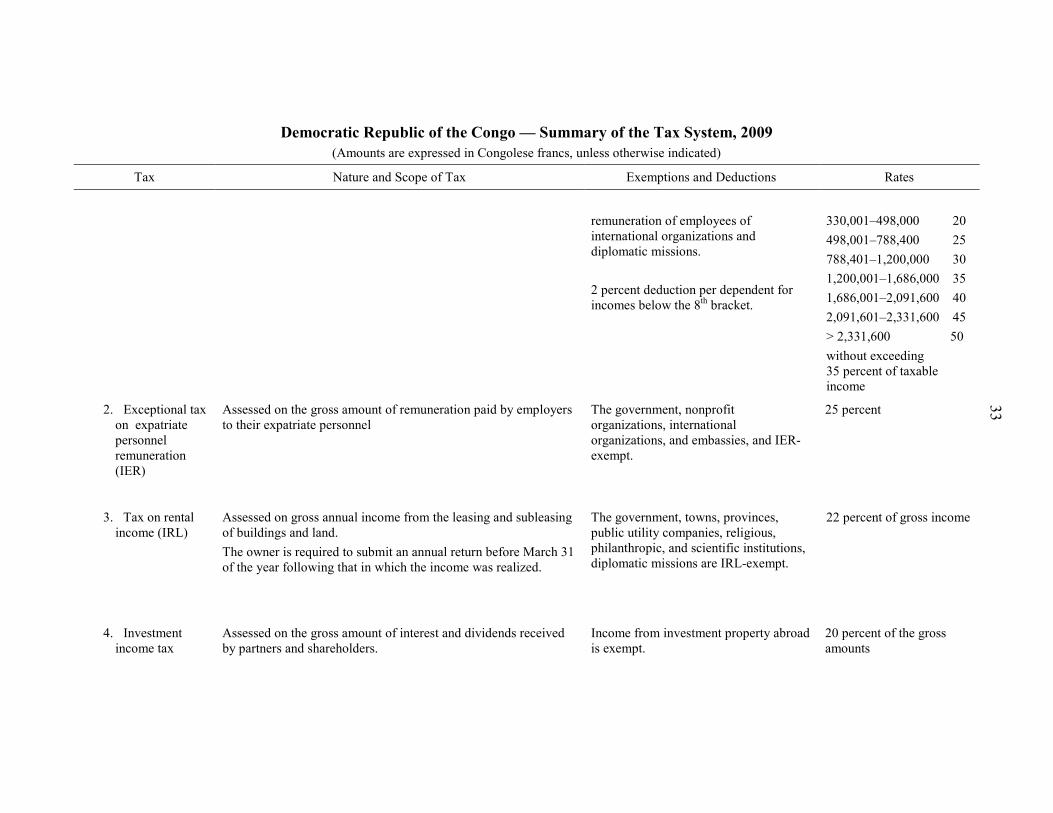
remuneration of employees of international organizations and diplomatic missions. 2 percent deduction per dependent for incomes below the 8th bracket.
330,001–498,000 20 498,001–788,400 25 788,401–1,200,000 30 1,200,001–1,686,000 35 1,686,001–2,091,600 40 2,091,601–2,331,600 45 > 2,331,600 50 without exceeding 35 percent of taxable income
2. Exceptional tax on expatriate personnel remuneration (IER)
Assessed on the gross amount of remuneration paid by employers to their expatriate personnel
The government, nonprofit organizations, international organizations, and embassies, and IER-exempt.
25 percent
3. Tax on rental income (IRL)
Assessed on gross annual income from the leasing and subleasing of buildings and land. The owner is required to submit an annual return before March 31 of the year following that in which the income was realized.
The government, towns, provinces, public utility companies, religious, philanthropic, and scientific institutions, diplomatic missions are IRL-exempt.
22 percent of gross income
4. Investment income tax
Assessed on the gross amount of interest and dividends received by partners and shareholders.
Income from investment property abroad is exempt.
20 percent of the gross amounts
34
Democratic Republic of the Congo — Summary of the Tax System, 2009 (Amounts are expressed in Congolese francs, unless otherwise indicated)
Tax Nature and Scope of Tax Exemptions and Deductions Rates
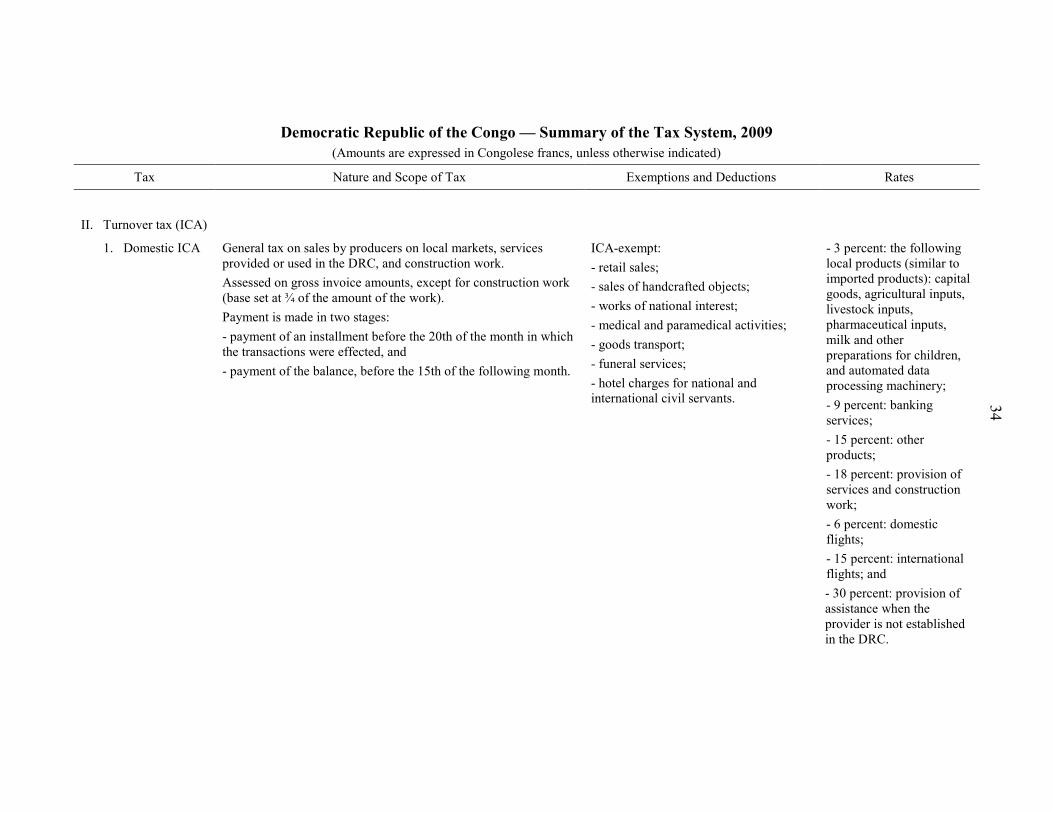
II. Turnover tax (ICA)
1. Domestic ICA General tax on sales by producers on local markets, services provided or used in the DRC, and construction work. Assessed on gross invoice amounts, except for construction work (base set at ¾ of the amount of the work). Payment is made in two stages: - payment of an installment before the 20th of the month in which the transactions were effected, and - payment of the balance, before the 15th of the following month.
ICA-exempt: - retail sales; - sales of handcrafted objects; - works of national interest; - medical and paramedical activities; - goods transport; - funeral services; - hotel charges for national and international civil servants.
- 3 percent: the following local products (similar to imported products): capital goods, agricultural inputs, livestock inputs, pharmaceutical inputs, milk and other preparations for children, and automated data processing machinery; - 9 percent: banking services; - 15 percent: other products; - 18 percent: provision of services and construction work; - 6 percent: domestic flights; - 15 percent: international flights; and - 30 percent: provision of assistance when the provider is not established in the DRC.

35
Democratic Republic of the Congo — Summary of the Tax System, 2009 (Amounts are expressed in Congolese francs, unless otherwise indicated)
Tax Nature and Scope of Tax Exemptions and Deductions Rates
2. ICA on imports Charged on the C.I.F. value of imports plus customs duties. Tax levied by the customs and excise office (OFIDA). For petroleum products (including gasoline, kerosene, diesel oil and fuel oil, and liquefied petroleum gas), ICA is set in the framework of a formula for setting rates and is based on a commercial average border price (PMF) plus customs duties. The rate formula (and the taxation on petroleum products) is subject to review whenever the exchange rate, the border price, or the volume of consumption vary by more than 5 percent.
Imports that are expressly exempted. - 3 percent for the following goods: capital goods, agricultural inputs, livestock inputs, pharmaceutical inputs, milk and other preparations for children, and automated data processing machinery; and - 15% for other goods (including petroleum products)
III. Non-personal property taxes
Taxes on property ownership.
1. Land tax Lump-sum tax calculated on the type of real estate, its location, and the standing of the owner.
The government, towns, provinces, public utility companies, religious, philanthropic, and scientific institutions, and diplomatic missions are exempt; permanent exemption for small farms;
Improved land: from US$1.50 to US$75/floor according to location Unimproved land: from US$1.50 to US$30 according to location; and
Exemption for owners older than age 55, and widows and widowers.
Residential: from US$0.30 to US$1.50/m2 according to their classification within 4 brackets

36
Democratic Republic of the Congo — Summary of the Tax System, 2009 (Amounts are expressed in Congolese francs, unless otherwise indicated)
Tax Nature and Scope of Tax Exemptions and Deductions Rates
2. Area tax on mining and hydrocarbon concessions
Tax owed by holders of concessions granted by the government for mining and petroleum exploration and/or operation.
US$0.02/hectare for exploration and US$0.04/hectare for operation of concessions during the 1st year (50 percent increase for the 2nd year, 75 percent for the 3rd year and 100 percent for the 4th year);
3. Vehicle tax and special tax on highway use (TSCR)
The vehicle tax is based on the weight and horsepower of motor vehicles.
Vehicles owned by the government, international organizations, the diplomatic corps, and utility companies, and mopeds and ambulances, are exempt.
Vehicle tax: tax sticker price ranges between US$5 and US$44 according to horsepower.
The TSCR is a tax on road use. TSCR: annual tax sticker price from US$6 to US$45 per vehicle.
IV. Excise duties
1. Selected products
Excise duties are assessed on a certain number of locally manufactured or imported consumer goods specifically established by excise law. Base: for imports: c.i.f. value + customs duties. For locally manufactured products: ex-factory price. Examples: 2 percent on new vehicles; 3 percent on flavored beverages and other nonalcoholic drinks; 5 percent on soft drinks
7 [sic] rates: 3, 5, 10, 20, 25, 30, and 40 percent.

37
Democratic Republic of the Congo — Summary of the Tax System, 2009 (Amounts are expressed in Congolese francs, unless otherwise indicated)
Tax Nature and Scope of Tax Exemptions and Deductions Rates
and other flavored beverages; 10 percent on natural or carbonated mineral waters, liquid perfume, beauty products, hair care products, soap, plastic articles and products, synthetic rubber articles and products, rental vehicles, 20 percent on beer under 6° proof and sparkling wines and wines under 15° proof; 20 percent on vermouths; 25 percent on wines more than 15° proof; 40 percent on other alcoholic drinks (whiskies, rum, gin, vodka, etc.), and 40 percent on cigars, and cigarillos; specific taxation for cigarettes. Taxation of cigarettes, cigars, and cigarillos also includes a special 20 percent excise tax on the c.i.f. value plus customs duties.
2. Petroleum products
For petroleum products (including gasoline, kerosene, diesel oil and fuel oil, and liquefied petroleum gas), excise taxes are based on a rate-setting formula and are calculated based on a fixed average border price.
Rates: 25 percent for gasoline and 15 percent for all other products.
V. Customs duties
1. Import duties Assessed on the c.i.f. value of imports. For petroleum products (including gasoline, kerosene, diesel oil and fuel oil, and liquefied petroleum gas), import duties are set using a rate formula for petroleum products and are based on a quarterly average of the average border price.
Various exemptions are delineated in the customs code, the investment code, the mining code, specific agreements, and international agreements. Some exemptions are complete whereas others require payment of an administrative fee, at a rate of 5% of the c.i.f. value, or preferential reduced rates (mining code: 2 percent, 3 percent, 5 percent, of the c.i.f. value).
4 rates: (0, 5, 10 and 20 percent). Examples: 0 percent for banknotes and stamps; 5 percent for equipment; crude raw materials, agricultural inputs, livestock inputs, pharmaceutical inputs, milk and other preparations for children, and automated data processing machinery;

38
Democratic Republic of the Congo — Summary of the Tax System, 2009 (Amounts are expressed in Congolese francs, unless otherwise indicated)
Tax Nature and Scope of Tax Exemptions and Deductions Rates
10 percent on widely consumed food products, flours for consumption, spare parts, and on petroleum products; and 20 percent on finished products.
2. Other levies on imports
Office of the Director General of Administrative, Judicial, Property, and Shares Revenue (DGRAD): various, at fixed rates or ad valorem; Congolese Control Office (OCC): 1.5 percent rate on f.o.b./c.i.f. value (including fees for preshipment inspection of goods by BIVAC when the value of the imports exceeds US$2,500). Fund for the Promotion of Industry (FPI): 2 percent of the c.i.f. value + customs duties, and Office of Maritime Freight Management (OGEFREM): 0.5 percent of the c.i.f. value.
Various rates, ad valorem (OCC, OGEFREM) and fixed (DGRAD)
3 Export duties Exports of mining products are subject to the mining royalty within the framework of the mining code.
None. Mining royaltyIron and ferrous metals: 0.5 percent
:
Nonferrous metals: 2 percent Precious metals: 2.5 percent Precious stones: 4 percent Industrial minerals, solid hydrocarbons:1 percent Construction materials in common usage: 1 percent

39
Democratic Republic of the Congo — Summary of the Tax System, 2009 (Amounts are expressed in Congolese francs, unless otherwise indicated)
Tax Nature and Scope of Tax Exemptions and Deductions Rates
Export dutiesSmall-scale extraction of gold and diamonds: 1.5%
:
Industrial production of gold and diamonds: 3%
Certain other exported products are subject to export duties. Other exported products are exempted from export duties.
None Coffee: 1 percent Logs: 10 percent Worked, polished wood: 6 percent Other mining products: 5–10 percent Crude oils: 5 percent (except for production under agreement) Fresh water: 5 percent Electrical energy: 5 percent.
VI. Administrative charges and licenses
1. Environment Licenses (fishing, hunting, and logging). None Specific rates
2. Real estate Recording fees, transaction fees, stamp duties. None Specific rates
3. Mines Prospecting fees; mining operations permit (individuals and companies); purchasing office licenses (gold, diamonds, etc.).
None Specific rates


