
Loma Linda UniversityTheScholarsRepository@LLU: Digital Archive of Research,Scholarship & Creative Works
Loma Linda University Electronic Theses, Dissertations & Projects
12-1-2011
Delayed Onset Muscle Soreness in People withDiabetes; Biomarkers and NutritionalSupplementationHani H. Al-NakhliLoma Linda University
Follow this and additional works at: http://scholarsrepository.llu.edu/etd
Part of the Rehabilitation and Therapy Commons
This Dissertation is brought to you for free and open access by TheScholarsRepository@LLU: Digital Archive of Research, Scholarship & CreativeWorks. It has been accepted for inclusion in Loma Linda University Electronic Theses, Dissertations & Projects by an authorized administrator ofTheScholarsRepository@LLU: Digital Archive of Research, Scholarship & Creative Works. For more information, please [email protected].
Recommended CitationAl-Nakhli, Hani H., "Delayed Onset Muscle Soreness in People with Diabetes; Biomarkers and Nutritional Supplementation" (2011).Loma Linda University Electronic Theses, Dissertations & Projects. 19.http://scholarsrepository.llu.edu/etd/19

Loma Linda University School of Allied Health Professions
in conjunction with the Faculty of Graduate Studies
_____________________
Delayed Onset Muscle Soreness in People with Diabetes; Biomarkers and Nutritional Supplementation
by
Hani H. Al-Nakhli
_____________________
A Dissertation submitted in partial satisfaction of the requirements for the degree
Doctor of Philosophy in Rehabilitations Science
_____________________
December, 2011

© 2011
Hani H. Al-Nakhli All Right Reserved

iii
Each person whose signature appears below certifies that this dissertation in his/her opinion is adequate, in scope and quality, as a dissertation for the degree Doctor of Philosophy.
, Chairperson Jerrold S. Petrofsky, Professor of Physical Therapy, Director of Research Lee S. Berk, Associate Professor of Physical Therapy Richard Hubbard, Professor of Pathology Michael S. Laymon, Professor of Physical Therapy, Chair of the Department of Physical Therapy, Azusa Pacific University Grenith Zimmerman, Professor of Biostatistics, Associate Dean for Research

iv
ACKNOWLEDGMENTS
No research project is ever the product of one person's efforts, and certainly this
one is no different. It would never have become reality without the help and suggestions
of many supportive faculty and colleagues. My biggest gratitude goes to Dr. Jerrold
Petrofsky. This dissertation would never have been accomplished without him. He not
only served as my chairperson and supervisor, but also encouraged and challenged me
throughout my academic program. He guided me through the research process, never
accepting less than my best efforts. Thank you for all your time, energy, and sacrifice that
you have invested in me.
I would also like to acknowledge the debt I owe to all my committee members,
particularly Dr. Grenith Zimmerman; I have learned much from working with her,
especially as her graduate teaching assistant. Not only did she give me valuable feedback
throughout my research, but she also highlighted many of my unknown weaknesses and
supported me in overcoming them. Of the many people who have been enormously
helpful in the preparation of this dissertation, I am especially thankful to Dr. Lee Berk,
who provided great balance between careful guidance and allowing creative autonomy. I
would also like to warmly acknowledge Dr. Richard Hubbard, and Dr. Mike Laymon, for
investing time and effort to provide me with necessary additional details regarding my
research topic.
I would like to extend my heartfelt gratitude to my wife Eman not only for her
willingness to be home to raise our children, but also for her patience and wisdom, which
always kept me going forward through every step of this process. I would also like to
v
direct an enormous thank you to my Mother, Father, Family, and Friends. Words alone
cannot express what I owe them for their encouragement and motivation.
A very special recognition is given to the Saudi Arabian Ministry of Higher
Education (MOHE), in collaboration with the Saudi Arabian Cultural Mission (SACM),
for granting me this opportunity to complete my post-graduate studies, and for making it
a reality.
I would also like to thank my research support team for their assistance in
recruiting and supervising the subjects; Darshita Dalal (MPT), Inayat Kaur (MPT), Vinit
Dubey (MPT), and Swetha Regula (MPT). And finally, I would like to thank God for
providing me this undeserved opportunity, and making all things possible.

vi
CONTENTS Approval Page .................................................................................................................... iii
Acknowledgements ............................................................................................................ vi
Table of Contents ............................................................................................................... vi
List of Figures .................................................................................................................... ix
List of Tables ..................................................................................................................... xi
List of Abbreviations ........................................................................................................ xii
Abstract ............................................................................................................................ xiii
Chapter
1. Introduction ..............................................................................................................1 Diabetes and Exercise ........................................................................................1 Delayed Onset Muscle Soreness ........................................................................2 Biomarkers and Thermal Imaging .....................................................................3 Nutritional Supplementation and Amino Acids .................................................5 Approach of Studies ...........................................................................................6 Investigation Purposes .......................................................................................7
2. The Use of Thermal Infra-Red Imaging to Assess the Efficacy of a
Therapeutic Exercise Program in Individuals with Diabetes ...................................8 Abstract ..............................................................................................................9 Introduction ......................................................................................................10 Subjects and Methods ......................................................................................13
The Exercise...............................................................................................14 Skin Temperature .......................................................................................15 Soreness/Pain Visual Analog Scale ...........................................................16 Blood Sampling and Measurement of Myoglobin .....................................17
Procedure .........................................................................................................18 Data Analysis .............................................................................................19
Results ..............................................................................................................20

vii
Skin Temperature .......................................................................................20 Perceived Soreness.....................................................................................22 Myoglobin Concentrations.........................................................................23
Discussion ........................................................................................................25 Acknowledgements ..........................................................................................29 References ........................................................................................................30
3. The Use of Thermal Infra-Red Imaging to Detect Delayed Onset Muscle
Soreness .................................................................................................................35 Short Abstract ..................................................................................................36 Long Abstract ...................................................................................................36 Protocol ............................................................................................................37
The Exercise...............................................................................................37 Infra Red Camera Preparation and Setup ...................................................40 Image Aquirement .....................................................................................42 Image Processing and Analysis .................................................................44 Visual Analog Scale and Blood Analysis ..................................................45 Representative Results ...............................................................................46
Discussion ........................................................................................................49 Acknowledgements ..........................................................................................52 Equipment Used ...............................................................................................52 References ........................................................................................................53
4. The Effects of Branched-Chain Amino Acid Supplementation on Delayed
Onset Muscle Soreness in People with Diabetes ...................................................55 Abstract ............................................................................................................56 Introduction ......................................................................................................57 Subjects and Methods ......................................................................................60
Study Design ..............................................................................................62 The Supplement Protocol ...........................................................................63 The Resistance Maximum and Muscle Strength Measurements ...............63 Electromyography Assessment ..................................................................65 Soreness and Pain Measurements ..............................................................66 Relaxed Elbow Range of Motion Measurement ........................................66 Blood Sampling and Myoglobin Concentrations .......................................67 Skin Temperature .......................................................................................68 Lean Body Weight Determination .............................................................68 Food Dietary Analysis ...............................................................................69
Procedure .........................................................................................................69

viii
Data Analysis .............................................................................................70
Results ..............................................................................................................71 Demographics and Protein Intake ..............................................................71 Muscle Strength .........................................................................................71 Electromyography ......................................................................................72 Soreness/Pain Response .............................................................................73 Relaxed Range of Motion ..........................................................................74 Myoglobin Concentrations.........................................................................75 Skin Temperature .......................................................................................76
Discussion ........................................................................................................78 Acknowledgements ..........................................................................................81 References ........................................................................................................83
5. Discussion ..............................................................................................................89 Suggestions for Future Research .....................................................................94 Conclusion .......................................................................................................94
References ..........................................................................................................................96 Appendix
A. Subject Data Collection Form ..........................................................................103
B. Short Form McGill Pain Questionnaire ............................................................105
C. Informed Consent Form ...................................................................................107

ix
FIGURES Figures Page
1. The Thermal Infra-Red Camera Setup ...................................................................16
2. Interface of the “ThermoVision® ExaminIR™” Software ...................................17
3. A Graph of the Differences in Skin Temperatures ................................................21
4. A Thermal Image of a Diabetic Individual’s Arm .................................................22
5. A Graph of the Differences in Perceived Muscle Soreness ...................................23
6. A Graph of the Differences in Myoglobin Levels .................................................25
7. Images of the Biopac Modules and the Strain Gauge Device Used .....................38
8. The Setup for Measuring a Subjects Muscle Strength Using the Strain Gauge Device .........................................................................................................39
9. A Subjects Setup During the Arm Exercise Protocol ............................................40
10. The Setup of the Thermal Camera and the Lights Used During the Image Taking ....................................................................................................................41
11. Images of the Thermal Camera Used in This Experiment .....................................42
12. An Infra Red Image of a Subject’s Exercised Arm ...............................................43
13. An Infra Red Image of a Subject’s Un-Exercised Arm .........................................43
14. An Illustration of the 4 Regions of Interest for the Infra Red Analyses ................44
15. A Snapshot of the Thermal Imaging Analysis Software .......................................45
16. A Graph of the Differences in Skin Temperature ..................................................47
17. A Graph of the Differences in Perceived Muscle Soreness ...................................48
18. A Graph of the Differences in Myoglobin Concentrations ....................................49
19. Subject Setup for the Repetition Maximum and Muscle Strength Measurements ........................................................................................................65
20. A Graph of the Muscle Strength Measures ............................................................72

x
21. A Graph of the Electromyography Amplitude During Maximum Effort ..............73
22. A Graph of the Subjects Soreness Responses ........................................................74
23. A Graph of the Relaxed Range of Motion Measurements .....................................75
24. A Graph of the Subjects Blood Myoglobin Concentrations ..................................76
25. A Graph of the Subjects Skin Temperatures ..........................................................77
xi
TABLES Tables Page
1. General Characteristics of the Subjects in both the Arm and Abdominal Exercise Groups .....................................................................................................14
2. Table of the Specific Equipment Used ..................................................................52
3. General Characteristics of the Healthy and Diabetic Subjects ..............................62

xii
ABBREVIATIONS
BCAA Branched Chain Amino Acids
DOMS Delayed Onset Muscle Soreness
T2DM Type 2 Diabetes Mellitus
IR Infra Red
EAA Essential Amino Acids
WHO World Health Organization
IDF International Diabetes Federation
HbA1c Hemoglobin A1c
NSAID Non-Steroidal Anti-Inflammatory Drugs
VAS Visual Analog Scale
SF-MPQ Short Form McGill Pain Questionnaire
MS Muscle Strength
RM Resistance Maximum
EMG Electromyography
RROM Relaxed Range of Motion
FFQ Food Frequency Questionnaire
ANOVA Analysis of Variance
xiii
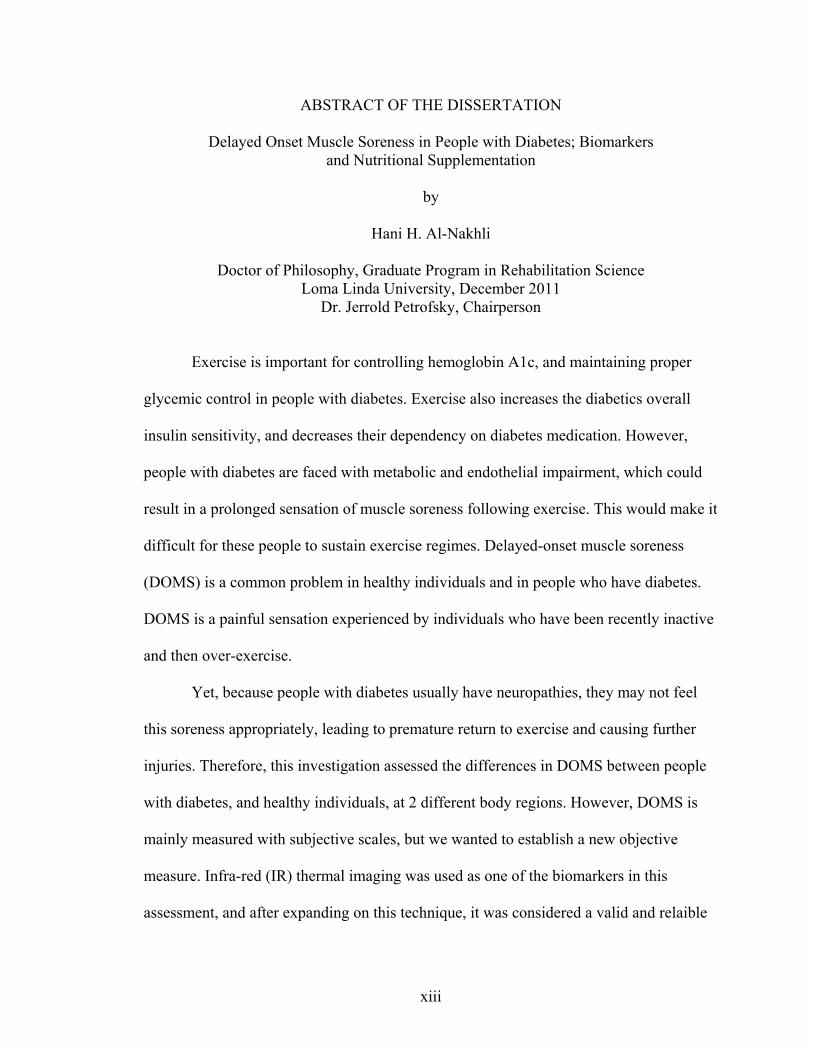
ABSTRACT OF THE DISSERTATION
Delayed Onset Muscle Soreness in People with Diabetes; Biomarkers and Nutritional Supplementation
by
Hani H. Al-Nakhli
Doctor of Philosophy, Graduate Program in Rehabilitation Science Loma Linda University, December 2011
Dr. Jerrold Petrofsky, Chairperson
Exercise is important for controlling hemoglobin A1c, and maintaining proper
glycemic control in people with diabetes. Exercise also increases the diabetics overall
insulin sensitivity, and decreases their dependency on diabetes medication. However,
people with diabetes are faced with metabolic and endothelial impairment, which could
result in a prolonged sensation of muscle soreness following exercise. This would make it
difficult for these people to sustain exercise regimes. Delayed-onset muscle soreness
(DOMS) is a common problem in healthy individuals and in people who have diabetes.
DOMS is a painful sensation experienced by individuals who have been recently inactive
and then over-exercise.
Yet, because people with diabetes usually have neuropathies, they may not feel
this soreness appropriately, leading to premature return to exercise and causing further
injuries. Therefore, this investigation assessed the differences in DOMS between people
with diabetes, and healthy individuals, at 2 different body regions. However, DOMS is
mainly measured with subjective scales, but we wanted to establish a new objective
measure. Infra-red (IR) thermal imaging was used as one of the biomarkers in this
assessment, and after expanding on this technique, it was considered a valid and relaible

xiv
tool for detecting and quantifying delayed onset muscle soreness after an intense exercise
session.
Once muscle soreness in people with diabetes was determined, and a new novel
biomarker was established, another focus of this dissertation was to examine whether
DOMS could be attenuated by ingesting a nutritional supplement. Branched Chain
Amino Acids (BCAA) have been shown to be effective in promoting muscle recovery
following exercise; however, the effects of this supplement have not been investigated
amongst diabetic individuals.
The results of this experiment showed that people with diabetes get sorer than
healthy individuals. It was also found that IR thermal imaging may be a valuable
technique for identifying which muscles are sore after exercising. Thus, thermal imaging
would be an efficient and painless way of quantifying DOMS in both healthy individuals
and in people with diabetes. Furthermore, this investigation showed that BCAA
significantly reduced muscle soreness and enhanced healing in subjects with diabetes.
However, in the healthy control group this supplement had minimal effects.

1
CHAPTER ONE
INTRODUCTION
Diabetes and Exercise
The diabetes epidemic is on the rise in both developing and developed countries.
1,2 According to the World Health Organization (WHO) and recent estimates, the disease
now affects approximately 345 million people worldwide and is expected to affect around
440 million by 2030, representing almost 8% of the global adult population. 3,4 Also, the
International Diabetes Federation (IDF) determined that Type 2 diabetes mellitus
(T2DM) accounts for almost 90% of all diabetes cases. 5
Lifestyle characteristics such as obesity, a sedentary lifestyle, and lack of physical
activity are regarded as the most important risk factors, both independently associated
with diabetes and diabetes related co-morbidities. 6,7 Co-morbidities associated with
diabetes are considered an even bigger concern than being diagnosed with the disease
itself. This is because diabetes has been ranked one of the leading causes of death by
disease; 8 the WHO has estimated that deaths from diabetes will almost double between
2005 and 2030. 9
Exercise is considered a major cornerstone of diabetes management. Studies have
verified the usefulness of exercise as part of the treatment and prevention of T2DM. 6,10,11
Even though aerobic exercise has beneficial effects for managing and treating T2DM, it
has been found that resistance-type exercise is also effective in controlling blood glucose,
and in reducing Hemoglobin A1c (HbA1c). 10,12-14 It would actually be more beneficial

2
for individuals with diabetes to participate in a combination of both aerobic and
resistance exercises to properly manage their blood glucose. A combined exercise
program has been shown to have more pronounced effects on glycemic control, muscle
strength, and insulin sensitivity. 10,12,15 An important finding in a study done by Church
and colleagues 12 showed that a combination training group decreased their diabetes
medication dependency, when compared to a control group who had increased their use
of diabetes medications. It would be imperative then to include resistance training as a
primary step in the exercise schedule of a diabetic patient. This is particularly important
for obese individuals who have been inactive for a while, since they face the challenge of
participating in aerobic exercises due to their low fitness levels.
Resistance training then, would be better for individuals with diabetes to begin
with, as it contributes to the recruitment of previously inactive muscle fibers. This has
been found to enhance the quality of the muscle, which eventually leads to a substantial
gain in muscle mass. 10,16,17 As a result, the body’s insulin sensitivity will be amplified
and glucose tolerance levels improved, thereby improving the body’s glucose disposal
capacity and giving the diabetic individual a better chance to cope with the disease. 6,10,16
Delayed Onset Muscle Soreness
People with or without diabetes might get discouraged from exercising because of
the related soreness. This type of soreness is called delayed onset muscle soreness
(DOMS), and is a typical phenomenon that occurs in skeletal muscle as a result of novel
or unaccustomed exercise. 18-20 The severity of the damage and the extent of discomfort is
exacerbated over time, and occurs minutes to days after an acute exercise bout. 18,19 The

3
intensity of the symptoms and discomfort associated with DOMS usually peaks between
24 to 72 hours post exercise, and can last for up to 10 days, especially when the exercise
bout encompasses an eccentric component. 20-22 Activities that are comprised of repeated
eccentric contractions have been shown to result in damage to the ultrastructure of
skeletal muscle. 23,24 This damage manifests itself as a temporary decrease in muscle
function, restricted range of motion in the associated joint, increased muscle soreness,
and swelling of the involved muscle group. 23,25,26 Consequently, DOMS is considered
one of the most common recurrent forms of injury, which can lead to further injuries if a
premature return to exercise is attempted. 19
The DOMS phenomenon has gained a considerable amount of interest lately,
particularly amongst researchers and specialists in exercise physiology, sports, and
rehabilitation. 27 However, DOMS has not been investigated in people with diabetes, and
being able to objectively determine the extent of soreness using a reliable biomarker is
sometimes a challenge.
Biomarkers and Thermal Imaging
DOMS is not an easy pathology to quantify, as there is a wide amount of
variability between the measurement tools and methods used to quantify this condition. 27
No agreement has been made on one best evaluation measure for DOMS, which makes it
difficult to identify the impact of a specific intervention in decreasing the symptoms
associated with DOMS. Even though needle biopsies of the muscle and blood levels of
myofiber proteins might be considered a gold standard, 27 large variations in some of
these blood proteins have been documented. 27,28 There are also high risks sometimes

4
associated with invasive techniques. Thus, it can be seen that muscle soreness, especially
in diabetic individuals who have neuropathies is somewhat ambiguous, because many
studies depend on measuring soreness using a subjective visual analog scale (VAS). 29-33
Muscle soreness has various underlying mechanisms, but a main mechanism of
soreness is related to blood flow and inflammation in the muscle. 19,34 Thus, when there is
damage to the muscle, the blood flow should increase because of the inflammatory
process, which results in the increase of the skin temperature above it. Infrared (IR)
thermography has been used, and found to be successful in detecting different types of
diseases and infections since the 1950’s. 35 There is ample evidence for this phenomenon.
For example, a common technique for detecting some types of tumors is by using
thermography. 36-39 In many cases, the tumor has higher blood flows than the rest of the
examined area, which warms up a spot under the skin and shows up on a thermal image.
36-39 Consequently, a muscle that is sore should also show up on a thermal image because
of this same phenomenon. The advantage of thermal imaging is that it would provide
useful information relative to the damage in the muscle, unlike subjective pain
measurements which can be altered by the individual’s sensation of pain and the
associated neuropathies from diabetes. Therefore, a noninvasive technique that detects
DOMS in its early stages would be very beneficial for this population, as it could prevent
them from premature return to exercise, thus decreasing the risks of further injuries.
On the other hand, people with diabetes might not be getting enough nutrients,
vitamins, and amino acids from their diets, due to the fact that they have gastrointestinal
and mal-absorption problems. 40-42 Interestingly, some studies have suggested that
nutritional supplementation after exercising can reduce or even prevent DOMS.

5
Nutritional Supplementation and Amino Acids
Amino acids are the molecular building blocks from which proteins are made.
There are essential and nonessential amino acids, and the difference between them is that
the human body can synthesize the nonessential amino acids, but the essential amino
acids (EAA) have to be taken through our diets. 43 Resistance exercise causes decreases
of some of the EAA, including branched chain amino acids (BCAA), during the recovery
period after exercise. 44,45 Skeletal muscle however, remains in an overall catabolic state
unless muscle protein synthesis surpasses muscle protein breakdown, and for this to take
place, adequate nutritional intervention is necessary during this recovery period. 46,47
Thus, when EAA are ingested in conjunction with an acute bout of resistance training, the
hypertrophic response is enhanced, resulting in a net increase in muscle protein synthesis.
25,48
Among these EAA, exceptional results have been observed with BCAA. 48,49
Studies have indicated that BCAA are mainly taken up by active skeletal muscles during
sub-maximal exercise, whereas all other amino acids are taken up by the liver. 44,50 Thus,
the metabolism of BCAA is initiated in skeletal muscle, and the oxidation process is
enhanced by exercise. Numerous studies have investigated the effects of BCAA
supplementation on skeletal muscle soreness, where some studies found that BCAA may
be useful for muscle recovery following acute sessions of exercise, both in trained and
untrained individuals. 25,26,47,51,52 However, nutritional supplementation and its effects on
muscle soreness has not been examined in people with diabetes.

6
Approach of Studies
To study DOMS in people with diabetes, it is necessary to establish whether
people with diabetes experience similar levels of soreness as healthy individuals or not?
This question arises because it is known that people with diabetes have neuropathies, and
with neuropathies they tend to have hypo or hyper-sensitivity. 53 Also, people with
diabetes have high levels of free radicals and chronic inflammation, which could prolong
muscle healing, and make it harder for these people to properly workout. 53,54 Therefore,
in chapter 2 of this dissertation, the problem of DOMS was examined in people with and
without diabetes to see if muscle soreness after exercising was greater or less between
them. We looked at DOMS in diabetic and healthy individuals at different areas of the
body, and used a thermal imaging technique in addition to other biomarkers to quantify
muscle soreness. As an outcome of the first study, in chapter 3 we expanded on this new
thermal imaging technique and clarified how it can be used as a reliable biomarker to
measure DOMS. An objective measure to determine and quantify muscle soreness is
critical, because subjectively, two people could portray the same level of soreness
whereas in reality they are experiencing different pain symptoms after performing a
similar exercise. Once this new measuring technique was validated, in chapter 4 we used
it in addition to other biomarkers to confirm if DOMS could be reduced with a nutritional
supplement in people with diabetes. In this investigation our supplement of choice was
BCAA, because there is abundant evidence suggesting that protein supplements which
are high in BCAA can attenuate muscle damage, and reduce muscle soreness. 25,26,55

7
Investigation Purposes
The purpose of this investigation was three fold:
First, to identify whether people with diabetes become as sore, or sorer than
healthy individuals after an intense exercise session, as there are hardly any studies that
look at DOMS in people with diabetes.
Second, to look at biomarkers of muscle soreness, and establish a new objective
means of quantifying muscle soreness. In this case, it was measuring skin temperature
using thermal imaging, as there are no published studies done on DOMS and changes in
skin temperatures.
Third, to verify whether nutritional supplementation could reduce muscle
soreness and increase healing in people with diabetes. In this investigation, our focus was
on BCAA, as no study to date has assessed the effectiveness of a BCAA supplement on
DOMS in a diabetic population.

8
CHAPTER TWO
THE USE OF THERMAL INFRA-RED IMAGING TO ASSESS THE EFFICACY OF
A THERAPEUTIC EXERCISE PROGRAM IN INDIVIDUALS WITH DIABETES
By:
Hani H. Al-Nakhli, MPT, Ph.D (C). 1
Jerrold S. Petrofsky, PhD, J.D. 1, 2
Michael S. Laymon, PT, DSc. 2
Daisuke Arai, B.S. 2
Kelli Holland, B.S. 2
Lee S. Berk, DrPH. 1
1 Loma Linda University, Loma Linda California
2 Azusa Pacific University, Azusa California

9
Abstract
Background: Exercise is of great value for individuals with diabetes in helping to
control their HbA1c levels, and increasing their insulin sensitivity. Delayed onset muscle
soreness (DOMS) is a common problem in healthy individuals, and in people who have
diabetes. People with diabetes are also faced with metabolic and endothelial impairments,
which could make DOMS even worse. But because they usually have neuropathies, they
may not feel this soreness appropriately, leading to premature return to exercise and
causing further injuries.
Research Design: 118 subjects participated in this study, and were divided into 4
groups. Two groups (healthy, and diabetic) performed a series of abdominal exercises,
and the other 2 groups (healthy, and diabetic) performed a series of arm exercises to
induce DOMS. Skin temperature above the muscle was assessed using a thermal infra-red
camera, and perceived soreness of the exercised muscle was assessed using a 100mm
visual analog scale (VAS). Serum myoglobin concentrations were also measured.
Results: the results showed that there was a significant increase in skin
temperature 24 hours post exercise for all 4 exercised groups (P < 0.05), where the
combined average increase in skin temperature for all 4 groups was approximately 0.65
°C from baseline. Also, 24 hours post-exercise, all 4 groups were significantly sorer than
they were at baseline (P < 0.05). Serum myoglobin levels were also significantly higher
on day 3 when compared to day 1 (P < 0.05).
Conclusion: Infra Red Thermal Imaging may be a valuable technique of seeing
which muscles are sore hours or even days after the exercise is over. Thus, thermal
imaging would be an efficient and painless way of looking at DOMS in both healthy

10
individuals, and individuals who have diabetes, even if they are facing neurological
problems.
Keywords: Diabetes, Muscle Soreness, DOMS, Thermal Imaging
Introduction
Exercise is recommended as part of the treatment and prevention of diabetes. 1,2
The combination of both aerobic and resistance exercises have been found to be more
effective in controlling blood glucose, and Hemoglobin A1c levels (HbA1c) when
compared to only one type of exercise. 1,3 It is imperative to include resistance training as
a primary step in the exercise schedule of a diabetic patient, since some face the
challenge of participating in aerobic exercise due to their low fitness levels. Also, muscle
building exercises are critical for the diabetic population, as an increase in the skeletal
muscle mass has been associated with better insulin sensitivity in people who have
diabetes. 4 But beginning with a resistive exercise routine after being physically inactive
for prolonged periods of time, could cause delayed onset muscle soreness (DOMS). 5-7
This would have the effect of reducing the individual’s willingness to continue
exercising.
While much is known about DOMS in young people, little is known about DOMS
in people with diabetes. However, there may be some comparisons that can be made from
studies of DOMS and ageing. 8 Studies have shown that there is reduced proteolytic
activity and an elevated production in free radicals in older individuals. 8,9 This elevation
prolongs healing time after excessive exercise. 8 With metabolic impairments, endothelial

11
dysfunction, and higher levels of free radicals in people with diabetes 10,11 DOMS could
be more severe and recovery periods longer in this population.
DOMS generally presents itself as initial soreness that starts within 24 hours of
heavy exercise, where its associated symptoms can range from slight muscle tenderness
to severe debilitating pain. 12-14 The severity of the symptoms depends on several factors
including the fitness of the individual, their age, genetics, training, and the intensity of the
activity. 15 The peak discomfort from muscle damage ranges between 24 to 72 hours
post-exercise, but the symptoms may continue as much as 7 days post- exercise until they
begin to diminish. 7,16 For this reason, DOMS is one of the most common recurrent forms
of sports injury that can affect an individual’s performance, and become intimidating for
many. 5,17
For the last 3 decades, the DOMS phenomenon has gained a considerable amount
of interest amongst researchers and specialists in exercise physiology, sports, and
rehabilitation. 18 There has been a variety of published studies investigating this painful
occurrence in regards to its underlying mechanisms, treatment interventions, and
preventive strategies. 5-7,10,17,19-24 However, it is evident from the literature that DOMS is
not an easy pathology to quantify, as there is a wide amount of variability between the
measurement tools and methods used to quantify this condition. 18 It is obvious that no
agreement has been made on one best evaluation measure for DOMS, which makes it
difficult to verify whether a specific intervention really helps in decreasing the symptoms
associated with this type of soreness. Even though needle biopsies of the muscle, and
blood levels of myofibre proteins or myoglobin might be considered a gold standard to
some, 18 large variations in some of these blood proteins have been documented. 18,25

12
Thus, it can be seen that muscle soreness is somewhat ambiguous, because many studies
depend on measuring soreness using a visual analog scale (VAS). 22,26-29 But with people
who have diabetes, they often have neuropathies, and in this case they might not be able
to feel the muscle pain as well as normal individuals, therefore giving false VAS
readings.
Muscle soreness has a variety of underlying mechanisms, but a main mechanism
of soreness is related to blood flow and inflammation in the muscle. 5,6 Thus, when there
is damage to the muscle, the blood flow should increase due to the inflammatory process,
which should result in the increase of the skin temperature above it. There is ample
evidence for this phenomenon. For example, a common technique for detecting some
types of tumors is by using thermography. 30-33 In many cases the tumor has higher blood
flows than the rest of the examined area, which warms up a spot under the skin and
shows up on a thermal image. 30-33 Consequently, a muscle that is sore should also show
up on a thermal image due to this same phenomenon. The advantage of using thermal
imaging is that, unlike subjective pain measurements which can be altered by the
individuals sensation of pain, and the associated neuropathies from diabetes, thermal
imaging would actually provide very useful information relative to the damage in the
muscle.
However, individuals with diabetes may have altered feeling of DOMS, or may
not feel this type of muscle soreness due to their neuropathies. Therefore, a non invasive
technique that could detect DOMS in its early stages would be very beneficial for this
population, as it could prevent them from premature return to exercise. This may increase
training and decrease their risks of injuries. It is surprising then that little has been done
13
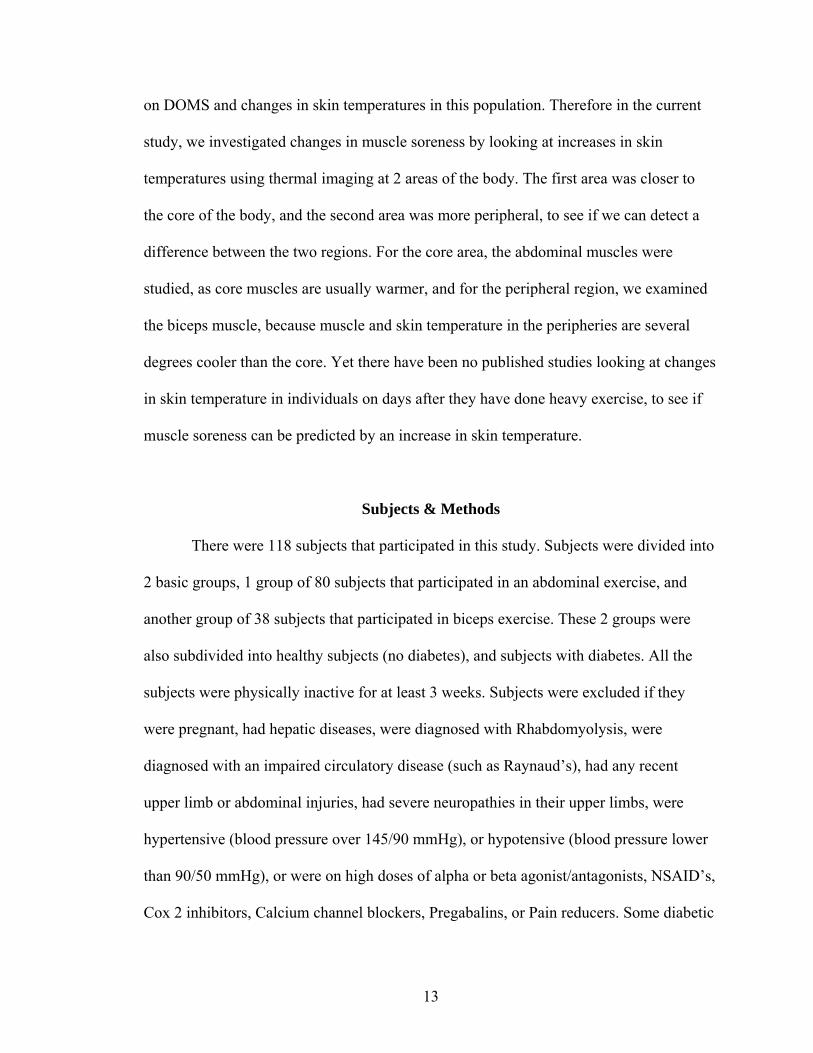
on DOMS and changes in skin temperatures in this population. Therefore in the current
study, we investigated changes in muscle soreness by looking at increases in skin
temperatures using thermal imaging at 2 areas of the body. The first area was closer to
the core of the body, and the second area was more peripheral, to see if we can detect a
difference between the two regions. For the core area, the abdominal muscles were
studied, as core muscles are usually warmer, and for the peripheral region, we examined
the biceps muscle, because muscle and skin temperature in the peripheries are several
degrees cooler than the core. Yet there have been no published studies looking at changes
in skin temperature in individuals on days after they have done heavy exercise, to see if
muscle soreness can be predicted by an increase in skin temperature.
Subjects & Methods
There were 118 subjects that participated in this study. Subjects were divided into
2 basic groups, 1 group of 80 subjects that participated in an abdominal exercise, and
another group of 38 subjects that participated in biceps exercise. These 2 groups were
also subdivided into healthy subjects (no diabetes), and subjects with diabetes. All the
subjects were physically inactive for at least 3 weeks. Subjects were excluded if they
were pregnant, had hepatic diseases, were diagnosed with Rhabdomyolysis, were
diagnosed with an impaired circulatory disease (such as Raynaud’s), had any recent
upper limb or abdominal injuries, had severe neuropathies in their upper limbs, were
hypertensive (blood pressure over 145/90 mmHg), or hypotensive (blood pressure lower
than 90/50 mmHg), or were on high doses of alpha or beta agonist/antagonists, NSAID’s,
Cox 2 inhibitors, Calcium channel blockers, Pregabalins, or Pain reducers. Some diabetic

14
subjects had minimal cardiovascular disease but were within the blood pressure ranges
stated above and had no major complications. The average ages, heights, weights, and
demographics of the subjects are shown in table 1. All subjects were informed of all
experimental procedures and protocols and signed a statement of informed consent as
approved by either the institutions review board at Azusa Pacific University or Loma
Linda University.
Table 1: General Characteristics of the Subjects (Means +/- SD)
N Age
(Years) Height (CM)
Weight (KG) BMI HbA1C
Abdominal Exercise
Healthy 40 28.75 (+/‐ 5.6)
171.25 (+/‐ 6.3)
88.15 (+/‐ 12.8)
30.10 (+/‐ 3.5)
Diabetics 40 59.0 (+/‐ 9.9)
176.08 (+/‐6.9)
95.95 (+/‐ 14.6)
31.43 (+/‐ 4.9)
7.7 (+/‐ 1.9)
Arm Biceps Exercise
Healthy 22 28.45 (+/‐ 8.7)
167.91 (+/‐ 8.2)
73.09 (+/‐ 20.0)
25.52 (+/‐ 5.5)
Diabetics 16 61.25 (+/‐ 12.6)
167.56 (+/‐ 14.8)
109.25 (+/‐ 39.6)
38.07 (+/‐ 10.2)
7.1 (+/‐ 1.7)
The Exercise
The group doing the arm exercise used a dumbbell to exercise one arm. The
resistance used was different for each subject, and was determined by testing each
participant for their resistance maximum (RM). To do this, we used a strength measuring
device with 4 strain gauge arranged as a Wheatstone bridge. This was interfaced with a
computer through a BioPac (DAC-100) bioelectric amplifier module (BioPac Systems,
Goleta, CA). The module was connected to a BioPac MP-100 analog to digital converter
sampling at a frequency of 1,000 hertz per second, and at a resolution of 24 bits. The

15
device was fixed to a bench at a 45° angle, so that the subject would not recruit any
muscle other than the biceps. After determining the RM for the biceps muscle of each
participant in that group, we made them sustain the intended session of exercise with
35% of their RM calculated from the average of the 3 strength recordings done on the
strain gauge device prior to the exercise.
The abdominal group accomplished a number of exercises as shown in the P90X
video series which is designed for both men and women (Beachbody LLC, Los Angeles,
California, USA.). The video includes several different exercise routines with various
individuals doing each exercise differently, so the user could select low or high intensity
variations of the exercise depending on their capability. For the purpose of this study, two
workout videos were selected to emphasize the abdominal region. The first video, Core
Synergistics lasted 44 minutes, followed by the Ab Ripper X video which lasted 16
minutes, giving a 60-minute total workout.
Skin Temperature
Skin temperature was measured using a Flir TC660 Thermal Camera (Stockholm,
Sweden). The thermal image taken of the arm or abdominal regions were from
approximately 1 meter away, and perpendicular to the skin (Fig. 1). From a series of tests
done at our labs using the FLIR 660 IR Camera, this distance and angle were found to
have the best correlation (r = 0.93) with thermocouple readings when compared to
different distances from the skin (2, and 5 meters), and at different angles (15, 30, 45, and
60 degrees). The images were taken in a temperature controlled room which was
maintained at approximately 23°C (+/- 0.5°C). The temperatures from the acquired image

16
were measured at 4 locations on the skin above the biceps or abdominal muscle using the
“ThermoVision® ExaminIR™” software Version: 1.10.2 (Fig. 2). These 4 readings were
analyzed individually and then averaged to give a full perspective of the temperature
above the exercised muscle.
Soreness/Pain Visual Analog Scale
A visual analog scale (VAS) was used to assess subjective soreness of the arm or
abdominal muscles before doing the exercise and after the exercise was completed. The
scale had a 10 cm (100mm) long line marked “no pain” at one end, and “extremely sore”
at the opposite end. Each participant was directed to make a vertical mark along the 10
cm line to indicate his or her response to soreness.
Figure 1: The setup of the Infra Red camera 1 meter away from the skin, and perpendicular to the area being examined.

17
Figure 2: Software interface for the “ThermoVision® ExaminIR™” showing the 4 boxes of interest on an IR image of an exercised arm. Also shown are the statistical interpretations for each box from the software itself.
Blood Sampling & Measurement of Myoglobin Concentrations
Approximately 4 ml peripheral blood was collected from an antecubital vein.
Peripheral venous blood was drawn before (Pre), immediately after (Post), and 48 hours
(2 days) after the exercise bout. The blood was spun down in a centrifuge at 4000 rpm for
10 min to separate the serum from the cells. The samples were stored at -80°C until the
analyses of myoglobin was done.
Myoglobin was measured using a TOSOH “AIA®-360” Automated enzyme
Immunoassay Analyzer (TOSOH Corp., Tokyo, Japan). The myoglobin Assay kits (Myo
025297, ST AIA-PACK Myoglobin) were used according to the manufactures

18
instructions. Controls were run before and after each analyses session, to verify that the
measurements were accurate and within the manufacturers specified quality control
ranges. The normal reference range for myoglobin using this method was 31.4 - 971
ng/ml. The intra-assay and inter-assay coefficient of variation was 2.76 %, and 4.45 %
respectively.
Procedure
In this investigation, we started off with the biceps study and monitored the
soreness and heat variations for the subjects over a period of more than 3 days. It was
realized that the biggest change in temperatures was at 24 hours. We then did the
abdominal study for only 3 days, to see if the core muscles have the same heating
response as the peripheral muscles. Blood samples for the myoglobin readings were only
carried out on the arm group. Myoglobin measurements were not carried out on the
abdominal group due to costs.
After subjects attended to the fitness lab, baseline data, including a thermal image
of the abdominal or arm muscles, and a soreness VAS reading were collected. Blood
samples for the myoglobin analyses were also collected at this time, but only for the arm
group. The targeted muscles for the subjects in the arm group were the elbow flexors. To
provoke DOMS in these muscles, the subjects in this group carried out 4 sets of 25
repetitions of biceps concentration curls while seated on a chair, and with the elbows
supported on their thighs. Subjects were advised to lower the weight and lift it at a steady
state (approximately 3 seconds going down, and 3 seconds coming back up), to insure
that both the eccentric and concentric components of the contraction were properly done.

19
There was a 90 second resting period between each set and the other, and subjects either
did the full set of 25 repetitions, or were instructed to stop the set if they failed to steadily
control the descent of the weight and return their arm back to full flexion. As indicated
previously, the resistance used was different for each subject, and was determined by
testing each participant for their resistance maximum (RM).
For the abdominal group, after the baseline readings, the subjects participated in
the 60-minute workout video mentioned above, to induce DOMS in their abdominal
muscles. All subjects were asked to attempt the most difficult variation of each exercise,
as they are able. Subjects were given four 3-minute breaks throughout the video to rest.
Subjects were told that they are allowed to stop the exercise at any time if it became too
strenuous.
Twenty-four hours post-exercise, thermal images of the arm or abdomen muscles
were measured, and VAS readings were also taken at this time. Both these measures were
also repeated at 48 hours post-exercise. Blood samples for the 2nd myoglobin reading
were taken 30 minutes post-exercise, and the 3rd reading was taken 48 hours post-
exercise.
Data Analysis
Data analysis involved means, and standard deviations. Measurements of all 3
variables (skin temperature, VAS, and myoglobin) were compared within each group
using the repeated measures analysis of variance (ANOVA). Spearman’s correlation was
also used to identify any relationships between the variables. Statistical analysis was

20
performed using PASW Statistics Version 18.0.0 (SPSS, Inc., 2009, Chicago, IL,
www.spss.com), and the level of significance was set at P <0.05.
Results
Skin Temperature
The results of the skin temperature measurements for the 4 groups are shown in
figure 3. As seen in figure 3, all the 4 groups had increased skin temperatures 24 hours
post exercise. For the healthy group who performed the P90x abdominal exercise, their
average skin temperature for the measured area increased by 0.83° C, from 32.50 +/-
0.37° C to 33.33 +/- 0.39° C. This increase in skin temperature was significant (P < 0.05).
The increase in skin temperatures from baseline to 24 hours post exercise for the diabetic
group who performed the P90x abdominal exercise was also significant (P < 0.05), where
it increased by 0.61° C, from 33.02 +/- 0.16° C to 33.63 +/- 0.61°C.

21
Figure 3: A representative graph of the differences in skin temperatures measured with the thermal camera in the healthy group who performed the P90x Abdominal exercise (diamonds), the diabetic group who performed the P90x Abdominal exercise (squares), the healthy group who performed the arm exercise (triangles), and the diabetic group who performed the arm exercise (X), over the 3 day time period.
For the groups that exercised their arm muscles, the healthy group had a 0.51° C
increase in skin temperature between the first 2 days, from 32.4 +/- 0.87° C to 32.91 +/-
0.96° C. This increase was significant (P < 0.05). Also, the diabetic group who exercised
their arms had a significant increase in skin temperature (P < 0.05) from day 1 to day 2,
where the increase was 0.62° C, from 32.58 +/- 0.85° C to 33.20 +/- 0.74° C (Fig. 4, A &
B).
By the 3rd day (48 hours post exercise), skin temperatures were almost back to
normal, where there was no significant difference between day 1 (pre exercise) and day 3
for all the groups (P > 0.05).
32.50
33.33
32.83
33.02
33.63
33.30
32.40
32.91
32.6832.58
33.20
32.92
32.00
32.20
32.40
32.60
32.80
33.00
33.20
33.40
33.60
33.80
34.00
Pre‐Exercise 24 Hours Post‐Ex 48 Hours Post‐Ex
Skin Temperature (Deg. C)
IR Skin Temperatures of the 4 Exercise Group's
Healthy P90x
Diabetic P90x
Healthy Arm's
Diabetic Arm's

22
Figure 4: A) A thermal image of a diabetic individuals arm before exercising. B) A thermal image of the same individual’s arm 24 hours post exercise (the temperature of the arm jumped from 31.5 °C to 34.4 °C)
Perceived Soreness (VAS)
The results of the perceived muscle soreness are shown in figure 5. As seen in
figure 5, all 4 groups had a dramatic increase in muscle soreness 24 hours post exercise.
The healthy group, who performed the P90x abdominal exercise, had an increase of
approximately 41.5 millimeters (mm) on the pain scale, from 0 pain to 41.5 +/- 6.1 mm.
This increase was highly significant (P < 0.05). The diabetic group who performed the
same abdominal exercise had an even higher increase in muscle soreness than the healthy
subjects. Their baseline muscle soreness was 7.3 +/- 1.7 mm, which had increased to 73.8
+/- 8.8 mm, 24 hours post exercise. That was a 66.5 mm increase which was also very
significant (P < 0.05).
The biceps group also had large increases in soreness levels from pre exercise to
24 hours post exercise, where the healthy subjects had an 18.8 mm increase in muscle
A B
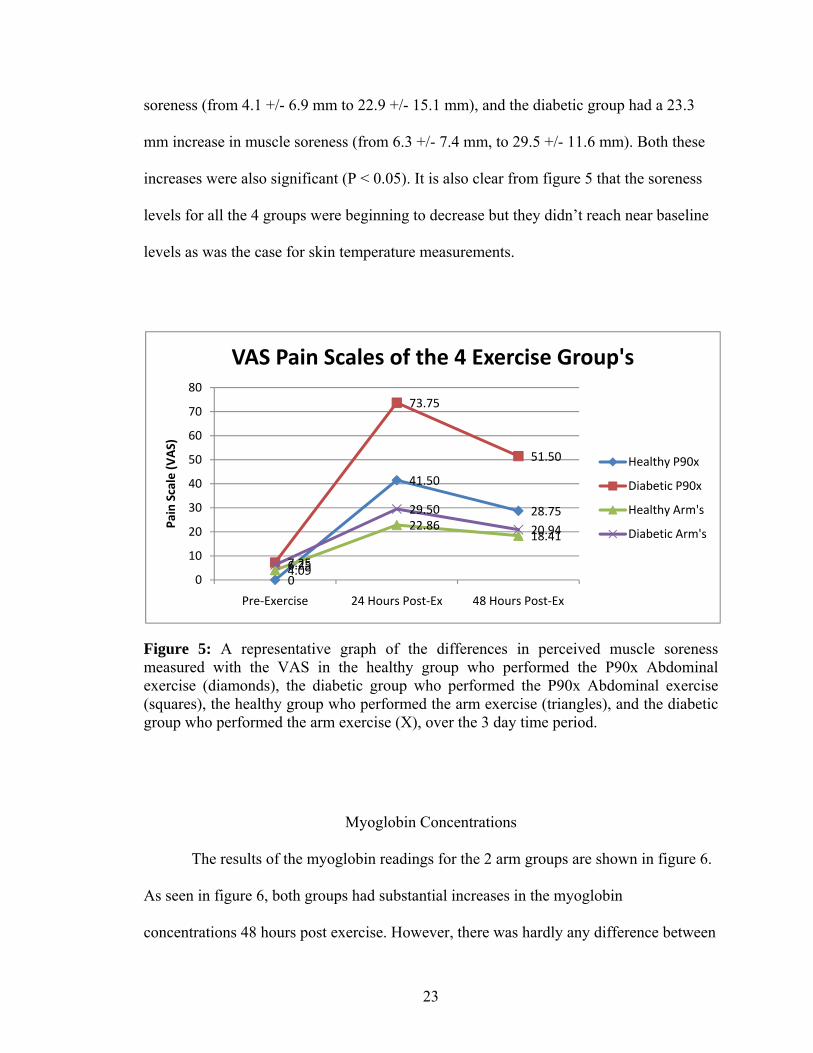
23
soreness (from 4.1 +/- 6.9 mm to 22.9 +/- 15.1 mm), and the diabetic group had a 23.3
mm increase in muscle soreness (from 6.3 +/- 7.4 mm, to 29.5 +/- 11.6 mm). Both these
increases were also significant (P < 0.05). It is also clear from figure 5 that the soreness
levels for all the 4 groups were beginning to decrease but they didn’t reach near baseline
levels as was the case for skin temperature measurements.
Figure 5: A representative graph of the differences in perceived muscle soreness measured with the VAS in the healthy group who performed the P90x Abdominal exercise (diamonds), the diabetic group who performed the P90x Abdominal exercise (squares), the healthy group who performed the arm exercise (triangles), and the diabetic group who performed the arm exercise (X), over the 3 day time period.
Myoglobin Concentrations
The results of the myoglobin readings for the 2 arm groups are shown in figure 6.
As seen in figure 6, both groups had substantial increases in the myoglobin
concentrations 48 hours post exercise. However, there was hardly any difference between
0
41.50
28.75
7.25
73.75
51.50
4.09
22.8618.41
6.25
29.50
20.94
0
10
20
30
40
50
60
70
80
Pre‐Exercise 24 Hours Post‐Ex 48 Hours Post‐Ex
Pain Scale (VAS)
VAS Pain Scales of the 4 Exercise Group's
Healthy P90x
Diabetic P90x
Healthy Arm's
Diabetic Arm's

24
the 2 measurements (pre, and post) on day 1, for both the groups (P > 0.1). The healthy
group had an increase of approximately 146 nanograms per milliliter (ng/mL) of blood on
day 3, compared to day 1(from 31.03 +/- 8.25 to 177 +/- 222). This increase was highly
significant (P < 0.05). The diabetic group who performed the same arm exercise had an
even larger increase in myoglobin concentrations, when compared to the healthy
individuals. This group had an increase of almost 337 ng/mL of blood at 48 hours, when
compared to baseline (from 50.9 +/- 19.2 to 388.35 +/- 411.9). This increase in the
myoglobin level was also very significant (P < 0.05).
A correlation analysis was done between the myoglobin measurements and the
other 2 variables (skin temperature and VAS). It was found that there was a strong
correlation between the peak skin temperature measurements (day 2), and the peak
myoglobin readings (day 3). This correlation was highly significant (r = 0.41, P < 0.05).
There was also a relevant correlation between the myoglobin readings on day 3, and the
VAS measurements on day 3. This correlation was also very significant (r = 0.47, P <
0.05).

25
Figure 6: A representative graph of the differences in Myoglobin levels between the healthy group who performed the arm exercise (diamonds), and the diabetic group who performed the arm exercise (squares) at 3 different time periods (Day 1 pre & post, and day 3).
Discussion
In the present investigation, subjects participated in an intense exercise program
involving a single bout of exercise to identify the usability of thermal infra red imaging
for detecting DOMS. From this investigation, it was found that IR imaging could be a
valid technique for determining DOMS within the first day of exercising.
Diabetes causes a chronic increase in whole body inflammation. 34 Due to this,
and to the metabolic, and endothelial impairments associated with diabetes, exercise
performance and training may become impaired in this population. 35,36 Even though in
our investigation, both the diabetes groups did not exercise as hard as the other 2 groups,
they had more muscle soreness than the healthier groups. However, exercise is still the
best means of increasing glycemic control in diabetics because it enhances the body’s
31.03 31.04
177.04
50.91 49.61
388.35
0
50
100
150
200
250
300
350
400
450
Day 1 (Pre) Day 1 (Post) Day 3 (48 Hours)
Myoglobin Levels of the 2 Arm Exercise Groups
Healthy
Diabetes
26
insulin sensitivity. 1 Exercise has also been associated with a mean reduction in HbA1c of
approximately 0.80%, especially muscle building exercises, as an increased overall
muscle mass has been associated with better insulin sensitivity. 4,37 This obviously gives
the diabetic individual a better chance of coping with the disease, and preventing its
symptoms from getting worse. 2,38
An interesting finding in this study was that the 2 groups who performed the
abdominal exercise had higher skin temperatures, and increased soreness levels when
compared to the groups who did the arm exercise. This could be due to the fact that the
abdominal exercise was slightly longer in duration than the arm exercise, or because the
abdominal muscles are larger in size than the biceps muscle. Another justification would
be that the abdominal muscles are closer to the core, and are slightly warmer to begin
with when compared to the peripheral arm muscles.
Pennes 39 provided a very detailed model of heat flow from muscle to skin in
limbs. This model predicts that heat in deeper tissues such as muscles can be dissipated
into blood and into the skin through conductive heat exchange. When muscles exercise,
heat is developed in the muscle due to frictional forces of the muscle fibers and from the
increased metabolism. 40 Increased blood flows to the muscle would also contribute to the
increased heat in the muscle after exercising.
Skin is a shell tissue and its temperature is usually about 6 degrees less than that
of the core. 41-43 The skin must be kept cooler than the core so that heat can move from
the core to the skin and be removed by radiation, conduction and evaporation. 42,44-46 Heat
moves from the muscle both into the blood perfusing muscle and is dissipated throughout
the body and also flows to the cooler skin area. 39-41 This allows core temperature to be

27
maintained at a regulated level. 35,39,47 Muscle is also a shell tissue, where its temperature
is usually 32 to 33 °C, which is slightly warmer than that of skin. However when blood
flow is increased to the exercised muscle, it approaches the temperature of the core
tissues which is approximately 37°C. 33,39 Blood flow in skeletal muscle is very dynamic.
However, when tissue is damaged during exercise, blood flow can increase dramatically.
Thus, warm blood entering muscle when tissue repair is being accomplished as part of
the inflammatory response, can deliver a great deal of heat into the tissue. 6,48 The
increased blood flow should go back to normal within an hour or two of the exercise
termination, but when temperatures are still elevated at 24 hours post exercise, this shows
that damage has happened to the exercised muscle and causes a hot spot under the skin.
Thus, the elevated skin temperatures found 24 hours post exercise in all subjects
is possibly the result of higher blood flows in muscle due to inflammation, and tissue
damage repair. 6 Therefore, if muscle blood flow remained elevated post exercise, the
warmer core blood would keep the muscle warm and hence the overlying skin would stay
warm. This occurrence has been seen with thermal imaging for breast tumors in women,
where tumors under the skin have this same effect and therefore form the basis for breast
thermal imaging to detect tumors. 31,49 In fact, IR imaging has been used to detect and
diagnose a number of other diseases, 30,32,33,50-52 as changes in the human body’s
temperature has always been an indicator of some sort of dysfunction. 51 Increased
circulation associated with delayed onset muscle soreness could also be seen as increased
tissue temperature resulting from a muscular dysfunction.
The elevated myoglobin concentrations on day 3 also verify this muscle soreness
response after exercise. Myoglobin is a monomer protein, which has several functions

28
regarding oxygen storage and transport in the muscles. After strenuous exercise,
myoglobin can be released in the bloodstream due to the breakdown of cell membranes in
the exercised muscles. 53,54 Muscle damage Biomarkers, such as myoglobin, may increase
30 minutes after exercising, and peak at 24 to 72 hours post exercise. 53 For that reason,
we made a measurement of venous myoglobin at 48 hours post exercise, to identify the
peak myoglobin response. Fortunately, as was seen in the correlation analyses, there was
a strong relationship between the myoglobin concentrations on day 3, and the skin
temperature measurements on the day before. This finding validates the usability of
thermal imaging to detect DOMS in its initial stages. Even though skin temperatures and
soreness levels were returning back to normal at 48 hours post exercise, the myoglobin
concentrations were dramatically high. This exaggerated release of myoglobin from
muscle could be due to the muscles response to the low grade inflammation and damage
after the exercise. 53,55
There were a couple of limitations in this study. First, the sample sizes weren’t
equal between the groups that did the abdominal exercises, and the arm exercise groups.
A main reason for this could be due to the fact that the arm exercise session, which was
done prior to the abdominal exercise session, needed more commitment from the
subjects, as it was extended to more than 3 days. Second, myoglobin was only measured
for the arm exercise group. This was due to cost. Third, the exercise routines between the
2 groups were different. However, this was necessary because the abdominal muscles are
larger than the arm muscles, and an exercise that challenges the abdominal muscles,
without causing back pain was needed for the purpose of this study.

29
Despite the limitations of this study, we have provided evidence to suggest that
thermal imaging could be of great value in identifying which muscles have been
exercised and are sore, hours or even days after the exercise is over. Thermal imaging
would then be a painless, and non invasive way of detecting DOMS in its early stages,
which could minimize further injuries from over-exercising in both healthy individuals,
and in people who have diabetes. This could be more beneficial for the diabetic
individuals, as they don’t always realize that they are sore, due to the neuropathies and
impairments they have.
Acknowledgements
We wish to acknowledge a contract (WS1763368) from Pfizer Pharmaceuticals
for support in this work. We would also like to thank the Saudi Arabian Ministry of
Higher Education (MOHE) for their support.
30
References
1. Zanuso S, Jimenez A, Pugliese G, Corigliano G, Balducci S. Exercise for the management of type 2 diabetes: a review of the evidence. Acta Diabetologica. 2009;47(1):15-22.
2. Hills AP, Shultz SP, Soares MJ, et al. Resistance training for obese, type 2 diabetic adults: a review of the evidence. Obesity Reviews. 2009;11(10):740-749.
3. Castaneda C. Diabetes control with physical activity and exercise. Nutrition in clinical care. 2003;6(2):89-96.
4. Srikanthan P, Karlamangla AS. Relative Muscle Mass Is Inversely Associated with Insulin Resistance and Prediabetes. Findings from The Third National Health and Nutrition Examination Survey. Journal of Clinical Endocrinology & Metabolism. 2011.
5. Cheung K, Hume PA, Maxwell L. Delayed Onset Muscle Soreness: Treatment strategies and Performance Factors. Sports Med. 2003;33(2):145-164.
6. MacIntyre DL, Reid WD, McKenzie DC. Delayed Muscle Soreness: The Inflammatory Response to Muscle Injury and its Clinical Implications. Sports Med. 1995;20(1):24-40.
7. Armstrong RB. Mechanisms of exercise-induced delayed onset muscular soreness: a brief review. Medicine and Science in Sports and Exercise. 1984;16(6):529-538.
8. Evans WJ. Exercise, nutrition and aging. J Nutr. Mar 1992;122(3 Suppl):796-801.
9. Fielding RA, Meredith CN, O'Reilly KP, Frontera WR, Cannon JG, Evans WJ. Enhanced protein breakdown after eccentric exercise in young and older men. J Appl Physiol. Aug 1991;71(2):674-679.
10. Petrofsky J, Batt J, Bollinger JN, Jensen MC, Maru EH, Al-Nakhli HH. Comparison of Different Heat Modalities for Treating Delayed-Onset Muscle Soreness in People with Diabetes. Diabetes Technology & Therapeutics. 2011;13(6):645-655.
11. Kanter MM. Free radicals, exercise, and antioxidant supplementation. Int J Sport Nutr. Sep 1994;4(3):205-220.
12. Helewa A, Goldsmith CH, Smythe HA. Measuring abdominal muscle weakness in patients with low back pain and matched controls: a comparison of 3 devices. J Rheumatol. Sep 1993;20(9):1539-1543.
13. Mayer JM, Mooney V, Matheson LN, et al. Continuous low-level heat wrap therapy for the prevention and early phase treatment of delayed-onset muscle soreness of the low back: a randomized controlled trial. Arch Phys Med Rehabil. Oct 2006;87(10):1310-1317.

31
14. Jaskolska A, Swistak R, Bogucka M, Jaskolski A. [Methods of prevention and reduction of delayed muscle soreness (DOMS)]. Przegl Lek. 2003;60(5):353-358.
15. Bonacci JV, Harris T, Wilson JW, Stewart AG. Collagen-induced resistance to glucocorticoid anti-mitogenic actions: a potential explanation of smooth muscle hyperplasia in the asthmatic remodelled airway. Br J Pharmacol. Apr 2003;138(7):1203-1206.
16. Reilly T, Ekblom B. The use of recovery methods post-exercise. J Sports Sci. Jun 2005;23(6):619-627.
17. Howatson G, Someren KAV. The Prevention and Treatment of Exercise-Induced Muscle Damage. Sports Med. 2008;38(6):483-503.
18. Warren GL, Lowe DA, Armstrong RB. Measurement Tools Used in the Study of Eccentric Contraction-Induced Injury. Sports Med. 1999;27(1):43-59.
19. Hilbert JE, Sforzo GA, Swensen T. The Effects of Massage on Delayed Onset Muscle Soreness. Br J Sports Med. 2003;37:72-75.
20. Symons TB, Clasey JL, Gater DR, Yates JW. Effects of Deap Heat as a Preventative Mechanism on Delayed Onset Muscle Soreness. Journal of Strength and Conditioning Research. 2004;18(1):155-161.
21. Vaile JM, Gill ND, Blazevich AJ. The Effect of Contrast Water Therapy on Symptoms of Delayed Onset Muscle Soreness. Journal of Strength and Conditioning Research. 2007;21(3):697-702.
22. Stone MB, Merrick MA, Ingersoll CD, Edwards JE. Preliminary Comparison of Bromelain and Ibuprofen for Delayed Onset Muscle Soreness Management. Clinical Journal of Sports Medicine. 2002;12:373-378.
23. Barlas P, Craig JA, Robinson J, Walsh DM, Baxter GD, Allen JM. Managing Delayed-Onset Muscle Soreness: Lack of Effect of Selected Oral Systemic Analgesics. Arch Phys Med Rehabil. 2000;81:966-972.
24. Jackman SR, Witard OC, Jeukendrup AE, Tipton KD. Branched-Chain Amino Acid Ingestion Can Ameliorate Soreness from Eccentric Exercise. Medicine & Science in Sports & Exercise. 2010;42(5):962-970.
25. Clarkson PM, Ebbeling C. Investigation of Serum Creatine Kinase Variability after Muscle-Damaging Exercise. Clin Sci. 1988;75(3):257-261.
26. Vaile J, Halson S, Gill N, Dawson B. Effect of hydrotherapy on the signs and symptoms of delayed onset muscle soreness. European Journal of Applied Physiology. 2007;102(4):447-455.
32
27. Vinck E, Cagnie B, Coorevits P, Vanderstraeten G, Cambier D. Pain reduction by infrared light-emitting diode irradiation: a pilot study on experimentally induced delayed-onset muscle soreness in humans. Lasers in Medical Science. 2006;21(1):11-18.
28. Barlas P, Robinson J, Allen J, Baxter GD. Lack of effect of acupuncture upon signs and symptoms of delayed onset muscle soreness. Clinical physiology. 2000;20(6):449-456.
29. Frey Law LA, Evans S, Knudtson J, Nus S, Scholl K, Sluka KA. Massage Reduces Pain Perception and Hyperalgesia in Experimental Muscle Pain: A Randomized, Controlled Trial. The Journal of Pain. 2008;9(8):714-721.
30. Herman C, Cetingul MP. Quantitative Visualization and Detection of Skin Cancer Using Dynamic Thermal Imaging. JoVE. 2011;51.
31. Wang J, Chang K-J, Chen C-Y, et al. Evaluation of the diagnostic performance of infrared imaging of the breast: a preliminary study. BioMedical Engineering OnLine. 2010;9(1):3.
32. Murray AK, Moore TL, Manning JB, Taylor C, Griffiths CEM, Herrick AL. Noninvasive imaging techniques in the assessment of scleroderma spectrum disorders. Arthritis & Rheumatism. 2009;61(8):1103-1111.
33. Ivanitsky GR, Khizhnyak EP, Deev AA, Khizhnyak LN. Thermal imaging in medicine: A comparative study of infrared systems operating in wavelength ranges of 3–5 and 8–12 μm as applied to diagnosis. Doklady Biochemistry and Biophysics. 2006;407(1):59-63.
34. Kanter MM. Free radicals, exercise, and antioxidant supplementation. International journal of sport nutrition. 1994;4(3):205-220.
35. Petrofsky J, Lee H, Trivedi M, et al. The Influence of Aging and Diabetes on Heat Transfer Characteristics of the Skin to a Rapidly Applied Heat Source. Diabetes Technology & Therapeutics. 2010;12(12):1003-1010.
36. Momma H, Niu K, Kobayashi Y, et al. Skin advanced glycation end product accumulation and muscle strength among adult men. European Journal of Applied Physiology. 2010;111(7):1545-1552.
37. Church TS, Blair SN, Cocreham S, et al. Effects of Aerobic and Resistance Training on Hemoglobin A1c Levels in Patients With Type 2 Diabetes. JAMA: The Journal of the American Medical Association. 2010;304(20):2253-2262.
38. Burr J, Rowan C, Jamnik V, Riddell M. The role of physical activity in type 2 diabetes prevention: physiological and practical perspectives. Phys Sportsmed. 2010;38(1):72-82.
39. Pennes HH. Analysis of Tissue and Arterial Blood Temperatures in the Resting Human Forearm. J Appl Physiol. 1948;1(2):93-122.

33
40. Petrofsky J, Paluso D, Anderson D, et al. The contribution of skin blood flow in warming the skin after the application of local heat; the duality of the Pennes heat equation. Medical Engineering & Physics. 2011;33(3):325-329.
41. Petrofsky J, Bains G, Prowse M, et al. Does skin moisture influence the blood flow response to local heat? A re-evaluation of the Pennes model. J Med Eng Technol. 2009;33(7):532-537.
42. Cranston WI, Gerbrandy J, Snell ES. Oral, Rectal and Oesophageal Temperatures and Some Factors Affecting Them in Man. J Physiol. 1954;126:347-358.
43. Rowell LB, Murray JA, Brengelmann GL, Kraning KK. Human Cardiovascular Adjustments to Rapid Changes in Skin Temperature during Exercise. Circ. Res. 1969;24:711-724.
44. Petrofsky J, Bains G, Prowse M, et al. Dry heat, moist heat and body fat: are heating modalities really effective in people who are overweight? J Med Eng Technol. 2009;33(5):361-369.
45. Petrofsky J. The effect of the subcutaneous fat on the transfer of current through skin and into muscle. Medical Engineering & Physics. 2008;30(9):1168-1176.
46. Rowell LB. Cardiovascular aspects of human thermoregulation. Circ. Res. 1983;52:367-379.
47. Petrofsky J, Goraksh N, Alshammari F, et al. The ability of the skin to absorb heat; the effect of repeated exposure and age. Med Sci Monit. 2011;17(1):CR1-8.
48. Chatzinikolaou A, Fatouros IG, Gourgoulis V, et al. Time Course of Changes in Performance and Inflammatory Responses After Acute Plyometric Exercise. J Strength Cond Res. 2010;24(5):1389-1398.
49. Kennedy DA, Lee T, Seely D. A Comparative Review of Thermography as a Breast Cancer Screening Technique. Integrative Cancer Therapies. 2009;8(1):9-16.
50. Zaproudina N, Ming Z, Hanninen OOP. Plantar Infrared Thermography Measurements and Low Back Pain Intensity. Journal of Manipulative and Physiological Therapeutics. 2006;29(3):219-223.
51. Jiang LJ, Ng EYK, Yeo ACB, et al. A perspective on medical infrared imaging. Journal of Medical Engineering & Technology. 2005;29(6):257-267.
52. Kim Y-C, Bahk J-H, Lee S-C, Lee Y-W. Infrared Thermographic Imaging in the Assessment of Successful Block on Lumbar Sympathetic Ganglion. Yonsei Medical Journal. 2003;44(1):119-124.
53. Brancaccio P, Lippi G, Maffulli N. Biochemical markers of muscular damage. Clinical Chemistry and Laboratory Medicine. 2010;48(6):757-767.

34
54. Ordway GA. Myoglobin: an essential hemoprotein in striated muscle. Journal of Experimental Biology. 2004;207(20):3441-3446.
55. Neubauer O, König D, Wagner K-H. Recovery after an Ironman triathlon: sustained inflammatory responses and muscular stress. European Journal of Applied Physiology. 2008;104(3):417-426.

35
CHAPTER THREE
THE USE OF THERMAL INFRA-RED IMAGING TO DETECT DELAYED ONSET
MUSCLE SORENESS
Authors: Hani H. Al-Nakhli1, Jerrold S. Petrofsky1,2, Michael S. Laymon2, Lee S. Berk1
1 Loma Linda University, Loma Linda, California
2 Azusa Pacific University, Azusa, California
Corresponding author: Dr. Jerrold S. Petrofsky at [email protected]
Keywords: (DOMS, Imaging, Thermal, Infra-Red, Muscle, Soreness, Thermography)

36
Short Abstract
The purpose of this investigation was to assess whether using an infra-red thermal
camera is a valid tool for detecting and quantifying the muscle soreness after exercising.
Long Abstract
Delayed onset muscle soreness (DOMS), also known as exercise induced muscle
damage (EIMD), is commonly experienced in individuals who have been physically
inactive for prolonged periods of time, and begin with an unexpected bout of exercise 1-4,
but can also occur in athletes who exercise beyond their normal limits of training 5. The
symptoms associated with this painful phenomenon can range from slight muscle
tenderness, to severe debilitating pain 1,3,5. The intensity of these symptoms and the
related discomfort increases within the first 24 hours following the termination of the
exercise, and peaks between 24 to 72 hours post exercise 1,3. For this reason, DOMS is
one of the most common recurrent forms of sports injury that can affect an individual’s
performance, and become intimidating for many 1,4.
For the last 3 decades, the DOMS phenomenon has gained a considerable amount
of interest amongst researchers and specialists in exercise physiology, sports, and
rehabilitation fields 6. There has been a variety of published studies investigating this
painful occurrence in regards to its underlying mechanisms, treatment interventions, and
preventive strategies 1-5,7-12. However, it is evident from the literature that DOMS is not
an easy pathology to quantify, as there is a wide amount of variability between the
measurement tools and methods used to quantify this condition 6. It is obvious that no
agreement has been made on one best evaluation measure for DOMS, which makes it

37
difficult to verify whether a specific intervention really helps in decreasing the symptoms
associated with this type of soreness or not. Thus, DOMS can be seen as somewhat
ambiguous, because many studies depend on measuring soreness using a visual analog
scale (VAS) 10,13-15, which is a subjective rather than an objective measure. Even though
needle biopsies of the muscle, and blood levels of myofibre proteins might be considered
a gold standard to some 6, large variations in some of these blood proteins have been
documented 6,16, in addition to the high risks sometimes associated with invasive
techniques.
Therefore, in the current investigation, we tested a thermal infra-red (IR) imaging
technique of the skin above the exercised muscle to detect the associated muscle
soreness. Infra-red thermography has been used, and found to be successful in detecting
different types of diseases and infections since the 1950’s 17. But surprisingly, near to
nothing has been done on DOMS and changes in skin temperature. The main purpose of
this investigation was to examine changes in DOMS using this safe and non-invasive
technique.
Protocol
The Exercise
The muscle of interest for this experiment was the elbow flexors (Biceps Brachii).
Muscle strength was measured for each participant to be able to give each individual an
appropriate resistance. This was determined by testing each participant for their
resistance maximum (RM). For testing the RM, we used a strain gauge device interfaced
with a computer through a BioPac (DA-100C) bioelectric amplifier module (BioPac
Systems, Goleta, CA) to measure muscle strength. The module was connected to an MP-

38
100 analog to digital converter sampling at a frequency of 1,000 hertz per second, and at
a resolution of 24 bits (Fig. 7).
Figure 7. A) The BioPac Modules used for measuring the muscle strength. B) The strain gauge device fixed to a 45° angled bench and hooked to the BioPac system.
The strain gauge device was fixed to a bench at a 45° angle. The subjects were
instructed to sit behind the device and rest their elbows on the padded area, so that the
exertion force is through their wrists. This was the best way to insure that the subject will
not recruit any muscle other than the biceps (Fig. 8).
A B
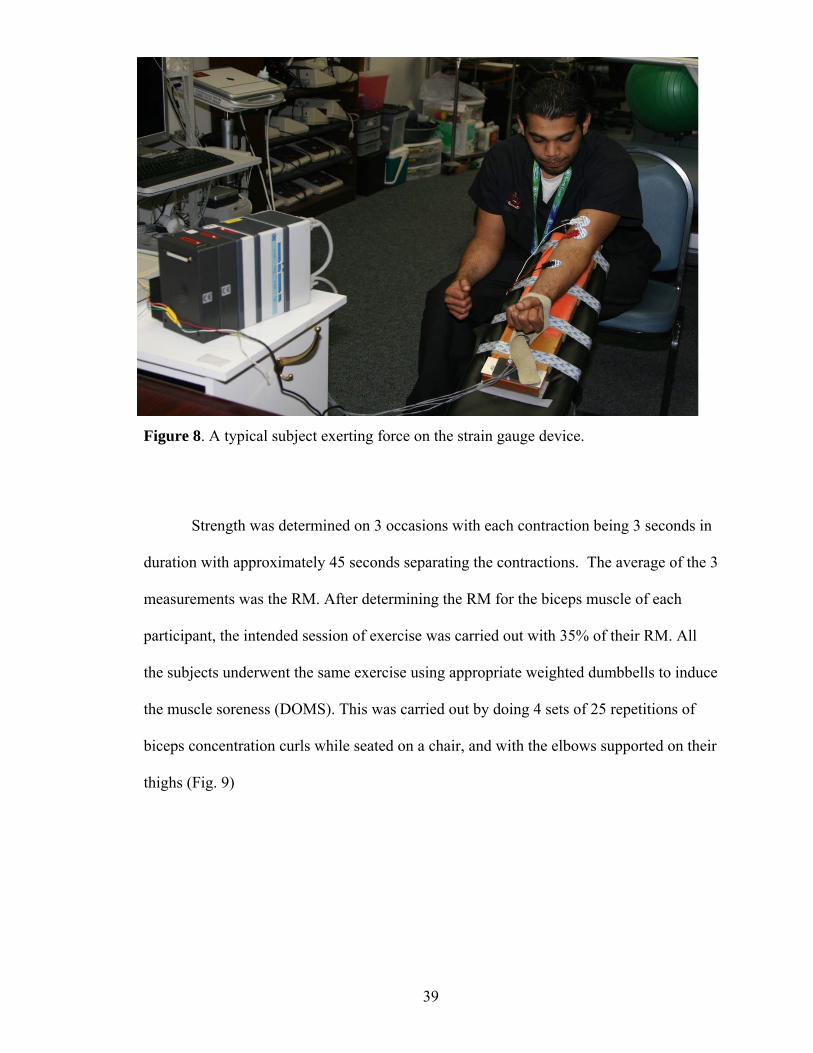
39
Figure 8. A typical subject exerting force on the strain gauge device.
Strength was determined on 3 occasions with each contraction being 3 seconds in
duration with approximately 45 seconds separating the contractions. The average of the 3
measurements was the RM. After determining the RM for the biceps muscle of each
participant, the intended session of exercise was carried out with 35% of their RM. All
the subjects underwent the same exercise using appropriate weighted dumbbells to induce
the muscle soreness (DOMS). This was carried out by doing 4 sets of 25 repetitions of
biceps concentration curls while seated on a chair, and with the elbows supported on their
thighs (Fig. 9)

40
Figure 9. A subject undergoing the exercise protocol for inducing muscle soreness.
Each subject was given a 90 second resting period between each set. Subjects
either did the full set of 25 repetitions, or were instructed to stop if they failed to steadily
control the weight during the exercise.
Infra-Red Camera Preparation & Setup
The room where the infra-red imaging takes place was set at a constant
temperature to minimize any external bias from differences in room temperature, which
could lead to false thermal readings. For the purpose of this experiment we had a
temperature controlled room which was maintained at approximately 23°C (+/- 0.5°C).
The camera was set at a distance of 1 meter away, and at a perpendicular angle to the skin
being measured. (Fig. 10a)*
A B

41
After the required distance was set up, the subjects were advised to stand still
until the image has been taken. This shouldn’t take more than a couple of seconds, but it
is very critical to minimize movement to insure the accuracy of the taken image. It is
preferable that the room has darker colored paint, rather than lighter colors, to minimize
any infra-red interference. Lighting is also critical when dealing with infra-red images,
because light source that emit infra-red waves like fluorescent or tungsten lighting could
give false high readings. The best lighting option would be a room equipped with
uniform LED lights, as LED lights hardly produce any infra-red interference. (Fig. 10b) *
Figure 10. A) The Setup of the IR Camera 1 meter away from the subjects arm. B) The LED lights used in the lab where the images were taken.
* A series of tests were done at our labs using the FLIR 660 IR Camera (Fig. 11), where
we compared images of the skin at different angles (0 (perpendicular), 15, 30, 45, and 60
degrees), and at different distances (1, 2, and 5 meters) from the skin, to accurately detect
the temperature of the skin. All images were compared to calibrated thermocouples, and
the best correlation between the images and the thermocouple readings was at a
A B

42
perpendicular angle and at a distance of 1 meter away from the skin (r = 0.93). The
different angles and distances caused a pixilation loss, and decreased the overall
correlation between the images and the thermocouple readings.
Figure 11. The IR thermal camera used for this investigation (FLIR 660)
Image acquirement
For the purpose of this experiment, the image of the exercised muscle was taken
before the exercise, and at 24, and 48 hours post exercise. Body heat from sources other
than the target could disrupt the thermal image and give false readings. For this reason,
no one should be standing beside or behind the intended target. In this investigation,
pictures of both the exercised and non-exercised arm were taken for comparison
purposes. We exercised one of the arms, as was mentioned previously, and the other arm
was used as a control. (Fig. 12 and 13). Image numbers from the IR camera were
recorded immediately on a separate spreadsheet, as it could be difficult to identify which
image belongs to whom.

43
Figure 12. A) a typical IR image of a subject’s exercised arm before the exercise. B) an IR image of the same subjects arm 24 hours after the exercise
Figure 13. A) a typical IR image of a subject’s un-exercised arm before the exercise. B) an IR image of the same subjects arm 24 hours after the exercise.
A B
A B

44
Image Processing & Analyses
The acquired IR images were processed using the “ThermoVision® ExaminIR™”
software Version: 1.10.2. After selecting the required image for analysis, four regions of
interest were identified on the acquired image of the arm using statistical boxes on the
software interface. (Fig.14)
Figure 14. An illustration of the 4 regions of interest for analyzing the thermal image of the arm
When the required regions across the arm have been located, the software shows
the Means and Standard Deviations of the temperatures for each of the selected regions.
Region
4
Region
3
Region
2
Region
1

45
We can then either cross compare each region individually or obtain an average
temperature of the whole arm. (Fig. 15)
Figure 15. Software interface for the “ ThermoVision® ExaminIR™ ” showing the 4 boxes of interest on an IR image of an exercised arm. Also shown are the statistical interpretations for each box.
Visual Analog Scale and Blood Analysis
Visual analog scales (VAS) were used to assess subjective soreness of the arm.
The scale had a 10 cm (100mm) long line marked “no pain” at one end, and “extremely
sore” at the opposite end. Each participant was directed to make a mark along the 10 cm
line to indicate their response to soreness. The VAS’s were administered to the subjects
before the exercise, 24 hours after the exercise, and at 48 hours. Peripheral blood was
collected from the subjects to measure myoglobin concentration levels in the blood.

46
The blood was drawn from the subjects antecubital vein before the exercise, 30 minutes
after the exercise was over, and at 48 hours. The blood was centrifuged at 4000 rpm for
10 min to separate the serum from the cells. The samples were then stored at -80°C until
the analyses of myoglobin was done. Myoglobin was measured using a TOSOH “AIA®-
360” Automated enzyme Immunoassay Analyzer (TOSOH Corp., Tokyo, Japan). The
myoglobin Assay kits (Myo 025297, ST AIA-PACK Myoglobin) were used according to
the manufactures instructions.
Representative Results
The results of IR thermal images taken during this investigation are clearly
represented in Figure 16. Images taken at the 3 time periods (pre-exercise, 24 hours post-
exercise, and 48 hours post-exercise) for the exercised arms of the 41 subjects, showed a
noticeable increase in temperature on day 2 (24 hours post-exercise) when compared to
pre-exercise temperatures, and temperatures taken at 48 hours. As shown in Figure 1, the
average skin temperature was 32.80 +/- 1.03 °C for day 1 (pre-exercise), and 33.96 +/-
1.46 °C for day 2 (24 hours post-exercise), and 32.82 +/- 1.29 for day 3 (48 hours post-
exercise). This difference in skin temperature from day 1 to day 2 was significant
(ANOVA p < 0.01).
However, for the un-exercised arm, changes amongst the 3 time periods were not
evident. Figure 16 shows that the average skin temperature was 33.08 +/- 0.83 °C for day
1 (pre-exercise), and 32.79 +/- 1.42 °C for day 2 (24 hours post-exercise), and 33.17 +/-
0.95 for day 3 (48 hours post-exercise). This difference in skin temperature over the 3
days was not significant (ANOVA p = 0.38).

47
Figure 16. A representative graph of the differences in skin temperature in the exercised arms (Diamonds), and un-exercised arms (Squares) of the 41 subjects over the 3 day time period.
The results of the pain readings from the VAS are shown in Figure 17. As seen in
Figure 17, the reported pain had a dramatic increase on days 2 and 3. Pain levels of the
exercised muscle increased from 3.6 +/- 6.1 on day 1, to 36.3 +/- 22.8 on day 2, and 37.5
+/- 25.3 on day 3. This increase from day 1 was significant (ANOVA p < 0.01).
32.80
33.97
32.8233.08
32.79
33.17
32.032.232.432.632.833.033.233.433.633.834.034.234.4
Pre‐Exercise 24 Hours Post‐Exercise
48 Hours Post‐Exercise
The Differences in Skin Temperature from Pre‐Exercise to 48 Hours Post‐Exercise in
Both Arms
Exercised Arm
Non Exercised Arm

48
Figure 17. A representative graph of the differences in perceived muscle soreness measured with the VAS over the 3 day time period for all the 41 subjects.
The results of the myoglobin concentration levels are shown in Figure 18. As seen
in this figure, there was hardly any change between the 2 myoglobin concentrations on
day 1 (pre, & 30 minutes post exercise). But on day 3, the increase in myoglobin was
very large. This increase on day 3 was approximately 147 nanograms per milliliter
(ng/mL) of blood when compared to the first 2 concentrations on day 1. Myoglobin
concentrations were 30.12 +/- 7.66 ng/mL at baseline, 31.66 +/- 11.89 ng/mL 30 minutes
post exercise, and 178.96 +/- 249.51 ng/mL on day 3. This increase on day 3 was highly
significant (ANOVA p < 0.01).
3.61
36.27 37.54
0.0
10.0
20.0
30.0
40.0
50.0
60.0
70.0
Pre‐Exercise 24 Hours Post‐Exercise 48 Hours Post‐Exercise
VAS Scores from Pre‐Exercise to 48 Hours Post‐Exercise

49
Figure 18. A representative graph of the differences in myoglobin concentrations for all the 41 subjects over the 3 time periods.
A correlation analysis was done between the skin temperatures obtained from the IR
images, and the VAS soreness levels. It was found that there was a considerable
correlation between the VAS readings on day 2, and the skin temperature measurement
on day 2. This correlation was significant (r = 0.312, p < 0.05). However, there was no
evident correlation between the VAS readings and the skin temperatures on day 3. This
correlation was insignificant (r = 0.047, p = 0.77).
Discussion
The primary purpose of this investigation was to assess the usefulness of thermal
IR imaging in detecting and measuring muscle soreness after strenuous exercise, and our
results suggest that IR imaging could be a valid technique for detecting DOMS,
30.12 31.66
178.96
0.0
20.0
40.0
60.0
80.0
100.0
120.0
140.0
160.0
180.0
200.0
220.0
Pre‐Exercise 30 Minutes Post‐Exercise 48 Hours Post‐Exercise
Myoglobin Concentrations from Pre‐Exercise to 48 Hours Post‐Exercise

50
especially within the first 24 hours of exercising. This is not surprising, as Pennes 18
provided a very detailed model of heat flow from muscle to skin in limbs. This model
predicts that heat in deeper tissues such as muscles can be dissipated into blood and into
the skin through conductive heat exchange. When muscles exercise, obviously,
tremendous heat is developed in the muscle due to frictional forces of the muscle fibers
and because of the increased metabolism. Increased blood flows to the muscle would also
contribute to the increased heat in the muscle after exercising. Because muscle is a shell
tissue, the temperature is usually 32 to 33 °C, however when blood flow is increased to
the exercised muscle it approaches the temperature of the core tissues which is 37°C 18,19.
This increased blood flow should go back to normal within a couple of hours after the
exercise termination. But when temperatures are still elevated at 24 hours post exercise,
this shows that damage has happened to the exercised muscle. This damage in the muscle
causes additional heat transfer from the muscle to the overlying skin, which causes a
detectable hot spot under the skin.
IR imaging has been used to detect and diagnose many diseases 17,19-24. Changes
in the human body’s temperatures have always been indicators of dysfunction, where
increased heat is mainly associated with some sort of inflammation or infection 17. Thus,
the elevated skin temperatures found 24 hours post exercise in all subjects is possibly the
result of higher blood flows in muscle due to inflammation, and tissue damage repair 2.
Also, no noticeable increases in the skin temperature of the un-exercised arm occurred
during the 3 days of the study. Therefore, if muscle blood flow remained elevated in the
exercised arm, the warmer blood would keep the muscle warm and hence the overlying
skin would stay warm. As a result, breast tumors in women and skin cancer can be easily
51
detected by IR imaging because of the increased blood flows to the affected lesion site
20,21.
The elevated soreness levels (VAS) on day 2 and 3, and the increased myoglobin
concentrations on day 3 are both indicators of DOMS. This shows that the subjects did
get sore after the exercise session. As was seen in the results, there was a relationship
between the increased skin temperatures on day 2, and the increased soreness levels on
that same day. Myoglobin concentrations were still elevated on day 3, while skin
temperatures were returning back to normal. This delayed release of myoglobin into the
blood, could be due to the muscles slower response to inflammation and damage that
occurs in the muscle fibers after exercise 25,26.
However, 3 to 5 days later, there can still be minor tissue repair and
reconstruction, even though the blood flow maybe close to normal. That’s why on the 3rd
day we did not see a correlation between skin temperature and soreness levels, because
the damage was already done. Therefore, we believe that this is predictive of soreness,
because it shows that if you get sustained 24 hours increase in tissue blood flow, then you
know that you’ve got damage to the tissue. This damage was verified by the VAS
readings, and the myoglobin concentrations in the blood. Thus, the higher the skin
temperature readings 24 hours post exercise, the sorer the subject would be later on.
Hence, IR thermal imaging would be of great value in detecting DOMS in its
early stages. It would also be an interesting, and painless way of looking at muscles that
have been exercised and are sore, hours after the exercise is over. In a sports setting, this
early detection of DOMS could help in lowering the incidence of injuries from over-
exercising sore muscles on days following the initial exercise.
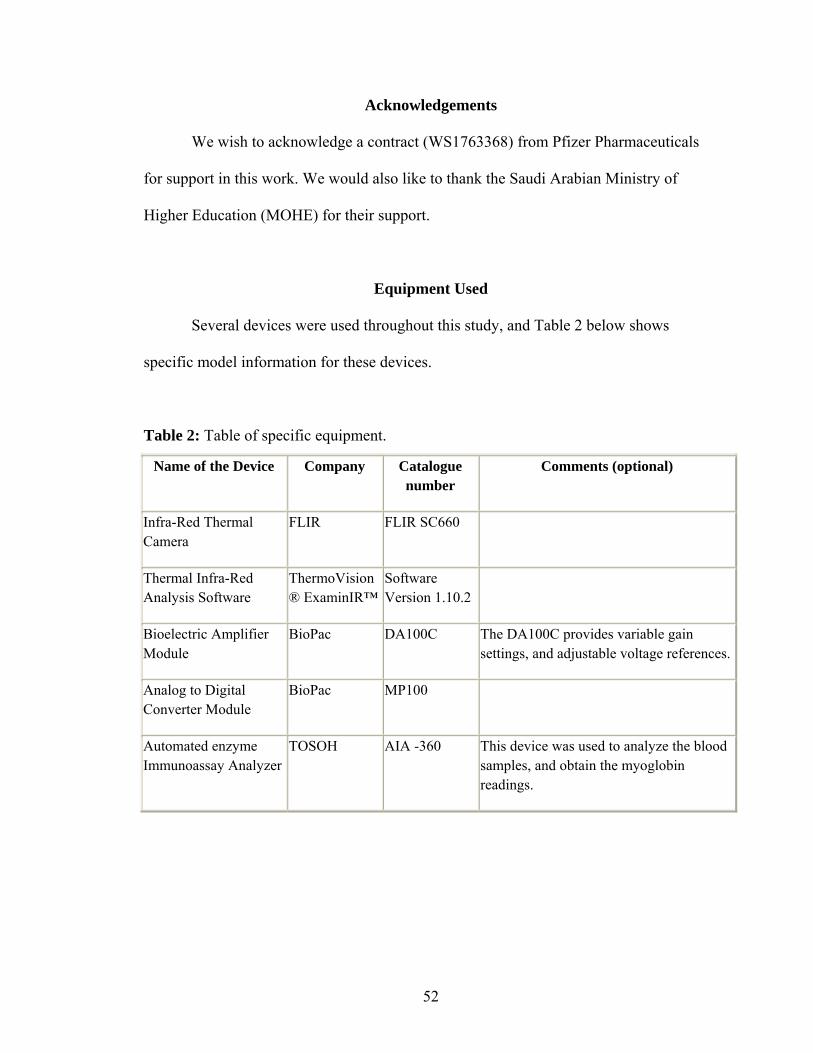
52
Acknowledgements
We wish to acknowledge a contract (WS1763368) from Pfizer Pharmaceuticals
for support in this work. We would also like to thank the Saudi Arabian Ministry of
Higher Education (MOHE) for their support.
Equipment Used
Several devices were used throughout this study, and Table 2 below shows
specific model information for these devices.
Table 2: Table of specific equipment.
Name of the Device Company Catalogue number
Comments (optional)
Infra-Red Thermal Camera
FLIR FLIR SC660
Thermal Infra-Red Analysis Software
ThermoVision® ExaminIR™
Software Version 1.10.2
Bioelectric Amplifier Module
BioPac DA100C The DA100C provides variable gain settings, and adjustable voltage references.
Analog to Digital Converter Module
BioPac MP100
Automated enzyme Immunoassay Analyzer
TOSOH AIA -360 This device was used to analyze the blood samples, and obtain the myoglobin readings.

53
References
1. Cheung, K., Hume, P. A. & Maxwell, L. Delayed Onset Muscle Soreness: Treatment strategies and Performance Factors. Sports Med 33, 145-164 (2003).
2. MacIntyre, D. L., Reid, W. D. & McKenzie, D. C. Delayed Muscle Soreness: The Inflammatory Response to Muscle Injury and its Clinical Implications. Sports Med 20, 24-40 (1995).
3. Armstrong, R. B. Mechanisms of exercise-induced delayed onset muscular soreness: a brief review. Medicine and Science in Sports and Exercise 16, 529-538 (1984).
4. Howatson, G. & Someren, K. A. V. The Prevention and Treatment of Exercise-Induced Muscle Damage. Sports Med 38, 483-503 (2008).
5. Petrofsky, J. et al. Comparison of Different Heat Modalities for Treating Delayed-Onset Muscle Soreness in People with Diabetes. Diabetes Technology & Therapeutics 13, 645-655, doi:10.1089/dia.2011.0002 (2011).
6. Warren, G. L., Lowe, D. A. & Armstrong, R. B. Measurement Tools Used in the Study of Eccentric Contraction-Induced Injury. Sports Med 27, 43-59 (1999).
7. Hilbert, J. E., Sforzo, G. A. & Swensen, T. The Effects of Massage on Delayed Onset Muscle Soreness. Br J Sports Med 37, 72-75 (2003).
8. Symons, T. B., Clasey, J. L., Gater, D. R. & Yates, J. W. Effects of Deap Heat as a Preventative Mechanism on Delayed Onset Muscle Soreness. Journal of Strength and Conditioning Research 18, 155-161 (2004).
9. Vaile, J. M., Gill, N. D. & Blazevich, A. J. The Effect of Contrast Water Therapy on Symptoms of Delayed Onset Muscle Soreness. Journal of Strength and Conditioning Research 21, 697-702 (2007).
10. Stone, M. B., Merrick, M. A., Ingersoll, C. D. & Edwards, J. E. Preliminary Comparison of Bromelain and Ibuprofen for Delayed Onset Muscle Soreness Management. Clinical Journal of Sports Medicine 12, 373-378 (2002).
11. Barlas, P. et al. Managing Delayed-Onset Muscle Soreness: Lack of Effect of Selected Oral Systemic Analgesics. Arch Phys Med Rehabil 81, 966-972 (2000).
12. Jackman, S. R., Witard, O. C., Jeukendrup, A. E. & Tipton, K. D. Branched-Chain Amino Acid Ingestion Can Ameliorate Soreness from Eccentric Exercise. Medicine & Science in Sports & Exercise 42, 962-970, doi:10.1249/MSS.0b013e3181c1b798 (2010).
13. Frey Law, L. A. et al. Massage Reduces Pain Perception and Hyperalgesia in Experimental Muscle Pain: A Randomized, Controlled Trial. The Journal of Pain 9, 714-721, doi:10.1016/j.jpain.2008.03.009 (2008).
54
14. Vaile, J., Halson, S., Gill, N. & Dawson, B. Effect of hydrotherapy on the signs and symptoms of delayed onset muscle soreness. European Journal of Applied Physiology 102, 447-455, doi:10.1007/s00421-007-0605-6 (2007).
15. Vinck, E., Cagnie, B., Coorevits, P., Vanderstraeten, G. & Cambier, D. Pain reduction by infrared light-emitting diode irradiation: a pilot study on experimentally induced delayed-onset muscle soreness in humans. Lasers in Medical Science 21, 11-18, doi:10.1007/s10103-005-0366-6 (2006).
16. Clarkson, P. M. & Ebbeling, C. Investigation of Serum Creatine Kinase Variability after Muscle-Damaging Exercise. Clin Sci 75, 257-261 (1988).
17. Jiang, L. J. et al. A perspective on medical infrared imaging. Journal of Medical Engineering & Technology 29, 257-267, doi:10.1080/03091900512331333158 (2005).
18. Pennes, H. H. Analysis of Tissue and Arterial Blood Temperatures in the Resting Human Forearm. J Appl Physiol 1, 93-122 (1948).
19. Ivanitsky, G. R., Khizhnyak, E. P., Deev, A. A. & Khizhnyak, L. N. Thermal imaging in medicine: A comparative study of infrared systems operating in wavelength ranges of 3–5 and 8–12 μm as applied to diagnosis. Doklady Biochemistry and Biophysics 407, 59-63, doi:10.1134/s1607672906020049 (2006).
20. Herman, C. & Cetingul, M. P. Quantitative Visualization and Detection of Skin Cancer Using Dynamic Thermal Imaging. JoVE 51, doi:10.3791/2679 (2011).
21. Wang, J. et al. Evaluation of the diagnostic performance of infrared imaging of the breast: a preliminary study. BioMedical Engineering OnLine 9, 3, doi:10.1186/1475-925x-9-3 (2010).
22. Murray, A. K. et al. Noninvasive imaging techniques in the assessment of scleroderma spectrum disorders. Arthritis & Rheumatism 61, 1103-1111, doi:10.1002/art.24645 (2009).
23. Zaproudina, N., Ming, Z. & Hanninen, O. O. P. Plantar Infrared Thermography Measurements and Low Back Pain Intensity. Journal of Manipulative and Physiological Therapeutics 29, 219-223 (2006).
24. Kim, Y.-C., Bahk, J.-H., Lee, S.-C. & Lee, Y.-W. Infrared Thermographic Imaging in the Assessment of Successful Block on Lumbar Sympathetic Ganglion. Yonsei Medical Journal 44, 119-124 (2003).
25. Brancaccio, P., Lippi, G. & Maffulli, N. Biochemical markers of muscular damage. Clinical Chemistry and Laboratory Medicine 48, 757-767, doi:10.1515/cclm.2010.179 (2010).
26. Neubauer, O., König, D. & Wagner, K.-H. Recovery after an Ironman triathlon: sustained inflammatory responses and muscular stress. European Journal of Applied Physiology 104, 417-426, doi:10.1007/s00421-008-0787-6 (2008).

55
CHAPTER FOUR
THE EFFECTS OF BRANCHED-CHAIN AMINO ACID SUPPLEMENTATION ON
DELAYED ONSET MUSCLE SORENESS IN PEOPLE WITH DIABETES
By:
Hani H. Al-Nakhli, MPT, Ph.D(C)
Jerrold S. Petrofsky, PhD, J.D.
Lee S. Berk, DrPH.
Darshita Dalal, MPT.
Inayat Kaur, MPT.
Vinit Dubey, MPT.
Swetha Regula, MPT.

56
Abstract
For individuals with diabetes, exercise is important for maintaining proper
glycemic control. However, exercise induces muscle soreness, making it problematic for
these individuals to maintain exercise regimes. In younger non-diabetic individuals,
studies have shown that nutritional supplementation including branched chain amino
acids (BCAA), enhance muscle recovery. The purpose of this blinded study was to assess
the effects of BCAA supplementation on delayed onset muscle soreness (DOMS) in
diabetics compared to healthy controls. Forty-four subjects; 28 healthy, and 16 with
diabetes, were randomly assigned to either the BCAA or placebo group. Measurements
including muscle strength, electromyography response of the biceps muscle during
maximum effort, perceived soreness, serum myoglobin concentration, elbow range of
motion, and skin temperatures were collected before the biceps exercise session and for
the five following days. The results showed that while serum myoglobin concentrations
increased at 48 hours for both the healthy and diabetic subjects, it was significantly
higher (P = 0.013) in the diabetic subjects who took the placebo supplement (pre-exercise
= 54.5 +/- 8 ng/mL, 48 hours = 767.1 +/- 189 ng/mL) when compared to those who took
the BCAA supplement (pre-exercise = 51.4 +/- 7 ng/mL, 48 hours = 158.1 +/- 62 ng/mL).
Pain was 79.6% higher in the diabetic group who took the placebo when compared to the
BCAA group (P = 0.017). In conclusion, BCAA supplementation reduced muscle
damage and muscle soreness in diabetic subjects, whereas they had minimal effects on
the healthy control subjects.
Keywords: BCAA, DOMS, Diabetes, Exercise

57
Introduction
The diabetes epidemic is on the rise in both developing and developed countries
[1,2]. According to the World Health Organization (WHO) and recent estimates, the
disease now affects approximately 345 million people worldwide and is expected to
affect around 440 million by 2030, representing almost 8% of the global adult population
[3,4]. Lifestyle characteristics such as obesity, a sedentary lifestyle, and lack of physical
activity are regarded as the most important risk factors, both independently associated
with diabetes and diabetes related co-morbidities [5,6].
Exercise is considered a major cornerstone of diabetes management. Studies have
shown that exercise is recommended as part of the treatment and prevention of type 2
diabetes mellitus (T2DM) [7,5,8]. Even though aerobic exercise has beneficial effects for
managing and treating T2DM, it has been found that resistance-type exercise is also
effective in controlling blood glucose, and in reducing Hemoglobin A1c (HbA1c) levels
[7,9-11]. It is best for individuals with diabetes to participate in a combination of both
aerobic and resistance exercise to properly manage their blood glucose levels. The effects
of combined exercise have shown more pronounced outcomes on glycemic control,
muscle strength, and insulin sensitivity [7,9,12]. A study done by Church and colleagues
[9], showed that a combination exercise group decreased their diabetes medication
dependency, when compared to a control group who had increased their use of diabetes
medications. It would be imperative then, to include resistance training as a primary step
in the exercise schedule of a diabetic patient. This is particularly important for obese
individuals, since aerobic exercise may be challenging for them.
Resistance training would be more beneficial for individuals with diabetes to
begin with, as it contributes to the recruitment of previously inactive muscle fibers, which
58
would enhance the quality of the muscle, and lead to gains in muscle mass [13,7,14]. This
would result in increased whole body insulin sensitivity, and improved glucose control
[13,7,5].
Delayed onset muscle soreness (DOMS) however, is a phenomenon that occurs in
skeletal muscle as a result of novel or unaccustomed exercise [15-17]. The severity of the
damage and the extent of discomfort is exacerbated over time, and occurs minutes to days
after the acute exercise bout [15,16]. The intensity of the symptoms and discomfort
associated with DOMS usually peaks between 24 to 72 hours post exercise, and can last
for up to 10 days, especially when the exercise bout encompasses an eccentric component
[17-19]. Activities that are comprised of repeated eccentric contractions have been shown
to result in damage to the ultrastructure of skeletal muscle[20,21]. This damage manifests
itself as a temporary decrease in muscle function, restricted range of motion in the
associated joint, increased muscle soreness, an increased swelling of the involved muscle
group, and an increase in intramuscular proteins in blood such as creatine kinase, and
myoglobin[22,23,20]. Consequently, DOMS is considered one of the most common
recurrent forms of injury, which can lead to further injuries if a premature return to
exercise is attempted [16]. For this reason, pain associated with DOMS can reduce an
individual’s willingness to exercise.
Not much is known about DOMS in people with diabetes. However, Studies have
shown that older individuals have reduced proteolytic activity and an elevated production
in free radicals [24,25]. This elevation in free radicals prolongs healing time after
excessive exercise [24]. With higher levels of free radicals, metabolic impairments, and

59
endothelial dysfunction, in people with diabetes [26,27], DOMS has been found to be
more severe in this population [26,28].
As a result of these observations, methods to alleviate the severity of DOMS, and
to minimize the damage resulting from resistance exercises have been investigated.
Treatment strategies including massage (depending on the time and type of massage) [29-
31], water baths [32,33], and the administration of non-steroidal anti-inflammatory drugs
(NSAID) [34-36] have shown varying results. Other treatment strategies such as
cryotherapy, stretching, homeopathy, and ultrasound have shown minimal to no effect on
the improvement of muscle soreness [15,37,38,16,39,40]. However, in regards to acute
nutritional interventions, there is evidence that suggests ingesting protein supplements
which are high in branched chain amino acids (BCAA) can attenuate muscle damage,
reduce muscle soreness, and promote enhanced recovery of muscle function [41,22,23].
Resistance exercise causes decreases of some of the essential amino acids,
including BCAA, during the recovery period after the exercise [42,43]. Resistance
exercise then, alters the turnover of muscle protein by increasing the amino acid transport
within the muscle [43]. This enhances both the rates of skeletal muscle protein synthesis,
and protein breakdown during the recovery period following even a single bout of
exercise [44,43]. Skeletal muscle however, remains in an overall catabolic state unless
muscle protein synthesis surpasses muscle protein degradation, and for this to take place,
adequate nutritional intervention is necessary during this recovery period [44,45]. Thus,
when essential amino acids (EAA) are ingested in conjunction with an acute bout of
resistance training, the hypertrophic response is enhanced resulting in a net increase in
muscle protein synthesis, thereby improving performance [22,46].

60
Among these EAA, exceptional results have been observed with BCAA, and
specifically leucine [46,47]. Studies have indicated that BCAA are mainly used by active
skeletal muscles during submaximal exercise, whereas most other amino acids are
metabolized in the liver [42,48].
Recent findings suggest that BCAA can be safely consumed in large doses with
no adverse effects in healthy adults, when compared to other amino acids in protein
[49,50]. Furthermore, the ingestion of acute doses of BCAA supplements containing all 3
BCAA (leucine, isoleucine, and valine) appears to be well tolerated by adults, because
human cells have a tightly controlled enzymatic system for BCAA degradation [50,47].
Numerous studies have investigated the effects of BCAA supplementation on
skeletal muscle soreness. Some found that BCAA may be useful for muscle recovery
following acute sessions of exercise, both in trained and untrained individuals
[22,51,45,52,23]. In contrast, other studies showed no effects of BCAA ingestion on
DOMS [53,46]. However, no study to date has assessed the effectiveness of BCAA
supplements on DOMS in a diabetic population. Thus, the purpose of this study was to
examine the effectiveness of BCAA supplementation on reducing DOMS. We
hypothesized that BCAA supplementation would be beneficial in alleviating DOMS by
reducing muscle damage, and maintaining the functional performance of the exercised
muscle.
Subjects and Methods
Forty four subjects participated in this study. There were 2 groups, one group of
healthy individuals which consisted of 28 subjects, and another group of 16 diabetic

61
subjects. The participants in these 2 groups were randomly assigned into either the
experimental group, who ingested the BCAA supplement, or the placebo group. All the
subjects were physically inactive for at least 3 weeks prior to participating in the study.
Subjects were excluded if they were pregnant, had hepatic diseases, were diagnosed with
Rhabdomyolysis, or an impaired circulatory disease (such as Raynaud’s), had any recent
upper limb injuries, had severe neuropathies in their upper limbs, were hypertensive
(blood pressure over 145/95 mmHg), or were on high doses of alpha or beta
agonist/antagonists, Cox 2 inhibitors, calcium channel blockers, or pregabalins. Also,
subjects were advised not to take any pain reducers, NSAID, or dietary supplements
during the course of the study. The average age, height, weight, and demographics of the
subjects are shown in Table 3. Subjects were informed of all experimental procedures and
protocols and signed a statement of informed consent as approved by the Institutional
Review Board (IRB) of Loma Linda University.

62
Table 3: Means (+/- SEM) of the general characteristics of the Subjects
Subject
Type
Suppleme
nt
N Age
(Years)
Height
(Cm)
Weight
(Kg)
BMI HbA1c
(%)
Diabetes
Duration
(Years)
Healthy
Individuals
BCAA 14 28.2 (+/-
2.0)
168.3
(+/- 2.1)
72.9 (+/-
4.7)
25.2
(+/-
1.3)
Placebo 14 28.07
(+/- 2.1)
168.0
(+/- 2.3)
72.7 (+/-
5.0)
25.5
(+/-
1.4)
Diabetic
Individuals
BCAA 8 60.6 (+/-
5.7)
166.7
(+/- 5.5)
98.7 (+/-
11.8)
34.8
(+/-
3.0)
7.5 (+/-
0.8)
7.7 (+/-
2.3)
Placebo 8 61.9 (+/-
3.3)
168.5
(+/- 4.9)
118.9
(+/-
15.5)
41.3
(+/-
4.2)
6.7 (+/-
0.4)
5.5 (+/-
1.9)
Study Design
This study was a double blinded randomized controlled trial. The subjects and the
examiners were blinded to the supplement taken, and the subjects were randomly
allocated into either the experiment group, or the placebo group. All measurements were
taken at 6 time periods: a baseline measurement taken pre-exercise (baseline), and post-
exercise measurements at 30 minutes (day1), 24 hours (day2), 48 hours (day3), 72 hours
(day4), and 96 hours (day5). The serum myoglobin measurements were taken at 5
occasions, where all measurements were taken at the same time periods except for day2
(at 24 hours).

63
The Supplement Protocol
The subjects in the experimental group took 3 doses of the BCAA supplement.
The first dose was taken 30 minutes before the workout, the 2nd dose was taken
immediately after completing the workout, and the 3rd dose was taken on the 2nd day (24
hours post exercise). The amount of BCAA supplement administered to the subjects in
the experimental group on day 1 was a total dose of 1 gram of BCAA per kilogram of
lean body mass (a bioelectric impedance analyzer was used to measure lean body mass as
described below). This dose was divided in half and administered at the two specified
occasions for the 1st day. The 3rd dose (on day 2) was equivalent to 0.8 grams per kilo of
lean body weight, and was administered before any measurements were taken on that
day. The ratio of isoleucine, leucine, and valine used in this study was 1:2.5:1
respectively. The subjects in the placebo group were administered 3 doses of a placebo
supplement at the exact same times as above. The placebo supplement consisted of
cellulose powder, which has no effects on skeletal muscle. Both the BCAA and the
placebo supplement were mixed in a low calorie fruit flavored drink. The tastes of both
the BCAA and placebo drinks were identical. Two teaspoons of artificial sweetener was
added to both supplements to mask the slight bitterness of the supplements.
The Resistance Maximum (RM) and Muscle Strength (MS) Testing
A strength measuring device with 4 strain gauges placed on opposite sides of a
steel bar (arranged as a Wheatstone bridge) was used to measure each individuals
resistance maximum (RM) and muscle strength (MS). When the bar bends, the strain
gauges get deformed and an electrical output is provided. This device was interfaced with

64
a computer through a BioPac (DAC-100) bioelectric amplifier module (BioPac Systems,
Goleta, CA). This module was connected to a BioPac MP-150 analog to digital converter
sampling at a frequency of 1,000 Hz per second, and at a resolution of 24 bits. The output
signal was amplified 5,000 times. Data analysis and storage was done on Acknowledge
9.1 software from BioPac (BioPac Systems, Goleta, CA). This method has also been
described elsewhere [28].
The device was fixed to a bench at a 45° angle, so that only the biceps would be
recruited. Subjects sat behind this bench with their intended arm aligned to the device.
The strap attached to the strain gauge device was placed on the subject’s wrist, and an
examiner instructed each subject when to exert their maximal force and when to relax
(Fig. 19). Strength was determined on 3 occasions with each contraction being 3 seconds
in duration and approximately 1 minute apart. The average of these 3 measurements was
considered their maximum strength. The baseline (pre-exercise) MS measurement was
also considered the subjects’ RM. After determining the RM for the biceps muscle of
each subject, the intended session of exercise was done with 35% of their RM.

65
Figure 19: A typical subject setup for the repetition maximum (RM) and muscle strength (MS) measurements while the examiner is giving verbal cues. Also seen here is the strain gauge device with the wrist strap, securely attached to the 45° angled bench.
Electromyography (EMG) Assessment
Surface EMG was recorded from the exercised biceps muscle and sampled by 2
bipolar vinyl adhesive EMG electrodes with an active surface area of 0.5 cm2. One
electrode was placed on the mid-belly of the biceps brachii muscle and the other
electrode was placed immediately distal to it. The position of both electrodes was
immediately marked with permanent ink to ensure consistent placement on subsequent
testing days. The ground electrode was attached to the forearm, and the position was also
marked with permanent ink. The electrodes were connected to a BioPac (EMG-100B)

66
electromyogram amplifier module (BioPac Systems, Goleta, CA), which was interfaced
with a computer. This module was connected to a BioPac MP-150 analog to digital
converter. The raw EMG signal was collected at a frequency of 1,000 Hz per second, at a
resolution of 24 bits, and amplified 5,000 times. Before recording, signals were visually
inspected to ensure background noise and artifacts were minimized. The EMG
measurements were standardized in that all measures were taken during the MS
measurements. The EMG readings were recorded at the same time the subjects were
instructed to contract their muscles for the MS measurement.
Soreness/Pain Measurements
The short form McGill pain questionnaire (SF-MPQ) has been identified as a
reliable measure of pain [54,55], and was used to assess subjective soreness of the arm
muscles on all days of the experiment. The benefit of this scale over the typical visual
analog scale is that this scale is divided into 4 simple sections (a sensory pain rating
index, an affective pain rating index, a present pain intensity rating, and an evaluative
overall intensity of total pain), which gives a better overview of the type and intensity of
the perceived pain. The subjects placed a check mark on the appropriate columns of each
type of pain, to indicate their response to soreness.
Relaxed Elbow Range of Motion (RROM)
Measurements of elbow resting angles were assessed using a universal
goniometer with subjects positioned in a standardized manner. During all the
measurements, the subjects were sitting in an armless chair so that they sat in an erect

67
position with the trunk supported and the feet on the floor. The arm, shoulder, and trunk
were maintained in a neutral position throughout testing. The lines of the humerus and
radius were used as standardization points. The lateral epicondyle of the humerus was
considered the goniometric axis of movement, and was marked with a semi-permanent
pen on all subjects. The reliability of this measurement technique has been demonstrated
[56]. The range of motion measured for the purpose of this study was the elbow angle at
rest, taken as the angle of the elbow while the arm hung loosely by the subjects side.
Each measurement was repeated 3 times, and the average of all 3 measurements was the
final measurement used. All measurements were obtained by the same experimenter,
using the same goniometer, in order to minimize any measurement error.
Blood Sampling & Measurement of Myoglobin Concentrations
Approximately 4 mL peripheral blood was collected from an antecubital vein.
Peripheral venous blood was drawn on all days of the experiment, except day 2. The
blood was allowed to clot at room temperature for 10 minutes, before it was spun down
in a refrigerated centrifuge at 4000 rpm for 10 min to separate the serum from the cells.
The serum samples were then stored at -80°C until the analyses was done.
Serum myoglobin was determined using a TOSOH “AIA®-360” automated
enzyme immunoassay analyzer (TOSOH Corp., Tokyo, Japan). The myoglobin Assay
kits (Myo 025297, ST AIA-PACK Myoglobin) were used according to the manufactures
instructions. Controls were run before and after each assay session, to verify that the
measurements were accurate and within the manufacturers specified quality control
ranges. The normal reference range for myoglobin using this method was 31.4 - 971

68
ng/mL. The intra-assay and inter-assay coefficient of variations were 2.76 %, and 4.45 %
respectively.
Skin Temperature
Skin temperature was measured using a Flir TC660 Thermal Camera (Stockholm,
Sweden). The thermal image taken of the exercised arm was taken from approximately 1
meter away, and perpendicular to the skin. From a series of tests done at our labs using
the FLIR 660 IR Camera, this distance and angle were found to have the best correlation
(r = 0.93) with thermocouple readings. The images were taken in a temperature
controlled room which was maintained at approximately 23°C (+/- 0.5°C). The
temperatures from the acquired image were measured at 4 locations on the skin above the
biceps muscle using the “ThermoVision® ExaminIR™” software Version: 1.10.2. These
4 readings were analyzed individually and then averaged to give a full perspective of the
temperature above the exercised muscle.
Lean Body Weight Determination
Lean body weight was determined by electrical impedance with an RJL Systems
Quantum 2 Bioelectric Impedance Analyzer (Minneapolis, MN). The unit measured
resistance and reactance with 1.0 ohms of resolution. Four electrodes were placed on the
body, two source electrodes on the hand and foot and two recording electrodes on the
hand and foot. The system placed a current of approximately 0.1 milliamps at 100,000
cycles per second frequency, through the source electrodes. The recording electrodes
recorded the signal transmitted through the body, and use this to calculate body fat

69
content via the software provided by the manufacturer (RJL Systems). The Quantum 2
with the multiplexed cable, allows multi-zone and segmental measurements to be taken
quickly and easily in 26 segments to calculate body water and body fat.
Food Dietary Analysis
Diet was assessed at baseline using the Brief Block Food Frequency
Questionnaire (FFQ) (Block Dietary Data Systems, Berkeley, CA,
www.nutritionquest.com) . This questionnaire has been shown to be a valid tool for
assessing different types of nutritional components [57,58].
Procedure
First, demographical data was collected including: height, weight, age, body fat,
body mass index (BMI), blood pressure, and medical history. Also, baseline data of all
the previously indicated measurements were collected (MS, EMG, SF-MPQ, and
RROM), including blood samples for the myoglobin measurement, and the
administration of the brief FFQ. The initial dose of the supplement, whether BCAA or
placebo, was also administered at this time. The targeted muscles for this experiment
were the elbow flexors. The resistance exercise was performed using a dumbbell, and
DOMS was only induced in the subjects’ dominant arm. To provoke DOMS in these
muscles, all subjects carried out 4 sets of 25 repetitions of biceps concentration curls
while seated on a chair, and the elbows supported on their thighs. Subjects were advised
to lower the weight and lift it at a steady rate (approximately 3 seconds going down, and
3 seconds coming back up), to ensure that the eccentric component of the muscle

70
contraction was properly done. There was a 90 second resting period between sets, and
subjects either did the full set of 25 repetitions, or were instructed to stop the set if they
failed to steadily control the descent of the weight and return their arm back to full
flexion. As indicated previously, the resistance used was 35% of each subject’s RM.
All the primary measurements were repeated after the exercise at 30 minutes, 24,
48, 72, and 96 hours except for the myoglobin measure which wasn’t carried out at 24
hours. Also, the 2nd and 3rd dose of the supplements were taken immediately after the
exercise and at 24 hours.
Data Analysis
Means, and standard errors (SEM) were calculated. Measurements of all variables
(MS, EMG, RROM, SF-MPQ, Myoglobin, and Skin Temperatures) were compared over
time between the experimental and placebo groups of each of the 2 main groups (healthy
and diabetic) using a mixed factorial (2 × 6) analysis of variance (ANOVA). When a
significant difference over time was found, a paired t-test was performed to determine
any significant differences from baseline. Demographic data and the protein intake (from
the FFQ analysis) were compared using independent-t tests. Statistical analysis was
performed using PASW Statistics Version 18.0.0 (SPSS, Inc., 2009, Chicago, IL,
www.spss.com), and the level of significance was set at α < 0.05.

71
Results
Demographics and Protein Intake
There were no significant differences in demographic data between the two
treatment groups of the healthy subjects group (P > 0.05). Also, no significant difference
between the baseline protein intakes was observed. The same results were also seen for
the diabetic subjects group, where no significant differences were found between the two
treatment groups in regards to demographical data, and protein intake (P > 0.05).
Muscle Strength (MS)
There was no significant difference in MS between the two treatment groups in
the healthy group (P > 0.1). However, there was a difference in MS over time, with a
significant decrease in MS at day1 (P < 0.01), compared to baseline.
In the diabetic group, there was no significant difference in MS between the two
treatment groups (P > 0.1). However, there was a significant decrease in MS at day1 (P <
0.05), compared to baseline. Figure 20 shows the MS response for all 4 groups.

72
Figure 20: Graph of the muscle strength measures (Means +/- SEM) in the healthy group who ingested the BCAA supplement (diamonds), the healthy group who ingested the Placebo supplement (squares), the diabetic group who ingested the BCAA supplement (triangles), and the diabetic group who ingested the Placebo supplement (X), over the 6 time periods.
Electromyography (EMG)
There was no significant difference in EMG between the two treatment groups in
the healthy group (P > 0.1). There was also no significant difference over time (P > 0.05).
In the diabetic group however, there was a significant difference in EMG between
the two treatment groups (P < 0.05), where the placebo group had a significantly lower
EMG amplitude during maximum effort when compared to the BCAA group. There was
also a difference in EMG over time, with a significant decrease in EMG at day3, day4,
and day5 (P < 0.05), compared to baseline. Figure 21 illustrates the EMG response during
maximum effort for all 4 groups.
0.0
2.0
4.0
6.0
8.0
10.0
12.0
14.0
Baseline Day 1 Day 2 Day 3 Day 4 Day 5
Muscle Strength (Kg)
Muscle Strength Measures for All 4 Groups
BCAA Healthy
Placebo Healthy
BCAA Diabetes
Placebo Diabetes

73
Figure 21: Graph of the electromyography (EMG) amplitude during maximum effort (Means +/- SEM) in the healthy group who ingested the BCAA supplement (diamonds), the healthy group who ingested the Placebo supplement (squares), the diabetic group who ingested the BCAA supplement (triangles), and the diabetic group who ingested the Placebo supplement (X), over the 6 time periods.
Soreness/Pain Response (SF-MPQ)
There was no significant difference in the pain scores from the SF-MPQ among
the two treatment groups in the healthy group (P > 0.1). Pain scores differed overtime
however, where there was a significant increase in pain at day1, day2, day3, and day4 (P
< 0.05), compared to baseline.
In the diabetic group, there was a significant difference between the two treatment
groups in regards to the level of perceived pain (P < 0.05), where the placebo group had
higher pain than the BCAA group. A difference in pain over time was also found, where
there was a significant increase in pain at day2, day3, and day4 (P < 0.05), compared to
baseline in the placebo group. In the BCAA group however, the only significant time
0.000
0.050
0.100
0.150
0.200
0.250
0.300
0.350
0.400
0.450
Baseline Day 1 Day 2 Day 3 Day 4 Day 5
EMG (Volts)
Electromyography During Maximum Effort for All 4 Groups
BCAA Healthy
Placebo Healthy
BCAA Diabetes
Placebo Diabetes

74
difference from baseline was at day 3 (P < 0.05). Figure 22 shows the pain scores from
the SF-MPQ for all 4 groups.
Figure 22: Graph of the soreness responses using the SF-MPQ (Means +/- SEM) in the healthy group who ingested the BCAA supplement (diamonds), the healthy group who ingested the Placebo supplement (squares), the diabetic group who ingested the BCAA supplement (triangles), and the diabetic group who ingested the Placebo supplement (X), over the 6 time periods.
Relaxed Range of Motion (RROM)
There was no significant difference in RROM between the two treatment groups
in the healthy group (P > 0.1). However, there was a difference in RROM over time, with
a significant decrease in RROM for all time points (day1, day2, day3, day4, day5)
compared to baseline (P < 0.05).
Also in the diabetic group, where there was no significant difference in RROM
between the two treatment groups (P > 0.1). However, there was a significant decrease in
0.0
2.0
4.0
6.0
8.0
10.0
12.0
14.0
16.0
Baseline Day 1 Day 2 Day 3 Day 4 Day 5
SF‐M
PQ (Points)
Pain/Soreness Response for All 4 Groups
BCAA Healthy
Placebo Healthy
BCAA Diabetes
Placebo Diabetes

75
RROM at day1, day2, day3, and day4 (P < 0.05), compared to baseline. Figure 23 shows
the RROM measurements in all 4 groups.
Figure 23: Graph of the relaxed range of motion (RROM) measurements (Means +/- SEM) in the healthy group who ingested the BCAA supplement (diamonds), the healthy group who ingested the Placebo supplement (squares), the diabetic group who ingested the BCAA supplement (triangles), and the diabetic group who ingested the Placebo supplement (X), over the 6 time periods.
Myoglobin Concentrations
There was no significant difference in myoglobin concentrations between the two
treatment groups in the healthy group (P > 0.1). However, there was a difference in
myoglobin concentrations over time, with a significant increase in myoglobin
concentrations at day3, day4, and day5 (P < 0.05) compared to baseline.
In the diabetic group, there was a significant difference in myoglobin
concentrations between the two treatment groups (P < 0.05), where the placebo group had
152.0
154.0
156.0
158.0
160.0
162.0
164.0
166.0
168.0
170.0
172.0
174.0
Baseline Day 1 Day 2 Day 3 Day 4 Day 5
ROM (Degrees)
Range of Motion Measurements for All 4 Groups
BCAA Healthy
Placebo Healthy
BCAA Diabetes
Placebo Diabetes

76
higher blood myoglobin concentrations than the BCAA group. A difference over time
was also found, with a significant increase in myoglobin concentrations at day3, day4,
and day5 (P < 0.05), compared to baseline in the placebo group. In the BCAA group
however, the only significant time difference from baseline was at day 4 (P < 0.05).
Figure 24 shows the blood myoglobin concentrations for all 4 groups.
Figure 24: Graph of the blood myoglobin concentrations (Means +/- SEM) in the healthy group who ingested the BCAA supplement (diamonds), the healthy group who ingested the Placebo supplement (squares), the diabetic group who ingested the BCAA supplement (triangles), and the diabetic group who ingested the Placebo supplement (X), over the 5 time periods.
Skin Temperatures
There was no significant difference in skin temperatures between the two
treatment groups in the healthy group (P > 0.05). However, there was a difference over
time, with a significant increase in skin temperatures at day1 (P < 0.05), compared to
baseline for both groups. Skin temperatures in the placebo group were still significantly
0.0
100.0
200.0
300.0
400.0
500.0
600.0
700.0
800.0
900.0
Baseline Day 1 Day 3 Day 4 Day 5
Myoglobin (ng/mL)
Blood Myoglobin Concentrations Levels in All 4 Groups
BCAA Healthy
Placebo Healthy
BCAA Diabetes
Placebo Diabetes

77
elevated at day 2 (P < 0.05) compared to baseline, whereas in the BCAA group, skin
temperatures at day 2 were not significantly different from baseline (P > 0.05).
Also in the diabetic group, where there was no significant difference in skin
temperatures between the treatment groups (P > 0.05). There was however, a time
difference, where there was a significant increase in skin temperatures at day1 (P < 0.05),
compared to baseline for both groups. Also, similar to the diabetic group, skin
temperatures for the placebo group were still significantly elevated at day 2 (P < 0.05)
compared to baseline, whereas for the BCAA group there was no significant difference
between day 2 and baseline measures (P > 0.05). Figure 25 shows the skin temperature
measurements for all 4 groups.
Figure 25: Graph of skin temperatures (Means +/- SEM) in the healthy group who ingested the BCAA supplement (diamonds), the healthy group who ingested the Placebo supplement (squares), the diabetic group who ingested the BCAA supplement (triangles), and the diabetic group who ingested the Placebo supplement (X), over the 6 time periods.
32.0
32.2
32.4
32.6
32.8
33.0
33.2
33.4
33.6
33.8
34.0
Baseline Day 1 Day 2 Day 3 Day 4 Day 5
Temperature (°C)
Skin Temperatures for all 4 Groups
BCAA Healthy
Placebo Healthy
BCAA Diabetes
Placebo Diabetes

78
Discussion
Exercise is still considered one of the best means of increasing glycemic control
in people with diabetes, particularly resistance exercise [7]. It has been shown that an
overall increase in muscle mass is associated with better insulin sensitivity [13,9].
Resistance exercise however, especially the eccentric phase, has been attributable to
micro-traumas and damage of protein structures within skeletal muscles [38,20,59]. This
damage alters the protein turnover process within the muscle, which causes a decrease in
performance and in the body’s BCAA content (and some other essential amino acids)
during the recovery period after exercise [44,43,42].
There has been a heightened interest lately in nutritional supplementation, in
treating DOMS and its associated symptoms. In these studies, BCAA has been found to
have promising effects in facilitating the restoration of muscle function, and attenuating
muscle damage following exercise [22,45,60,51,52,23]. However, because people with
diabetes have endothelial dysfunction, soreness levels are worse after exercise and
recovery periods longer [26,28].
No study up to date has investigated BCAA effects on a diabetic population,
which was the focus of this study. In this investigation, subjects participated in a
moderate intensity resistance exercise to induce DOMS, and identify the effectiveness of
BCAA supplementation in enhancing the recovery of DOMS, and its perceived
symptoms. This study was also unique in the fact that we used a BCAA dosage
dependent on lean body weight, rather than just the individual’s weight. The reason for
incorporating this method is that diabetic individuals, on average, have higher fat
distributions when compared to non-diabetic individuals. Also, because BCAA is mainly
79
metabolized in skeletal muscle, we thought that the incorporation of the individual’s
whole body weight in the dosage calculation might not be necessary. From this
investigation, we found that BCAA supplementation could be a useful method for
treating DOMS and facilitating muscle recovery in a diabetic population.
BCAA when consumed before or after an acute exercise session has been found
to further stimulate muscle protein synthesis, and reduce muscle protein breakdown,
resulting in an enhanced muscle adaptation to the related damage [46,45,47]. These
positive results were seen in the diabetic group, where some of the muscle damage
markers were decreased when compared to the placebo group.
In regards to the EMG response, the diabetic BCAA group showed a better
maintenance of their muscle activity output, while the diabetic placebo group had a larger
decrease. This could be attributed to the fact that an increased dose of leucine has been
found to help maintain the muscles force output during isometric contractions [22].
Perceived soreness, and myoglobin concentrations in the diabetic BCAA group were
much lower than in the diabetic placebo group. This response has been observed in a
number of studies that have incorporated the use of BCAA, or leucine supplementation
on the markers of muscle damage and DOMS [52,60]. Although skin temperatures were
not significantly different between the two diabetic groups, a notable finding was that
skin temperatures were closer to baseline in the BCAA group at 24 hours, while
temperatures were still elevated in the placebo group at that same time period. This
indicates that there were higher blood flows in the exercised muscle of the placebo group,
due to increased inflammation and tissue damage [59].

80
An interesting finding in our study was that the BCAA supplement had enhanced
the recovery in the diabetic group, but had almost no effects on the healthy group, even
though the dosage duration was short. A critical explanation for this occurrence could be
ascribed to the fact that diabetic individuals have a high prevalence of gastrointestinal
complications including dyspepsia, and abdominal pain [61,62]. Diabetes mellitus is
known to provoke many complications such as retinopathy and nephropathy;
gastrointestinal dysfunction is just one of these many complications [61,63]. Neuropathy
and hyperglycemia have been found to cause abnormal gastrointestinal motility and
disturbed digestion, which together have shown to cause impaired intestinal absorption
[64-66]. This may result in the mal-absorption of essential amino acids from the proteins
in the diet of a diabetic individual. Thus, an amino acid supplement would be much easier
for the diabetic individual to absorb through an impaired gastrointestinal system.
On the other hand, we found no significant differences between the healthy
BCAA group, and the healthy placebo group. A main reason for this finding could be
related to the fact that the supplementation duration wasn’t long enough. Studies have
concluded that the duration of BCAA supplementation could have a large impact on its
effects on DOMS [67,53]. For example, a study done by Sharp and colleagues [45] found
that BCAA supplementation had significant effects on lowering DOMS, but their
supplementation period was over the length of 4 weeks (3 weeks before the exercise, and
1 week after). These positive effects were seen even though the exercise routine they
incorporated was intense, as it included muscles of the whole body (circuit training)
rather than just the arm, or leg muscles. Also, another study done by Skillen and

81
colleagues [68], administered an amino acid supplement over a period of 2 weeks and
found that it had beneficial effects on reducing muscle damage markers.
One of the limitations of this study is that we only assessed the subject’s dietary
intake at baseline, and failed to assess their intake over the course of the study. This
obviously limits our ability to detect changes in intake, especially in regards to protein
content. Another limitation would be the fact that we didn’t incorporate a strict dietary
program for the subjects during the time of the study. However, even though this would
increase the studies internal validity, it might decrease its external validity. Suggestions
for further studies would be to incorporate different vitamins into the BCAA supplement.
Vitamin E would be a good example, as it is considered an antioxidant, which has been
found to be effective in attenuating exercise induced muscle damage [15,69].
Despite the limitations of this study, we have provided suggestive evidence that
BCAA supplementation in a diabetic population can be beneficial in enhancing muscle
performance, and improving recovery from DOMS. BCAA supplementation would be a
simple method for stabilizing the muscle’s protein content after an acute bout of
resistance exercise in people with diabetes. This could assist in minimizing further
injuries from over-exercising in this population. However, further investigations are
required to clarify and elucidate these findings.
Acknowledgments
No external financial support was used for this study. We would like to thank the
Saudi Arabian Ministry of Higher Education (MOHE), and the Saudi Arabian Cultural
Mission (SACM) for their cooperation and support. We would also like to thank the

82
Physical Therapy Department at the School of Allied Health Professions (SAHP) at
Loma Linda University (LLU). We would also like to acknowledge everyone who
assisted us in the clinical lab including: Paula Cavalcanti, Bhargav Dave, and Harold
Moniz for their time and effort.

83
References
1. Al-Hussein FA (2008) Diabetes control in a primary care setting: a retrospective study of 651 patients. Ann Saudi Med 28 (4):267-271
2. Sarah Wild GR, Anders Green, Richard Sicree, Hilary King (2004) Global Prevalence of Diabetes: Estimates for the year 2000 and projections for 2030. Diabetes Care 27:1047-1053
3. J.E. Shaw RAS, P.Z. Zimmet (2010) Global estimates of the prevalence of diabetes for 2010 and 2030. Diabetes Research and Clinical Practice 87:4-14
4. Collins Boakye-Agyemang FI, Devan Mohee, Souleymane Koné, Henry Bastienne, José Dacosta Caetano (2009) The Challenge of Diabetes by 2030.
5. Praet SFE, Loon LJC (2009) Exercise therapy in Type 2 diabetes. Acta Diabetologica 46 (4):263-278. doi:10.1007/s00592-009-0129-0
6. Hills AP, Shultz SP, Soares MJ, Byrne NM, Hunter GR, King NA, Misra A (2009) Resistance training for obese, type 2 diabetic adults: a review of the evidence. Obesity Reviews 11 (10):740-749. doi:10.1111/j.1467-789X.2009.00692.x
7. Zanuso S, Jimenez A, Pugliese G, Corigliano G, Balducci S (2009) Exercise for the management of type 2 diabetes: a review of the evidence. Acta Diabetologica 47 (1):15-22. doi:10.1007/s00592-009-0126-3
8. A. Honkola TF, J. Eriksson (1997) Resistance training improves the metabolic profile in individuals with type 2 diabetes. Acta Diabetologica 34:245-248
9. Church TS, Blair SN, Cocreham S, Johannsen N, Johnson W, Kramer K, Mikus CR, Myers V, Nauta M, Rodarte RQ, Sparks L, Thompson A, Earnest CP (2010) Effects of Aerobic and Resistance Training on Hemoglobin A1c Levels in Patients With Type 2 Diabetes. JAMA: The Journal of the American Medical Association 304 (20):2253-2262
10. Castaneda C (2003) Diabetes control with physical activity and exercise. Nutrition in clinical care 6 (2):89-96
11. Nathan K. LeBrasseur KW, Zoltan Arany (2010) Metabolic benefits of resistance training and fast glycolytic skeletal muscle. Am J Physiol Endocrinol Metab 300:E3–E10
12. Umpierre D, Ribeiro PAB, Kramer CK, Leita˜o CB, Zucatti ATN, Azevedo MJ, Gross JL, Ribeiro JP, Schaan BD (2011) Physical Activity Advice Only or Structured Exercise Training and Association With HbA1c Levels in Type 2 Diabetes: A Systematic Review and Meta-analysis. JAMA: The Journal of the American Medical Association 305 (17):1790-1799

84
13. Srikanthan P, Karlamangla AS (2011) Relative Muscle Mass Is Inversely Associated with Insulin Resistance and Prediabetes. Findings from The Third National Health and Nutrition Examination Survey. Journal of Clinical Endocrinology & Metabolism. doi:10.1210/jc.2011-0435
14. Meex RCR, Schrauwen-Hinderling VB, Moonen-Kornips E, Schaart G, Mensink M, Phielix E, van de Weijer T, Sels JP, Schrauwen P, Hesselink MKC (2009) Restoration of Muscle Mitochondrial Function and Metabolic Flexibility in Type 2 Diabetes by Exercise Training Is Paralleled by Increased Myocellular Fat Storage and Improved Insulin Sensitivity. Diabetes 59 (3):572-579. doi:10.2337/db09-1322
15. Howatson G, Someren KAV (2008) The Prevention and Treatment of Exercise-Induced Muscle Damage. Sports Med 38 (6):483-503
16. Cheung K, Hume PA, Maxwell L (2003) Delayed Onset Muscle Soreness: Treatment strategies and Performance Factors. Sports Med 33 (2):145-164
17. Armstrong RB (1984) Mechanisms of exercise-induced delayed onset muscular soreness: a brief review. Medicine and Science in Sports and Exercise 16 (6):529-538
18. Evans WJ (1992) Exercise, Nutrition and Aging. Journal of Nutrition 122:796-801
19. Diamond Nguyen LEB, Jared W. Coburn, Daniel A. Judelson, Alea D. Eurich, Andy V. Khamoui, Brandon P. Uribe (2009) Effect of delayed-onset muscle soreness on elbow flexion strength and rate of velocity development. Journal of Strength and Conditioning Research 23 (4):1282–1286
20. Kazunori Nosaka MN, Paul Sacco (2002) Muscle damage and soreness after endurance exercise of the elbow flexors. Medicine & Science in Sports & Exercise 34 (6):920-927
21. Akihiro Sakamoto TM, Hisashi Naito, Peter J. Sinclair (2010) Acute Effects of High Intensity Dumbbell Exercise After Isokinetic Eccentric Damage: Interaction between altered pain perception and fatigue on static and dynamic muscle performance. Journal of Strength and Conditioning Research 24 (8):2042-2049
22. Kirby TJ, Triplett NT, Haines TL, Skinner JW, Fairbrother KR, McBride JM (2011) Effect of leucine supplementation on indices of muscle damage following drop jumps and resistance exercise. Amino Acids. doi:10.1007/s00726-011-0928-9
23. Kraemer WJ, Ratamess NA, Volek JS, Häkkinen K, Rubin MR, French DN, Gómez AL, McGuigan MR, Scheett TP, Newton RU, Spiering BA, Izquierdo M, Dioguardi FS (2006) The effects of amino acid supplementation on hormonal responses to resistance training overreaching. Metabolism 55 (3):282-291. doi:10.1016/j.metabol.2005.08.023
85
24. Evans WJ (1992) Exercise, nutrition and aging. J Nutr 122 (3 Suppl):796-801
25. Fielding RA, Meredith CN, O'Reilly KP, Frontera WR, Cannon JG, Evans WJ (1991) Enhanced protein breakdown after eccentric exercise in young and older men. J Appl Physiol 71 (2):674-679
26. Petrofsky J, Batt J, Bollinger JN, Jensen MC, Maru EH, Al-Nakhli HH (2011) Comparison of Different Heat Modalities for Treating Delayed-Onset Muscle Soreness in People with Diabetes. Diabetes Technology & Therapeutics 13 (6):645-655. doi:10.1089/dia.2011.0002
27. Kanter MM (1994) Free radicals, exercise, and antioxidant supplementation. Int J Sport Nutr 4 (3):205-220
28. Al-Nakhli HH, Petrofsky JS, Laymon MS, Arai D, Holland K, Berk LS (2011) The Use of Thermal Infrared Imaging to Assess the Efficacy of a Therapeutic Exercise Program in Individuals with Diabetes. Diabetes Technology & Therapeutics:111019130632009. doi:10.1089/dia.2011.0187
29. Frey Law LA, Evans S, Knudtson J, Nus S, Scholl K, Sluka KA (2008) Massage Reduces Pain Perception and Hyperalgesia in Experimental Muscle Pain: A Randomized, Controlled Trial. The Journal of Pain 9 (8):714-721. doi:10.1016/j.jpain.2008.03.009
30. Hilbert JE, Sforzo GA, Swensen T (2003) The Effects of Massage on Delayed Onset Muscle Soreness. Br J Sports Med 37:72-75
31. Zainal Zainuddin MN, Paul Sacco, Kazunori Nosaka (2005) Effects of Massage on Delayed-Onset Muscle Soreness, Swelling, and Recovery of Muscle Function. Journal of Athletic Training 40 (3):174-180
32. Vaile JM, Gill ND, Blazevich AJ (2007) The Effect of Contrast Water Therapy on Symptoms of Delayed Onset Muscle Soreness. Journal of Strength and Conditioning Research 21 (3):697-702
33. Vaile J, Halson S, Gill N, Dawson B (2007) Effect of hydrotherapy on the signs and symptoms of delayed onset muscle soreness. European Journal of Applied Physiology 102 (4):447-455. doi:10.1007/s00421-007-0605-6
34. Barlas P, Craig JA, Robinson J, Walsh DM, Baxter GD, Allen JM (2000) Managing Delayed-Onset Muscle Soreness: Lack of Effect of Selected Oral Systemic Analgesics. Arch Phys Med Rehabil 81:966-972
35. Pizza FX CD, Stockard A, Baylies H, Beighle A (1999) Anti-inflammatory doses of ibuprofen: effect on neutrophils and exercise-induced muscle injury. International Journal of Sports Medicine 20 (2):98-102

86
36. Michael O'Grady ACH, Kenneth Schneider, Edward Bossen, Karl Steinberg, James M Douglas Jr, William J Murray, W. David Watkins (2000) Diclofenac sodium (Voltaren) reduced exercise-induced injury in human skeletal muscle. Medicine & Science in Sports & Exercise 32 (7):1191–1196
37. Howatson G, Gaze D, van Someren KA (2005) The efficacy of ice massage in the treatment of exercise-induced muscle damage. Scandinavian Journal of Medicine and Science in Sports 15 (6):416-422. doi:10.1111/j.1600-0838.2005.00437.x
38. Symons TB, Clasey JL, Gater DR, Yates JW (2004) Effects of Deap Heat as a Preventative Mechanism on Delayed Onset Muscle Soreness. Journal of Strength and Conditioning Research 18 (1):155-161
39. Dawn T. Gulick IFK, Michael Sitler, Albert Paolone, John D. Kelly (1996) Various Treatment Techniques on Signs and Symptoms of Delayed Onset Muscle Soreness. Journal of Athletic Training 31 (2):145-152
40. William Kirk Isabell ED, William Myrer, Shauna Anderson (1992) The Effects of Ice Massage, Ice Massage with Exercise, and Exercise on the Prevention and Treatment of Delayed Onset Muscle Soreness. Joumal of Athletic Training 27 (3):208-217
41. Betts JA, Toone RJ, Stokes KA, Thompson D (2009) Systemic indices of skeletal muscle damage and recovery of muscle function after exercise: effect of combined carbohydrate-protein ingestion. Applied Physiology, Nutrition, and Metabolism 34 (4):773-784. doi:10.1139/h09-070
42. Mero A (1999) Leucine supplementation and Intensive Training. Sports Med 27 (6):347-358
43. Eva Blomstrand BE-G (2009) Changes in amino acid concentration in plasma and type I and type II fibres during resistance exercise and recovery in human subjects. Amino Acids 37:629-636
44. W. Apro´ EB (2010) Influence of supplementation with branched-chain amino acids in combination with resistance exercise on p70S6 kinase phosphorylation in resting and exercising human skeletal muscle. Acta Physiologica 200:237-248
45. Carwyn P.M. Sharp DRP (2010) Amino Acid Supplements and Recovery from High-Intensity Training. Journal of Strength and Conditioning Research 24 (4):1125-1130
46. Matt S. Stock JCY, Lawrence A. Golding, Laura J. Kruskall, Richard D. Tandy, Janice M. Conway-Klaassen, Travis W. Beck (2010) The Effects of Adding Leucine to Pre and Postexercise Carbohydrate Beverages on Acute Muscle Recovery from Resistance Training. Journal of Strength and Conditioning Research 24 (8):2211-2219
47. Yoshiharu Shimomura TM, Naoya Nakai, Masaru Nagasaki, Robert A. Harris (2004) Exercise Promotes BCAA Catabolism: Effects of BCAA Supplementation on Skeletal Muscle during Exercise. Journal of Nutrition 134:1583S-1587S
87
48. Yoshiharu Shimomura TH, Makoto Shiraki, Taro Murakami, Juichi Sato, Hisamine Kobayashi, Kazunori Mawatari, Mariko Obayashi, Robert A. Harris (2006) Branched-Chain Amino Acid Catabolism in Exercise and Liver Disease. Journal of Nutrition 136:250S-253S
49. Matthews DE (2005) Observations of Branched-Chain Amino Acid Administration in Humans. Journal of Nutrition 135:1580S–1584S
50. Gleeson M (2005) Interrelationship between Physical Activity and Branched-Chain Amino Acids. Journal of Nutrition 135:1591S–1595S
51. Jackman SR, Witard OC, Jeukendrup AE, Tipton KD (2010) Branched-Chain Amino Acid Ingestion Can Ameliorate Soreness from Eccentric Exercise. Medicine & Science in Sports & Exercise 42 (5):962-970. doi:10.1249/MSS.0b013e3181c1b798
52. Matsumoto K, Mizuno M, Mizuno T, Dilling-Hansen B, Lahoz A, Bertelsen V, Münster H, Jordening H, Hamada K, Doi T (2007) Branched-chain Amino Acids and Arginine Supplementation Attenuates Skeletal Muscle Proteolysis Induced by Moderate Exercise in Young Individuals. International Journal of Sports Medicine 28 (6):531-538. doi:10.1055/s-2007-964940
53. Knechtle B, Knechtle P, Mrazek C, Senn O, Rosemann T, Imoberdorf R, Ballmer P (2011) No effect of short-term amino acid supplementation on variables related to skeletal muscle damage in 100 km ultra-runners - a randomized controlled trial. Journal of the International Society of Sports Nutrition 8 (1):6. doi:10.1186/1550-2783-8-6
54. Strand L, Ljunggren A, Bogen B, Ask T, Johnsen T (2008) The Short-Form McGill Pain Questionnaire as an outcome measure: Test–retest reliability and responsiveness to change. European Journal of Pain 12 (7):917-925. doi:10.1016/j.ejpain.2007.12.013
55. Kate V. Grafton NEF, Christine C. Wright, (2005) Test-Retest Reliability of the Short-Form McGill Pain Questionnaire. Clinical Journal of Pain 21 (1):73-82
56. April D Armstrong JCM, Shrikant Chinchalkar, Rob S. Stevens, Graham J.W. King (1998) Reliability of range-of-motion measurement in the elbow and forearm. J Shoulder Elbow Surg 7:573-580
57. Julie A. Mares-Perlman BEKK, Ronald Klein, Linda L Ritter, Marian R. Fisher, Jo L Freudenheim (1993) A Diet History Questionnaire Ranks Nutrient Intakes in Middle-Aged and Older Men and Women Similarly to Multiple Food Records. Journal of Nutrition 123:489-501
58. Block G TF, Hartman AM, Larkin FA, Guire KE (1992) Comparison of two dietary questionnaires validated against multiple dietary records collected during a 1-year period. J Am Diet Assoc 92 (6):686-693

88
59. MacIntyre DL, Reid WD, McKenzie DC (1995) Delayed Muscle Soreness: The Inflammatory Response to Muscle Injury and its Clinical Implications. Sports Med 20 (1):24-40
60. Yoshiharu Shimomura YY, Gustavo Bajotto, Juichi Sato, Taro Murakami, Noriko Shimomura, Hisamine Kobayashi, Kazunori Mawatari (2006) Nutraceutical Effects of Branched-Chain Amino Acids on Skeletal Muscle. Journal of Nutrition 136:529S-532S
61. Oh J-H, Choi M-G, Kang M-I, Lee K-M, Kim JI, Kim B-W, Lee D-S, Kim S-S, Choi H, Han S-W, Choi K-Y, Son H-Y, Chung I-S (2009) The Prevalence of Gastrointestinal Symptoms in Patients with Non-Insulin Dependent Diabetes Mellitus. The Korean Journal of Internal Medicine 24 (4):309. doi:10.3904/kjim.2009.24.4.309
62. Amer Shakil RJC, Shobha S. Rao (2008) Gastrointestinal Complications of Diabetes. American Family Physician 77 (12):1697-1702
63. Khaled M. Elsayes COM, Lina Sierra, Jonathan R. Dillman, Joel F. Platt (2009) Gastrointestinal Manifestations of Diabetes Mellitus: Spectrum of Imaging Findings. J Comput Assist Tomogr 33:86-89
64. Russell Yang RA, Lawrence Chan (1984) Gastrointestinal Tract Complications of Diabetes Mellitus: Pathophysiology and Management. Arch Intern Med 144:1251-1256
65. Camilleri M (1996) Gastrointestinal problems in diabetes. Endocrinol Metab Clin North Am 25 (2):361-378
66. Lawrence A. Szarka MC (2010) Stomach Dysfunction in Diabetes Mellitus: Emerging Technology and Pharmacology. Journal of Diabetes Science and Technology 4 (1):180-189
67. Nosaka K SP, Mawatari K (2006) Effects of amino acid supplementation on muscle soreness and damage. Int J Sport Nutr Exerc Metab 16 (6):620-635
68. Skillen RA TM, Applegate EA, Heiden EA, Fascetti AJ, Casazza GA (2008) Effects of an amino acid carbohydrate drink on exercise performance after consecutive-day exercise bouts. Int J Sport Nutr Exerc Metab 18 (5):473-492
69. Bloomer RJ (2007) The Role of Nutritional Supplements in the Prevention and Treatment of Resistance Exercise-Induced Skeletal Muscle Injury. Sports Med 37 (6):519-532

89
CHAPTER FIVE
DISCUSSION
In the present reseaerch, we examined the intensity of DOMS in people who have
diabetes, in 2 different body regions (Chapter 2). As an outcome of the first study, we
then investigated a new technique to objectively quantify muscle soreness (Chapter 3).
Finally, using this new technique and other biomarkers, we examined whether soreness
could be reduced by ingesting a single nutritional supplement, which in this case was
BCAA (Chapter 4).
Diabetes causes a chronic increase in whole body inflammation. 54 Because of
this, and of the metabolic and endothelial impairments associated with diabetes, exercise
performance and training may become impaired in this population. 56,57 It has been shown
that exercise which results in an overall increase in muscle mass is associated with better
insulin sensitivity, and a mean reduction in hemoglobin A1c of approximately 0.80%.
12,16 This obviously gives the individual with diabetes a better chance of coping with the
disease and preventing its symptoms from getting worse. 7,58 For these reasons, resistance
exercise is considered one of the best means of increasing glycemic control in people
with diabetes. 10 Resistance exercise however, especially the eccentric phase, has been
attributable to micro-traumas and damage of protein structures within skeletal muscles.
23,34,59 This damage alters the protein turnover process within the muscle, which causes a
decrease in BCAA and some other essential amino acids during the recovery period after

90
exercise. 44-46 A decrease in performance occurs during this recovery period, but BCAA
supplementation has been found to facilitate the restoration of muscle function. 25,47,60
While much is known about DOMS in young people, little is known about DOMS
in people with diabetes. However, there may be some comparisons that can be made from
studies of DOMS and ageing. 61 These studies have shown that there is reduced
proteolytic activity and an elevated production in free radicals in older individuals. 61,62
This elevation prolongs healing time after excessive exercise. 61 With metabolic
impairments, endothelial dysfunction, and higher levels of free radicals in people with
diabetes53,63 DOMS could be more severe and recovery periods longer in this population.
To understand DOMS however, we need a marker of DOMS, and in this
dissertation we used common markers such as; myoglobin and soreness scales. But the
most interesting finding was being able to use a non-invasive marker, which was
objectively valid and correct.
In this investigation, it was found that infrared imaging could be a valid technique
for determining DOMS within the first days of exercising. A purpose of this investigation
was to assess the usefulness of thermal imaging in detecting and measuring muscle
soreness after strenuous exercise. Our results suggest that thermal imaging could be a
valid technique for detecting DOMS, especially within the first 24 hours of exercising.
As well as being able to measure skin temperature, thermal cameras are fairly
inexpensive.
Pennes 64 provided a very detailed model of heat flow from muscle to skin in
limbs. This model predicts that heat in deeper tissues such as muscles can be dissipated
into blood and into the skin through conductive heat exchange. When muscles exercise,

91
heat is developed in the muscle because of frictional forces of the muscle fibers and from
the increased metabolism.65 Increased blood flows to the muscle would also contribute to
the increased heat in the muscle after exercising.
Skin is a shell tissue, and its temperature is usually about 6°C less than that of the
core. 66-68 The skin must be kept cooler than the core so that heat can move from the core
to the skin and be removed by radiation, conduction, and evaporation. 68-71 Muscle is also
a shell tissue, where its temperature is usually 32−33°C, which is slightly warmer than
that of skin. However, when blood flow is increased to the exercised muscle it
approaches the temperature of the core tissues, which is approximately 37°C. 39,64 Blood
flow in skeletal muscle is very dynamic, and when tissue is damaged during exercise,
blood flow can increase dramatically. Thus, warm blood entering muscle when tissue
repair is being accomplished as part of the inflammatory response can deliver a great deal
of heat into the tissue. 34,72 The increased blood flow should go back to normal within an
hour or two of the exercise termination, but when temperatures are still elevated at 24
hours post-exercise, this shows that damage has happened to the exercised muscle and
causes a hot spot under the skin.
Thus, the elevated skin temperatures found 24 hours post-exercise in all subjects
is possibly the result of higher blood flows in muscle due to inflammation and tissue
damage repair. 34 Therefore, if muscle blood flow remained elevated post-exercise, the
warmer core blood would keep the muscle warm, and hence the overlying skin would
stay warm. This occurrence has been used to detect and diagnose several other diseases
using thermal imaging. 35-39,73-75 This is true because changes in the human body’s

92
temperatures have always been indicators of dysfunction, where increased heat is mainly
associated with inflammation or infection. 35
The elevated soreness levels, and the increased myoglobin concentrations are both
indicators of DOMS. This verifies that the subjects did get sore after the exercise session.
Myoglobin is a monomer protein, which has several functions regarding oxygen storage
and transport in the muscles. After strenuous exercise, myoglobin can be released in the
bloodstream because of the breakdown of cell membranes in the exercised muscles. 76,77
Concentrations of muscle myoglobin markers in the blood, may increase 30 min after
exercising and peak at 24-72 hours post-exercise. 76
Certainly being able to quantify DOMS is important, but preventing it is as
important, especially in a diabetic population. Even though we would have liked to
investigate several nutritional supplements and vitamins, but because of financial and
time limitations, we chose to investigate only one supplement which was BCAA
There has been a heightened interest lately in nutritional supplementation, in
treating DOMS and its associated symptoms. In these studies, BCAA has shown
promising effects in attenuating muscle damage following exercise. 25,26,47,51,52,60
However, because people with diabetes have endothelial dysfunction, soreness levels
may be worse after exercise and recovery periods longer. 53 In addition, no study to date
has investigated the effects of BCAA in people with diabetes, which was one of the
focuses of this experiment.
BCAA, when consumed before or after an acute exercise, has been found to
further stimulate muscle protein synthesis and reduce muscle protein breakdown,
resulting in an enhanced muscle adaptation to the related damage. 47-49 These positive
93
results were seen in our diabetic group, where some of the muscle damage markers
including myoglobin concentrations, were much lower when compared to the placebo
group.
On the other hand, we found no significant differences between the healthy
groups, whether they ingested the BCAA or placebo supplement. A main reason for this
finding could be related to the fact that the supplementation duration wasn’t long enough.
Studies have concluded that the duration of BCAA supplementation could have a large
impact on its effects on DOMS. 78,79 For example, studies that supplemented their
subjects over a period of 2, and 4 weeks showed significant results on lowering DOMS,
and reducing muscle damage markers. 47,80
An intriguing finding in our experiment was that the BCAA supplement had
enhanced the recovery in the diabetic group, but had no effects in the healthy group. This
difference was not likely due to a placebo effect, because all subjects were blinded to
what supplement they were taking. A critical explanation for this occurrence could be
attributed to the fact that diabetic individuals have a high prevalence of gastrointestinal
complications including dyspepsia, and abdominal pain. 81,82 Diabetes mellitus is known
to provoke many complications such as retinopathy and nephropathy, and gastrointestinal
dysfunction is just one of these many complications. 81,83 Neuropathy and hyperglycemia
have been found to cause abnormal gastrointestinal motility and disturbed digestion,
which have shown to cause impaired intestinal absorption. 40-42 This may result in the
mal-absorption of essential amino acids from the proteins in the diet of a diabetic
individual. Thus, an amino acid supplement would be much easier for the diabetic
individual to absorb through an impaired gastrointestinal system.

94
Suggestions for Future Research
Several suggestions that would enhance some of the findings in this dissertation
would be to:
1. Look at different populations of people with diabetes, in regards to how long they
have been diagnosed with diabetes, and whether this factor affects the intensity of
DOMS in this population.
2. Look at diabetic individuals who have different levels of HbA1c control, and identify
if people with higher HbA1c, because of increased neuropathic damage, feel more or
less soreness compared to people with lower HbA1c.
3. Look at different durations of the supplementation, especially in the healthy control
subjects because the BCAA supplement seemed to have minimal effects on that
group. An extended duration might also benefit people with diabetes, where they
might experience even less soreness with increased periods of supplementation.
4. Look at other types of nutritional supplements, such as vitamin A, C, D, E, and Co-
Enzyme Q10, and what impact would these supplements have in regards to exercise
performance, and reducing muscle soreness? Also, if different vitamins and
supplements are coupled with BCAA, would this combination be even more
beneficial in adding extra nutrients to people with diabetes, and assist in the muscle
recovery process after exercise.
Conclusion
In this dissertation, we provided evidence that people with diabetes experienced
higher levels of muscle soreness after an intense exercise session, when compared to

95
healthy controls. This muscle soreness was quantified non-invasively, as well as with
invasive biomarkers. One interesting finding in this study was that we developed a new
novel biomarker, thermal imaging, which provided an efficient and non-invasive
technique of predicting and quantifying the extent of muscle soreness in healthy and
diabetic individuals. This new biomarker was correlated with the pain scales, and with
the myoglobin concentrations throughout this investigation. Thermal imaging would then
be a painless and in-expensive way of detecting DOMS in its early stages,
By using this biomarker and other biomarkers it was also shown that at least one
nutritional supplement, BCAA, reduced muscle soreness and enhanced recovery in
people with diabetes. Therefore, BCAA supplementation would be a simple method for
stabilizing the muscle’s protein content after an acute bout of resistance exercise in
people with diabetes.
From this investigation we found that thermal imaging would be an early
predictor of muscle soreness. We also concluded that BCAA would be beneficial in
decreasing DOMS, and in enhancing muscle recovery following exercise. Thus, an acute
dose of BCAA supplementation would help in faster muscle recovery, and an early
detection of DOMS would assist in minimizing the incidence of injuries from over-
exercising sore muscles.

96
REFERENCES
1. Al-Hussein FA. Diabetes control in a primary care setting: a retrospective study of 651 patients. Ann Saudi Med. 2008;28(4):267-271.
2. Sarah Wild GR, Anders Green, Richard Sicree, Hilary King. Global Prevalence of Diabetes: Estimates for the year 2000 and projections for 2030. Diabetes Care. 2004;27:1047-1053.
3. J.E. Shaw RAS, P.Z. Zimmet. Global estimates of the prevalence of diabetes for 2010 and 2030. Diabetes Research and Clinical Practice 2010;87:4-14.
4. Collins Boakye-Agyemang FI, Devan Mohee, Souleymane Koné, Henry Bastienne, José Dacosta Caetano. The Challenge of Diabetes by 2030. 13 November 2009 2009.
5. Types of Diabetes. International Diabetes Federation; 2011. http://www.idf.org/types-diabetes. Accessed 09/16/2011.
6. Praet SFE, Loon LJC. Exercise therapy in Type 2 diabetes. Acta Diabetologica. 2009;46(4):263-278.
7. Hills AP, Shultz SP, Soares MJ, et al. Resistance training for obese, type 2 diabetic adults: a review of the evidence. Obesity Reviews. 2009;11(10):740-749.
8. Kenneth D. Kochanek JX, Sherry L. Murphy, Arialdi M. Miniño, Hsiang-Ching Kung. Deaths: Preliminary Data for 2009. National Vital Statistics Reports. 2011;59(4):1-51.
9. Diabetes. World Health Organization; 2011. http://www.who.int/mediacentre/factsheets/fs312/en/index.html. Accessed 09/21/2011.
10. Zanuso S, Jimenez A, Pugliese G, Corigliano G, Balducci S. Exercise for the management of type 2 diabetes: a review of the evidence. Acta Diabetologica. 2009;47(1):15-22.
11. A. Honkola TF, J. Eriksson. Resistance training improves the metabolic profile in individuals with type 2 diabetes. Acta Diabetologica. 1997;34:245-248.
12. Church TS, Blair SN, Cocreham S, et al. Effects of Aerobic and Resistance Training on Hemoglobin A1c Levels in Patients With Type 2 Diabetes. JAMA: The Journal of the American Medical Association. 2010;304(20):2253-2262.

97
13. Castaneda C. Diabetes control with physical activity and exercise. Nutrition in clinical care. 2003;6(2):89-96.
14. Nathan K. LeBrasseur KW, Zoltan Arany. Metabolic benefits of resistance training and fast glycolytic skeletal muscle. Am J Physiol Endocrinol Metab. 2010;300:E3–E10.
15. Umpierre D, Ribeiro PAB, Kramer CK, et al. Physical Activity Advice Only or Structured Exercise Training and Association With HbA1c Levels in Type 2 Diabetes: A Systematic Review and Meta-analysis. JAMA: The Journal of the American Medical Association. 2011;305(17):1790-1799.
16. Srikanthan P, Karlamangla AS. Relative Muscle Mass Is Inversely Associated with Insulin Resistance and Prediabetes. Findings from The Third National Health and Nutrition Examination Survey. Journal of Clinical Endocrinology & Metabolism. 2011.
17. Meex RCR, Schrauwen-Hinderling VB, Moonen-Kornips E, et al. Restoration of Muscle Mitochondrial Function and Metabolic Flexibility in Type 2 Diabetes by Exercise Training Is Paralleled by Increased Myocellular Fat Storage and Improved Insulin Sensitivity. Diabetes. 2009;59(3):572-579.
18. Howatson G, Someren KAV. The Prevention and Treatment of Exercise-Induced Muscle Damage. Sports Med. 2008;38(6):483-503.
19. Cheung K, Hume PA, Maxwell L. Delayed Onset Muscle Soreness: Treatment strategies and Performance Factors. Sports Med. 2003;33(2):145-164.
20. Armstrong RB. Mechanisms of exercise-induced delayed onset muscular soreness: a brief review. Medicine and Science in Sports and Exercise. 1984;16(6):529-538.
21. Evans WJ. Exercise, Nutrition and Aging. Journal of Nutrition. 1992;122:796-801.
22. Diamond Nguyen LEB, Jared W. Coburn, Daniel A. Judelson, Alea D. Eurich, Andy V. Khamoui, Brandon P. Uribe. Effect of delayed-onset muscle soreness on elbow flexion strength and rate of velocity development. Journal of Strength and Conditioning Research. 2009;23(4):1282–1286.
23. Kazunori Nosaka MN, Paul Sacco. Muscle damage and soreness after endurance exercise of the elbow flexors. Medicine & Science in Sports & Exercise. 2002;34(6):920-927.
24. Akihiro Sakamoto TM, Hisashi Naito, Peter J. Sinclair. Acute Effects of High Intensity Dumbbell Exercise After Isokinetic Eccentric Damage: Interaction between altered pain perception and fatigue on static and dynamic muscle

98
performance. Journal of Strength and Conditioning Research. 2010;24(8):2042-2049.
25. Kirby TJ, Triplett NT, Haines TL, Skinner JW, Fairbrother KR, McBride JM. Effect of leucine supplementation on indices of muscle damage following drop jumps and resistance exercise. Amino Acids. 2011.
26. Kraemer WJ, Ratamess NA, Volek JS, et al. The effects of amino acid supplementation on hormonal responses to resistance training overreaching. Metabolism. 2006;55(3):282-291.
27. Warren GL, Lowe DA, Armstrong RB. Measurement Tools Used in the Study of Eccentric Contraction-Induced Injury. Sports Med. 1999;27(1):43-59.
28. Clarkson PM, Ebbeling C. Investigation of Serum Creatine Kinase Variability after Muscle-Damaging Exercise. Clin Sci. 1988;75(3):257-261.
29. Stone MB, Merrick MA, Ingersoll CD, Edwards JE. Preliminary Comparison of Bromelain and Ibuprofen for Delayed Onset Muscle Soreness Management. Clinical Journal of Sports Medicine. 2002;12:373-378.
30. Frey Law LA, Evans S, Knudtson J, Nus S, Scholl K, Sluka KA. Massage Reduces Pain Perception and Hyperalgesia in Experimental Muscle Pain: A Randomized, Controlled Trial. The Journal of Pain. 2008;9(8):714-721.
31. Vaile J, Halson S, Gill N, Dawson B. Effect of hydrotherapy on the signs and symptoms of delayed onset muscle soreness. European Journal of Applied Physiology. 2007;102(4):447-455.
32. Vinck E, Cagnie B, Coorevits P, Vanderstraeten G, Cambier D. Pain reduction by infrared light-emitting diode irradiation: a pilot study on experimentally induced delayed-onset muscle soreness in humans. Lasers in Medical Science. 2006;21(1):11-18.
33. Barlas P, Robinson J, Allen J, Baxter GD. Lack of effect of acupuncture upon signs and symptoms of delayed onset muscle soreness. Clinical physiology. 2000;20(6):449-456.
34. MacIntyre DL, Reid WD, McKenzie DC. Delayed Muscle Soreness: The Inflammatory Response to Muscle Injury and its Clinical Implications. Sports Med. 1995;20(1):24-40.
35. Jiang LJ, Ng EYK, Yeo ACB, et al. A perspective on medical infrared imaging. Journal of Medical Engineering & Technology. 2005;29(6):257-267.
36. Herman C, Cetingul MP. Quantitative Visualization and Detection of Skin Cancer Using Dynamic Thermal Imaging. JoVE. 2011;51.

99
37. Wang J, Chang K-J, Chen C-Y, et al. Evaluation of the diagnostic performance of infrared imaging of the breast: a preliminary study. BioMedical Engineering OnLine. 2010;9(1):3.
38. Murray AK, Moore TL, Manning JB, Taylor C, Griffiths CEM, Herrick AL. Noninvasive imaging techniques in the assessment of scleroderma spectrum disorders. Arthritis & Rheumatism. 2009;61(8):1103-1111.
39. Ivanitsky GR, Khizhnyak EP, Deev AA, Khizhnyak LN. Thermal imaging in medicine: A comparative study of infrared systems operating in wavelength ranges of 3–5 and 8–12 μm as applied to diagnosis. Doklady Biochemistry and Biophysics. 2006;407(1):59-63.
40. Lawrence A. Szarka MC. Stomach Dysfunction in Diabetes Mellitus: Emerging Technology and Pharmacology. Journal of Diabetes Science and Technology. 2010;4(1):180-189.
41. Camilleri M. Gastrointestinal problems in diabetes. Endocrinol Metab Clin North Am. 1996;25(2):361-378.
42. Russell Yang RA, Lawrence Chan. Gastrointestinal Tract Complications of Diabetes Mellitus: Pathophysiology and Management. Arch Intern Med. 1984;144:1251-1256.
43. Robert M. Berne MNL, Bruce M. Koeppen, Bruce A. Stanton. Physiology. 4th ed. St. Louis: Mosby; 1998.
44. Mero A. Leucine supplementation and Intensive Training. Sports Med. 1999;27(6):347-358.
45. Eva Blomstrand BE-G. Changes in amino acid concentration in plasma and type I and type II fibres during resistance exercise and recovery in human subjects. Amino Acids. 2009;37:629-636.
46. W. Apro´ EB. Influence of supplementation with branched-chain amino acids in combination with resistance exercise on p70S6 kinase phosphorylation in resting and exercising human skeletal muscle. Acta Physiologica. 2010;200:237-248.
47. Carwyn P.M. Sharp DRP. Amino Acid Supplements and Recovery from High-Intensity Training. Journal of Strength and Conditioning Research. 2010;24(4):1125-1130.
48. Matt S. Stock JCY, Lawrence A. Golding, Laura J. Kruskall, Richard D. Tandy, Janice M. Conway-Klaassen, Travis W. Beck. The Effects of Adding Leucine to Pre and Postexercise Carbohydrate Beverages on Acute Muscle Recovery from Resistance Training. Journal of Strength and Conditioning Research. 2010;24(8):2211-2219.

100
49. Yoshiharu Shimomura TM, Naoya Nakai, Masaru Nagasaki, Robert A. Harris. Exercise Promotes BCAA Catabolism: Effects of BCAA Supplementation on Skeletal Muscle during Exercise. Journal of Nutrition. 2004;134:1583S-1587S.
50. Yoshiharu Shimomura TH, Makoto Shiraki, Taro Murakami, Juichi Sato, Hisamine Kobayashi, Kazunori Mawatari, Mariko Obayashi, Robert A. Harris. Branched-Chain Amino Acid Catabolism in Exercise and Liver Disease. Journal of Nutrition. 2006;136:250S-253S.
51. Jackman SR, Witard OC, Jeukendrup AE, Tipton KD. Branched-Chain Amino Acid Ingestion Can Ameliorate Soreness from Eccentric Exercise. Medicine & Science in Sports & Exercise. 2010;42(5):962-970.
52. Matsumoto K, Mizuno M, Mizuno T, et al. Branched-chain Amino Acids and Arginine Supplementation Attenuates Skeletal Muscle Proteolysis Induced by Moderate Exercise in Young Individuals. International Journal of Sports Medicine. 2007;28(6):531-538.
53. Petrofsky J, Batt J, Bollinger JN, Jensen MC, Maru EH, Al-Nakhli HH. Comparison of Different Heat Modalities for Treating Delayed-Onset Muscle Soreness in People with Diabetes. Diabetes Technology & Therapeutics. 2011;13(6):645-655.
54. Kanter MM. Free radicals, exercise, and antioxidant supplementation. International journal of sport nutrition. 1994;4(3):205-220.
55. Betts JA, Toone RJ, Stokes KA, Thompson D. Systemic indices of skeletal muscle damage and recovery of muscle function after exercise: effect of combined carbohydrate-protein ingestion. Applied Physiology, Nutrition, and Metabolism. 2009;34(4):773-784.
56. Petrofsky J, Lee H, Trivedi M, et al. The Influence of Aging and Diabetes on Heat Transfer Characteristics of the Skin to a Rapidly Applied Heat Source. Diabetes Technology & Therapeutics. 2010;12(12):1003-1010.
57. Momma H, Niu K, Kobayashi Y, et al. Skin advanced glycation end product accumulation and muscle strength among adult men. European Journal of Applied Physiology. 2010;111(7):1545-1552.
58. Burr J, Rowan C, Jamnik V, Riddell M. The role of physical activity in type 2 diabetes prevention: physiological and practical perspectives. Phys Sportsmed. 2010;38(1):72-82.
59. Symons TB, Clasey JL, Gater DR, Yates JW. Effects of Deap Heat as a Preventative Mechanism on Delayed Onset Muscle Soreness. Journal of Strength and Conditioning Research. 2004;18(1):155-161.
101
60. Yoshiharu Shimomura YY, Gustavo Bajotto, Juichi Sato, Taro Murakami, Noriko Shimomura, Hisamine Kobayashi, Kazunori Mawatari. Nutraceutical Effects of Branched-Chain Amino Acids on Skeletal Muscle. Journal of Nutrition. 2006;136:529S-532S.
61. Evans WJ. Exercise, nutrition and aging. J Nutr. Mar 1992;122(3 Suppl):796-801.
62. Fielding RA, Meredith CN, O'Reilly KP, Frontera WR, Cannon JG, Evans WJ. Enhanced protein breakdown after eccentric exercise in young and older men. J Appl Physiol. Aug 1991;71(2):674-679.
63. Kanter MM. Free radicals, exercise, and antioxidant supplementation. Int J Sport Nutr. Sep 1994;4(3):205-220.
64. Pennes HH. Analysis of Tissue and Arterial Blood Temperatures in the Resting Human Forearm. J Appl Physiol. 1948;1(2):93-122.
65. Petrofsky J, Paluso D, Anderson D, et al. The contribution of skin blood flow in warming the skin after the application of local heat; the duality of the Pennes heat equation. Medical Engineering & Physics. 2011;33(3):325-329.
66. Petrofsky J, Bains G, Prowse M, et al. Does skin moisture influence the blood flow response to local heat? A re-evaluation of the Pennes model. J Med Eng Technol. 2009;33(7):532-537.
67. Rowell LB, Murray JA, Brengelmann GL, Kraning KK. Human Cardiovascular Adjustments to Rapid Changes in Skin Temperature during Exercise. Circ. Res. 1969;24:711-724.
68. Cranston WI, Gerbrandy J, Snell ES. Oral, Rectal and Oesophageal Temperatures and Some Factors Affecting Them in Man. J Physiol. 1954;126:347-358.
69. Petrofsky J, Bains G, Prowse M, et al. Dry heat, moist heat and body fat: are heating modalities really effective in people who are overweight? J Med Eng Technol. 2009;33(5):361-369.
70. Petrofsky J. The effect of the subcutaneous fat on the transfer of current through skin and into muscle. Medical Engineering & Physics. 2008;30(9):1168-1176.
71. Rowell LB. Cardiovascular aspects of human thermoregulation. Circ. Res. 1983;52:367-379.
72. Chatzinikolaou A, Fatouros IG, GOURGOULIS V, et al. Time Course of Changes in Performance and Inflammatory Responses After Acute Plyometric Exercise. J Strength Cond Res. 2010;24(5):1389-1398.

102
73. Zaproudina N, Ming Z, Hanninen OOP. Plantar Infrared Thermography Measurements and Low Back Pain Intensity. Journal of Manipulative and Physiological Therapeutics. 2006;29(3):219-223.
74. Kim Y-C, Bahk J-H, Lee S-C, Lee Y-W. Infrared Thermographic Imaging in the Assessment of Successful Block on Lumbar Sympathetic Ganglion. Yonsei Medical Journal. 2003;44(1):119-124.
75. Kennedy DA, Lee T, Seely D. A Comparative Review of Thermography as a Breast Cancer Screening Technique. Integrative Cancer Therapies. 2009;8(1):9-16.
76. Brancaccio P, Lippi G, Maffulli N. Biochemical markers of muscular damage. Clinical Chemistry and Laboratory Medicine. 2010;48(6):757-767.
77. Ordway GA. Myoglobin: an essential hemoprotein in striated muscle. Journal of Experimental Biology. 2004;207(20):3441-3446.
78. Nosaka K SP, Mawatari K. Effects of amino acid supplementation on muscle soreness and damage. Int J Sport Nutr Exerc Metab. 2006;16(6):620-635.
79. Knechtle B, Knechtle P, Mrazek C, et al. No effect of short-term amino acid supplementation on variables related to skeletal muscle damage in 100 km ultra-runners - a randomized controlled trial. Journal of the International Society of Sports Nutrition. 2011;8(1):6.
80. Skillen RA TM, Applegate EA, Heiden EA, Fascetti AJ, Casazza GA. Effects of an amino acid carbohydrate drink on exercise performance after consecutive-day exercise bouts. Int J Sport Nutr Exerc Metab. 2008;18(5):473-492.
81. Oh J-H, Choi M-G, Kang M-I, et al. The Prevalence of Gastrointestinal Symptoms in Patients with Non-Insulin Dependent Diabetes Mellitus. The Korean Journal of Internal Medicine. 2009;24(4):309.
82. Amer Shakil RJC, Shobha S. Rao. Gastrointestinal Complications of Diabetes. American Family Physician. 2008;77(12):1697-1702.
83. Khaled M. Elsayes COM, Lina Sierra, Jonathan R. Dillman, Joel F. Platt. Gastrointestinal Manifestations of Diabetes Mellitus: Spectrum of Imaging Findings. J Comput Assist Tomogr. 2009;33:86-89.

103
APPENDIX A
SUBJECT DATA COLLECTION FORM
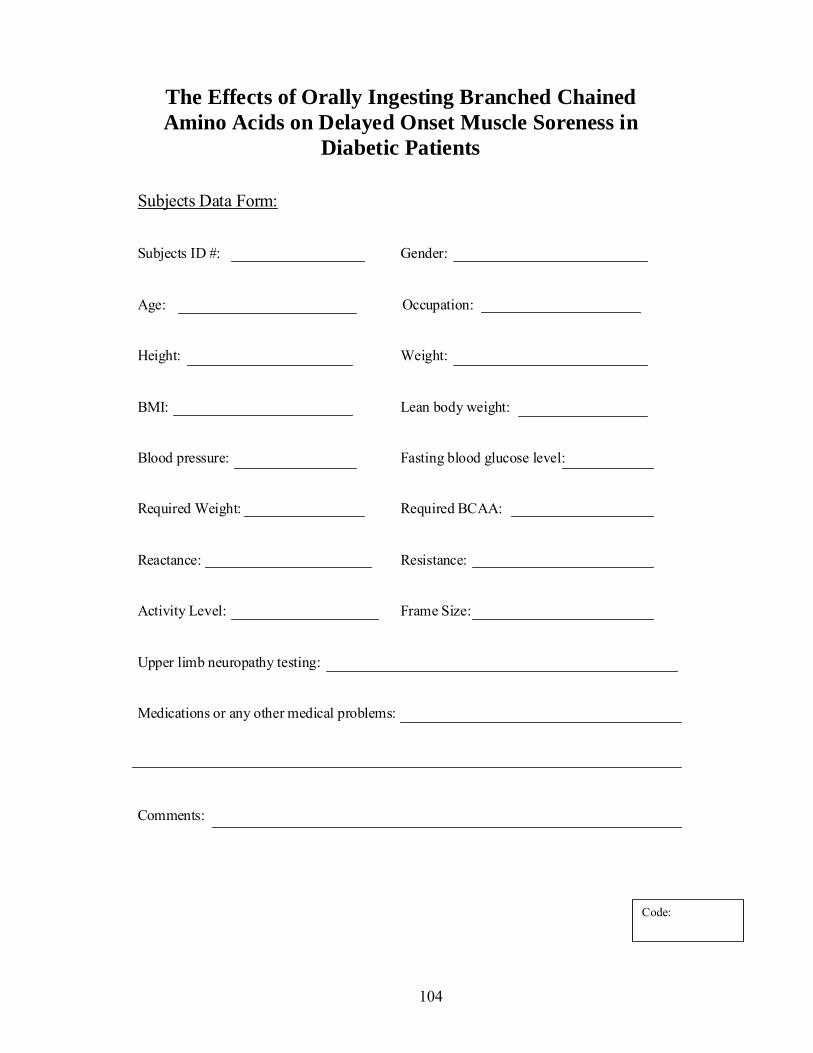
104
The Effects of Orally Ingesting Branched Chained Amino Acids on Delayed Onset Muscle Soreness in
Diabetic Patients Subjects Data Form: Subjects ID #: Gender: Age: Occupation: Height: Weight: BMI: Lean body weight: Blood pressure: Fasting blood glucose level: Required Weight: Required BCAA: Reactance: Resistance: Activity Level: Frame Size: Upper limb neuropathy testing: Medications or any other medical problems: Comments:
Code:

105
APPENDIX B
SHORT FORM McGILL PAIN QUESTIONNAIRE

106
Arm:
Pain
Arm.

107
APPENDIX C
INFORMED CONSENT FORM

108

109

110
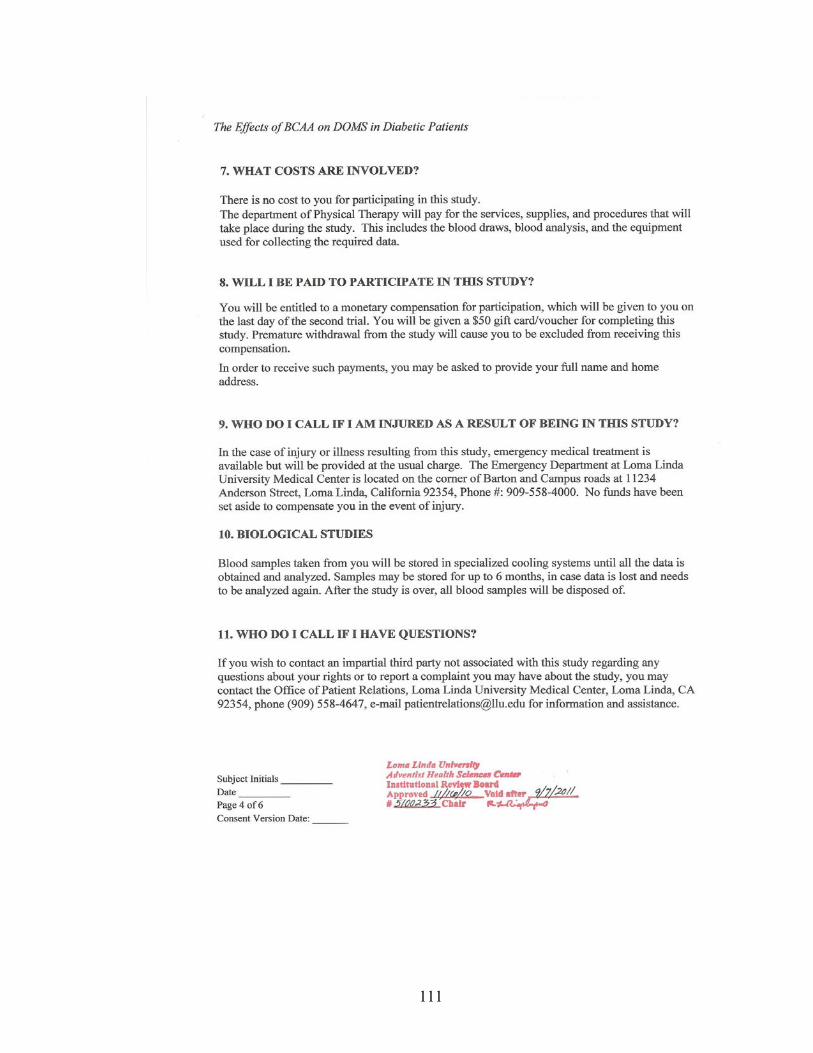
111

112

113


