
Vincenzo Giordano Silvia Vitiello Julija Vasiljevska
Under the EC "Proposal for a regulation of the
European Parliament and of the Council on
guidelines for trans-European energy
infrastructure"
DEFINITION OF AN ASSESSMENT FRAMEWORK FOR PROJECTS OF COMMON INTEREST IN THE FIELD OF SMART GRIDS
2014
Report EUR 25828 EN

European Commission
Joint Research Centre
Institute for Energy and Transport
Contact information
Silvia L. Vitiello
Address: Joint Research Centre, Westerduinweg 3, NL-1755 LE Petten The Netherlands
E-mail: [email protected]
Tel.: +31 (0)224 56 5182
http://ses.jrc.ec.europa.eu/
Legal Notice
This publication is a Science and Policy Report by the Joint Research Centre, the European Commission’s in-house science
service. It aims to provide evidence-based scientific support to the European policy-making process. The scientific output
expressed does not imply a policy position of the European Commission. Neither the European Commission nor any person
acting on behalf of the Commission is responsible for the use which might be made of this publication.
All images © European Union 2014
JRC79445
EUR 25828 EN
ISBN 978-92-79-28757-2 (PDF)
ISSN 1831-9424 (online)
doi:10.2790/83888
Luxembourg: Publications Office of the European Union, 2014
© European Union, 2014
Reproduction is authorised provided the source is acknowledged.
Abstract
The document presents the methodology elaborated by JRC within the framework of its participation to the work of the
Smart Grids Task Force, Expert Group on Smart Grid Infrastructure Deployment (Expert Group 4). The then adopted
Regulation 347/2013 on guidelines for trans-European energy infrastructure provides for the establishment of a EU-wide
list of "Projects of Common Interest", a label identifying key energy infrastructure projects in EU. Within this framework,
Expert Group 4 had the mandate to define an evaluation framework for projects proposals in the field of smart grids. On
the basis of its experience on Cost Benefit Analysis of smart grid projects, JRC developed a multi-criteria assessment
framework including: a) a checklist to check that project proposals meet the requirements set out by the Regulation; b) a
techno-economic assessment through Key Performance Indicators to capture the key features of each project; c) a Cost
Benefit Analysis of each projects.

1
Smart Grids Task Force Expert Group 4 – Infrastructure Development
DEFINITION OF AN ASSESSMENT FRAMEWORK FOR PROJECTS OF
COMMON INTEREST IN THE FIELD OF SMART GRIDS
under the EC 'Proposal for a regulation of the European Parliament and of the Council on guidelines for
trans-European energy infrastructure and repealing Decision No 1364/2006/EC’ (COM(2011) 658)
Brussels, July 2012

2
EUROPEAN TASK FORCE FOR THE IMPLEMENTATION OF SMART GRIDS INTO THE EUROPEAN INTERNAL MARKET
The mission of the Smart Grids Task Force (SGTF) is to advise the Commission on policy and regulatory frameworks at
European level to co-ordinate the first steps towards the implementation of Smart Grids under the provision of the
Third Energy Package and to assist the Commission in identifying projects of common interest in the field of Smart
Grids under the context of regulations on guidelines for Trans-European Infrastructure (COM (2011)658) 1
.
The Smart Grids Task Force was reactivated in 01/02/2012 and four Expert Groups were launched2. This report has
been developed and adopted by the Expert Group for Smart Grid Infrastructure Deployment (Expert group 4).
1 http://eur-lex.europa.eu/LexUriServ/LexUriServ.do?uri=COM:2011:0658:FIN:EN:PDF
2 http://ec.europa.eu/energy/gas_electricity/smartgrids/doc/mission_and_workprogramme.pdf

3
TABLE OF CONTENTS
SMART GRID TASK FORCE .............................................................................................................................. 1
1 INTRODUCTION ............................................................................................................................ 4
2 MINIMUM TECHNICAL REQUIREMENTS ..................................................................................... 8
3 PROJECT CONTRIBUTION TO SMART GRID FUNCTIONS – EVALUATION CRITERIA AND KEY PERFORMANCE INDICATORS ......................................................................................................................... 9
4 ECONOMIC VIABILITY - COST-BENEFIT ANALYSIS ......................................................................13
4.1 ECONOMIC VIABILITY - MONETARY APPRAISAL ....................................................................................... 14 4.2 CBA – APPRAISAL OF NON-MONETARY IMPACTS.................................................................................... 16
5 SUMMARY – PROJECT PROPOSALS AND EVALUATION PROCESS .............................................18
REFERENCES ..................................................................................................................................................22
ANNEX I TEMPLATE FOR PROJECT PROPOSALS AND FOR PROJECT MONITORING ....................................26
ANNEX II PROPOSED CALCULATION OPTIONS FOR KPIS MENTIONED IN THE REGULATION PROPOSAL ..35
ANNEX III A GUIDE TO THE CALCULATION OF BENEFITS .............................................................................54
ANNEX IV – POSSIBLE ADDITIONAL PROJECT IMPACTS TO ARGUE FOR THE ECONOMIC VIABILITY OF THE PROJECT ........................................................................................................................................................63
ANNEX V – MULTI-CRITERIA DECISION ANALYSIS USING THE ANALYTIC HIERARCHY PROCESS (AHP) METHOD ........................................................................................................................................................66
ANNEX VI – EXAMPLE TO ILLUSTRATE THE ANALYTIC HIERARCHY PROCESS (AHP) METHOD ...................70

4
1 INTRODUCTION
The scope of this document is to sketch an assessment framework in order to identify and
evaluate Smart Grid projects in line with the requirements put forward by the European
Commission (EC) in the Proposal for a regulation on guidelines for trans-European energy
infrastructure (COM(2011)658) [EC 2011a]. This identification and evaluation shall be carried out
in the course of 2012 in line with the missions of the Smart Grid Task Force expert group 4
"infrastructure development" [EC 2012a].
Smart Grid priority
The draft Regulation identifies "Smart Grids deployment" among the proposed 12 priorities,
with the objective to adopt Smart Grid technologies across the Union to efficiently integrate the
behaviour and actions of all users connected to the electricity network, in particular the
generation of large amounts of electricity from renewable or distributed energy sources and
demand response by consumers.
Smart Grid definition
A Smart Grid is a network efficiently integrating the behaviour and actions of all users connected
to it – generators, consumers and those that do both – in order to ensure an economically
efficient, sustainable electricity system with low losses and high quality and security of supply
and safety” [Proposal for a Regulation on Guidelines for trans-European energy infrastructures,
Annex II – Energy Infrastructure categories]. The draft Regulation considers as Smart Grid
infrastructure “any equipment or installation, both at transmission and medium voltage
distribution level, aiming at two way digital communication, real-time or close to real-time,
interactive and intelligent monitoring and management of electricity generation, transmission,
distribution and consumption within an electricity network”.
Eligibility requirements
The Regulation proposal defines the following general requirements for project eligibility:
Contributing to the implementation of the energy infrastructure priority corridors and
priority thematic areas, including Smart Grids deployment (article 4 point 1a and Annex I
(10))

5
Fulfilling the minimum technical requirements reported in Annex IV (1)(e) of the
Regulation proposal
Significantly contributing to the six specific functions (these functions are indicated as
‘services’ in [EC Task Force for Smart Grids 2010a]) of the “ideal” Smart Grid (article 4
point 2c). Project contribution to the six functions shall be evaluated against six
different criteria. Each criterion shall be measured according to a number of key
performance indicators (KPIs), as detailed in annex IV (4).
The potential benefits of the project assessed according to the proposed criteria and
KPIs outweigh its costs (article 4 point 1b)
Goal of this report
The goal of this report is to define an assessment framework for the evaluation of projects
against all the aforementioned criteria and to guide project promoters in compiling their project
proposals.
Table 1 summarizes the evaluation criteria and highlights the proposed tool to perform the
evaluation. The compliance of the project with the minimum technical requirements is verified
through a checklist. Key performance indicators and corresponding calculation metrics are
proposed to assess the contribution of projects to Smart Grid functions. A cost-benefit analysis
framework is presented to assess the economic viability of the project.
SMART GRID PROJECT EVALUATION CRITERIA ASSESSMENT TOOL
1)Fulfil minimum technical requirements Checklist
2)Contribute significantly to the specific target
functions defined in Article 4.2.c
Evaluation against six policy criteria: key
performance indicators (KPI) and
corresponding metrics
3)Benefits outweigh costs
Cost-benefit analysis (CBA) and qualitative
impact analysis of additional impacts that
cannot be reliably monetized
Table 1 Requirements of the overall Smart Grid project assessment

6
The assessment should consider the following two scenarios:
Business as Usual (BaU) scenario (without Smart Grids deployment), considering only
planned maintenance. This is the reference scenario to assess the impact of the Smart Grid
project.
Smart Grid project implementation (SG scenario). This is the scenario with the Smart Grid
project in place. Particular attention should be devoted to clearly defining the portion of the
grid that will be affected by the Smart Grid project and that will be thus considered in the
analysis. The choice of the boundary of the analysis should be clearly illustrated and
motivated.
More details on the set of tools composing the proposed assessment framework are provided in
the next sections. Chapter 2 discusses the implementation of the checklist to verify project
compliance with the minimum technical requirements. Chapter 3 discusses the KPI-analysis for
the evaluation of the policy-related criteria reported in ANNEX IV of the Regulation Proposal.
Chapter 4 presents cost-benefit analysis guidelines to capture the economic impact of candidate
projects. Finally chapter 5 summarizes the content of the project proposals that is required for
the evaluation process.
The general idea of the assessment framework is that it is up to project promoters to clearly and
convincingly build the case for their project. They shall demonstrate how the project proposal is
fully in line with the technical, economic and policy criteria, as laid down in the energy
Regulation. To this end, the project information template in ANNEX I should be accurately filled
by all project promoters. The guidelines presented in this document are intended to support
project promoters in performing this exercise.
In particular, the project proposal should argue convincingly about the project contribution to
policy criteria, by making reference to the corresponding KPIs. As much as possible, the
argumentation of the project contribution to a particular criterion (e.g. level of sustainability)
should be supported by a quantification of the corresponding KPIs (e.g. reduction of greenhouse
gas emissions, environmental impact of electricity grid infrastructure).
Likewise, the project proposal should argue convincingly about the economic viability and cost
effectiveness of the project, by discussing how achieved benefits outweigh the costs. These

7
arguments should be credibly supported by both numerical quantifications (societal CBA) and
qualitative appraisals of benefits that cannot be reliably monetized.
To this end, the report also proposes a number of calculation options which are intended to
facilitate the preparation of project proposals by project promoters. In particular, ANNEX II and
ANNEX III present guidelines for the calculation of KPIs and of the monetary benefits of the CBA.
Chapter 4 discusses also the qualitative appraisal of some project impacts that cannot be
reliably monetized and included in the CBA (e.g. social impacts).
However, project promoters can, if duly justified, propose other evaluation methods for both
the CBA and the KPI analysis. In any case, they need to clearly and transparently provide a
detailed explanation of the rationale and of the assumptions of the evaluation methods they
have employed.

8
2 MINIMUM TECHNICAL REQUIREMENTS
Proposed projects need to comply with the following minimum technical requirements
Being implemented at a voltage level of 10kV or more
Involving at least two Member States (MS), either by directly crossing the border of one
or more MS or by being located on the territory of one MS and having significant cross-
border impact; involve transmission and distribution operators from at least two MS
Covering at least 100,000 users (producers, consumers and prosumers)
Focusing on a consumption area of at least 300 GWh/year, of which at least 20%3
originate from non-dispatchable resources.
Project promoters shall argue convincingly about the project compliance to these technical
requirements. In particular, project promoters shall clearly demonstrate the cross-border impact
of the project and describe in detail the role of the project participants (particularly DSOs and
TSOs) from the involved Member States. This analysis shall be supported by all relevant
technical documentation. Project promoters shall fill in detail the checklist of minimum technical
requirements, as reported in section A3 of ANNEX I of the present document. The checklist shall
be drawn by Art. (4.1) (c) (Chapter II) and Art. (1) (e) of Annex IV of the Regulation proposal.
3 Following discussions in the Expert Group 4 of The Smart Grid Task Force, it has been clarified
that this requirement refers to capacity

9
3 PROJECT CONTRIBUTION TO SMART GRID FUNCTIONS – EVALUATION CRITERIA AND KEY PERFORMANCE INDICATORS
As detailed in the regulation proposal, selected projects are expected to contribute to the six
Smart Grid functions presented in article 4 point 2c.
The functions will be evaluated via a set of six criteria, which are directly related to Smart Grid
policy objectives. In turn, the contribution of the project to each criterion will be evaluated via a
set of Key Performance Indicators (KPI) as set out in Annex IV, point (4). The six policy criteria
and the corresponding KPIs are reported below:
a. Level of sustainability
1) Reduction of greenhouse emissions
2) Environmental impact of electricity grid infrastructure
b. Capacity of transmission and distribution grids to connect and bring electricity from and
to users
1) Installed capacity of distributed energy resources in distribution networks
2) Allowable maximum injection of electricity without congestion risks in
transmission networks
3) Energy not withdrawn from renewable sources due to congestion or security
risks
c. Network connectivity and access to all categories of network users
1) Methods adopted to calculate charges and tariffs, as well as their structure, for
generators, consumers and those that do both
2) Operational flexibility provided for dynamic balancing of electricity in the
network
d. Security and quality of supply
1) Ratio of reliably available generation capacity and peak demand
2) Share of electricity generated from renewable sources
3) Stability of the electricity system
4) Duration and frequency of interruptions per customer, including climate related
disruptions
5) Voltage quality performance
e. Efficiency and service quality in electricity supply and grid operation

10
1) Level of losses in transmission and distribution networks
2) Ratio between minimum and maximum electricity demand within a defined
time period
3) Demand side participation in electricity markets and in energy efficiency
measures
4) Percentage utilisation (i.e. average loading) of electricity network components
5) Availability of network components (related to planned and unplanned
maintenance) and its impact on network performances
6) Actual availability of network capacity with respect to its standard value
f. Contribution to cross-border electricity markets by load-flow control to alleviate loop-
flows and increase interconnection capacities
1) Ratio between interconnection capacity of a Member State and its electricity
demand
2) Exploitation of interconnection capacities
3) Congestion rents across interconnections
The aforementioned criteria and KPIs are outcome-oriented and not limited to delivering a
certain type of physical (hardware or software) infrastructure (that means that ‘number of
intelligent substations deployed’ for example is not a criterion or KPI) (see also [ERGEG 2010]).
It is up to project promoters to build a convincing case for their project according to each of the
six criteria, taking into account the corresponding KPIs (see figure 1).
The outcome of this analysis should therefore be a detailed explanation of how the project is
contributing to each of the six criteria (sections B2.1 – B2.6 in ANNEX I). For each criterion,
arguments should be supported as much as possible by a quantification of the corresponding
KPIs and a clear and detailed explanation of the KPI calculation assumptions. When duly justified,
qualitative assessment of KPIs will also be accepted. If a KPI is not directly relevant or applicable
to the project, project promoters shall clearly demonstrate it.
In order to facilitate this exercise, Annex II proposes options on how to transform the KPIs into
computable metrics. For some of them, formulas have been proposed for their quantification.
Project promoters should express as many KPIs as possible in quantitative values. However,
given the uncertainties surrounding many KPIs and their underlying assumptions, these shall be

11
clearly stated together with the numerical results. Qualitative assessments, where duly justified,
will be accepted as well. In any case, project promoters need to make sure that their KPI
assessment is technically sound and verifiable.
Figure 1 Project appraisal against the six policy criteria based on the KPI analysis (section B2 of ANNEX I)
In the discussion of the project performance according to the different criteria, we underline
three main issues.
Criteria and KPIs might pull in opposite directions
First of all, the proposed criteria and KPIs evaluate the impact of Smart Grid technologies from
different perspectives. It is possible that some projects will perform well against a certain
criterion and less well against others. Criteria 2 (adequate grid capacity), 4 (security and quality
of supply) and 5 (efficiency and service quality) are in several occasions pulling in opposite
directions. For example, an improvement in the penetration of DERs might be at odds with a
reduction in the level of energy losses or in the level of voltage harmonic distortion. The
proposed multi-criteria analysis framework proposed in ANNEX V is intended to transparently
trade-off possibly contradictory scores of projects according to the different criteria and come
up with a single overall assessment of the project. In any case, project promoters shall clearly
highlight possible contradictory scores against different criteria and KPIs and explain the reasons.
Influence of local conditions on the project evaluation
Level of sustainability
•Demonstrate convincingly project contribution by referring to
•KPIa1
•KPIb1
Grid capacity
•Demonstrate convincingly project contribution by referring to
•KPIa2
•KPIb2
•KPIc2
Grid connectivity and access
•Demonstrate convincingly project contribution by referring to
•KPIa3
•KPIb3
Security and quality of
supply
•Demonstrate convincingly project contribution by referring to
•KPIa4
•KPIb4
•KPIc4
•KPId4
•KPIe4
Efficiency and service
quality
•Demonstrate convincingly project contribution by referring to
•KPIa5
•KPIb5
•KPIc5
•KPId5
•KPIe5
•KPIf5
Crossborder electricity markets
•Demonstrate convincingly project contribution by referring to
•KPIa6
•KPIb6
•KPIc6

12
Secondly, we remark that, in many instances, the comparison of different projects against a
certain KPI or criterion might not be straightforward, because of specific local conditions that
affect the outcome of the KPI calculation (e.g. different starting conditions of smartness of the
grid, different regulations, different climate hazards etc.).
The goal of this assessment framework is to identify Smart Grid projects that have a high impact
in a specific area. In doing so, one must take into account the starting conditions of that area,
while acknowledging that Smart Grids deployment should proceed at a similar pace in the
different Member States [EC 2011b], because large differences between national energy
infrastructures would prevent businesses and consumers from reaping the full benefits of Smart
Grids and would make trade and cooperation across national borders difficult. As smart grid is
not an end in itself but rather a means to an end, the proposed assessment framework aims at
rewarding those projects in Europe that contribute the most to improve local conditions with
smart solutions, whatever these conditions are at the outset.
KPIs influenced by developments beyond the control of project promoters
Finally, it is acknowledged that certain projects can create the conditions to improve some of
the KPIs but that actual improvement of the KPIs might also depend on external developments
beyond the control of project promoters (particularly DSOs and TSOs). In other words, it is
possible that in some cases a project might facilitate the improvement of a KPI rather than
actually actively improving it.
For example, the improvement of the KPI " Share of electricity generated from renewable
sources" might also depend on investments by external actors (e.g. generation companies
investing in renewable energy sources) or by regulatory and policy developments (e.g. incentive
schemes for DGs, approval and enforcement of connection codes).
In the KPI analysis, the contribution of projects in enabling the improvement of certain KPIs will
also be considered. However, project promoters shall (1) clearly demonstrate how their project
is enabling the future improvement of a KPI; (2) explain clearly which external developments
need to take place for an actual improvement of the KPI; (3) discuss how these external
developments might take place in the near future in the project area.
It is recommended to support these claims, as much as possible, with results from similar
projects or relevant pilot projects.

13
4 ECONOMIC VIABILITY - COST-BENEFIT ANALYSIS
As mentioned in the regulation proposal, project promoters shall demonstrate that the potential
project benefits outweigh the costs (see figure 2 and section B3 of ANNEX I).
Project promoters shall argue convincingly about the economic viability and cost-effectiveness
of the project, supporting their analysis as much as possible by monetary quantification of costs
and benefits (see section B3.1 of ANNEX I). Positive and negative externalities shall also be
included. It is necessary to perform a societal CBA, which goes beyond the costs and the benefits
incurred by the project promoter. Calculation assumptions shall be clearly and transparently
indicated.
Expected impacts (positive or negative) that cannot be reliably monetized (e.g. employment
impact, safety, social acceptance) can also be used to support the economic case of the project
(see section B3.2 of ANNEX I). Their appraisal should however be convincingly argued and
supported. The potential economic dimension of these impacts shall be convincingly discussed.
To be eligible for funding, moreover, project promoters shall clearly demonstrate the economic
viability of the project (from a societal point of view, including positive and negative
externalities) and the lack of commercial viability.
We recommend following the CBA guidelines defined in [EC 2012b4], offering a structured
evaluation of costs and benefits of different Smart Grid solutions, from the point of view of
society. However, if duly justified, project promoters can propose alternative quantification
formulas, provided that their rationale is clearly and convincingly illustrated.
Some of the benefits included in the CBA are expected to be directly related to the KPIs
presented in chapter 3 (e.g. level of losses, value of lost load etc.).
Any overlapping with the KPI-analysis should be clearly highlighted. In performing the economic
appraisal, the focus should be on the economic dimension of the impacts captured by the
proposed KPIs. For example, the project economic evaluation could include the monetary value
of reduced CO2 emissions, whereas the KPI analysis might just refer to the amount of CO2
reduction expressed in tons.
4 http://ses.jrc.ec.europa.eu/sites/ses/files/documents/guidelines_for_conducting_a_cost-
benefit_analysis_of_smart_grid_projects.pdf

14
Figure 2 Appraisal of the economic viability of the project (section B3 of ANNEX I)
4.1 Economic viability - Monetary appraisal
The economic analysis takes into account all costs and benefits that can be expressed in
monetary terms, considering a societal perspective.
The benefits of implementing any Smart Grid project will be measured against the Business as
Usual scenario.
As shown in figure 3, the proposed approach to CBA is composed of three main parts [EC 2012b]:
definition of boundary conditions (e.g. demand growth forecast, forecast of
supply side evolution, local grid characteristics, technological/engineering design)
identification of costs and benefits
sensitivity analysis of the CBA outcome to variations in key variables/parameters
(identification of switching values, volatility of benefits and costs, mitigation actions)
The goal of the economic analysis is to extract the range of parameter values enabling a positive
outcome of the CBA and define actions to keep these variables in that range. Output indicators
representing the CBA outcome include:
-Economic Net present value (ENPV): the difference between the discounted social benefits
and costs. It provides an indication of the profitability of the project.
Economic viability
(Benefits outweighing costs)
•Demonstrate convincingly project economic viability and cost-effectiveness in delivering the benefits associated with the six policy criteria, supporting the case with:
•CBA indicators (ENPV, EIRR etc.)
•Appraisal of non-monetary impacts (preferably expressed in physical units)

15
-Economic Internal rate of return (EIRR): the discount rate that produces a zero value for the
ENPV. It provides an indication of the quality of the investment.
-B/C ratio, i.e. the ratio between discounted economic benefits and costs. It provides an
indication of the efficiency of the project.
Figure 3 Cost-Benefit Analysis Framework
When conducting the CBA, it is also recommended to consider:
Benefits should represent those actually resulting from the project.
Benefits should be significant (meaningful impact), relevant to the analysis and
transparent in their quantification and monetization.
The individual benefit and cost variables should be mutually exclusive. In other words,
avoid including one type of benefit as part of another type of benefit.
The level of uncertainty associated to the benefit estimation should be clearly stated
and documented.
The beneficiaries (consumers, system operators, society, retailers etc.) associated with
each benefit should be identified, if possible with a quantitative estimation of the
corresponding share. In particular, we recommend performing a financial cost-benefit
analysis at least for consumers and for the actor(s) implementing the project in order to

16
evaluate the financial viability of the investment (e.g. this is important to assess whether
regulatory incentives are needed and appropriate)
Use shadow prices wherever possible
Make sure that transfers (including taxes) are not included in the analysis
We recommend using a social discount rate of 4% [EC 2009]
We recommend adopting a time horizon for the analysis of 20 years (the [EC 2008]
recommends a time horizon of 15 years for ICT projects and 25 years for energy
infrastructure projects)
We recommend using the carbon prices projected both in the Commission reference
and decarbonisation scenarios5.
4.2 CBA – Appraisal of non-monetary impacts
As mentioned, in building the case for the economic viability of their project, project promoters
can also provide a qualitative appraisal of other expected impacts that cannot be reliably
monetized and included in the CBA. The goal is to give decision makers the whole range of
elements for the evaluation of the project economic viability. We stress that the analysis of non-
monetary impacts of the project will be treated very cautiously, especially when the analysis
does not rely on quantitative indicators but on vague and subjective descriptive appraisals.
For this exercise, project promoters shall convincingly
(1) identify and express the expected non-monetary impacts (preferably) in physical terms or
through a well-argued descriptive analysis.
(2) demonstrate the economic relevance of these impacts for the project.
Some project impacts included in this analysis might be directly related to the criteria and KPIs
presented in chapter 3 (if they cannot be monetized and included directly in the CBA presented
in section 4.1). For example, the project economic evaluation could include a qualitative
appraisal of the economic impact of increased security of supply or of increased connectivity of
network users.
5 Annex 7.10 to Commission Staff Working Document SEC(2011) 288 final — ‘Impact Assessment’: http://eur-
lex.europa.eu/LexUriServ/LexUriServ.do?uri=SEC:2011:0288:FIN:EN:PDF

17
Other project impacts included in this exercise might not be directly related to the criteria and
KPIs but might still represent important social impacts, worth of being used to support the case
for the economic viability of the project. In ANNEX IV, we provide a (non-exhaustive) list of
project impacts that might be difficult to monetize and include in the CBA but that can however
be considered (preferably expressed in physical units) in the economic analysis.

18
5 SUMMARY – PROJECT PROPOSALS AND EVALUATION PROCESS
CONTENT OF PROJECT PROPOSALS
Figure 4 summarizes the three main inputs that need to be included in the project proposals for
project evaluation. To this end, project promoters shall duly fill in the submission forms
/templates presented in ANNEX I.
Project promoters shall argue convincingly about the project compliance with the technical
requirements, about the project contribution to policy objectives (KPI analysis) and about the
project economic viability. The argumentation shall be supported by all relevant technical
documentation, including quantifications in terms of KPIs and CBA.
Overlaps among the different assessment tools are possible. For example, environmental
impacts might be considered in the KPI-analysis (consider the ‘sustainability’ criteria) and in the
CBA (e.g. monetization of carbon costs). In presenting the expected impacts of their projects,
project promoters are required to transparently highlight where overlapping in their project
proposal might occur.
In summary, the project proposals shall include three main sections:
Compliance with technical requirements – Project promoters shall argue convincingly
for project compliance with the technical requirements presented in chapter 2. They
shall fill in detail the checklist of minimum technical requirement reported in section A3
of ANNEX I and provide all necessary supporting technical documentation.
Project contribution to policy objectives – Project promoters shall argue convincingly
for project contribution to each of the six policy criteria (please refer to sections B2.1 –
B2.6 of ANNEX I). The analysis of project performance against each criterion shall be
supported by a reference to the corresponding KPIs. A quantitative evaluation of KPIs
supported by clear exposition of performed analysis and calculation assumptions is
required. However; if duly justified, also qualitative evaluation of KPIs will also be
accepted. If a criterion or KPI is not relevant to the project, project promoters shall
clearly demonstrate why. In any case, the analysis shall be technically sound, detailed
and verifiable.

19
Project economic viability - Project promoters shall argue convincingly that the societal
benefits of the project outweigh its costs (please refer to sections B3 of ANNEX I). To
this end, the case for economic viability and cost-effectiveness of the project should be
supported as much as possible by a quantitative societal CBA and resulting economic
indicators (e.g. ENPV). A reasonable estimate of the costs and benefits of the project,
including positive and negative externalities, shall be carried out. The appraisal can also
include a qualitative appraisal (preferably expressed in physical units) of all the impacts
that cannot be reliably expressed in monetary terms. Project promoters shall include a
detailed description of the methodology and of the calculation assumptions they have
employed. Their proposed approach shall be technically sound, detailed and verifiable.
Any other analysis and/or documentation (e.g. results from related pilot projects etc.)
that may be used to support the case for the project.
The project proposal shall also include:
A project plan, specifying roles and responsibilities of the different participants and
highlighting, as a minimum, project key phases, milestones and interdependencies (e.g.
through the use of a Gantt chart)
An estimation of the necessary resources to complete the project on time and of the
allocation of the resources among the different project participants
The identification of the possible project risks and a description of the corresponding
risk mitigation strategies

20
Figure 4 Inputs to project assessment to be included in the project proposal
PROJECT ASSESSMENT
As indicated in the Regulation Proposal, project proposals will be evaluated by an expert panel
(Regional Group). Projects will be evaluated based on how they perform against the six criteria
(discussed in chapter 3) and on how cost-effectively they can deliver the benefits associated
with those criteria. The KPI-based analysis represents the core of the overall evaluation
framework and priority will be given to projects significantly contributing to the objectives of
Smart Grid implementation (see point 17 of the regulation recital and Article 4.2(c)). The
compliance with the technical requirements will be considered as a prerequisite for further
evaluation of the project proposal.
In the evaluation phase, a question arises over how to integrate the outcome of the KPI and of
the economic analysis and come up with an overall project evaluation. It is also important to
ensure that project proposals are evaluated against a common reference system.
To this aim, the ‘Analytic Hierarchy Process’ (AHP)6 (see [Kendrick et Saaty 2007, Kumar 2004]
for examples of application of this method to project evaluation), which is a widespread
analytical tool to organize and analyse complex decisions, could be used by the project
evaluators to combine projects' performances against the different criteria and according a
common reference system. This method is intended to assess different alternatives with regard
to multiple criteria. It enables the decision-maker to transparently implement weights as
6 http://composite-indicators.jrc.ec.europa.eu/S6_weighting.htm
Inputs to project
assessment
Technical compliance
(Checklist)
Contribution to policy criteria
(KPI-based analysis)
Economic viability
(Societal CBA)

21
opposed to arbitrarily assign them. ANNEX V and VI present the details of the AHP method and
illustrate a possible way to use it in the context of the assessment framework proposed in this
document.

22
REFERENCES
CEER (Council of European Energy Regulators), 2008. 4th Benchmarking Report on Quality of
Electricity Supply 2008. CEER Report. Ref: C08-EQS-24-04.
CEER (Council of European Energy Regulators), 2011. CEER status review of regulatory
approaches to smart electricity grids. CEER Report. Ref: C11-EQS-45-04.
Deuse J., Grenard S., Bollen M.H.J., 2008. “EU-DEEP integrated project – Technical Implications
of the “hosing-capacity” of the system for DER”, International Journal of Distributed Energy
Resources, vol. 4, no.1, pp. 17-34
Dupont B., Meeus L., Belmans R. (2010). Measuring the smartness of the Electricity grid.
Proceedings of the 7th International Conference on the European Energy Market (EEM), June
2010
ENTSOE, 2009. “System adequacy forecast 2010—2025”, ENTSOE Report, available from
https://www.entsoe.eu/fileadmin/user_upload/_library/publications/entsoe/outlookreports/SA
F_2010-2025_final.pdf
ERGEG (European Regulators Group for Electricity and Gas) (2010). Position Paper on Smart
Grids. An ERGEG Conclusions Paper, 10 June 2010.
European Commission, DG Regional Policy., 2008. “Guide to cost-benefit analysis of investment
projects”,– available at
http://ec.europa.eu/regional_policy/sources/docgener/guides/cost/guide2008_en.pdf
European Commission, 2009. “Commission Impact assessment guidelines”, available from
http://ec.europa.eu/governance/impact/commission_guidelines/commission_guidelines_en.ht
m
European Commission Task Force for Smart Grids, 2010. “Expert Group 1: Functionalities of
smart grid and smart meters”, available from
http://ec.europa.eu/energy/gas_electricity/smartgrids/doc/expert_group1.pdf
European Commission Task Force for Smart Grids, 2010. “Expert Group 2: Regulatory
Recommendations For Data Safety, Data Handling And Data Protection”, available from
http://ec.europa.eu/energy/gas_electricity/smartgrids/doc/expert_group2.pdf

23
European Commission Task Force for Smart Grids, 2010. “Expert Group 3: Roles and
responsibilities”, available from
http://ec.europa.eu/energy/gas_electricity/smartgrids/doc/expert_group3.pdf
European Commission, 2011. “Proposal for a regulation on guidelines for trans-European energy
infrastructure and repealing Decision No 1364/2006/EC”, available from http://eur-
lex.europa.eu/LexUriServ/LexUriServ.do?uri=COM:2011:0658:FIN:EN:PDF
European Commission, 2011. “Smart Grids: From Innovation to Deployment”, Communication
from the Commission to the European Parliament, the Council, the European Economic and
Social Committee and the Committee of the Regions, available from: http://eur-
lex.europa.eu/LexUriServ/LexUriServ.do?uri=COM:2011:0202:FIN:EN:PDF
European Commission, 2011. “Smart Grid projects in Europe: lessons learned and current
developments”, Joint Research Centre Reference Report, available from
http://ses.jrc.ec.europa.eu/
European Commission, 2012. “European task force for the implementation of Smart Grids into
the European internal market. Mission and work programme” -
http://ec.europa.eu/energy/gas_electricity/smartgrids/doc/mission_and_workprogramme.pdf
European Commission, 2012. “Guidelines for conducting cost-benefit analysis of Smart Grid
projects”, Reference Report - Joint Research Centre, Institute for Energy and Transport, available
from http://ses.jrc.ec.europa.eu/
European Union, 2009. Directive 2009/72/EC 13 July 2009 concerning common rules for the
internal market in electricity and repealing Directive 2003/54/EC, available from http://eur-
lex.europa.eu/LexUriServ/LexUriServ.do?uri=CELEX:32009L0072:EN:NOT
European Union (2009). Directive 2009/72/EC 13 July 2009 concerning common rules for the
internal market in electricity and repealing Directive 2003/54/EC, available from http://eur-
lex.europa.eu/LexUriServ/LexUriServ.do?uri=CELEX:32009L0072:EN:NOT
KEMA (2009). Smart Grid Evaluation Metrics, prepared for the GridWise Alliance.

24
Kumar S. 2004. AHP-based formal system for R&D project evaluation, Journal of Scientific &
Industrial Research, vol.63, pp. 888-896.
Kendrick J., Saaty D., 2007. Use analytic hierarchy process for project selection. Six sigma forum
magazine, August 2007
Lo Schiavo L., Delfanti M., Fumagalli E., Olivieri V., 2011. “Changing the regulation for regulating
the change Innovation‐driven regulatory developments in Italy: smart grids, smart metering and
e‐mobility”. Working paper 46, IEFE ‐ The Center for Research on Energy and Environmental
Economics and Policy at Bocconi University, available from
http://www.iefe.unibocconi.it/wps/wcm/connect/Centro_IEFEen/Home/Working+Papers/WP_
46_CdR_iefe
Miller, J. (2008). Smart Grid Metrics: Monitoring Our Progress, presented at the Smart Grid
Implementation Workshop (June 19 2008).
Office of Electricity Delivery and Energy Reliability (2008). Metrics for Measuring Progress
Toward Implementation of the Smart Grid, results of the breakout session discussions at the
Smart Grid Implementation Workshop, June 18-19 2008, Washington, DC. Prepared by
Energetics, Inc., July 31, 2008.
Saaty T., 2008. Decision making with the analytic hierarchy process. International Journal of
Services Sciences, Vol. 1, No. 1, 2008, available from
http://colorado.edu/geography/leyk/geog_5113/readings/saaty_2008.pdf
T&D Europe and University of Genoa, 2009. Study on Criteria for the Quantification of how
modern T&D-systems help accomplish the EU 20/20/20 targets, available from
Tsoutsos T., Tsouchlaraki A., Tsiropoulos M. , Serpetsidakis M., 2009. Visual impact evaluation
of a wind park in a Greek island, Applied Energy Journal vol. 86, pp. 546-553
UCTE, 2009. “System adequacy methodology”, UCTE Report, available from
https://www.entsoe.eu/fileadmin/user_upload/_library/publications/ce/UCTE_System_Adequa
cy_Methodology.pdf
UNEP (United Nations Environment Program) (2009). Supplemental Cost-Benefit Economic
Analysis Guide, (7 July 2009). Available at www.chem.unep.ch. Accessed in October 2011.

25
Wolsink M., 2012. “The research agenda on social acceptance of distributed generation in smart
grids: Renewable as common pool resources, Renewable and Sustainable Energy Reviews,
Volume 16, Issue 1, Pages 822–835
26
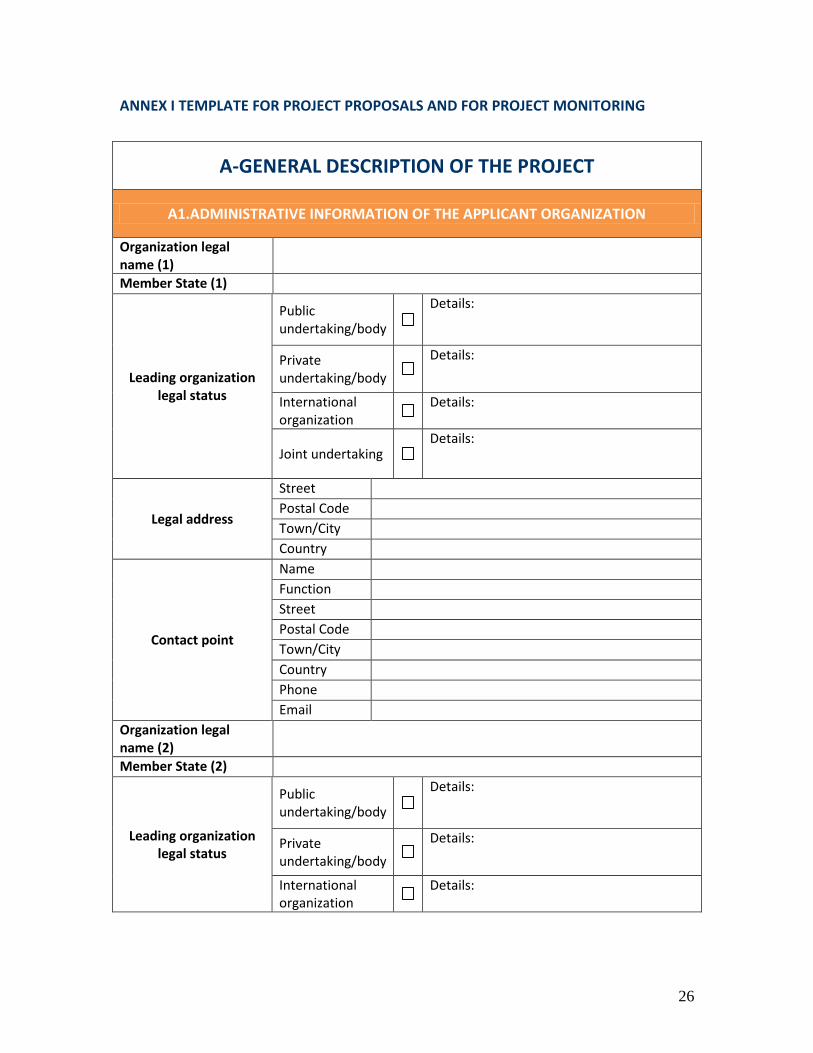
ANNEX I TEMPLATE FOR PROJECT PROPOSALS AND FOR PROJECT MONITORING
A-GENERAL DESCRIPTION OF THE PROJECT
A1.ADMINISTRATIVE INFORMATION OF THE APPLICANT ORGANIZATION
Organization legal name (1)
Member State (1)
Leading organization legal status
Public undertaking/body
Details:
Private undertaking/body
Details:
International organization
Details:
Joint undertaking Details:
Legal address
Street Postal Code Town/City Country
Contact point
Name Function Street Postal Code Town/City Country Phone Email
Organization legal name (2)
Member State (2)
Leading organization legal status
Public undertaking/body
Details:
Private undertaking/body
Details:
International organization
Details:

27
Joint undertaking Details:
Legal address
Street Postal Code Town/City Country
Contact point
Name Function Street Postal Code Town/City Country Phone Email
A2. PROJECT GENERAL INFORMATION
Project name Location/s of the physical implementation,
specifying Member States (please provide also a
map showing the grid under consideration, the
consumption and generation areas and the
main power flows)
Project Website Name of leading organization(s) Name and email address of technical contact point(s)
Other Participants (Names, Countries and Organization Type)
Please provide an executive summary of the project (including main goals, participants and
responsibilities, cross-border dimension, technical characteristics and expected impacts):
Please describe main needs addressed by the project:
Please describe in detail the expected cross-border impact of the project:

28
Please provide a project plan (including a graphic tool, e.g. Gantt chart), specifying roles and
responsibilities of the different participants and highlighting, as a minimum, main project
phases, milestones and interdependencies:
Please provide an estimation of the necessary resources to complete the project on time and of
the allocation of the resources among the different project participants:
Please describe any major element of complexity of the project:
Please illustrate possible project risks and a description of the corresponding risk mitigation
strategies:
Please describe briefly the main results of previous feasibility studies, pilot projects and/or
technical studies undertaken for the project:
Has the project already received monetary support at National or European level? If yes please
specify (e.g. support through tariffs or public funding etc.):
A3. COMPLIANCE WITH TECHNICAL REQUIREMENTS
Please describe in detail the technical characteristics of the project and of the portion of the grid
impacted by the project (please provide any relevant technical documentation):
Please demonstrate clearly the "Smart Grid dimension" of the proposed project (i.e. clarifying
why the proposed project can be considered a Smart Grid project) and provide details of the

29
Smart Grid features that will be implemented:
Please provide a summary of the project compliance with the technical requirements specified
in the regulation proposal:
For each of the technical requirements reported below, please provide the corresponding
project value and discuss in detail project compliance:
Criteria Reference
value Analysis of project compliance
Project value (synthetic outcome of analysis of project
compliance)
Voltage level(s) (kV):
>10kV
Number of users involved
(producers, consumers
and prosumers):
>100000
Consumption level in the
project area (MWh/year):
300GWh/year
% of energy supplied by
non-Dispatchable resources (in
terms of capacity)
>20%
Projects involving
transmission and
distribution operators
from at least two MS
-

30
B-IMPACT OF THE PROJECT
B1. OVERVIEW OF EXPECTED PROJECT IMPACT Please describe expected impacts on the project region and on neighbouring regions:
B2. PROJECT PERFORMANCE AGAINST SIX POLICY CRITERIA Please provide an overview of the project performance against the six policy criteria (detailed below)
B2.1 – PROJECT PERFORMANCE AGAINST CRITERION 1 –LEVEL OF SUSTAINABILITY
Please demonstrate convincingly project contribution to this criterion, referring to the KPIs reported below:
KPI Estimated KPI value and calculation assumptions
Reduction of greenhouse gas emissions
Environmental impact of electricity grid infrastructure
B2.2 – PROJECT PERFORMANCE AGAINST CRITERION 2 –CAPACITY OF TRANSMISSION AND DISTRIBUTION GRIDS TO CONNECT AND BRING ELECTRICITY FROM AND TO USERS
Please demonstrate convincingly project contribution to this criterion, referring to the KPIs reported below:
KPI Estimated KPI value and calculation assumptions
Installed capacity of distributed energy
resources in distribution networks
Allowable maximum injection of power without
congestion risks in transmission networks
Energy not withdrawn from renewable sources
due to congestion or security risks

31
B2.3 – PROJECT PERFORMANCE AGAINST CRITERION 3 – NETWORK CONNECTIVITY AND ACCESS TO ALL CATEGORIES OF NETWORK USERS
Please demonstrate convincingly project contribution to this criterion, referring to the KPIs reported below:
KPI Estimated KPI value and calculation assumptions
Methods adopted to calculate charges and tariffs, as well as their
structure, for generators, consumers and those that
do both
Operational flexibility for dynamic balancing of
electricity in the network
B2.4 – PROJECT PERFORMANCE AGAINST CRITERION 4 – SECURITY AND QUALITY OF SUPPLY
Please demonstrate convincingly project contribution to this criterion, referring to the KPIs reported below:
KPI Estimated KPI value and calculation assumptions
Ratio of reliably available generation capacity and
peak demand
Share of electricity generated from renewable
sources
Stability of the electricity system
Duration and frequency of interruptions per
customer, including climate related disruptions
Voltage quality performance
B2.5 – PROJECT PERFORMANCE AGAINST CRITERION 5 – EFFICIENCY AND SERVICE QUALITY IN ELECTRICITY SUPPLY AND GRID
Please demonstrate convincingly project contribution to this criterion, referring to the KPIs reported below:
KPI Estimated KPI value and calculation assumptions
Level of losses in

32
transmission and in distribution networks
Ratio between minimum and maximum electricity demand within a defined
time period
Demand side participation in electricity markets and
in energy efficiency measures
Percentage utilisation (i.e. average loading) of electricity network
components
Availability of network components (related to planned and unplanned
maintenance) and its impact on network
performances
Actual availability of network capacity with respect to its standard
value
B2.6 – PROJECT PERFORMANCE AGAINST CRITERION 6 – CONTRIBUTION TO CROSS-BORDER ELECTRICITY MARKETS BY LOAD-FLOW CONTROL TO ALLEVIATE LOOP-FLOWS AND INCREASE
INTERCONNECTION CAPACITIES Please demonstrate convincingly project contribution to this criterion, referring to the KPIs reported below:
KPI Estimated KPI value and calculation assumptions
Ratio between interconnection capacity
of a Member State and its electricity demand
Exploitation of interconnection capacities
Congestion rents across interconnections

33
B3. ECONOMIC APPRAISAL
Please demonstrate convincingly that benefits provided by the project outweigh their costs. The case for the economic viability and cost-effectiveness of the project should be supported as much as possible by (1) a quantitative societal CBA and resulting economic indicators (e.g. ENPV) and by (2) a qualitative appraisal (preferably expressed in physical units) of all the impacts that cannot be reliably expressed in monetary terms.
B3.1 SOCIETAL CBA
ASSUMPTIONS
VARIABLE VALUE RATIONALE FOR VALUE CHOICE
Demand growth
Discount rate
Time horizon
Other
Is the choice of the discount rate consistent with the Commission’s or Member States’ own guidance? If
not, why?
Is the choice of the time horizon consistent with the recommended value? If not, why?
ESTIMATED BENEFITS
BENEFIT VALUE ESTIMATION APPROACH
ESTIMATED COSTS (CAPEX and OPEX)
COST VALUE ESTIMATION APPROACH VALUE ESTIMATION APPROACH
CAPEX
OPEX

34
SENSITIVITY ANALYSIS
Please describe the assumptions and critical variables considered in the sensitivity analysis: Please provide CBA outcome (NPV and IRR) and provide the range of values of critical variables leading to a positive CBA outcome :
Please provide the switching values of critical variables and foreseen control/mitigation actions to keep critical variables under control and reduce CBA uncertainty:
B3.2 - APPRAISAL OF NON-MONETARY IMPACTS (see ANNEX IV)
Please provide a detailed appraisal of expected (positive and negative) impacts that cannot be monetized and included in the CBA. Preferably physical units shall be used. Qualitative descriptions of impacts could also be used but shall be convincingly supported.
Non-monetary impact Estimation in physical units and/or description of expected impact

35
ANNEX II PROPOSED CALCULATION OPTIONS FOR KPIS MENTIONED IN THE REGULATION PROPOSAL
This ANNEX proposes ways to translate the key performance indicators put forward in the
regulation proposal into computable metrics. It shall facilitate the preparation of project
proposals by project promoters. However, project promoters can, if duly justified, propose other
evaluation methods for the requested KPIs.
In following proposed calculation guidelines, we recommend to:
Clearly define the particular local conditions (technical, regulatory) that affect the KPI
calculation
Clearly highlight the assumptions made in the calculation, the method of calculating the
KPIs (e.g. details over the simulation model employed) and the grid boundary conditions
considered in the analysis.
Clearly illustrate how, in the design of the project, it has been foreseen a way to collect
the data that are necessary to calculate the KPI in ex-post evaluation in the SG scenario.
If field data for the evaluation of a KPI cannot be collected, please provide reasons and
describe how this affects the KPI analysis.
When using results from Smart Grid pilots to support assumptions in the calculation of
KPIs, highlight clearly why the results are relevant and how they can be extended to the
deployment project under consideration.
In those cases where the project is simply enabling the improvement of a KPI, highlight
clearly the external developments (i.e. developments that are beyond the control of the
project promoters) that need to occur to actually improve that KPI.
1. LEVEL OF SUSTAINABILITY
a) Reduction of greenhouse gas emissions (GHG)
The quantification of this KPI requires the identification of all possible means of GHGs reduction
(including CO2 reduction) brought by the project, like:
-reduction due to reduced energy losses
-reduction due to energy savings
-reduction due to peak load reduction and displacement of fossil-based peak generation
36
- reduction due to higher integration of renewables with consequent displacement of fossil-
based generation
Clearly, it is important to avoid overlapping with benefits in terms of CO2 reduction included in
the CBA analysis.
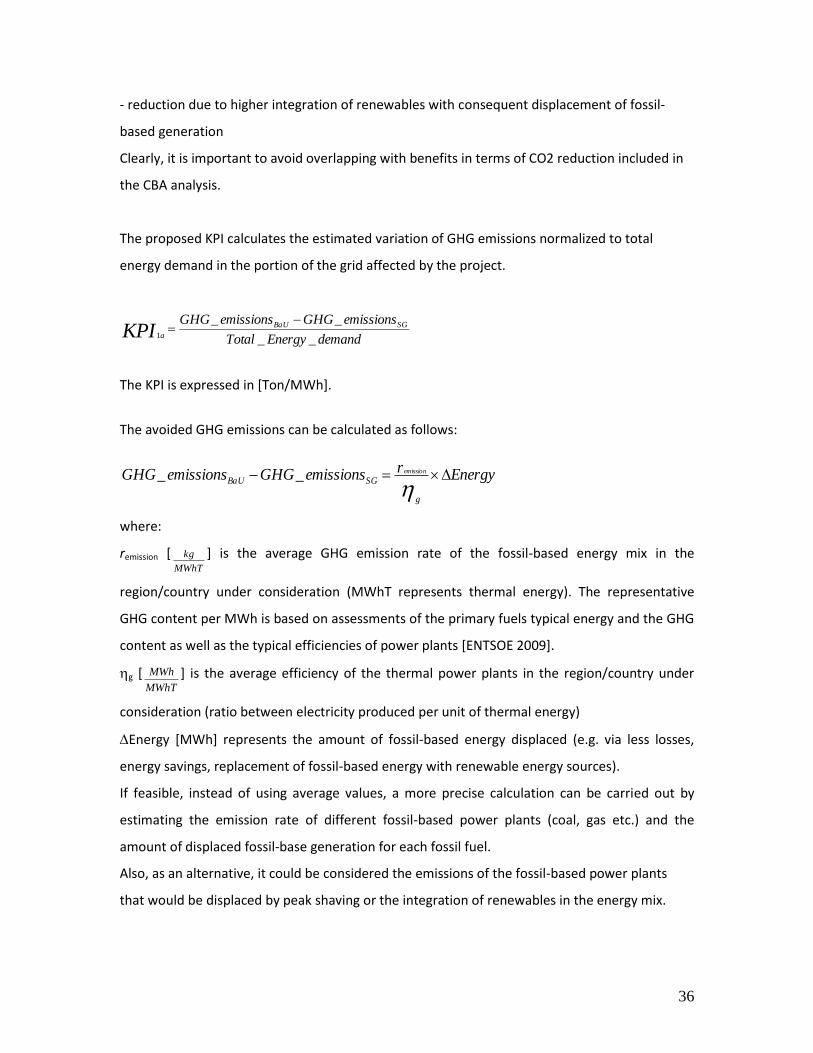
The proposed KPI calculates the estimated variation of GHG emissions normalized to total
energy demand in the portion of the grid affected by the project.
demandEnergyTotal
emissionsGHGemissionsGHG SGBaU
aKPI__
__1
The KPI is expressed in [Ton/MWh].
The avoided GHG emissions can be calculated as follows:
EnergyremissionsGHGemissionsGHG
g
SGBaUemission
__
where:
remission [MWhT
kg ] is the average GHG emission rate of the fossil-based energy mix in the
region/country under consideration (MWhT represents thermal energy). The representative
GHG content per MWh is based on assessments of the primary fuels typical energy and the GHG
content as well as the typical efficiencies of power plants [ENTSOE 2009].
g [MWhT
MWh ] is the average efficiency of the thermal power plants in the region/country under
consideration (ratio between electricity produced per unit of thermal energy)
Energy [MWh] represents the amount of fossil-based energy displaced (e.g. via less losses,
energy savings, replacement of fossil-based energy with renewable energy sources).
If feasible, instead of using average values, a more precise calculation can be carried out by
estimating the emission rate of different fossil-based power plants (coal, gas etc.) and the
amount of displaced fossil-base generation for each fossil fuel.
Also, as an alternative, it could be considered the emissions of the fossil-based power plants
that would be displaced by peak shaving or the integration of renewables in the energy mix.

37
b) Environmental impact of electricity grid infrastructure
For the appraisal of the environmental viability of a Smart Grid project, we need to consider all
environmental impacts that have not already been included in the KPI-analysis (under criteria
‘level of sustainability’) and in the CBA (e.g. monetization of CO2 costs or of noise reduction).
The environmental impact of Smart Grid projects should be evaluated against the “BaU”
scenario, as in other typical licensing procedures for works of public interest. The policy goal of
including an environmental evaluation of projects is, in fact, to preserve as much as possible the
environment as it is before any intervention, or, if possible, to ameliorate it.
If numerical indicators cannot be calculated (e.g. decibel for sound level), the project appraisal
might include a detailed well-argued description of the expected (positive or negative) impacts.
In the following we report a non-exhaustive list of possible areas of environmental impact that,
wherever relevant, should be considered and assessed:
Any anticipated or observed direct or indirect effects of the project on soil, water, air,
climate
Land use and landscape change (e.g. square meters per peak capacity of PV farm)
Visual impact
Emissions of air pollutants (except GHG, already included in the CBA and in the KPI analysis)
and releases of toxic substances (e.g. heavy metals)
Acoustic impact (e.g. decibel from wind farms per installed capacity)
Electro-magnetic impact

38
2. CAPACITY OF TRANSMISSION AND DISTRIBUTION GRIDS TO CONNECT AND BRING
ELECTRICITY FROM AND TO USERS
a) Installed capacity of distributed energy resources in distribution networks
This KPI is intended to capture the amount of additional capacity of distributed energy resources
that can be safely integrated in the distribution grid thanks to the Smart Grid project.
As explained in [CEER 2011], ‘the hosting capacity is the amount of electricity production that
can be connected to the distribution network without endangering the voltage quality and
reliability for other grid users’.
The calculation of this indicator might depend on specific national regulations (e.g. technical and
economic conditions of curtailment of power/generation during periods of overproduction). It is
recommended to clearly express the local conditions affecting the calculation of this KPI.
The contribution of a Smart Grid project to integrate DERs can be assessed by estimating, over a
defined period of time (e.g. a year), the increase of DER energy injected in the distribution grid
in safe conditions as a result of the Smart Grid implementation (e.g. through active management
of distribution networks: control of transformer taps, innovative voltage regulation algorithms,
reactive power management, innovative grid protection/monitoring etc.).
total
BaUSG
a E
EIEIKPI
2
Where
EISG is the DER energy input (over a defined period of time, e.g. yearly) that can be integrated in
safe conditions in the portion of the distribution grid under consideration in the SG scenario
[MWh];
EIBaU is the DER energy input (over a defined period of time, e.g. yearly) that can be integrated in
safe conditions in the portion of the distribution grid under consideration in the BaU scenario
[MWh];
Etotal is the total energy consumption in the portion of the grid under consideration and is used
as a normalization factor to keep into account the size of the project.
The installed DER capacity is affected by the short circuit level increase of the line, the voltage
stability and the nominal current before and after the new installation. The protection (electrical)
of the equipment is always taken in to account. Most of these values can be calculated by a

39
power flow and short circuit analysis. Calculation hypothesis should be clearly explained and
documented.
As highlighted in [Lo Schiavo 2011], both EISG and EIBaU should be calculated with respect to the
network structure, according to the Hosting Capacity approach discussed in [Deuse et al. 2008],
regardless of the DG units actually connected to the network before and after the project. In this
sense, this KPI can be calculated referring to the hosting capacity in the SG and BaU scenarios.
We remark that the contribution of DERs in terms of energy should be assessed cautiously and
in accordance to local conditions. In fact, distributed energy resources can positively contribute
to the system operations also by providing ancillary services, which in some cases can result in
less energy generated. If that's the case, project promoters can include this analysis in their
evaluation of this KPI.
b) Allowable maximum injection of power without congestion risks in transmission networks
As specified in [CEER 2011], ‘this index can be considered as the transmission system equivalent
of the hosting capacity. It can also be seen as the net transfer capacity from a (hypothetical)
production unit to the rest of the grid. The condition “without congestion risks” should be
interpreted as obeying the prescribed rules on operational security’.
This indicator can be calculated on an hourly basis, considering the actual availability of network
components and the actual power flows through the network. This would result in an indicator
whose value changes with time.
We recommend that the indicator be calculated as a fixed value under pre-defined worst-case
power flows and a pre-defined outage level (e.g. n-1). The resulting value would give the largest
size of production unit that can be connected without risking curtailment [CEER 2011].
100maxmax
2
P
PiPiKPI
ref
BaUSG
b
Where Pimax represents the largest size of production unit that can be connected without risking
curtailment in the pre-defined worst case scenario[MW].
Pref is the power load in the grid under consideration in the pre-defined worst-case scenario (it is
assumed constant before and after the project) [MW].
The choice of Pref as normalisation factor is intended to reward projects having, for the same
power load, a higher increase of the allowable maximum injection of power in absolute terms.

40
c) Energy not withdrawn from renewable sources due to congestion or security risks
“This indicator quantifies the ability of the network to host renewable electricity production. In
that sense, it is similar to indicators like hosting capacity and allowable maximum injection of
power. But whereas the latter two indicators only quantify the actual limits posed by the
network, the energy not withdrawn quantifies to which extent the limits are exceeded” [CEER
2011].
This impact could be captured by estimating the percentage variation of RES energy curtailed as
a result of the Smart Grid implementation.
tot2 E_RES
____ SGBaU
c
curtailedRESEcurtailedRESEKPI
Where
E_RES_curtailedSG is the RES energy curtailed (over a defined period of time, e.g. yearly) in the
SG scenario [MWh];
E_RES_curtailedBaU is the RES energy curtailed (over a defined period of time, e.g. yearly) in the
BaU scenario [MWh];
E_REStot is the total RES energy generated (over a defined period of time, e.g. yearly), assuming
no variations between the BaU and SG scenario [MWh];
Etotal is the total energy consumed in the grid under consideration in the defined period (it is
assumed constant before and after the project) [MWh]. The calculation is done in the
hypothesis that the same boundary conditions (e.g. load profile, generation mix, RES profile etc.)
apply for both the BaU and in the SG scenarios.
If a reliable estimation of the total RES energy generated in the BaU and SG scenarios is possible,
then the KPI could also be expressed as
SG
SG
BaU
BaU
c RESE
curtailedRESE
RESE
curtailedRESEKPI _
__
_
__2
E_RESSG is the total RES energy generated (over a defined period of time, e.g. yearly) in the SG
scenario [MWh];
E_RESBaU is the total RES energy generated (over a defined period of time, e.g. yearly) in the BaU
scenario [MWh];
In this way, the higher the total RES energy enabled by the SG projects (in the SG scenario), the
more emphasized is an improvement in the reduction of E_RES_curtailedSG

41
The proposed KPI formulations are intended to capture the contribution of Smart Grids to
reduce the instances where shedding of RES takes place. However, there might be cases where
shedding of intermittent energy sources can provide substantial benefits in terms of network
security and investment reduction and is in fact the best strategy to pursue. If, depending on
local circumstance, the RES energy not withdrawn in those instances is not the same in both the
BaU and the SG scenarios, then the KPI calculation should be accordingly corrected.

42
3. NETWORK CONNECTIVITY AND ACCESS TO ALL CATEGORIES OF NETWORK USERS
a) Methods adopted to calculate charges and tariffs, as well as their structure, for generators,
consumers and those that do both
The implementation of Smart Grids provides a granular array of information that can be used by
regulators to better allocate the costs of the electricity system among different users.
This KPI could be expressed qualitatively by listing the new information that can be measured
and collected and by highlighting how this information can be used in defining more accurate
methods of allocating costs.
b) Operational flexibility provided for dynamic balancing of electricity in the network
A possible metric for this KPI is:
1003
P
PPKPI
Peak
BaUSG
b
dispdisp
Where PdispSG is the capacity of dispatchable resources (generation, storage and controllable
loads) connected to the grid under consideration in the SG scenario
PdispBaU is the capacity of dispatchable resources (generation, storage and controllable loads)
connected to the grid under consideration in the BaU scenario
Both PdispSG and PdispBaU should be corrected using a suitable simultaneity factor, taking into
account that not all dispatchable resources can be operated at the same time.
PPeak represent the average electricity demand in the BaU over the predefined period of time.
Other possible options for the quantification of the KPI include:
- comparing the needs in operating reserves before and after the project deployment
-Extent to which storage and DG are able to provide ancillary services as a percentage of the
total offered ancillary services [Dupont et al. 2010]
-Percentage of storage and DG that can be modified vs. total storage and DG [MW/MW]
[Dupont et al. 2010]

43
4. SECURITY AND QUALITY OF SUPPLY
a) Ratio of reliably available generation capacity and peak demand
The Reliably Available Capacity (RAC) on a power system is the difference between Net
Generating Capacity and Unavailable Capacity [UCTE, 2009].
Net Generating Capacity of a power station is the maximum electrical net active power it
can produce continuously throughout a long period of operation in normal conditions,
where [UCTE, 2009]:
¨ "net" means the difference between, on the one hand, the gross generating capacity
of the alternator(s) and, on the other hand, the auxiliary equipments’ load and the
losses in the main transformers of the power station;
¨ for thermal plants “normal conditions” means average external conditions (weather,
climate…) and full availability of fuels;
¨ for hydro and wind units, “normal conditions” refer to the usual maximum
availability of primary energies, i.e. optimum water or wind conditions.
Unavailable Capacity is the part of Net Generating Capacity that is not reliably available to
power plant operators due to limitations of the output power of power plants [ENTSOE,
2009].
The Reliably Available Capacity is the part of Net Generating Capacity actually available to cover
the load at a reference point [UCTE, 2009].
Let us consider, as reference point, the peak load point over a predefined period of time (for
example over a year). The ratio between the reliably available generation capacity and the peak
demand (Ppeak) is representative of the system adequacy. The KPI could then be expressed as a
percentage variation of this ratio in the BaU and in the SG scenarios.
1004
BaUpeak
BaUpeakSGpeak
a
P
RAC
P
RAC
P
RAC
KPI

44
b) Share of electricity generated from renewable sources
This KPI can be quantified in terms of percentage variation of the share of electricity generated
from renewable sources7 that can be safely integrated in the system in the SG and in the BaU
scenarios (over a defined period of time, e.g. over a year), assuming the same total amount of
electricity generated in both scenarios:
total
4 E
__ RESERESEKPI
BaUSG
b
Where
E_RESSG and E_RESRES represent the amount of electricity generated from renewable sources in
the SG and in the BaU scenarios.
Etotal is the total energy consumption in the distribution grid under consideration in the defined
period (it is assumed constant before and after the project) [MWh].
The calculation of RES energy requires the estimation of the installed capacity [MW] and of the
equivalent running hours of the different types of RES units considered [h/yr] (see e.g. [ENTSOE
2009]). We recommend highlighting clearly and transparently how the estimation has been
carried out.
c) Stability of the electricity system
A preliminary analysis would identify whether the implementation of the Smart Grid project
is able to remove the cause of possible system instabilities (typically in terms of voltage and
frequencies) that were observed in the portion of the grid under consideration. The analysis
could be conducted by defining contingency scenarios where the stability of the system is put
under stress.
d) Duration and frequency of interruptions per customer, including climate related disruptions
This KPI is expressed by calculating the variations of reliability indexes in the Smart Grid and in
the BaU scenario.
We recommend considering the following reliability indexes:
7 As indicated in Directive 2003/54/EC , ‘renewable energy sources' means renewable non-fossil
energy sources (wind, solar, geothermal, wave, tidal, hydropower, biomass, landfill gas, sewage treatment plant gas and biogases);

45
SAIDI is the System Average Interruption Duration Index [min] and represents the average
outage duration for each customer served
-SAIFI is the System Average Interruption Frequency Index [units of interruptions per
customer] and represents the average number of interruptions that a customer would
experience.
The corresponding KPIs are:
1001
4
SAIDISAIDISAIDI
KPIBaU
SGBaU
d
1002
4
SAIFISAIFISAIFI
KPIBaU
SGBaU
d
e)Voltage quality performance
The impact of the Smart Grid project on voltage quality performance can be assessed keeping
track of short interruptions, voltage dips, flicker, supply voltage variation and harmonic
distortions .
As mentioned in [CEER 2008], it is useful to group the different voltage disturbances mentioned
above into continuous phenomena and voltage events. For each quality parameter to be
regulated, it is important that it can be observed, quantified and verified.
Continuous phenomena are voltage variations that occur continuously over time.
Continuous phenomena are mainly due to load pattern, changes of load or nonlinear loads.
They occur continuously over time and can often be satisfactorily monitored during
measurement over a limited period of time, e.g. 1 week.
Voltage events are sudden and significant deviations from normal or desired wave shape or
RMS value. Voltage events are typically due to unpredictable events (e.g. faults) or to
external causes. Normally voltage events occur only once in a while. To be able to measure
voltage events, continuous monitoring and the use of predefined trigger values are
necessary.
In order to assess the impact of the Smart Grid project over voltage quality performance, we
recommend calculating the variation in the SG and BaU scenarios of:

46
1) Voltage line violations (over a predefined period of time, e.g. yearly), defined in accordance
with the EN 50160 standard. The resulting KPI could be expressed in terms of number of voltage
line violations over a predefined period of time:
BaU
SGBaU
e violationsVoltage
violationsVoltageviolationsVoltageKPI _
__1
4
If feasible, the duration of voltage line violations in the BaU and SG scenarios can also be
considered in this analysis.
Violations are calculated with reference to the following requirements:
-Variations in the stationary voltage RMS value are within an interval of +/-10% of the nominal
voltage (in steady state)
-Number of micro-interruptions, sages and surges, assessing the number of events (MV-LV
violations) recorded over a given time period (one year for example). Dips and surges are
recorded when the voltage exceeds the threshold of +/-10% of its nominal value (in transient
state).
2) Total harmonic distortion factor (THD).
The THD can be measured as defined in EN 50160. The KPI could be expressed as the percentage
variation between the BaU and the SG scenarios.
BaU
SGBaU
e THD
THDTHDKPI
2
4
5. EFFICIENCY AND SERVICE QUALITY IN ELECTRICITY SUPPLY AND GRID OPERATION
a) Level of losses in transmission and in distribution networks
This KPI is expressed as:
1005
E
ELELKPI
tot
SGBaU
b
Where ELBaU represent the yearly level of energy losses [MWh] in the portion of the grid under
consideration in the BaU scenario;
ELSG represent the yearly level of energy losses [MWh] in the portion of the grid under
consideration in the SG scenario;

47
Etot represents the total yearly energy consumption in the portion of the grid under
consideration [MWh]. For sake of simplicity, it is assumed to be the same in the BaU and SG
scenarios.
Project promoters should also highlight which local structural parameters (e.g. the presence of
distributed generation in distribution grids and its production pattern) are affecting the value of
the KPI. It is possible that energy losses might actually increase in the SG scenario due to higher
penetration of DER. For example, if applicable, project promoters could analyse the ratio
between energy losses and the amount of energy injected from DER in the SG and BaU scenarios
and highlight that, even if the absolute value of losses has increased, a relative improvement
with respect to the amount of injected DER energy is observed.
b) Ratio between minimum and maximum electricity demand within a defined time period
The KPI should calculate the variation in the ratio between minimum (Pmin) and maximum (Pmax)
electricity demand (within a defined time period, e.g. one day, one week) as a consequence of
the implementation of the project
100
max
min
max
min
max
min
5
BaU
BaUSG
b
PP
PP
PP
KPI
Or alternatively:
BaU
Peak
SGBaU
b P
PPKPI
5
Where PBaU represents the difference between minimum and maximum electricity demand
(within a predefined period of time, e.g. one week or one year) in the BaU scenario,
PSG represents the difference between minimum and maximum electricity demand (within a
predefined period of time, e.g. one week or one year) in the SG scenario,
PPeak represents the peak electricity demand in the BaU over the predefined period of time.
The choice of PPeak as normalisation factor is intended to reward projects for which the reduction
between minimum and maximum electricity demand represents a higher share of the peak
power load in the BaU.
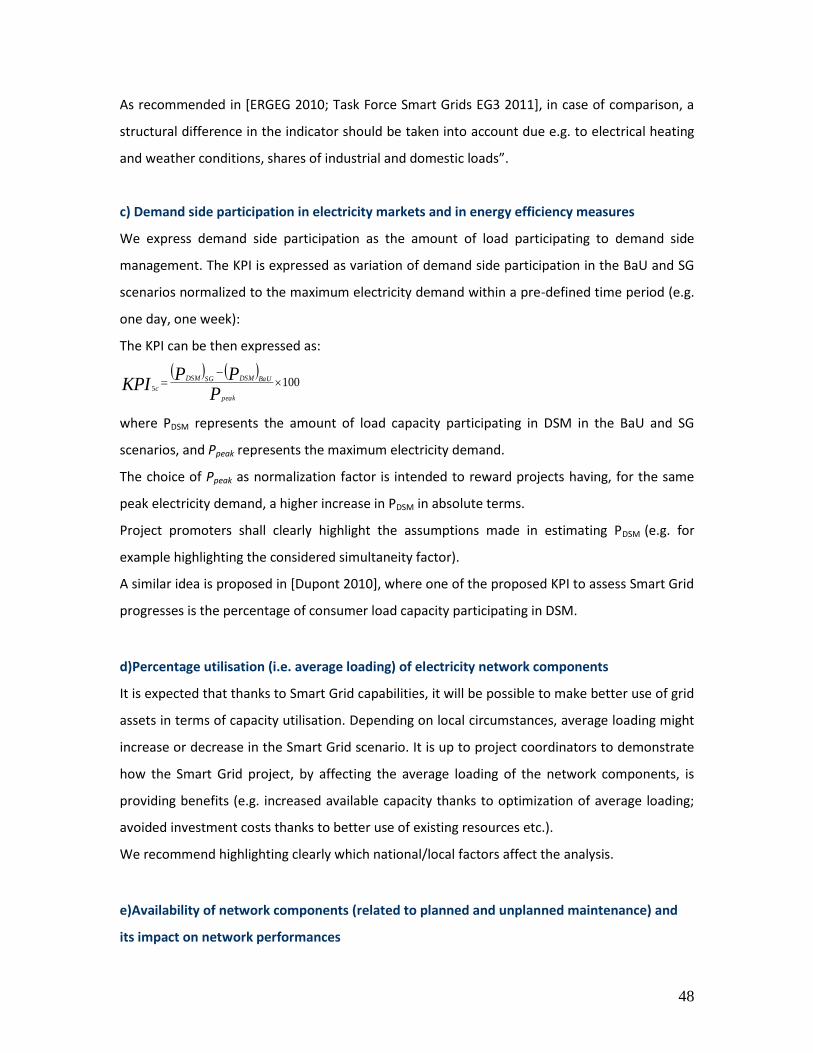
48
As recommended in [ERGEG 2010; Task Force Smart Grids EG3 2011], in case of comparison, a
structural difference in the indicator should be taken into account due e.g. to electrical heating
and weather conditions, shares of industrial and domestic loads”.
c) Demand side participation in electricity markets and in energy efficiency measures
We express demand side participation as the amount of load participating to demand side
management. The KPI is expressed as variation of demand side participation in the BaU and SG
scenarios normalized to the maximum electricity demand within a pre-defined time period (e.g.
one day, one week):
The KPI can be then expressed as:
100
5
PPP
KPIpeak
BaUDSMSGDSM
c
where PDSM represents the amount of load capacity participating in DSM in the BaU and SG
scenarios, and Ppeak represents the maximum electricity demand.
The choice of Ppeak as normalization factor is intended to reward projects having, for the same
peak electricity demand, a higher increase in PDSM in absolute terms.
Project promoters shall clearly highlight the assumptions made in estimating PDSM (e.g. for
example highlighting the considered simultaneity factor).
A similar idea is proposed in [Dupont 2010], where one of the proposed KPI to assess Smart Grid
progresses is the percentage of consumer load capacity participating in DSM.
d)Percentage utilisation (i.e. average loading) of electricity network components
It is expected that thanks to Smart Grid capabilities, it will be possible to make better use of grid
assets in terms of capacity utilisation. Depending on local circumstances, average loading might
increase or decrease in the Smart Grid scenario. It is up to project coordinators to demonstrate
how the Smart Grid project, by affecting the average loading of the network components, is
providing benefits (e.g. increased available capacity thanks to optimization of average loading;
avoided investment costs thanks to better use of existing resources etc.).
We recommend highlighting clearly which national/local factors affect the analysis.
e)Availability of network components (related to planned and unplanned maintenance) and
its impact on network performances

49
The Smart Grid implementation can have positive effects on the availability of network
components. The implementation of Smart Grid capabilities potentially allows condition-based
maintenance and reduces the stress of grid components. This might reduce the mean time
between failures - MTBF (as components are operated at their optimal working point) and the
mean time to repair - MTTR (thanks to faster identification of faults and to condition-
based/proactive maintenance). For example, the possibility of remote control of MV devices
reduces the need of intervention of work field teams and ensures short time failures. In
distribution transformer stations and MV/BT transformer the constant monitoring of
temperature, pressure, gas, intrusion, flood is important to anticipate problems.
In general, the availability of components is defined as
MTTRMTBF
MTBFtyAvailabili
Where MTBF is the mean time between failures
And MTTR is the mean time to repair (including planned and unplanned maintenance)
For a given component, the KPI can be expressed as the percentage variation of its availability in
the BaU and SG scenarios.
The indicator might be applied only to those components whose availability is indispensable for
optimal grid performance and have a direct impact on output-based indicators like SAIDI and
SAIFI (see KPI4d). An alternative way to measure the impact of increased availability on network
performances is to measure the increase in the network equipment lifespan in the SG scenario.
If some sort of estimation is feasible, it could also be carried out a comparison between the
number of unplanned maintenance interruptions before ad after the project implementation.
f)Actual availability of network capacity with respect to its standard value
As clarified in [CEER, 2011], ”There are two possible understandings of this type of indicator:
-The availability of network capacity compared to a reference value at national or local level; or
-The actual availability of network capacity in selected lines or network cross-sections compared
to their nominal capacity (e.g. winter peak net transfer capacity), due to unavailability of some
network components or actual operational conditions. “
In this document we recommend following the second approach. The resulting KPI can be
expressed as:

50
PPP
KPIN
BaUSG
f
5
Where PSG and PBaU represent the sum of the actual network capacities [MW] of the considered
lines or network cross-sections, in the SG and BaU scenarios respectively. Pn is the sum of the
nominal network capacities (standard value) of the considered lines or network cross-sections.

51
6. CONTRIBUTION TO CROSS-BORDER ELECTRICITY MARKETS BY LOAD-FLOW
CONTROL TO ALLEVIATE LOOP-FLOWS AND INCREASE INTERCONNECTION
CAPACITIES
a) Ratio between interconnection capacity of a Member State and its electricity demand
This ratio should have a value of at least 10%8, i.e. the minimum interconnection capacity to
ensure that, in case of significant events affecting one Country/zone electricity supply, at least
10% of the demand can be covered through imports. Calculation of the ratio (r) is usually carried
out on yearly data as follows:
100)(
jtot
i ii
j E
NTCr
r
Where i refers to each single interconnection from a Country/zone j to another Country/zone j
and (NTC) is the average NTC (Net Transfer Capacity9) throughout the year per border i. Etot j
represents the total electricity demand in Country/zone j.
It should be noted that this indicator is mostly significant for interconnections between
Countries/zones where capacity calculation is based on ATC (Available Transfer Capacity).
According to the Framework Guidelines for Congestion Management and Capacity Allocation,
capacity in highly meshed networks should instead be calculated through flow-based calculation
method10, therefore a correct estimation of SG benefits on loop-flows should be assessed
through a simulation of power flow change in the selected network branch.
In any event, the KPI should express the percentage variation of the aforementioned ratio in the
SG and BaU scenarios.
1006
BaU
SGprojectBaU
a r
rrKPI
b) Exploitation of interconnection capacities
8 Presidency Conclusions of the Barcelona European Council (March 2002), where it has been agreed that “the target
for Member States of a level of electricity interconnections [should be] equivalent to at least 10% of their installed production capacity by 2005”. 9 ENTSO-E Procedures for Cross-border transmission capacity assessment https://www.entsoe.eu/resources/ntc-
values/ 10
Draft Framework Guidelines on Capacity Allocation and Congestion Management for Electricity - Initial Impact Assessment page 25

52
The exploitation of interconnection capacities can be calculated by comparing the yearly
allocated NTC per border with the average yearly load flow on that same interconnection. These
data are available through ENTSO-E Data Portal11 for each European Interconnection. Actual
load flow is measured conventionally every Wednesday at 03.00 am (proxy for off-peak load
flow) and at 11.00 am (proxy for peak load flow). In order to calculate such Exploitation rate, the
following formula can be used, where i stands for each interconnection and μ is the average of
annual Load Flow values, measured as above:
100)_(
i
ii
NTC
flowloadER
Where ERi is the exploitation rate for the interconnector i.
As above, the related KPI measures the percentage variation of the ratio in the SG and BaU
scenarios:
1006
BaU
SGprojectBaU
a Er
ERERKPI
c) Congestion rents across interconnections
Congestion rents can be calculated both ex-ante and ex-post. For the purposes of evaluating
projects before their actual implementation, as provided by the Proposal of Regulation on
Guidelines for Trans-European energy infrastructure, the ex-ante estimation of congestion rent
is the most appropriate. Ex-post evaluation will then be used in order to monitor the
effectiveness of the Smart Grid project during and after its implementation.
Ex ante estimation of congestion rents (CR) can be derived by looking at the results of
interconnection capacity auctions, i.e. how the market participants value that specific
interconnection capacity in any on the selected interconnection i:
i
dailymonthlyyearlyi iiivvvCR ReReRe
After the project is implemented, the ex-post calculation of congestion rents can be performed
through calculating the sum of allocated interconnection capacity allocated on each
interconnection i per single hour of the year, multiplied by the price differential per single hour
on that same interconnection:
i
ihAllocatedCi priceMWCRih ,,
11
https://www.entsoe.eu/resources/data-portal/exchange/

53
The proposed Smart Grids projects should contribute to alleviate price differentials between
two price zones/Countries. Moreover, the comparison of ex ante and ex post congestion rents in
the same year and in previous years may also provide some relevant information on the actual
SG impact on cross-zonal congestion.

54
ANNEX III A GUIDE TO THE CALCULATION OF BENEFITS
This annex provides a description of possible formulae for the calculation of benefits. The list is
however not exhaustive, and project promoters may, if duly justified, use other calculation
methods. Benefits should be calculated for each year of the time horizon of the analysis.
Other benefits, which might be not relevant for MV projects, refer more to the customers’ side
and include: reduced meter reading costs; reduced meter operation costs; reduced billing costs;
reduced electricity theft; reduced call centre/customer care costs etc.
a. Reduced operations and maintenance cost To calculate these benefits, the scenario should track the distribution operational and
maintenance cost before and after the Smart Grid project takes place. These benefits will
typically consist of different components, like reduced maintenance costs, reduced rate of
breakdowns etc. The benefits refer to the cost reduction which is due to monitoring and
real-time network information, quicker detection of anomalies and reduced amount of
time between a breakdown and the restoring of the supply. The following formulae are
proposed for the calculation of their monetary impact:
Reduced maintenance costs of assets Value (€) = [Direct costs relating to maintenance of assets(€)]Baseline – [Direct costs relating
to maintenance of assets (€)] SGproject
Through remote control and monitoring of asset conditions and utilization (e.g. secondary
substations LV), site visits could be avoided. However, it might also be the case that the
installation of additional grid components increases the overall need for maintenance costs.
Reduced cost of equipment breakdowns Value (€) = [Cost of equipment breakdowns (€)]Baseline – [Cost of equipment breakdowns
(€/)] SGproject
With a better knowledge of power flow and distributions of charge in the grid, less
equipment (e.g. transformers) is likely to break down due to overcharge or maintenance
failures. The benefit value can be estimated by considering the expected reduction in the
number of equipment requiring replacement and the average cost of the equipment.
b. Deferred distribution capacity investments

55
The assumption underlying the monetization of this benefit is that the implementation of
Smart Grid solutions will potentially allow reducing consumption and peak load or at least a
reduction in their growth rate in cases where there are underlying industrial, economic or
social reasons for growth in electricity demand.
Additionally the Smart Grid solutions are expected to enable the integration of distributed
generation reducing the need of network reinforcements.
Taken cumulatively, these two effects would lead to a reduction of maximum installed
capacity required and consequently to a deferral of investments. However it must be borne
in mind that unless the two effects are entirely discretely measured, the savings calculated
may not necessarily be treated as cumulative benefits.
Monetization of these benefits across a system can only be indicative and the more specific
the deferral (pertaining to several specific networks affected by a Smart Grid project), the
more accurate the projected savings.
A potential calculation method is the following.
The first step is to estimate the future incremental cost for the reinforcement of the grid
due to the growing peak demand. Hence, it is necessary to estimate the incremental cost
per MW of peak demand [€M/∆MW]. This can be done considering the planned
reinforcement projects to meet growing peak demand. Projections about growing peak
demand are based on the projected growth rates. These rates can be determined on the
basis of historical growth, economic, social and industrial factors.
The second step is to understand the reasons of peak reduction. We observe that peak
reduction can be mainly achieved through two different ways: consumption reduction and
peak load shifting.
Then it is necessary to distinguish the consumers whose consumption level can be affected
by the Smart Grid project implementation. For example: In a smart metering project, we
can assume that consumption reduction (e.g. 1%) should be applied only to the quota of
peak demand due to domestic and small commercial loadings.
Separately, the potential for deferred cost of capacity (due to peak load shifting) needs to
be calculated. This calculation should consider only those networks where the peak
corresponds with the general peak (e.g. 6pm) when the potential for peak load shifting is
higher.

56
The third step is the calculation of the benefit for both the consumption reduction and
peak load shift. The benefit is calculated as a percentage of reduction on the Incremental
cost per MW of peak demand. The formulas for the calculations are the following:
Deferred distribution capacity investments due to consumption reduction:
Value (€) = Peak demand reduction due to energy savings [MW]* Incremental cost per
MW of peak demand [€M/∆MW]
Deferred distribution capacity investments due to peak load shift:
Value (€) = Peak demand reduction due to peak load shift [MW]* *% of networks where
the peak corresponds with general peak *Incremental cost per MW of peak demand
[€M/∆MW]
Where Peak demand reduction due to energy savings [MW] = % demand reduction * peak
demand * % contribution of domestic and commercial load (or whatever load-type is
influenced by the project in question)
The CBA calculation will then include:
The (discounted) avoided costs of the reinforcement project, allocated on the years where
the reinforcement project was planned
The (discounted) costs of the reinforcement project, allocated to the years when the
investment will take actually place after the deferral (provided that these costs are still
within the time horizon of the CBA)
In the graph it is demonstrated an example of benefits due to deferred distribution
investments allocated on the time horizon of the project. It can be observed the effect of
discount rate on the net present values of benefit (decreasing benefits). It is assumed that
investments have been deferred by six years, after which they are undertaken.

57
c. Deferred transmission capacity investments
For the calculation of this benefit, similar considerations made at the distribution level
apply (see previous item). Similar monetization formulae can be used.
d. Deferred generation capacity investments For the calculation of this benefit, we suggest considering the impact on the amount of
generation capacity investments of peak load plants on the one hand and of spinning
reserves on the other hand.
The underlying assumption concerning the monetization of this benefit is that the Smart
Grid scenario will potentially allow reducing consumption and peak load and will provide
demand side management tools to cope with supply variability. Taken cumulatively, these
effects would lead to a reduction of maximum installed capacity and consequently to a
deferral of investments.
Deferred generation investments for peak load plants:
Value (€) = Annual investment to support peak load generation (€/year) * Time deferred
(# of years)
This takes into account the price of the marginal unit at peak and assumes that generation
deferral is based on reducing peak demand.
Deferred generation investments for spinning reserves
Value (€) = Annual investment to support spinning reserve generation (€/year) * Time
deferred (# of years)
e. Reduced electricity technical losses
1 2 3 4 5 6
7 8 9
Years
Deferred distribution investments benefits

58
As mentioned in the EPRI methodology, several Smart Grid functions can contribute to loss
reductions, and scenarios that demonstrate more than one of them at once will see
compounded effects. The total benefit of reduced power losses comprises different sub-
categories of benefits. They are related to i) energy efficiency (consumption reduction and
peak load transfer at the distribution level, ii) improved balancing between phases, iii)
increased distributed (micro-generation); iv) voltage control and v) consumption reduction
at the transmission level.
One way of estimating technical loss reductions is the use of simulators. Another possibility
to determine loss reductions, e.g. on a distribution feeder, would be to measure and
compare hourly load and voltage data from smart meters as well as hourly load and voltage
data from the head end of the feeder at the substation [EPRI 2011].
Reduced electricity technical losses:
Value (€) = Reduced losses via energy efficiency (€) + Reduced losses via voltage control (€)
+ Reduced losses at transmission level (€)
As an example, in this formula we include the estimated loss reductions via energy
efficiency and via voltage control at distribution level and the estimated loss reductions at
transmission level.
f. Electricity cost savings For the calculation of this benefit, the impact of consumption reduction and peak load
transfer on electricity cost savings have been considered. The following formulae are
suggested for the calculation of the monetary impact of this benefit:
Consumption reduction:
Value (€) = Energy Rate (€/MWh) * Total energy consumption (MWh) * Estimated % of
consumption reduction with Smart Grid scenario (%/100)
In ex ante calculations, a confident estimate of consumption reduction is difficult.
Assumptions on consumption reduction can be done by analyzing international
benchmarks and recent studies.
Peak Load Transfer:

59
Value (€) = Wholesale margin difference between peak and non-peak generation (€/MWh)
* % Peak load transfer (%/100) * Total energy consumption (MWh)
The introduction of new tariff plans and detailed real-time information about consumption
is expected to incentivize clients to shift part of their consumption to off-peak periods. The
percentage of peak load transfer needs to be estimated. One way of monetizing this benefit
is to use the price difference of the electricity wholesale margin between peak and off-peak
periods (€/MWh).
g. Reduced outage times
Customer outage time can typically be measured by smart metering or outage
management systems. This data can then be compared with average hourly loads to
estimate the load that was not served during the outage. The value of the decreased load
not served as a result of a particular asset and its functions must be attributed to that
asset’s contribution to the reduction in outage duration.
Reduced outage time can be achieved through monitoring and real-time network
information, quicker detection of anomalies, remote management and automatic network
reconfiguration. Since the % decrease in outage time varies across endpoints depending on
the infrastructure installed, the value of service needs to be calculated separately for
different installed assets (e.g. smart meters, distribution transformer controllers).
In principle, the estimated value of outage costs might go beyond the immediate lost load
cost and reflect also other societal impacts which are difficult to quantify (e.g. uncertainty,
negative perception etc.). In this perspective, the outage penalty cost set by regulators
could be used, as it reflects the ultimate cost to society in the local context.
We suggest the following three formulae to calculate the monetary impact of this benefit:
Value of service:
Value (€) = Total energy consumed (MWh)/ Minutes per year (#/year) * Average non-
supplied minutes/year ((#/year) * Value of Lost Load (€/kWh) * % Decrease in outage
time (%)
For the calculation of this value, it is necessary to adopt an index to measure technical
service quality (e.g. Interruption Time Equivalent to Installed Capacity-TIEPI) and use a
target in a BaU scenario (e.g. 100 minutes/year) as a reference. The value of lost load,

60
which is typically set as a reference by national regulators, represents an estimated cost for
the economy per kWh of electricity not supplied.
Note: When estimating the load not served (average non-supplied minutes), it is important
to bear in mind the potential impact of load control and the energy efficiency on load not
served. The average number of non-supplied minutes could decrease after the
implementation of the scenario, e.g. as a result of customers using less electricity, without
any actual improvement in reliability, i.e. outage duration.
Recovered revenue due to reduced outages:
Value (€) = Annual supplier revenue (€)/ Minutes per year (#/year) * Average non-
supplied minutes/year (#/year) * % Decrease in outage time (%)
While the value of service benefit is a benefit associated with society at large, as it
measures the cost of outages for the economy, this benefit refers to increased supplier’s
revenue due to a reduction in outage time.
Reduced cost of client compensations:
Value (€) = Average annual client compensations (€) * % Reduction of client
compensations
This benefit refers to a reduction of client compensations relating to losses or injuries
incurred by power outages.
h. Reduced CO2 emissions and reduced fossil fuel usage
CO2 reduction can be achieved through different means, such as the incorporation of
additional renewable sources or increased energy efficiency through the implementation of
the roll-out scenarios. These values are, however, complex to calculate and should be
evaluated on a case by case basis.
Another possible source of CO2 emissions is related to the reduction of the total mileage of
DSOs’ operational fleet and the consequent savings on liters of fuels and CO2 emissions
due to remote meter readings and remote network operations.
In those cases where the analysis permits the calculation of carbon costs, it is
recommended to use the projected EU Emission Trading Scheme carbon prices in the

61
Commission reference scenario up to 2050 as a minimum lower bound, assuming
implementation of existing legislation, but not decarbonisation.12
Benefit of reduced CO2 emissions due to reduced line losses:
Value (€) = [Line losses (MWH) * CO2 content (tons/MWH) * Value of CO2
(€/ton)]Baseline -[Line losses (MWH) * CO2 content (tons/MWH) * Value of CO2
(€/ton)]SGproject
This calculation monetizes the reduced CO2 emissions due to reduced line losses. If feasible,
the estimation of this benefit should be integrated with a clear and transparent explanation
of the value chosen for the CO2 content of the electricity produced (tons/MWH). In the
definition of this value, the generation sources that are affected by the reduction of line
losses should typically be taken into account.
Reduced CO2 emissions due to wider diffusion of low carbon generation sources
Value (€) = [CO2 Emissions (tons) * Value of CO2 (€/ton)] Baseline - [CO2 Emissions (tons)
* Value of CO2 (€/ton)]SGproject
This benefit captures the emission reductions due to a wider diffusion of renewable energy
sources and distributed generation. This benefit is extremely challenging to capture. Its
estimation should be integrated with a clear and transparent explanation of the link
between the SMD and the wider diffusion of low carbon generation sources.
Benefit of reduced CO2 emissions:
Value (€) = Avoided # liter of fossil fuel (#) * Cost per liter of fossil fuel avoided (€)
This calculation monetizes the reduced CO2 emissions due to fuel savings. It is necessary to
define the reduction of fleet mileage, the average consumption (liter/100km), the CO2
emissions per liter of fuel and a monetary value to CO2 emissions (€/metric ton of CO2)
Benefit of reduced fossil fuel usage:
Value (€) = Avoided # liter of fossil fuel (#) * Cost of one liter of fossil fuel (€)
12
Annex 7.10 of SEC (2011) 288 final- COMMISSION STAFF WORKING DOCUMENT IMPACT ASSESSMENT http://eur-lex.europa.eu/LexUriServ/LexUriServ.do?uri=SEC:2011:0288:FIN:EN:PDF

62
For this calculation, it is necessary to define the reduction of fleet mileage, the average
consumption (liter/100km) and the price (€/liter) of fossil fuel.
i. Reduction of air pollution (Particulate Matters, NOx, SO2)
For the 'cost of air pollutants' (particulate matters, NOx, SO2), it is recommended to consult
the Clean Vehicles Directive - Directive 2009/33/EC of the European Parliament and of the
Council of 23 April 2009 on the promotion of clean and energy-efficient road transport
vehicles, and the "CAFÉ" (Clean Air For Europe) air quality benefits' quantification process.
Reduced air pollutants emissions due to reduced line losses
For each pollutant:
Value (€) = [Line losses (MWh) * air pollutant content (unit/ MWh )* cost of air pollutant
(€/unit)]Baseline -
Line losses (MWh) * air pollutant content (unit/MWh )* cost of air pollutant (€/unit)]
SGproject
Reduced air pollutants emissions due to wider diffusion of low carbon generation sources
(enabled by the Smart Grid project)
For each pollutant:
Value (€) = [air pollutant Emissions (unit) * cost of air pollutant(€/unit) ]Baseline — [air
pollutant Emissions (unit) * cost of air pollutant(€/unit)]SGproject

63
ANNEX IV – POSSIBLE ADDITIONAL PROJECT IMPACTS TO ARGUE FOR THE ECONOMIC VIABILITY OF THE PROJECT
In the following we provide a (non-exhaustive) list of project impacts that might be difficult to
monetize and include in the CBA. These impacts might be used to support the case for economic
viability and cost-effectiveness of the project proposal. As much as possible, expected additional
impacts should be expressed in physical units. Their economic relevance should be discussed.
Network user/consumer inclusion
For Smart Grids to be economically and socially sustainable, consumers need to be engaged
through understanding, trust and clear tangible benefits, like economic benefits, increased
market choice, and greater awareness.
In this context, it is worth mentioning that the Task Force has put forward three consumer-
related criteria [EC 2010c] that have not been included in the regulation proposal:
Enhanced consumer awareness and participation in the market by new players
Consumer bills are either reduced or upward pressure on them is mitigated
Create a market mechanism for new energy services such as energy efficiency or energy
consulting for customers
These indicators could be used in the assessment of project impact in terms of consumer
inclusion and empowerment.
During the project, the adverse impact on network users should be minimized. Any expected or
potential adverse impact should be discussed with the impacted network users.
Employment
In this area, one important challenge is to evaluate the impact on jobs along the whole value
chain, and identify the segments where jobs might be lost and the segments where jobs might
be produced.
The analysis might include an estimation of the number of jobs in the supply and operation
value chain. The first direct impact is on utility jobs created by Smart Grid projects that require
new skills and on utility positions which are retrained for other roles. A second direct impact is
on new jobs for service providers working to the implementation of the project.
Other categories that might be impacted include direct and indirect utility suppliers (supply
chain providers like manufacturers, communication providers, integrators etc.), aggregators

64
entering the market to provide energy services, new industry players (renewable energy
suppliers, electric vehicle manufacturers and suppliers etc.).
This criterion should be considered together with the improvement in skills endowment of all
stakeholders (see below).
Safety
This analysis might take into account new possible sources of hazard or of reduction of hazard
exposure (e.g. fewer field workers due to remote reading through smart meters).
It is important that companies are responsible to ensure that both direct employees and
workers from third-parties have the adequate training and skills. Third parties should be
appropriately vetted for competence and compliance including health and safety standards.
Moreover, each project application should present clearly what are the safety standards
applicable to any component of the project, and prove that HSE management systems are put in
place to ensure compliance.
If feasible, a quantitative indicator might be an estimation of the reduction in the risk of death
or serious injuries.
Social acceptance
In several instances, social acceptance is critical for the successful implementation of Smart Grid
projects. Social resistance might arise due to concerns over transparency, over fair benefit
sharing or over environmental impact. (e.g. [Wolsink 2012]). The consequences of the project on
this subject should be assessed and mitigation strategies proposed.
Enabling new services and applications and market entry to third parties
This analysis should try to assess which new services and applications might be enabled by the
implementation of the Smart Grid project under consideration. It should assess the impact of
the project in creating new opportunities for third parties (e.g. aggregators, telecommunication
companies) to enter the electricity market. The analysis could also assess whether the project
contributes to minimize any risk for a monopoly player to use its monopoly position to obtain an
advantage on an open market.
Time lost/saved by consumers and network users

65
The analysis might try to capture and quantify (e.g. in terms of minutes) the impact of the
implementation of Smart Grid technologies on time saved/lost by network users/consumers.
Ageing work force – gap in skills and personnel
This analysis might address the impact of the project in terms of reducing the gap in skills and
personnel due to "Greying workforce”, i.e. shortages of qualified technical personnel due to
retirement of skilled technicians. It might also analyze the impact of the project in terms of
creation of new skills and knowledge that might increase know-how and competitiveness.
ICT system performances
The analysis might quantify the impact brought by the project in terms of ICT system
performances (e.g. increased network availability, reduced latency, improved communication
rate etc.) and related potential new applications and services.
This analysis might also address the foreseen activities to develop measures to ensure data
protection and cyber-security related to the implementation of ICT systems. It might
qualitatively include the additional costs that are foreseen to implement preventing measures
or the benefits resulting from reduced risks.
Dissemination of the results
A further criterion could be the extent to which experience from the project and any results
from the project and from experiments performed during the project are disseminated over a
wide audience. A dissemination plan could be submitted together with the project proposal and
the level of dissemination could be considered as a further impact of the project.

66
ANNEX V – MULTI-CRITERIA DECISION ANALYSIS USING THE ANALYTIC HIERARCHY PROCESS (AHP) METHOD
The Analytic Hierarchy process is a multi-criteria decision analysis. It consists in systematically
extracting judgment by means of pair-wise comparisons, by firstly posing the question “which of
the two is more important?” and secondly “by how much?”. The strength of preference per
pairs is expressed on a semantic scale of 1 (equality) to 9 (i.e. an indicator can be voted to be 9
times more important than the one to which it is being compared).
The first step of the procedure consists in applying this process to calculate the relative weights
of the different criteria (see table 2). The hypothetical example reported in table 3 indicates that
criterion B is considered to be weakly more important than criterion A (3 in a scale of 10) and
very strongly more important than criterion C (7 in a scale of 10).
Objective Criterion A Criterion B Criterion C
Criterion A 1 1/3 1
Criterion B 3 1 7
Criterion C 1 1/7 1 Table 2: Comparison matrix of three criteria (semantic scale)
The second step is to make pair-wise comparisons of project alternatives with respect to each of
the criteria (which project scores higher with regard to this criterion?). In this way it is possible
to come up with the relative strengths of each project alternative with respect to each criterion.
The hypothetical example in table 3 indicates that, with respect to criterion 1, project C is as
good as project A (1 in a scale of 10) and strongly better than project B (5 in a scale of 10).
Project alternative with respect to criterion 1
Project A Project B Project C
Project A 1 1/4 1
Project B 4 1 1/5
Project C 1 5 1
Table 3: Comparison matrix of three project alternatives with respect to criterion 1 (semantic scale)

67
By combining the weights calculated in step 1 and step 2, it is possible to come up with a ranking
of the different project alternatives with respect to all the criteria. For sake of clarity, annex VI
reports an illustrative example of implementation of the AHP method. More details can be
found in [Saaty T. 2008].
Application of the AHP to project appraisal and ranking
The AHP is intended to support the project evaluators (i.e. the regional group, as defined in the
Regulation Proposal) to apply their expert judgement in a structured way.
We stress that the AHP evaluation is based on the parallel (or joint) comparison of projects
against the set of criteria, rather than the individual evaluation of each project against each of
the criteria.
Therefore it allows to have a common reference system and to come up with a ranking of the
proposed projects.
For the purpose of comparing and evaluating project proposals against the six policy criteria and
against the economic criterion, we propose to use the AHP three times, in three separate steps
(see figure 6).
First, the AHP will be used to evaluate project scores against the six policy criteria (AHP1). The
outcome of this first step is a ranking of the project proposals based on the six policy criteria. In
this first phase, the six policy criteria could all be weighted the same.
In the second step, the AHP will be used to evaluate project scores against the economic
criterion (AHP2). The outcome of this second step is a ranking of project proposals based on the
economic criterion.
In the third step, the AHP will again be used to combine the scores of projects against the policy
and economic criteria and come up with the final ranking of project proposals (AHP3).
By applying the AHP in this way, we aim at maximizing the transparency of the evaluation
process. In fact, project proposals are ranked against the policy criteria first and then against the
economic criterion, before coming up with an overall project ranking.
Alternatively, the AHP can be used in a single step to combine the project performance against
the policy criteria and the economic criterion at the same time.
Figure 7 summarizes the overall proposed project evaluation process, in the case where a multi-
criteria decision analysis approach like AHP is chosen. The KPI and economic analysis performed
by each project promoter are the inputs for the multi-criteria analysis (application of AHP in

68
three steps) to be performed by the project evaluators through pair-wise comparisons of
projects.
Figure 6 –Three-step implementation of the AHP (performed by project evaluators): 1)ranking of
projects against policy criteria (AHP1); 2)ranking of projects against the economic criterion (AHP2); 3)ranking of projects against all criteria (AHP3)
Overall ranking of projects against all criteria (policy and economic)
Project ranking against
economic appraisal
Project ranking against policy
criteria
AHP3
AHP1
AHP2

69
AHP1
Checklist of technical requirements
KPI-based analysis
Appraisal of each of the project proposals against policy criteria
Y
Compliance with technical
requirements?
Economic viability - Societal CBA
Appraisal of each of the project proposals against the economic criterion
N
Project is out
AHP3
Overall evaluation of projects
against all the criteria
Evaluation of projects against policy criteria
AHP2
Evaluation of projects against economic criterion (possibly using AHP)
Figure 7 Flowchart of the evaluation process when the AHP approach is chosen

70
ANNEX VI – EXAMPLE TO ILLUSTRATE THE ANALYTIC HIERARCHY PROCESS (AHP) METHOD
In the following, we provide an illustrative example of applying the Analytic Hierarchy Process
(AHP) in the assessment of three hypothetical Smart Grid projects named A, B and C. Please
bear in mind that the values and the calculations provided in this example do not refer to a
realistic project scenario. They have been chosen for the sole purpose of illustrating the AHP
method.
As detailed in Annex V, project evaluation could be conducted by applying three times the AHP:
a) AHP for ranking the projects against the policy criteria (AHP1)
b) AHP for ranking the projects against the economic criterion (AHP2)
c) AHP for ranking overall the projects (AHP3)
The same result can be achieved combining these three individual AHPs in one AHP for the
overall ranking of the projects. Applying the AHP three times is intended to facilitate and make
more transparent the project evaluation. Firstly, in this way, the decision-maker can have a
separate appraisal of the project performance against the policy criteria and against the
economic criterion before making the final- overall ranking of the projects. Secondly, in terms of
structure it is more convenient to split the process into two initial steps [(a) and (b)] and one
final step (c) which has as input the output of steps (a) and (b). By increasing the granularity of
the process, it should be easier to allocate weights to the policy and to the economic criteria.
The main aim of this annex is to provide an illustrative example of how to apply the AHP. For
sake of brevity only AHP3 will be presented. Thus we consider steps (a) and (b) completed and
we use their output (i.e. projects’ ranking in AHP1 and AHP2) as an input to the final AHP3 in step
c. As mentioned, in step (a) the AHP is used for ranking the projects against the six policy criteria
while in (b) the AHP is used for ranking the projects against one economic criterion. The
resulting scores of AHP1 and AHP2 are reported in table 4.

71
CRITERIA/PROJECTS PROJECT
SCORES
AGAINST THE
SIX POLICY
CRITERIA
(OUTPUT OF
AHP1)
PROJECT
SCORES
AGAINST THE
ECONOMIC
CRITERION
(OUTPUT OF
AHP2)
Project A 0.4 0.6
Project B 0.8 0.3
Project C 0.12 0.15
Table 4: Output of AHP1 (project scores against the 6 policy criteria) and AHP2 (project scores against
the economic criterion)
Three basic steps should be followed for applying AHP process in the assessment of the three
projects:
1st Step: Assess the relative weights of the different criteria.
2nd Step: Make pair-wise comparisons of project alternatives with respect to each of the
criteria.
3rd Step: This final step consists of the synthesis of 1st and 2nd step in order to get the
overall priorities for each alternative.
First step
The first step of the procedure is to assess the relative weights of the different criteria. To make
comparisons, we need a scale of numbers that indicates how many times more important or
dominant one criterion is over another criterion with respect to the objective they are
compared. Table 5 details the scale.

72
Intensity of
importance
Definition Explanation
1 Equal importance Two activities contribute
equally to the objective
2 Weak or slight
Moderate importance
Experience and judgement
slightly favour one activity
over another
3
4 Moderate plus
strong importance
Experience and judgement
strongly favour one activity
over another
5
6 Strong plus
Very strong or demonstrated importance
An activity is favoured very
strongly over another; its
dominance demonstrated in
practice
7
8 Very, very strong
Extreme importance
The evidence favouring one
activity over another is of the
highest possible order of
affirmation
9
Reciprocals of
above
If activity i has one of the above non-zero
numbers assigned to it when compared
with activity j, then j has the reciprocal
value when compared with i
A reasonable assumption
1.1 – 1.9 If the activities are very close May be difficult to assign the
best value but when
compared with other
contrasting activities the size
of the small numbers would
not be too noticeable, yet
they can still indicate the
relative importance of the
activities
Table 5: Scale of relative weights

73
Taking into consideration the above scale, the relative weights of the different decision criteria
are filled in table 6.
Objective Decision
Criterion 1
(policy
criterion)
Decision
Criterion 2
(economic
criterion)
Decision
Criterion 1
1 1/4
Decision
Criterion 2
4 1
Table 6: Relative weights among the two criteria (policy and economic)
The above table indicates that Criterion 1 (project scores against the 6 policy criteria) is 4 times
more important than Criterion 2 (project scores against the economic criterion).
The three steps for calculating the priorities are:
i. Calculate the sum of each column:
In the first column we made the calculation: Σ= 1+ 4= 5
In the second column we made the calculation: Σ= 1/4+ 1= 5/4
ii. Then divide each element of the matrix with the sum of its column:
For Example the new values in the first column are: 1/5, 4/5
In the second column: 4/20, 4/5
As it can be observed the sum of each column is 1.
iii. The normalized principal priority vector (V) can be obtained by averaging across the
rows. The priority vector shows relative weights among the things that we compare.
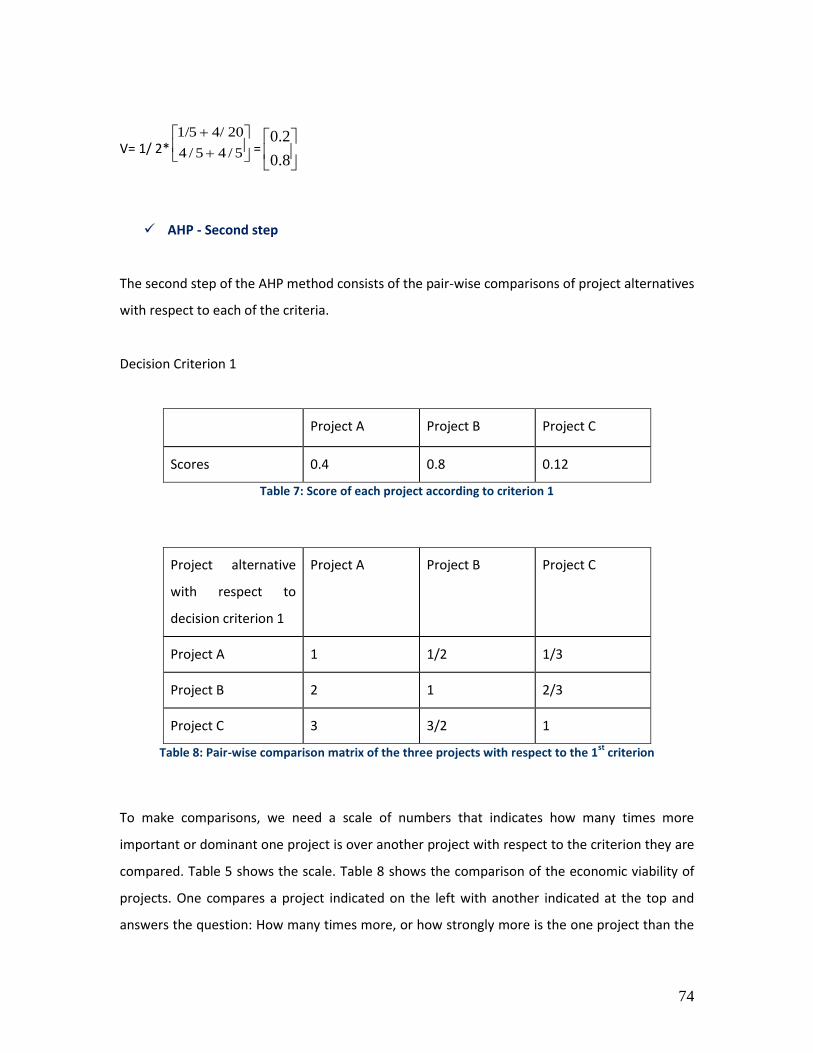
74
V= 1/ 2*
5/45/4
204/ 1/5
=
8.0
2.0
AHP - Second step
The second step of the AHP method consists of the pair-wise comparisons of project alternatives
with respect to each of the criteria.
Decision Criterion 1
Project A Project B Project C
Scores 0.4 0.8 0.12
Table 7: Score of each project according to criterion 1
Project alternative
with respect to
decision criterion 1
Project A Project B Project C
Project A 1 1/2 1/3
Project B 2 1 2/3
Project C 3 3/2 1
Table 8: Pair-wise comparison matrix of the three projects with respect to the 1st
criterion
To make comparisons, we need a scale of numbers that indicates how many times more
important or dominant one project is over another project with respect to the criterion they are
compared. Table 5 shows the scale. Table 8 shows the comparison of the economic viability of
projects. One compares a project indicated on the left with another indicated at the top and
answers the question: How many times more, or how strongly more is the one project than the

75
one at the top? One then enters the number from the scale that is appropriate for the judgment:
for example enters 2 in the (Project B, Project A) position meaning that Project B economic
performance is 2 times better than Project A economic performance. It is automatic that 1/2 is
what one needs to use in the (Project A, Project B) position.
Calculating the priorities for each criterion after completing the table with the scores includes
the three steps that were also described in the First step of the AHP method. These are:
i. Calculate the sum of each column.
ii. Then divide each element of the matrix with the sum of its column.
iii. Finally, calculate priority vector by averaging across the rows.
Following all the above steps we calculate the principal priority vector (V)
V=1/ 3*
2/16/36/3
6/23/16/2
6/16/16/1
=
50.0
33.0
17.0
Project alternative
with respect to
decision criterion 1
Project A Project B Project C PRIORITIES
Project A 1 1/2 1/3 0.17
Project B 2 1 2/3 0.33
Project C 3 3/2 1 0.50
Table 9: Priorities of each project with respect to decision criterion 1
Decision Criterion 2:
Project A Project B Project C
Scores 0.6 0.3 0.15
Table 10: Score of each project according to criterion 2

76
Project alternative
with respect to
decision criterion 2
Project A Project B Project C
Project A 1 2 4
Project B 1/2 1 2
Project C 1/4 1/2 1
Table 11: Pair-wise comparison matrix of the three projects with respect to criterion 2
Following the three steps (i, ii, iii) for the calculation of priorities we get:
V=
14.0
29.0
57.0
Project alternative
with respect to
decision criterion 2
Project A Project B Project C PRIORITIES
Project A 1 2 4 0.57
Project B 1/2 1 2 0.29
Project C 1/4 1/2 1 0.14
Table 12: Priorities of each project with respect to decision criterion 2
AHP - Third step
CRITERIA/PROJECTS CRITERION 1 CRITERION 2
0.2 0.8
Project A 0.17 0.57
Project B 0.33 0.29
Project C 0.50 0.14
Table 13: Overall Priorities of projects

77
This final step of the assessment consists of the synthesis of first and second step. It can be
observed that table 13 contains the priorities of each project with respect to the two criteria
(step 2). Additionally, the table contains the priority of each criterion with respect to the
objective being assessed (step 1). For getting the final priorities (overall priority column) one has
to multiply each priority criterion with the project priority. For getting the overall priority for
each Project we should make the following calculations:
Priority of Project A= (0.2*0.17) + (0.8*0.57) = 0.49
Priority of Project B= (0.2*0.33) + (0.8*0.29) = 0.298
Priority of Project C= (0.2*0.50) + (0.8*0.14) = 0.212
Project A gets the higher score (0.49) while Project B comes second with a score of 0.298 and
Project C comes third with a score equal to 0.212.

Europe Direct is a service to help you find answers to your questions about the European Union
Freephone number (*): 00 800 6 7 8 9 10 11
(*) Certain mobile telephone operators do not allow access to 00 800 numbers or these calls may be billed.
A great deal of additional information on the European Union is available on the Internet.
It can be accessed through the Europa server http://europa.eu.
How to obtain EU publications
Our publications are available from EU Bookshop (http://bookshop.europa.eu),
where you can place an order with the sales agent of your choice.
The Publications Office has a worldwide network of sales agents.
You can obtain their contact details by sending a fax to (352) 29 29-42758.
European Commission
EUR 25828 EN – Joint Research Centre – Institute for Energy and Transport
Title: DEFINITION OF AN ASSESSMENT FRAMEWORK FOR PROJECTS OF COMMON INTEREST IN THE FIELD OF SMART GRIDS
- Under the EC "Proposal for a regulation of the European Parliament and of the Council on guidelines for trans-European
energy infrastructure"
Authors: Vincenzo Giordano, Silvia Vitiello, Julija Vasiljevska
Luxembourg: Publications Office of the European Union
2014 – 77 pp. – 21.0 x 29.7 cm
EUR – Scientific and Technical Research series – ISSN 1831-9424 (online)
ISBN 978-92-79-28757-2 (PDF)
doi:10.2790/83888

ISBN 978-92-79-28757-2
doi:10.2790/83888
JRC Mission As the Commission’s in-house science service, the Joint Research Centre’s mission is to provide EU policies with independent, evidence-based scientific and technical support throughout the whole policy cycle. Working in close cooperation with policy Directorates-General, the JRC addresses key societal challenges while stimulating innovation through developing new methods, tools and standards, and sharing its know-how with the Member States, the scientific community and international partners.
Serving society Stimulating innovation Supporting legislation
LD
-NA
-25
82
8-E
N-N


