Download - December 2019 - January 2020 - Avendus

December 2019 - January 2020

2
ABOUT US
M&A DEAL SUMMARY
MOVERS AND SHAKERS
AVENDUS INSIGHTS – PRODUCTE ENGINEERING SERVICES (PES) INDUSTRY OVERVIEW
REPRESENTATIVE TRADING COMPARABLES

3Source: Mergermarket, Company Press release and Avendus Research
Date Buyer Target HQ DescriptionSegment/Vertical
Deal Size($Mn)
EV/ Revenue
EV/EBITDA Rationale
30-Jan-20Provider of video interpretation solutions with a focus in the healthcare industry
Consulting475 4.4x 15.8x
Scale, Capability play
27-Jan-20Provider of cloud technology, cyber security, Agile, and DevOps services and solutions
Cloud, Cybersecurity
85 1.9x NACapability Play,
Geography –Market Access
19-Jan-20 China China-based IT consulting and outsourcing company Consulting 750 NA NAGeography –
Market Access
14-Jan-20A cloud, Enterprise Resource Planning (ERP), and data services provider for Oracle and Microsoft applications and databases
Consulting NA NA NACapability Play,
Geography –Market Access
13-Jan-20A digital consulting firm delivering IT systems modernization and business transformation for government and commercial clients
Consulting NA NA NACapability Play,
Geography –Market Access
09-Jan-20Provider of risk adjustment and quality healthcare solutions
Software Development,
System Integrators
NA NA NA PE Transaction
08-Jan-20Slovak
iaProvider of Salesforce.com platform-related services
System Integrators
NA NA NA Capability Play
M&A DEAL SUMMARY
MOVERS AND SHAKERS
REPRESENTATIVE TRADING COMPARABLES
ABOUT US
AVENDUS INSIGHTS –PES INDUSTRY OVERVIEW

4Source: Mergermarket, Company Press release and Avendus Research
Date Buyer Target HQ DescriptionSegment/Vertical
Deal Size($Mn)
EV/ Revenue
EV/EBITDA Rationale
07-Jan-20Provider of Retail AI-powered markdown, promotions, assortment and allocation SaaS products
Software Development
NA NA NAScale, Geography –
Market access
07-Jan-20Consulting firm that specializes in cloud application platforms and modern development frameworks
Software Development,
CloudNA NA NA Capability Play
07-Jan-20
Cybersecurity
Provides global threat monitoring and analysis through a network of security operation centers, real-time adversary and industry-specific threat intelligence and incident response services
Cybersecurity NA NA NA Capability Play
07-Jan-20Germa
ny
A provider of customer experience and customer relationship management consulting, optimization and ongoing enhancement services
Consulting NA NA NACapability Play,
Geography –Market access
07-Jan-20 Managed Services
Managed services division of West Monroe Partners, LLC
Managed Services
NA NA NA PE Transaction
06-Jan-20
Cirrus9
Canada
Digital healthcare marketing and technology consultancy
Digital Agency NA NA NA Capability Play
06-Jan-20 A Microsoft Dynamic solutions provider Consulting NA NA NACapability Play,
Scale
M&A DEAL SUMMARY
MOVERS AND SHAKERS
REPRESENTATIVE TRADING COMPARABLES
ABOUT US
AVENDUS INSIGHTS –PES INDUSTRY OVERVIEW

5Source: Mergermarket, Company Press release and Avendus Research
Date Buyer Target HQ DescriptionSegment/Vertical
Deal Size($Mn)
EV/ Revenue
EV/EBITDA Rationale
27-Dec-19Provides managed cloud and hosting solutions to customers from eastern Canada to British Columbia
Managed Services
NA NA NAGeography –
Market Access
24-Dec-19Leading I.T. services provider serving the Triangle and Triad areas of North Carolina
Managed Services
NA NA NAScale, Geography –
Market Access
23-Dec-19Delivers smart and innovative SaaS technology solutions to the US residential mortgage industry
Software Development
NA NA NA Scale
19-Dec-19Full-service, independent technology company that provides embedded solutions
ER&D $401 2.4x 24.2xScale, Capability
Play
18-Dec-19
Company engaged in providing technology consultancy by specializing in cloud & mobile apps, data analytics & machine learning, enterprise collaboration and machine design
Consulting NA NA NAGeography –
Market Access
18-Dec-19
NTT DATA NETE
USA provider of digital design and transformation services for U.S. Department of health and human services (HHS) agencies
Software Development(Government)
NA NA NA Vertical Focus
18-Dec-19Provider of hospital and physician revenue cycle services and supporting technology
BPM NA NA NA Capability Play
M&A DEAL SUMMARY
MOVERS AND SHAKERS
REPRESENTATIVE TRADING COMPARABLES
ABOUT US
AVENDUS INSIGHTS –PES INDUSTRY OVERVIEW

6Source: Mergermarket, Company Press release and Avendus Research
Date Buyer Target HQ DescriptionSegment/Vertical
Deal Size($Mn)
EV/ Revenue
EV/EBITDA Rationale
18-Dec-19
Leidos Dynetics
USProvider of high-technology, mission-critical services and solutions to the US Government, including NASA, DOD
Software Development(Government)
$1,650 2.8x 25.4xCapability Play,
Scale
13-Dec-19
Accenture
Clarity Insights
USProvider of data science and artificial intelligence/ machine learning engineering capabilities to companies
Analytics NA NA NA Capability Play
12-Dec-19
Softtek Vector ITC
SpainDesigns and implements technological solutions that adapt to different segments
Software Development
NA NA NAScale, Vertical
Focus
12-Dec-19Warburg Pincus and Vivtera
Arise Virtual Solutions
US
It employs state-of-the-art systems and technology to enable automation of document and data management for commercial insurance and government customers
Managed Services
NA NA NA PE Transaction
11-Dec-19 USProvider of business process outsourcing (BPO) and crowdsourcing solutions
BPM NA NA NA PE Platform Play
10-Dec-19 Hawke MediaArtemis Digital Media
USFull-service digital media management company providing premium affiliate management services
Digital Agency NA NA NA Capability Play
M&A DEAL SUMMARY
MOVERS AND SHAKERS
REPRESENTATIVE TRADING COMPARABLES
ABOUT US
AVENDUS INSIGHTS –PES INDUSTRY OVERVIEW
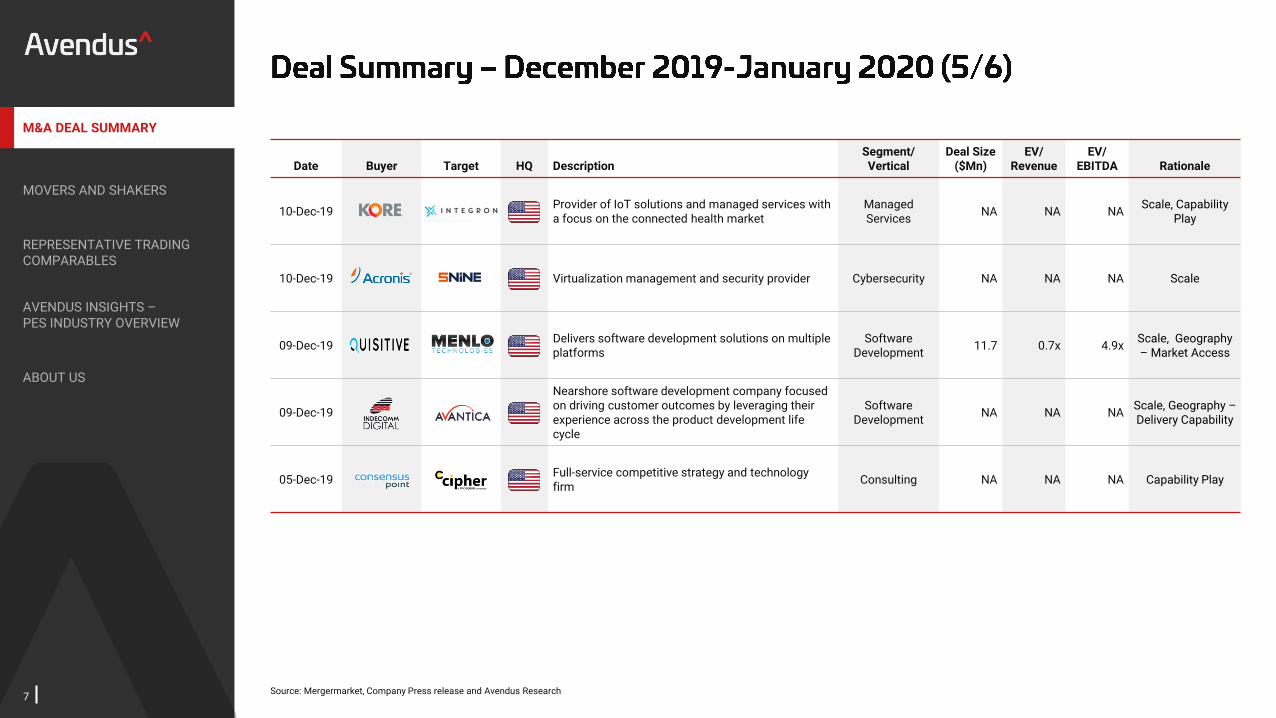
7Source: Mergermarket, Company Press release and Avendus Research
Date Buyer Target HQ DescriptionSegment/Vertical
Deal Size($Mn)
EV/ Revenue
EV/EBITDA Rationale
10-Dec-19 Kore Integron USProvider of IoT solutions and managed services with a focus on the connected health market
Managed Services
NA NA NAScale, Capability
Play
10-Dec-19 Acronis 5nine US Virtualization management and security provider Cybersecurity NA NA NA Scale
09-Dec-19Delivers software development solutions on multiple platforms
Software Development
11.7 0.7x 4.9xScale, Geography – Market Access
09-Dec-19Indecomm Digital
Avantica Technologies
US
Nearshore software development company focused on driving customer outcomes by leveraging their experience across the product development life cycle
Software Development
NA NA NAScale, Geography –Delivery Capability
05-Dec-19Consensus Point
Cipher Systems
USFull-service competitive strategy and technology firm
Consulting NA NA NA Capability Play
M&A DEAL SUMMARY
MOVERS AND SHAKERS
REPRESENTATIVE TRADING COMPARABLES
ABOUT US
AVENDUS INSIGHTS –PES INDUSTRY OVERVIEW
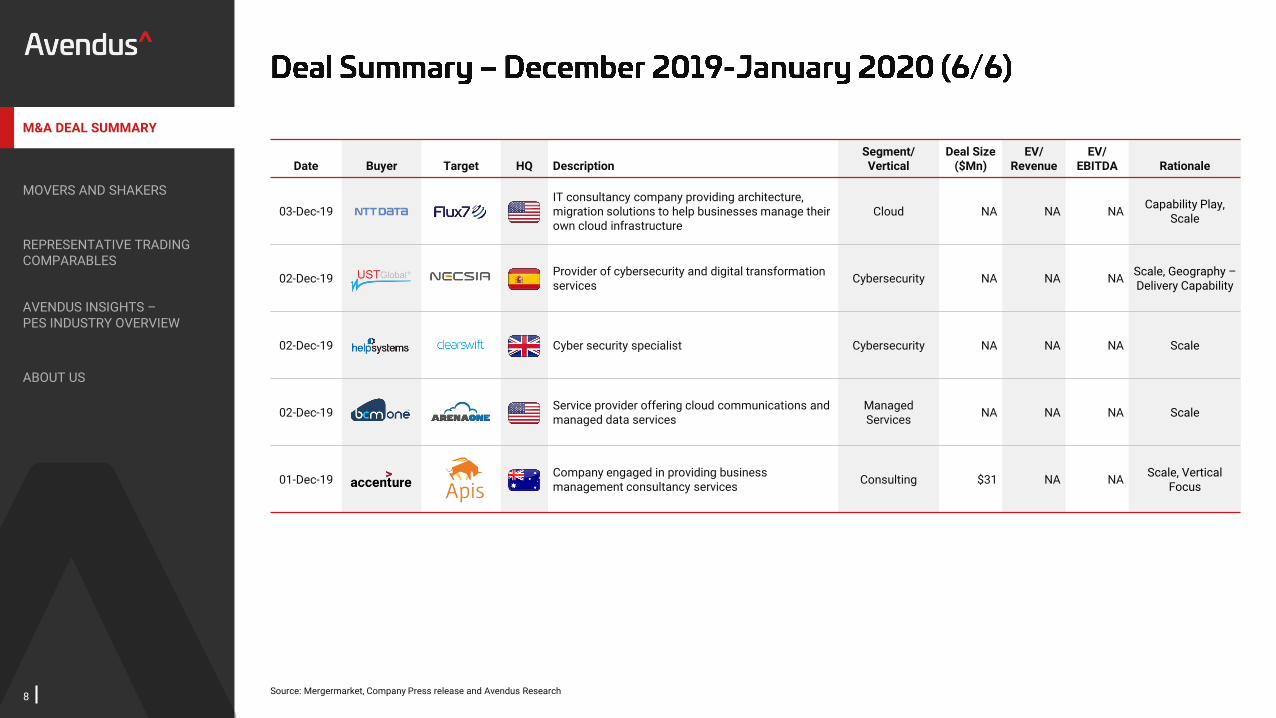
8Source: Mergermarket, Company Press release and Avendus Research
Date Buyer Target HQ DescriptionSegment/Vertical
Deal Size($Mn)
EV/ Revenue
EV/EBITDA Rationale
03-Dec-19 NTT DATA Flux7 USIT consultancy company providing architecture, migration solutions to help businesses manage their own cloud infrastructure
Cloud NA NA NACapability Play,
Scale
02-Dec-19 UST GlobalNecsia Cybersecurity
SpainProvider of cybersecurity and digital transformation services
Cybersecurity NA NA NAScale, Geography –Delivery Capability
02-Dec-19HelpSystems
Clearswift UK Cyber security specialist Cybersecurity NA NA NA Scale
02-Dec-19 BCM One Arena One USService provider offering cloud communications and managed data services
Managed Services
NA NA NA Scale
01-Dec-19 Accenture Apis GroupAustra
liaCompany engaged in providing business management consultancy services
Consulting $31 NA NAScale, Vertical
Focus
M&A DEAL SUMMARY
MOVERS AND SHAKERS
REPRESENTATIVE TRADING COMPARABLES
ABOUT US
AVENDUS INSIGHTS –PES INDUSTRY OVERVIEW
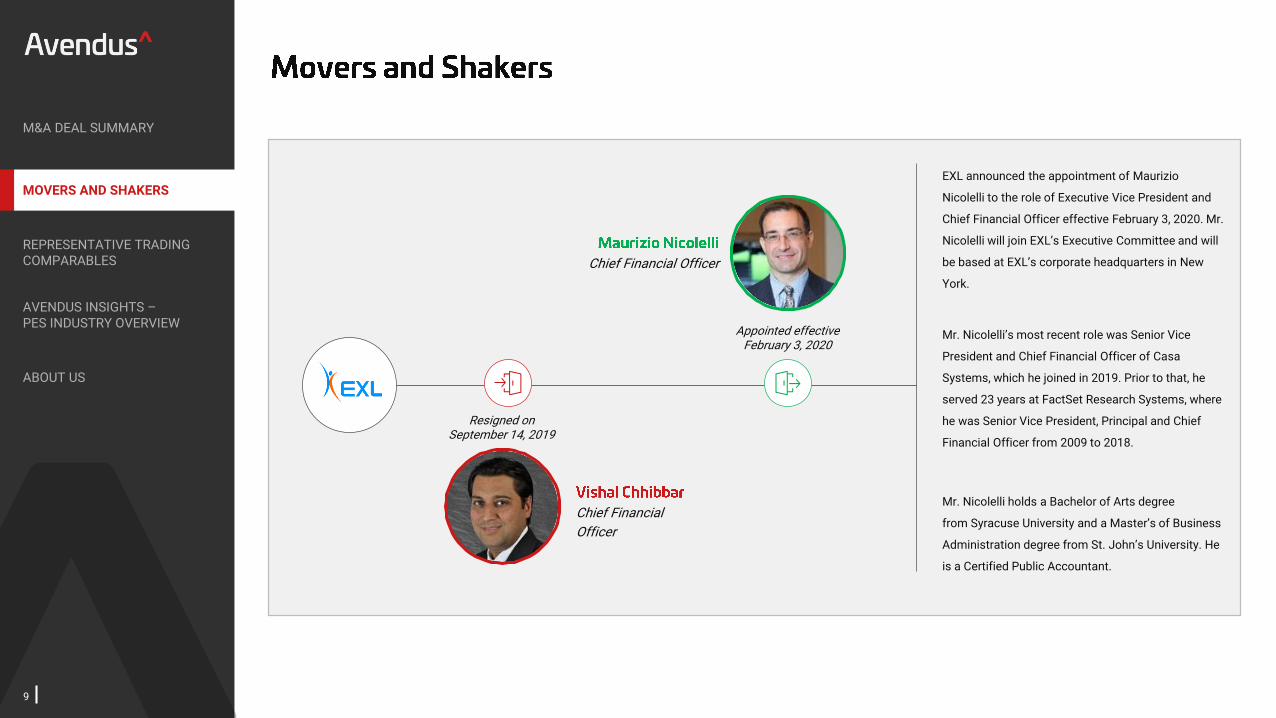
9
Chief Financial
Officer
Chief Financial Officer
EXL announced the appointment of Maurizio
Nicolelli to the role of Executive Vice President and
Chief Financial Officer effective February 3, 2020. Mr.
Nicolelli will join EXL’s Executive Committee and will
be based at EXL’s corporate headquarters in New
York.
Mr. Nicolelli’s most recent role was Senior Vice
President and Chief Financial Officer of Casa
Systems, which he joined in 2019. Prior to that, he
served 23 years at FactSet Research Systems, where
he was Senior Vice President, Principal and Chief
Financial Officer from 2009 to 2018.
Mr. Nicolelli holds a Bachelor of Arts degree
from Syracuse University and a Master’s of Business
Administration degree from St. John’s University. He
is a Certified Public Accountant.
Resigned onSeptember 14, 2019
Appointed effectiveFebruary 3, 2020
M&A DEAL SUMMARY
MOVERS AND SHAKERS
REPRESENTATIVE TRADING COMPARABLES
ABOUT US
AVENDUS INSIGHTS –PES INDUSTRY OVERVIEW

10
President & Global
CEO
Startek has appointed Aparup Sengupta as executive
chairman and global CEO, effective January 15,
2020. Sengupta will replace Lance Rosenzweig, who
is stepping down from his role as president and
global CEO to pursue other opportunities.
Sengupta brings more than two decades of
executive experience in the BPO and
telecommunications industry and has served as
Startek’s chairman of the board of directors since
the business combination with Aegis on July 20,
2018.
Sengupta is an operating partner of Capital Square
Partners (CSP), a Singapore-based private equity
firm and majority shareholder of Startek.
Previously, Sengupta was the executive chairman
of The Minacs Group, a global BPO company that
was acquired by SYNNEX Corporation, a publicly-
traded Fortune 500 company. Prior to that, he spent
over eight years as global CEO and managing
director for Aegis.
M&A DEAL SUMMARY
MOVERS AND SHAKERS
REPRESENTATIVE TRADING COMPARABLES
ABOUT US
AVENDUS INSIGHTS –PES INDUSTRY OVERVIEW
Executive Chairman &
Global CEO
Appointed effectiveJanuary 15, 2020
Resigned onSeptember 14, 2019

11
CEO & MD
Wipro announced that CEO & MD Abidali Z
Neemuchwala has decided to step down due to
family commitments.
The Board of Directors has initiated a search to
identify the next Chief Executive Officer. Abid will
continue to hold the office of CEO & MD until a
successor is appointed for a smooth transition and
to ensure that business continues as usual.
Rishad Premji, Chairman said, “We thank Abid for his
leadership and his contributions to Wipro. Over the
last four years, Abid helped build a strong execution
mindset, drove key acquisitions and scaled our
Digital business globally. We wish him the very best
for the future.”
Resigned onJanuary 31, 2020
M&A DEAL SUMMARY
MOVERS AND SHAKERS
REPRESENTATIVE TRADING COMPARABLES
ABOUT US
AVENDUS INSIGHTS –PES INDUSTRY OVERVIEW

12
Source: Last 5 years data taken as on 2nd Jan 2020 from CapIQ; Indices for each group have been calculated free float market cap methodology (sum of free float shares* share price) and then rebased to 100Note: Large-Cap IT: Tata Consultancy Services Limited, Infosys Limited, Cognizant Technology Solutions Corporation, Wipro Limited, HCL Technologies Limited, Tech Mahindra Limited, International Business Machines Corporation, Accenture plc, Capgemini SE; Mid-Cap IT: Mphasis Limited, Mindtree Limited, Hexaware Technologies Limited, NIIT Technologies Limited, Persistent Systems Limited, Zensar Technologies Limited, The Hackett Group, Inc., Larsen & Toubro Infotech Limited; Digital Engineering Focused: Endava plc, EPAM Systems, Inc., Globant S.A.CRM Focused BPM: TTEC Holdings, Inc., Sykes Enterprises, Incorporated; Teleperformance SE, StarTek, Inc., Firstsource Solutions Limited Diversified BPM: WNS (Holdings) Limited, Genpact Limited, Conduent Incorporated, ExlService Holdings, Inc.; SaaS: salesforce.com, inc., Workday, Inc., ServiceNow, Inc., Box, Inc., LogMeIn, Inc.
158
129
175
820
311
254
417
S&P 500 Large Cap IT Mid Cap IT Digital Engineering Focussed CRM Focussed BPM Diversified BPM SaaS
M&A DEAL SUMMARY
MOVERS AND SHAKERS
REPRESENTATIVE TRADING COMPARABLES
ABOUT US
AVENDUS INSIGHTS –PES INDUSTRY OVERVIEW

13
10.4x
14.2x
11.4x
10.8x
12.1x
12.1x
18.5x
36.3x
7.6x
11.1x
11.6x
16.9x
S&P 500 Large Cap Mid Cap Digital Engineering Focussed CRM Focussed BPM Diversified BPO
Source: Last 5 years data taken as on 2nd Jan 2020 from CapIQ; Median values have been taken for groupsNote: Large-Cap IT: Tata Consultancy Services Limited, Infosys Limited, Cognizant Technology Solutions Corporation, Wipro Limited, HCL Technologies Limited, Tech Mahindra Limited, International Business Machines Corporation, Accenture plc, Capgemini SE; Mid-Cap IT: Mphasis Limited, Mindtree Limited, Hexaware Technologies Limited, NIIT Technologies Limited, Persistent Systems Limited, Zensar Technologies Limited, The Hackett Group, Inc., Larsen & Toubro Infotech Limited; Digital Engineering Focused: Endava plc, EPAM Systems, Inc., Globant S.A.CRM Focused BPM: TTEC Holdings, Inc., Sykes Enterprises, Incorporated; Teleperformance SE, StarTek, Inc., Firstsource Solutions Limited; Diversified BPM: WNS (Holdings) Limited, Genpact Limited, Conduent Incorporated, Capita plc, ExlService Holdings, Inc.
M&A DEAL SUMMARY
MOVERS AND SHAKERS
REPRESENTATIVE TRADING COMPARABLES
ABOUT US
AVENDUS INSIGHTS –PES INDUSTRY OVERVIEW
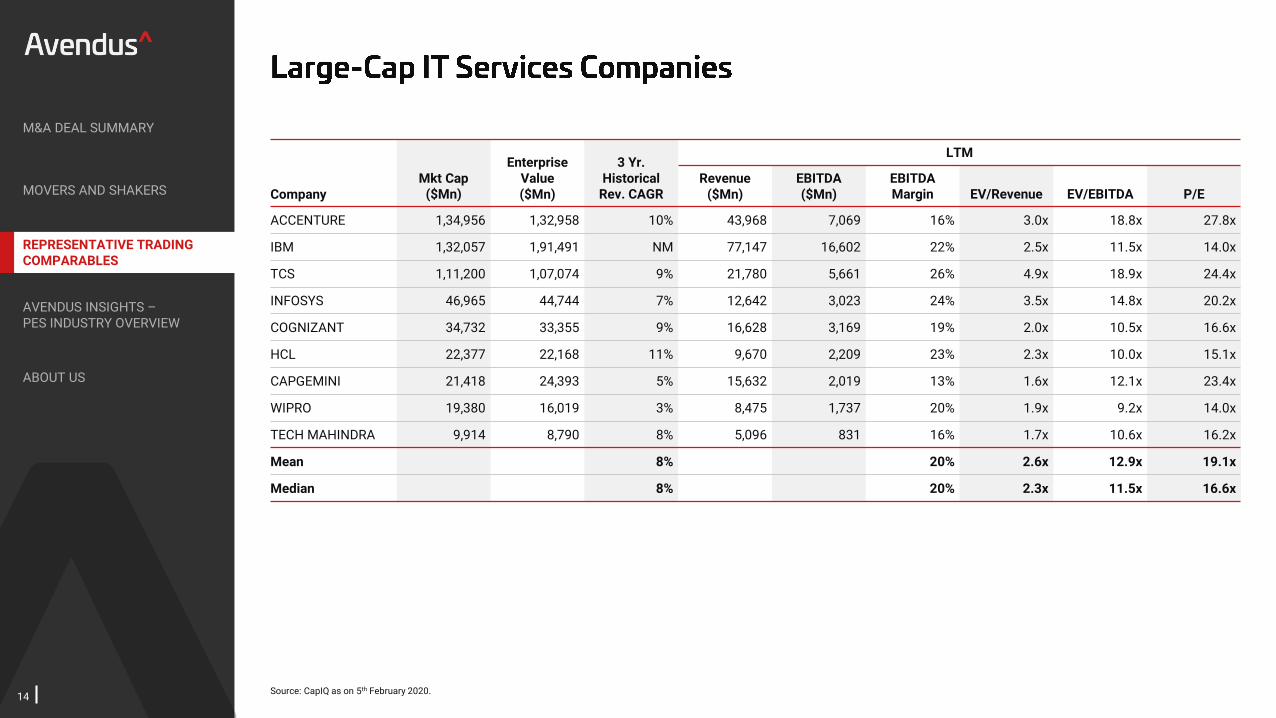
14Source: CapIQ as on 5th February 2020.
M&A DEAL SUMMARY
MOVERS AND SHAKERS
REPRESENTATIVE TRADING COMPARABLES
ABOUT US
AVENDUS INSIGHTS –PES INDUSTRY OVERVIEW
Mkt Cap($Mn)
Enterprise Value($Mn)
3 Yr. Historical
Rev. CAGR
LTM
CompanyRevenue
($Mn)EBITDA($Mn)
EBITDA Margin EV/Revenue EV/EBITDA P/E
ACCENTURE 1,34,956 1,32,958 10% 43,968 7,069 16% 3.0x 18.8x 27.8x
IBM 1,32,057 1,91,491 NM 77,147 16,602 22% 2.5x 11.5x 14.0x
TCS 1,11,200 1,07,074 9% 21,780 5,661 26% 4.9x 18.9x 24.4x
INFOSYS 46,965 44,744 7% 12,642 3,023 24% 3.5x 14.8x 20.2x
COGNIZANT 34,732 33,355 9% 16,628 3,169 19% 2.0x 10.5x 16.6x
HCL 22,377 22,168 11% 9,670 2,209 23% 2.3x 10.0x 15.1x
CAPGEMINI 21,418 24,393 5% 15,632 2,019 13% 1.6x 12.1x 23.4x
WIPRO 19,380 16,019 3% 8,475 1,737 20% 1.9x 9.2x 14.0x
TECH MAHINDRA 9,914 8,790 8% 5,096 831 16% 1.7x 10.6x 16.2x
Mean 8% 20% 2.6x 12.9x 19.1x
Median 8% 20% 2.3x 11.5x 16.6x
15
M&A DEAL SUMMARY
MOVERS AND SHAKERS
REPRESENTATIVE TRADING COMPARABLES
ABOUT US
AVENDUS INSIGHTS –PES INDUSTRY OVERVIEW
Mkt Cap($Mn)
Enterprise Value($Mn)
3 Yr. Historical
Rev. CAGR
LTM
CompanyRevenue
($Mn)EBITDA($Mn)
EBITDA Margin EV/Revenue EV/EBITDA P/E
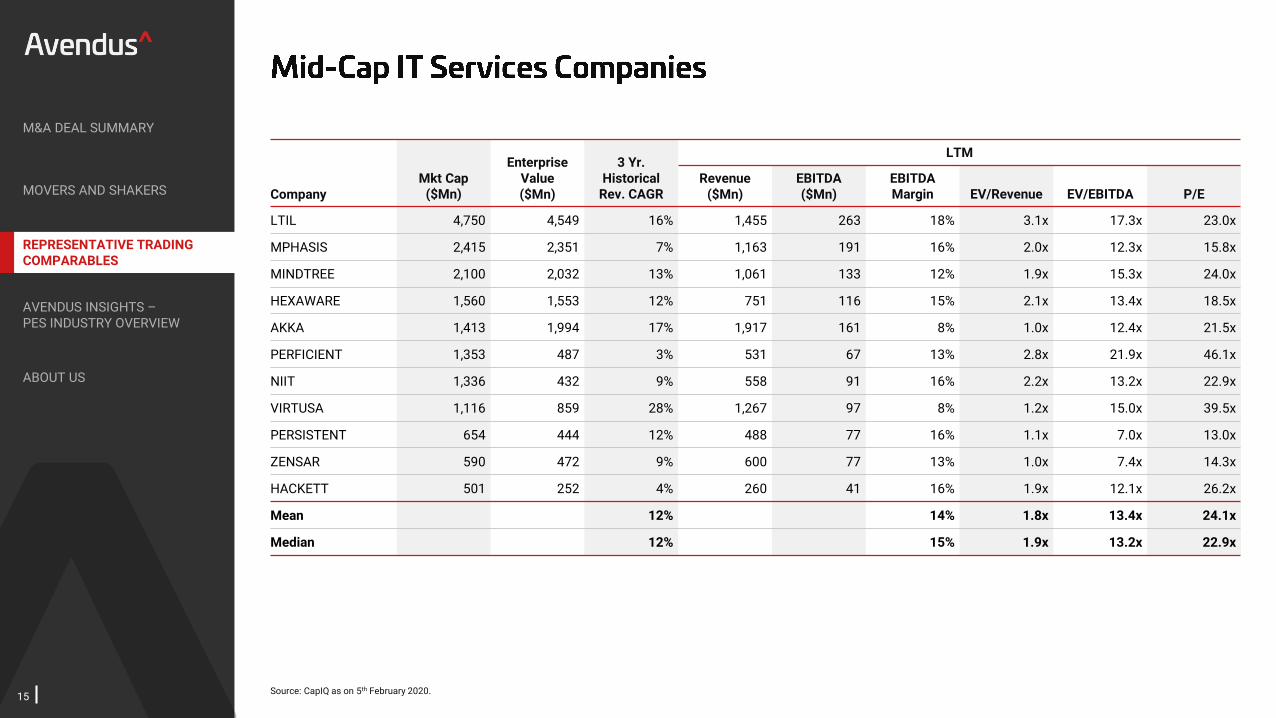
LTIL 4,750 4,549 16% 1,455 263 18% 3.1x 17.3x 23.0x
MPHASIS 2,415 2,351 7% 1,163 191 16% 2.0x 12.3x 15.8x
MINDTREE 2,100 2,032 13% 1,061 133 12% 1.9x 15.3x 24.0x
HEXAWARE 1,560 1,553 12% 751 116 15% 2.1x 13.4x 18.5x
AKKA 1,413 1,994 17% 1,917 161 8% 1.0x 12.4x 21.5x
PERFICIENT 1,353 487 3% 531 67 13% 2.8x 21.9x 46.1x
NIIT 1,336 432 9% 558 91 16% 2.2x 13.2x 22.9x
VIRTUSA 1,116 859 28% 1,267 97 8% 1.2x 15.0x 39.5x
PERSISTENT 654 444 12% 488 77 16% 1.1x 7.0x 13.0x
ZENSAR 590 472 9% 600 77 13% 1.0x 7.4x 14.3x
HACKETT 501 252 4% 260 41 16% 1.9x 12.1x 26.2x
Mean 12% 14% 1.8x 13.4x 24.1x
Median 12% 15% 1.9x 13.2x 22.9x
Source: CapIQ as on 5th February 2020.

16
M&A DEAL SUMMARY
MOVERS AND SHAKERS
REPRESENTATIVE TRADING COMPARABLES
ABOUT US
AVENDUS INSIGHTS –PES INDUSTRY OVERVIEW
Mkt Cap($Mn)
Enterprise Value($Mn)
3 Yr. Historical
Rev. CAGR
LTM
CompanyRevenue
($Mn)EBITDA($Mn)
EBITDA Margin EV/Revenue EV/EBITDA P/E
EPAM 9,688 1,160 26% 2,046 322 16% 4.5x 28.4x 39.5x
GLOBANT 3,328 323 27% 578 104 18% 5.8x 32.1x 63.3x
ENDAVA 2,296 207 34% 366 51 14% 6.0x 42.9x 75.3x
Mean 29% 16% 5.4x 34.5x 59.4x
Median 27% 16% 5.8x 32.1x 63.3x
Source: CapIQ as on 5th February 2020.
17
M&A DEAL SUMMARY
MOVERS AND SHAKERS
REPRESENTATIVE TRADING COMPARABLES
ABOUT US
AVENDUS INSIGHTS –PES INDUSTRY OVERVIEW
Mkt Cap($Mn)
Enterprise Value($Mn)
3 Yr. Historical
Rev. CAGR
LTM
CompanyRevenue
($Mn)EBITDA($Mn)
EBITDA Margin EV/Revenue EV/EBITDA P/E
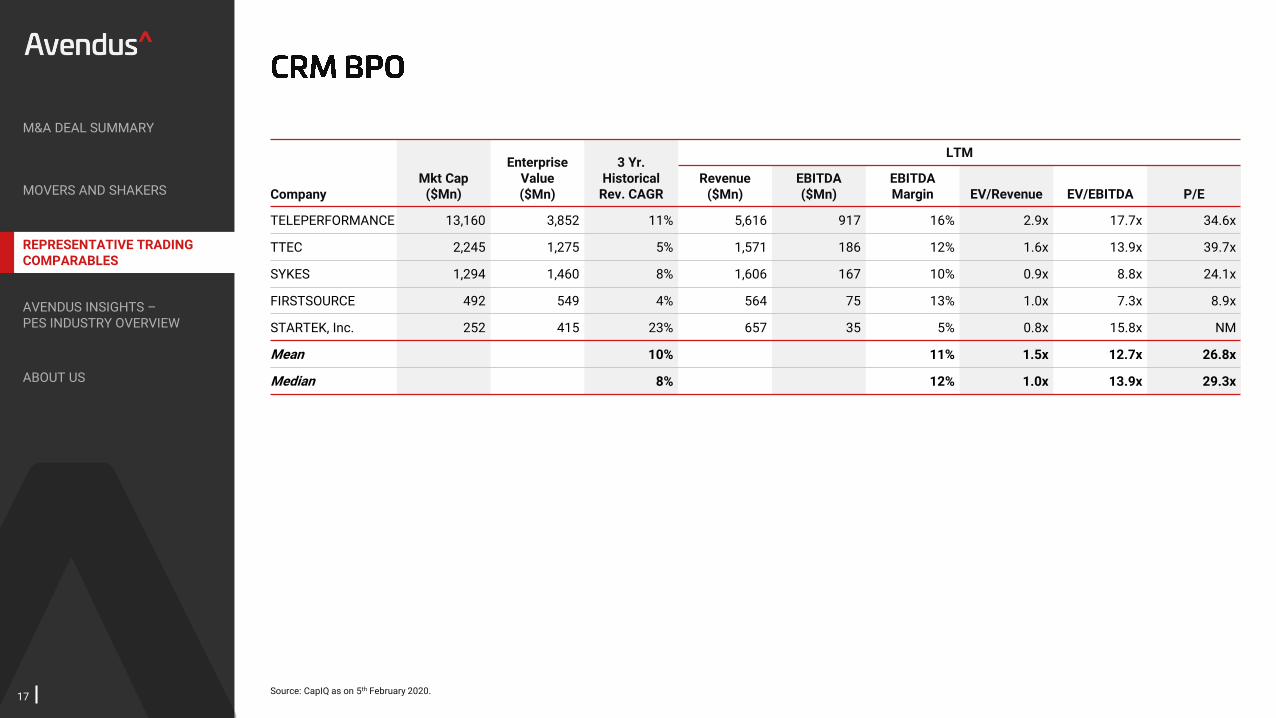
TELEPERFORMANCE 13,160 3,852 11% 5,616 917 16% 2.9x 17.7x 34.6x
TTEC 2,245 1,275 5% 1,571 186 12% 1.6x 13.9x 39.7x
SYKES 1,294 1,460 8% 1,606 167 10% 0.9x 8.8x 24.1x
FIRSTSOURCE 492 549 4% 564 75 13% 1.0x 7.3x 8.9x
STARTEK, Inc. 252 415 23% 657 35 5% 0.8x 15.8x NM
Mean 10% 11% 1.5x 12.7x 26.8x
Median 8% 12% 1.0x 13.9x 29.3x
Source: CapIQ as on 5th February 2020.

18
M&A DEAL SUMMARY
MOVERS AND SHAKERS
REPRESENTATIVE TRADING COMPARABLES
ABOUT US
AVENDUS INSIGHTS –PES INDUSTRY OVERVIEW
Mkt Cap($Mn)
Enterprise Value($Mn)
3 Yr. Historical
Rev. CAGR
LTM
CompanyRevenue
($Mn)EBITDA($Mn)
EBITDA Margin EV/Revenue EV/EBITDA P/E
GENPACT 7,393 2,571 7% 3,274 519 16% 2.6x 16.7x 25.7x
CAPITA 3,412 5,394 NM 4,775 318 7% 1.1x 16.2x 11.7x
WNS 3,061 603 13% 851 163 19% 3.7x 19.4x 26.7x
EXLSERVICE 2,377 686 12% 969 129 13% 2.5x 19.0x 47.4x
CONDUENT 1,298 6,408 NM 4,856 538 11% 0.6x 5.7x NM
Mean 11% 13% 2.1x 15.4x 27.9x
Median 12% 13% 2.5x 16.7x 26.2x
Source: CapIQ as on 5th February 2020.

19
M&A DEAL SUMMARY
MOVERS AND SHAKERS
REPRESENTATIVE TRADING COMPARABLES
ABOUT US
AVENDUS INSIGHTS –PES INDUSTRY OVERVIEW
Mkt Cap($Mn)
Enterprise Value($Mn)
3 Yr. Historical
Rev. CAGR
LTM
CompanyRevenue
($Mn)EBITDA($Mn)
EBITDA Margin EV/Revenue EV/EBITDA P/E
SALESFORCE.COM 1,35,758 8,437 26% 14,729 2,064 14% 9.2x 66.0x 142.9x
SERVICENOW 45,450 1,391 37% 3,224 238 7% 14.0x 189.7x NM
WORKDAY 36,049 1,574 35% 3,245 NM NM 11.0x NM NM
LOGMEIN 3,269 336 64% 1,248 319 26% 2.8x 10.8x NM
BOX 2,465 399 26% 655 NM NM 4.1x NM NM
Mean 38% 16% 8.2x 88.8x 142.9x
Median 35% 14% 9.2x 66.0x 142.9x
Source: CapIQ as on 5th February 2020.

Click here to access our OPD Report
26%
~$250Bn
37%40%
35%34%
27%
2016 2017 2021
Software Embedded Mechanical
20
Source: Zinnov Zones Product Engineering Services 2016, 2017Note: 1. Includes market for captives, offshore R&D service providers and onshore R&D service providers
~$250Bn
~$170Bn
PRODUCT ENGINEERING
PROCESS ENGINEERING
(Plant design engineering,
manufacturing
engineering, industrial
engineering and process
control systems)
$232Bn
$302Bn
$420Bn
$62Bn
$38Bn $100Bn
$25.5Bn Western Europe
$10.0Bn North America
$12.5Bn India
$4.0Bn Eastern Europe
$10.0Bn RoW
GlobalIn-House Captives
(GICs)
ENGINEERING SERVICE PROVIDERS (ESPs)
M&A DEAL SUMMARY
MOVERS AND SHAKERS
REPRESENTATIVE TRADING COMPARABLES
ABOUT US
AVENDUS INSIGHTS –PES INDUSTRY OVERVIEW

21
Modern Infrastructure
High performance computer
architecture
Cloud centric infrastructure
Security, infrastructure (MDM, End point encryption)
Software defined infrastructures
Data lakes
Digital workloads and relevant stakeholders
Customer ExperienceCMO | CDO | CAIO1
New Digital ProductsCInO2 | CTO | CDO | CAIO1
Operational ExcellenceCOO | CIO | BU | CDO
Workforce EngagementCOO | CHRO | BU
Risk Management & SecurityCRO | CIO
Digital Business Outcomes
New Age Enterprise Digital Business Models
Digital Technology Foundation
Personalized Experience
Business Efficiency
Empowered Workforce
New Revenue Workstreams
Business Security and Customer Privacy
Software Led Platformization
Empowered Workforce
Co-Innovator with Customer
Data Ecosystem
Internet of Things AR/VR
3D Printing Robotic Automation
Blockchain
Near Zero Interfaces
R&
D I
NV
ES
TM
EN
T A
CR
OS
S S
TA
KE
HO
LD
ER
S
Source: Worldwide semi-annual digital transformation spending guide , IDC, November 2017, Everest Group, NASSCOM Strategic Review 2018, 20191. CAIO: Chief Artificial Intelligence Officer2. CInO: Chief Innovation Officer
(in $Bn)
(in $Bn)
390
668
2018 2021
180
310
2017 2020e
Digital Addressed Market Size
DigitalTransformation Services TAM
M&A DEAL SUMMARY
MOVERS AND SHAKERS
REPRESENTATIVE TRADING COMPARABLES
ABOUT US
AVENDUS INSIGHTS –PES INDUSTRY OVERVIEW

22Note: Years refer to calendar year
A significant demand-supply mismatch in the US for key skills driving outsourcing
Integration of software to be the next driver of growth across verticals
Reduction in innovation cycles with companies leveraging complex technology architecture
▪ 18–19% of business leaders in the developed world, across verticals, expect a large-scale mismatch in demand and supply of talent in R&D and product/services design, over the next three years
▪ While US, Western Europe and Japan account for ~60% of the global R&D budget, only ~20% of the engineers graduate from these geographies
▪ Across businesses, market leaders are increasing the proportion of spend towards software development (contribution from software R&D to increase from ~27% (2017) to 37% (2020))
▪ The outsourced software PES addressable market is expected to grow at a CAGR of ~13% against the overall outsourced PES addressable market growing at ~5% between 2016 and 2021
▪ Over the last decade, the advent of multiple disruptive technologies like AI/ML, Automation, IoT, Cloud, renders all technology created before 2010 to be “legacy”
▪ Ability to integrate and connect multiple technology stacks is central to modern enterprise IT systems
Industry 4.0 to drive digital product development for industrial IoT
▪ Driven by adaption of smart automation across industries, industrial IoT market is expected to increase from $161Bn in 2018 to $934Bn in 2025 at a CAGR of 29%
▪ This is expected to drive demand growth for development of industrial IoT platforms as well as the analytics stack on top of this over the next five years
Data driven customer centric organizations gaining dominance in the digital age
▪ Data creation has grown at a CAGR of >42% since 2015, reaching ~30ZB in 2019. This combined with advances in AI/ML technologies, make it a strategic imperative for new enterprise applications to be intelligent
▪ The need to translate brand promise to customer experience across channels has led to large services opportunity (ongoing convergence between marketing and technology)
M&A DEAL SUMMARY
MOVERS AND SHAKERS
REPRESENTATIVE TRADING COMPARABLES
ABOUT US
AVENDUS INSIGHTS –PES INDUSTRY OVERVIEW

615
600
552
499
483
400
374
350
350
200
175
150
150
120
50 250 450 650 850
EPAM Systems
Globant
Globallogic
Perficient
Beyondsoft
Persistent
Rocket Software
Endava
Harman OPD
Softserve
NessTechnologies
Ciklum
Cybage
Infogain
Accion Labs
2,166
23
Note: Logos mentioned in the pyramid are only a representative list and not exhaustive list of PES service providers1. LTM for listed players, latest available for unlisted ones; Source: Bloomberg, Avendus Research
(Revenue in $Mn1)
▪ Comprises pure-play outsourced software development players and large
diversified IT services providers
▪ Recently, ER&D majors (e.g. Alten, Altran) have been investing in this
market segment
▪ Similar profile as Tier 1 players albeit with a relatively
smaller revenue profile
▪ Pure play companies typically have higher growth rates
compared to peers
▪ Smaller-sized players focusing on
catering to certain select verticals,
geographies and/or service lines
▪ Most are pure-play outsourced
software development firms offering
niche products/solutions
Revenue>$500Mn
Revenue>$100–500Mn
Revenue<$100Mn
M&A DEAL SUMMARY
MOVERS AND SHAKERS
REPRESENTATIVE TRADING COMPARABLES
ABOUT US
AVENDUS INSIGHTS –PES INDUSTRY OVERVIEW
24
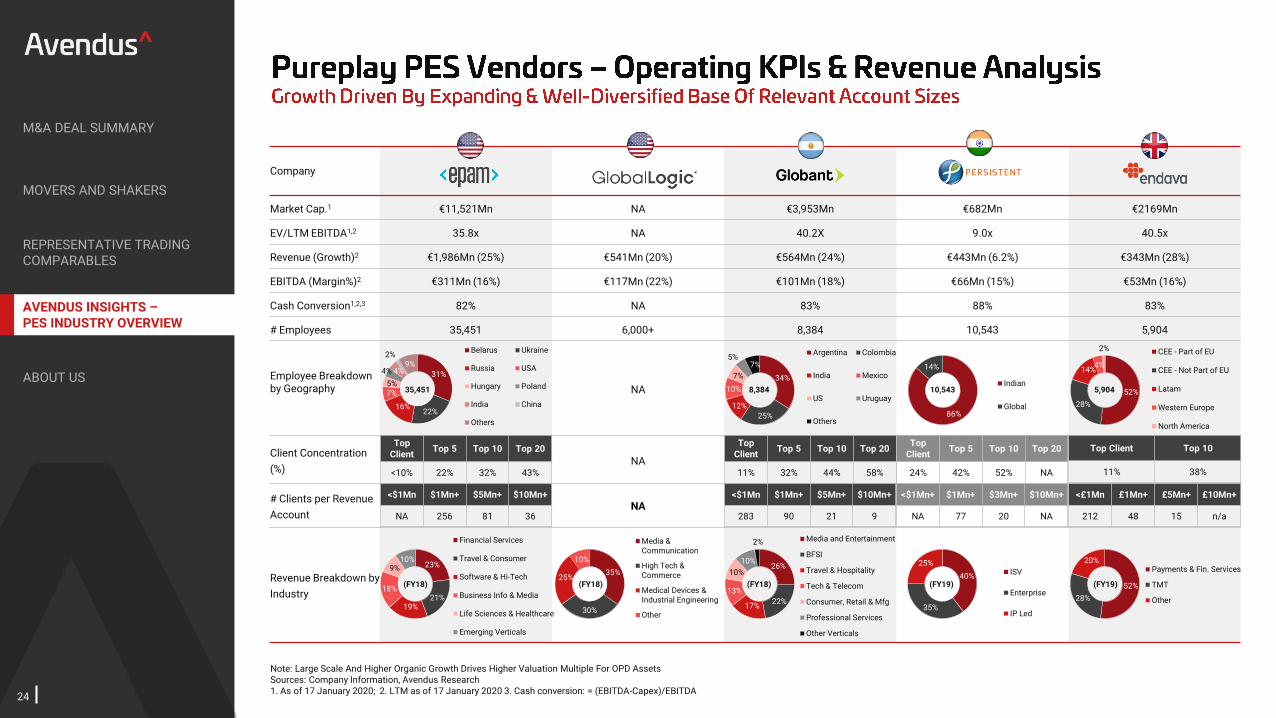
Note: Large Scale And Higher Organic Growth Drives Higher Valuation Multiple For OPD AssetsSources: Company Information, Avendus Research1. As of 17 January 2020; 2. LTM as of 17 January 2020 3. Cash conversion: = (EBITDA-Capex)/EBITDA
M&A DEAL SUMMARY
MOVERS AND SHAKERS
REPRESENTATIVE TRADING COMPARABLES
ABOUT US
AVENDUS INSIGHTS –PES INDUSTRY OVERVIEW
Company
Market Cap.1 €11,521Mn NA €3,953Mn €682Mn €2169Mn
EV/LTM EBITDA1,2 35.8x NA 40.2X 9.0x 40.5x
Revenue (Growth)2 €1,986Mn (25%) €541Mn (20%) €564Mn (24%) €443Mn (6.2%) €343Mn (28%)
EBITDA (Margin%)2 €311Mn (16%) €117Mn (22%) €101Mn (18%) €66Mn (15%) €53Mn (16%)
Cash Conversion1,2,3 82% NA 83% 88% 83%
# Employees 35,451 6,000+ 8,384 10,543 5,904
Employee Breakdown by Geography NA
Client Concentration
(%) NA
# Clients per Revenue
AccountNA
Revenue Breakdown by
Industry
Top Client Top 10
11% 38%
34%
25%
12%
10%
7%
5%7%
Argentina Colombia
India Mexico
US Uruguay
Others
8,384
31%
22%16%
7%5%
4% 4%
2%9%
Belarus Ukraine
Russia USA
Hungary Poland
India China
Others
35,451
86%
14%
Indian
Global
10,543 52%
28%
14%4%
2% CEE - Part of EU
CEE - Not Part of EU
Latam
Western Europe
North America
5,904
Top Client
Top 5 Top 10 Top 20
<10% 22% 32% 43%
26%
22%17%
13%
10%
10%
2% Media and Entertainment
BFSI
Travel & Hospitality
Tech & Telecom
Consumer, Retail & Mfg
Professional Services
Other Verticals
(FY18)
23%
21%19%
18%
9%10%
Financial Services
Travel & Consumer
Software & Hi-Tech
Business Info & Media
Life Sciences & Healthcare
Emerging Verticals
(FY18)40%
35%
25%ISV
Enterprise
IP Led
(FY19) 52%
28%
20%Payments & Fin. Services
TMT
Other
(FY19)
35%
30%
25%
10%
Media & Communication
High Tech & Commerce
Medical Devices & Industrial Engineering
Other
(FY18)
Top Client
Top 5 Top 10 Top 20
11% 32% 44% 58%
Top Client
Top 5 Top 10 Top 20
24% 42% 52% NA
<$1Mn $1Mn+ $5Mn+ $10Mn+
NA 256 81 36
<$1Mn $1Mn+ $5Mn+ $10Mn+
283 90 21 9
<$1Mn+ $1Mn+ $3Mn+ $10Mn+
NA 77 20 NA
<£1Mn £1Mn+ £5Mn+ £10Mn+
212 48 15 n/a

25
END-TO-END PRODUCT LIFECYCLE CAPABILITIES1
CONSULTATIVE APPROACH TO DRIVE BUSINESS IMPACT2
VERTICAL SPECIALIZATION3
ABILITY TO MINE HIGH-POTENTIAL ENTERPRISE ACCOUNTS4
INNOVATION MINDSET AND IP CREATION WITH FOCUS ON NEW-AGE TECHNOLOGIES5
RIGHT-SHORING: A CRITICAL SUCCESS FACTOR FOR COMPLEX PROJECTS6
These critical success factors are rapidly becoming
must-haves – while execution remains key, these
are relatively easier to achieve
Consultative capabilities are difficult to develop /
acquire, and even more difficult to integrate and
scale. This is a key differentiator that can help
create significant value
Accelerators & pre-packaged tools are increasingly
becoming a must-have and can create significant
value enabling both non-linear growth and higher
gross margins. That said, a very small percentage
of services companies have been successful in
developing revenue-generating products. Pursuing
the product route has typically resulted in a
sideways or downward financial trajectory for
services firms
M&A DEAL SUMMARY
MOVERS AND SHAKERS
REPRESENTATIVE TRADING COMPARABLES
ABOUT US
AVENDUS INSIGHTS –PES INDUSTRY OVERVIEW

26
Source: MergerMarkets and Avendus estimatesThe above analysis is based on 97 transactions tracked by Avendus from Sep 2015 onwards in PES space
2 3
68
12
16
21
25
1.2x2.3x 2.4x 2.2x
10.1x
13.6x11.9x
15.3x
2016 2017 2018 YTD 2019
PE Deals Strategic Deals
EV/Revenue EV/EBITDA
14
19
27
33
56%31%
8%5%
North America
Europe
Asia
Others
20%
13%
47%
15%
5% Vertical Focused Play
Delivery Geography
Capability Play
Scale
New Market Access
▪ Technology services vendors have been acquiring scale in PES services (e.g. DXC-Luxoft, Capgemini-
Altran, Cognizant-Softvision)
▪ PES vendors are doing tuck-ins to maintain competitive edge along the critical success factors (this is
bulk of the volume as shown in the next slide)
▪ Private equity firms are investing in $100m+ revenue platforms (e.g. Bain-Brillio, Warburg Pincus-
Indecomm) that can enable them to execute on a buy and build strategy
M&A DEAL SUMMARY
MOVERS AND SHAKERS
REPRESENTATIVE TRADING COMPARABLES
ABOUT US
AVENDUS INSIGHTS –PES INDUSTRY OVERVIEW

27
78%
20%3% Mergers & Acquisitions
PE Syndication
Structured Finance
72%
28%
Sellside Buyside
44%56%
Domestic
Cross-Border
Transactions
Deal Value
Professionals Globally
Has Acquired
UndisclosedAdvisor to: eInfochips
January 2018
Has Acquired
UndisclosedAdvisor to: LaserLine
July 2017
▪ Thought Leader: Cloud, Digital, Analytics, Software Development
▪ Relationship Network: Constant dialogue with 500+ firms and funds
▪ Theme Based Advisory: Identify future trends
▪ ~80% M&A vs. 20% Fund Raising
▪ Deal size: $50Mn–1.2Bn
▪ 60%+ Mandates Closed
Has Merged
UndisclosedAdvisor to: KPIT
January 2019
Has Acquired
$1.2BnAdvisor to: Patni
January 2011
Has Acquired
$536MnFinancial Advisor
July 2011
1. As of November 2019, by number of deals
▪ Unparalleled track record in
selling $50-500 Mn revenue
companies globally
▪ Global network of 250+
buyers across the US, EU,
China, Japan, and India
▪ Specialist in cross-border
transactions
▪ Raising capital of $50-
250Mn from PE funds
for mid-size tech
companies
▪ Network of over 500
funds globally
▪ Network to source
assets globally
▪ Represented some
of the leading
global buyers and
funds
M&A DEAL SUMMARY
MOVERS AND SHAKERS
REPRESENTATIVE TRADING COMPARABLES
ABOUT US
AVENDUS INSIGHTS –PES INDUSTRY OVERVIEW

28
Private Equity
UndisclosedAdvisor to ProdaptSeptember 2019
Private Equity
UndisclosedAdvisor to QBSS
October 2019
Has Acquired
UndisclosedAdvisor to: IGTJanuary 2019
Has merged with
UndisclosedAdvisor to: KPIT
Jan 2019
Private Equity
UndisclosedAdvisor to: MidEuropa
November 2018
Has Acquired
UndisclosedAdvisor to: CitiusTech
August 2018
Private Equity
UndisclosedAdvisor to: FPE
June 2018
Has Acquired
Undisclosed Advisor to: SCOPE
June 2018
Has Acquired
Undisclosed Advisor to: Runway
May 2018
Has Acquired
UndisclosedAdvisor to: TATA
April 2018
Has Acquired
UndisclosedAdvisor to: eInfochips
January 2018
Has Acquired
Undisclosed Advisor to: TAISTech
December 2016
Has Acquired
Undisclosed Advisor to: Lohika
August 2016
Has Acquired
$28MnAdvisor to: BSIL
January 2016
Has Acquired
$27MnAdvisor to: eClerx
April 2015
Private Equity
UndisclosedAdvisor to: Visionary
December 2017
Has Acquired
$202MnAdvisor to: MphasiS
December 2012
Has Acquired
$1.2BnAdvisor to: Patni
January 2011
Has Acquired
$536MnFinancial Advisor
July 2011
Has Acquired
$95MnAdvisor to: BornNovember 2019
Private Equity
UndisclosedAdvisor to: UST
June 2018
M&A DEAL SUMMARY
MOVERS AND SHAKERS
REPRESENTATIVE TRADING COMPARABLES
ABOUT US
AVENDUS INSIGHTS –PES INDUSTRY OVERVIEW

Avendus Capital Private Limited: CIN: U99999MH1999PTC123358 | SEBI Registration no.: Merchant Banking - INM000011021 | Avendus Wealth Management Private Limited: CIN: U67120MH2008PTC179931 | SEBIRegistration no.: PMS - INP000003625 | SEC - USA: CRD No. 156771 | Avendus Capital, Inc: FINRA-USA: CRD No. – 150160 | Avendus Capital(UK) Private Limited: Authorised and regulated by the Financial Conduct Authority(493919) | Avezo Advisors Pvt. Ltd.: CIN: U74120MH2014PTC255373 | SEBI Registration No. Portfolio Manager – INP000004607 | Manager to SEBI registered Category – I Alternative Investment Fund – Zodius TechnologyFund – IN/AIF1/14-15/0126 | Manager to SEBI registered Category III Alternative Investment Fund- Avendus India Opportunities Fund III – IN/AIF3/12-13/0033
IL&FS Financial Centre, C & D Quadrant – 6th Floor,Bandra-Kurla Complex, Bandra (East),Mumbai – 400 051, India
The Millenia Tower, A – 10th Floor, No 1 & 2,Murphy Road, UlsoorBengaluru – 560 008, India
Time Tower,901-B, M.G. Road, Gurgaon,Haryana – 122 002, India
PS Arcadia,7th Floor, Unit 7B, 4A,Camac Street,Kolkata – 700 016, India
Sahiti Sreshta, 1st Floor, Plot No. 1222,Road No. 36, Jubliee Hills,Hyderabad – 500 033, India
Regus Business Centre,Earth Arise, Unit No. 1101, 11th Floor, Sarkhej – Gandhinagar Highway, Makarba,Ahmedabad – 380 015, India
Redbrick Offices Limited,Level 5 & 6, The Pavilion, S B Road, Chaturshringi, Next to JW Marriott, Laxmi Society, Model Colony, Shivajinagar, Pune – 411 006, India
Avendus Capital (U.K.), Pvt. Ltd.33,St James's Square,London,SW1Y 4JS
Avendus Capital Inc., 445 Park Avenue, Suite 1900,New York,NY 10022
9, Temasek Boulevard#31-00Suntec Tower 2,Singapore,038989

This document is being furnished to you by Avendus Capital Private Limited for itself and its affiliates strictly on a confidential basis. The document is for informational purposes only and should not beregarded as an offer to sell, or offer for subscription, or as a solicitation of an offer to buy the securities or other investments mentioned in it. This information profile has been provided to its recipient uponthe express understanding that the information contained herein, or made available in connection with any further investigation, is strictly confidential and is intended for the exclusive use of its recipient. Itshall not be photocopied, reproduced and/or distributed to others at any time without prior written consent.
This document is neither a prospectus nor an invitation to subscribe to securities or other investments. Nothing in this document is intended to constitute legal, tax, securities or investment advice, oropinion regarding the appropriateness of any investment, or a solicitation for any product or service. The information herein is subject to change without notice. Avendus Capital Private Limited does notrepresent that any information, including any third party information, is accurate or complete and it should not be relied upon without proper investigation on the part of the investor/s.
Neither Avendus Capital Private Limited nor its affiliates nor any of its officers or employees accept any liability whatsoever for any direct or consequential loss arising from any use of this publication or itscontents. The recipient of the material should rely on their own investigations and take their own professional advice. While we endeavor to update on a reasonable basis the information discussed in thismaterial, there may be regulatory, compliance, or other reasons that prevent us from doing so.
Investments in securities/equity related instruments are subject to market risk. These risks could be security specific or market specific and arising from company, industry, political, economic (bothdomestic and global), etc, factors. Investor/s should carefully read all disclosure documents before investing and shall not make Avendus Capital Private Limited and/or its associates/employees liable forany risks/losses pertaining to any product/scheme offered by them from time to time.
Past performance does not indicate the future performance of any current or future fund or strategies advised or managed by Avendus Capital Private Limited or its affiliates.
Distribution of this document in some jurisdictions may be restricted or prohibited by law and regulation, and accordingly recipients of this document represent that they are able to receive it withoutcontravention of any unfulfilled registration requirements or any other legal or regulatory restrictions. Recipients of this document in such jurisdiction should fully inform themselves about and observe allapplicable legal or regulatory requirements and Avendus Capital Private Limited and its affiliates, directors, shareholders, managers, officers, employees, agents and advisors, do not accept any liability toany person in relation thereto.
For the purposes of distribution within the United Kingdom, this communication is exempt from the financial promotion restriction in Section 21 of the Financial Services and Markets Act, 2000 relating tothe communication of an invitation or inducement to engage in investment activity on the grounds that it is made to those persons falling within the following Articles of the Financial Services and MarketsAct 2000 (Financial Promotion) Order 2005, as amended: Article 19 (Investment Professionals) and Article 49 (High Net Worth Companies). Any investment to which this communication relates is onlyavailable to investment professionals and high net worth companies.
If you have received this document and you are not the person for whom it is intended, you should not rely on this communication or act on it.


