Download - de novo assembly - Evolution and Genomics

de novo assembly
Rayan Chikhi
CNRS
Workshop On Genomics - Cesky Krumlov - January 2015
1/75

YOUR INSTRUCTOR IS..
- CNRS researcher in Bioinformatics, France
- Postdoc at Penn State, USA
Research:- I’ve made software and methods for de novo assembly of short reads:
I MiniaI KmerGenieI DSK
- I’ve worked with biologists on real assembly projects
@RayanChikhi on Twitterhttp://rayan.chikhi.name
2/75

QUESTIONS TO THE AUDIENCE
- Already have data to assemble?
- Plans to sequence de novo?
- RNA-Seq?
- PacBio?
3/75
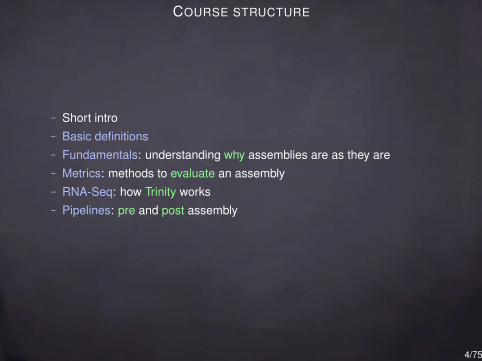
COURSE STRUCTURE
- Short intro
- Basic definitions
- Fundamentals: understanding why assemblies are as they are
- Metrics: methods to evaluate an assembly
- RNA-Seq: how Trinity works
- Pipelines: pre and post assembly
4/75
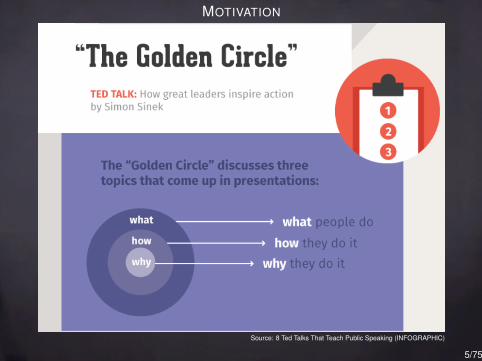
MOTIVATION
Source: 8 Ted Talks That Teach Public Speaking (INFOGRAPHIC)
5/75

THE "WHY"
- Create a reference genome / assemble a transcriptome
- Just interested in the genes
- Find novel insertions
- Make sense of un-mapped reads
- Discover SNPs on non-model organisms
- Validate breakpoints
- Recover a specific region of interest
- Explore metagenomics
- ..
6/75

"WHAT" AND "HOW" BASED ON "WHY"
Scenario 1:
What FASTA file containing "The Best Possible Assembly" ofbacteria X
How high-coverage coverage of PacBio
Why Obtain a reference geome
Scenario 2:
What FASTA file containing some draft assembly of organism X
How couple of Illumina lanes
Why A biological question: gene content? viral insertions?
7/75
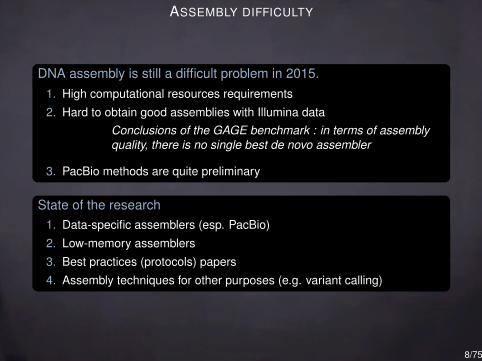
ASSEMBLY DIFFICULTY
DNA assembly is still a difficult problem in 2015.1. High computational resources requirements
2. Hard to obtain good assemblies with Illumina dataConclusions of the GAGE benchmark : in terms of assemblyquality, there is no single best de novo assembler
3. PacBio methods are quite preliminary
State of the research1. Data-specific assemblers (esp. PacBio)
2. Low-memory assemblers
3. Best practices (protocols) papers
4. Assembly techniques for other purposes (e.g. variant calling)
8/75

PLAN
What is a de novo assemblyDescriptionShort Exercise
Some useful assembly theoryGraphsContigs constructionExercise
How to evaluate an assemblyReference-free metricsExercise
Assembly softwareDNA-seq assemblyRNA-seq assemblyTipsExercise
9/75

Definition of an assembly (a trickier question than it seems)
Set of sequences which best approximate the original sequencedmaterial.
10/75
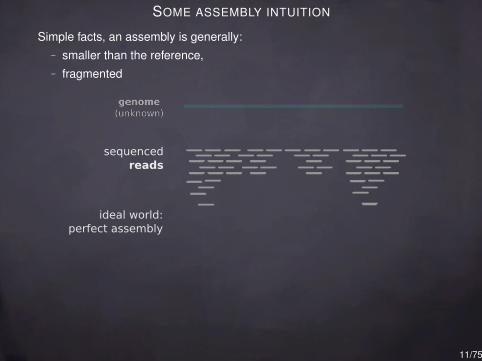
SOME ASSEMBLY INTUITION
Simple facts, an assembly is generally:
- smaller than the reference,
- fragmented
11/75
sequencedreads
ideal world: perfect assembly

SOME ASSEMBLY INTUITION
Simple facts, an assembly is generally:
- smaller than the reference,
- fragmented
11/75
missing readscreate gaps
sequencedreads
ideal world: perfect assembly

SOME ASSEMBLY INTUITION
Simple facts, an assembly is generally:
- smaller than the reference,
- fragmented
11/75
repeat repeat
repetitions fragment assemblies and
reduce total size
missing readscreate gaps
sequencedreads
ideal world: perfect assembly

Some vocabulary:
Read Any sequence that comes out of the sequencer
Paired read read1, gap ≤ 500 bp, read2
Mate-pair read1, gap ≥ 1 kbp, read2
Single read Unpaired read
k -mer Any sequence of length k
Contig gap-less assembled sequence
Scaffold sequence which may contain gaps (N)
12/75

EXERCISE
Here is a set of reads:
TACAGT
CAGTC
AGTCA
CAGA
1. How many k -mers are in these reads (including duplicates), for k = 3?
2. How many distinct k -mers are in these reads?I (i) for k = 2I (ii) for k = 3I (iii) for k = 5
3. It appears that these reads come from the (toy) genome TACAGTCAGA.What is the largest k such that the set of distinct k -mers in the genomeis exactly the set of distinct k -mers in the reads above?
4. For any value of k , is there a mathematical relation between N, thenumber of k -mers (incl. duplicates) in a sequence, and L, the length ofthat sequence?
13/75

EXERCISE (SOLUTION)
Here is a set of reads:
TACAGT
CAGTC
AGTCA
CAGA
1. How many k -mers are in these reads (including duplicates), for k = 3?12
2. How many distinct k -mers are in these reads?I (i) for k = 2 , 7I (ii) for k = 3 , 7I (iii) for k = 5 , 4
3. It appears that these reads come from the (toy) genome TACAGTCAGA.What is the largest k such that the set of distinct k -mers in the genomeis exactly the set of distinct k -mers in the reads above? 3; for k=4, TCAGdoes not appear in the reads
4. For any value of k , is there a mathematical relation between N, thenumber of k -mers (incl. duplicates) in a sequence, and L, the length ofthat sequence? N = L− k + 1
14/75

PLAN
What is a de novo assemblyDescriptionShort Exercise
Some useful assembly theoryGraphsContigs constructionExercise
How to evaluate an assemblyReference-free metricsExercise
Assembly softwareDNA-seq assemblyRNA-seq assemblyTipsExercise
15/75

GRAPHS
A graph is a set a nodes and a set of edges (directed or not).
a0
a1
a2
a3
a4
a5
a6
a7
16/75

GRAPHS FOR SEQUENCING DATA
Overlaps between reads is the fundamental information used to assemble.Graphs permit to represent these overlaps.
Two different types of graphs for sequencing data are known:
- de Bruijn graphs Used with Illumina data
- string graphs Used with PacBio and 454 data
A bioinformatician who knows those graphs will understand:
- how to set the parameters of an assembler
- the type of errors that assemblers make
- why assemblies do not retain variants
- why some heterozygous sites appear twice
17/75

DE BRUIJN GRAPHS
This is going to be fundamental for Illumina data. A de Bruijn graph for afixed integer k :
1. Nodes = all k-mers (k -length sub-strings) present in the reads.
2. For each (k + 1)-mer x present in the reads, there is an edge1 betweenthe k -mer prefix of x and the k -mer suffix of x .
Exemple for k = 3 and a single read:
ACTG
ACT CTG
1In this lecture, I am using the edge-centric de Bruijn graph definition. The node-centricdefinition is when edges correspond to exact (k − 1)-overlaps between nodes, and (k + 1)-mersare never considered.
18/75

DE BRUIJN GRAPHS
Example for many reads and still k = 3.
ACTG
CTGC
TGCT
ACT CTG TGC GCT
19/75

DE BRUIJN GRAPHS: REDUNDANCY
What happens if we add redundancy?
ACTG
ACTG
CTGC
CTGC
CTGC
TGCT
TGCT
dBG, k = 3:
ACT CTG TGC GCT
20/75
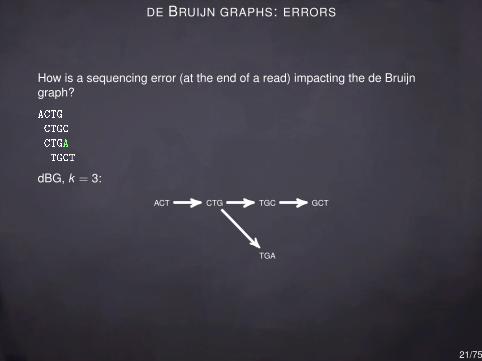
DE BRUIJN GRAPHS: ERRORS
How is a sequencing error (at the end of a read) impacting the de Bruijngraph?
ACTG
CTGC
CTGA
TGCT
dBG, k = 3:
ACT CTG TGC
TGA
GCT
21/75

DE BRUIJN GRAPHS: SNPS
What is the effect of a SNP (or a sequencing error inside a read) on thegraph?
AGTCTGA
AGTTTGA
dBG, k = 3:
AGT
GTC
GTT
TCT
TTT
CTG
TGA
TTG
TGA
22/75

DE BRUIJN GRAPHS: REPEATS
What is the effect of a small repeat on the graph?
ACTG
CTGC
TGCT
GCTG
CTGA
TGAT
dBG, k = 3:
ACT CTG TGC
GCTTGAGAT
23/75

STRING GRAPHS: OVERLAP GRAPHS
This is going to be fundamental for PacBio data. Definition of an overlapgraph. It is almost a string graph.
1. Nodes = reads.
2. Two nodes are linked by an edge if both reads overlap2.
Example for k = 3 and a single read:
ACTG
ACTG
2The definition of overlap is voluntarily fuzzy, there are many possible definitions.24/75
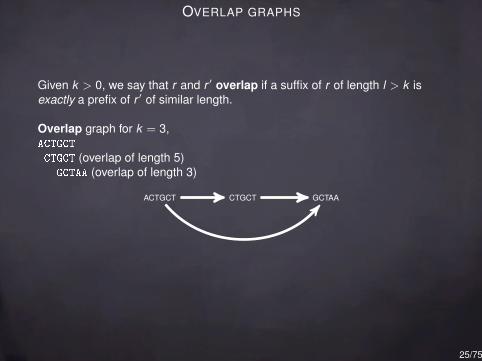
OVERLAP GRAPHS
Given k > 0, we say that r and r ′ overlap if a suffix of r of length l > k isexactly a prefix of r ′ of similar length.
Overlap graph for k = 3,ACTGCT
CTGCT (overlap of length 5)GCTAA (overlap of length 3)
ACTGCT CTGCT GCTAA
25/75

STRING GRAPHS: OVERLAP GRAPHS
A string graph is obtained from an overlap graph by removing redundancy:
- redundant reads (those fully contained in another read)
- transitively redundant edges(if a→ c and a→ b → c, then removea→ c)
26/75

FROM OVERLAP GRAPHS TO STRING GRAPHS
Overlap graph for k = 3,
ACTGCT CTGCT GCTAA
String graph for k = 3,
ACTGCT GCTAA
The read CTGCT is contained in ACTGCT, so it is redundant
27/75
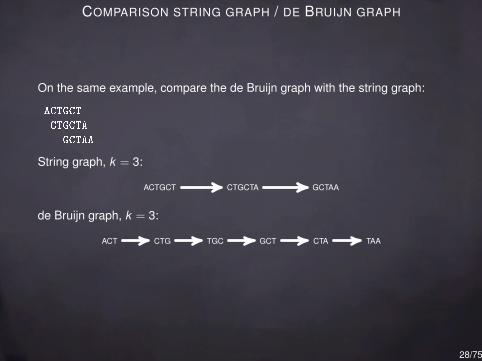
COMPARISON STRING GRAPH / DE BRUIJN GRAPH
On the same example, compare the de Bruijn graph with the string graph:
ACTGCT
CTGCTA
GCTAA
String graph, k = 3:
ACTGCT CTGCTA GCTAA
de Bruijn graph, k = 3:
ACT CTG TGC GCT CTA TAA
28/75

STRING GRAPH / DE BRUIJN GRAPH (2)
Let’s add an error:
ACTGCT
CTGATA
GCTAA
String graph, k = 3:
ACTGCT CTGATA GCTAA
de Bruijn graph, k = 3:
ACT CTG TGC GCT CTA TAA
TGA GAT ATA
29/75

STRING GRAPH / DE BRUIJN GRAPH (2)
How to "fix" the string graph?→ use a relaxed definition of overlaps.String graph where overlaps may ignore 1 error, k = 3:
ACTGCT CTGATA GCTAA
de Bruijn graph, k = 3:
ACT CTG TGC GCT CTA TAA
TGA GAT ATA
30/75

STRING GRAPH / DE BRUIJN GRAPH (3)
So, which is better?
- String graphs capture whole read information- de Bruijn graphs are conceptually simpler:
I single node lengthI single overlap definition
Historically, string graphs were used for long reads and de Bruijn graphs forshort reads.
For raw PacBio data, there are too many indels to input them to a stringgraph. The solution is to input corrected data.
31/75
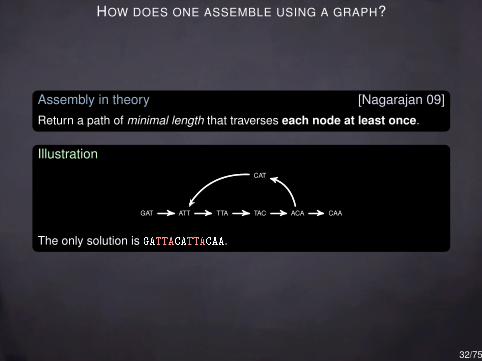
HOW DOES ONE ASSEMBLE USING A GRAPH?
Assembly in theory [Nagarajan 09]Return a path of minimal length that traverses each node at least once.
Illustration
GAT ATT TTA TAC
CAT
ACA CAA
The only solution is GATTACATTACAA.
32/75
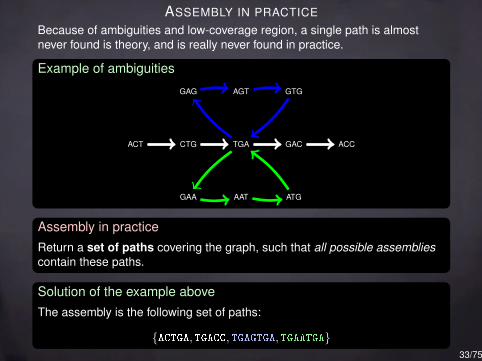
ASSEMBLY IN PRACTICEBecause of ambiguities and low-coverage region, a single path is almostnever found is theory, and is really never found in practice.
Example of ambiguities
ACT CTG TGA GAC ACC
GAA AAT ATG
GAG AGT GTG
Assembly in practiceReturn a set of paths covering the graph, such that all possible assembliescontain these paths.
Solution of the example aboveThe assembly is the following set of paths:
{ACTGA, TGACC, TGAGTGA, TGAATGA}33/75

CONTIGS CONSTRUCTION
Contigs construction from a graph (de Bruijn graph or string graph, samemethods).
The naive way is to enumerate all node-disjoint simple paths.
A simple path is a path where all internal nodes have one out-edge and onein-edge.
Node-disjoint means that two different paths cannot share a node.
(could also be done with edge-disjoint simple paths).
34/75

CONTIGS CONSTRUCTION EXAMPLE
dBG, k = 3:
ACT CTG TGC
GCTTGAGAT
Contigs:
CTGCTGTGATACT
35/75

CONTIGS CONSTRUCTION EXAMPLE
dBG, k = 3:
ACT CTG TGC
GCTTGAGAT
Contigs:
CTGCTGTGATACT
35/75

CONTIGS CONSTRUCTION EXAMPLE
dBG, k = 3:
ACT CTG TGC
GCTTGAGAT
Contigs:CTGCTG
TGATACT
35/75

CONTIGS CONSTRUCTION EXAMPLE
dBG, k = 3:
ACT CTG TGC
GCTTGAGAT
Contigs:CTGCTG
TGATACT
35/75

CONTIGS CONSTRUCTION EXAMPLE
dBG, k = 3:
ACT CTG TGC
GCTTGAGAT
Contigs:CTGCTGTGAT
ACT
35/75

CONTIGS CONSTRUCTION EXAMPLE
dBG, k = 3:
ACT CTG TGC
GCTTGAGAT
Contigs:CTGCTGTGATACT
35/75

HOW AN ASSEMBLER WORKS[HGAP, SPAdes, Velvet, ABySS, SOAPdenovo, SGA ..]
1) Maybe correct the reads. (SPAdes, HGAP, SGA)2) Construct a graph from the reads.
Assembly graph with variants & errors
3) Likely sequencing errors are removed.
3) Known biological events are removed.4) Finally, simple paths (i.e. contigs) are returned.
1 1 1 12
3
2
3
2
3
2
3
36/75

SHORT NOTE ON REVERSE COMPLEMENTS
Because sequencing isn’t strand-directed:
In assembly, we always identify a read with its reverse complement.
E.g: AAA = TTT, ATG = CAT
37/75

EXERCISE
In this exercise, for simplicity, ignore reverse complements.Reads:
TACAGT
CAGTC
AGTCAG
TCAGA
1. Construct the de Bruijn graph for k = 3.(Reminder: nodes are k -mers and edges correspond to (k + 1)-mers)
2. How many contigs can be created? (stopping at any branching)
3. At which value of k is there a single contig?
4. (optional) Find a mathematical relationship between ka, the smallestvalue of k for which a genome can be assembled into a single contig,and `r , the length of the longest exactly repeated substring in thatgenome.
38/75

EXERCISE (SOLUTION)In this exercise, for simplicity, ignore reverse complements.Reads:TACAGT
CAGTC
AGTCAG
TCAGA
1. Construct the de Bruijn graph for k = 3.The 3-mers (nodes) are: TAC, ACA, CAG, AGT, GTC, TCA, AGAThe 4-mers (edges) are: TACA, ACAG, CAGT, AGTC, GTCA, TCAG,CAGA
TAC ACA CAG AGT GTC TCA
AGA
2. How many contigs can be created? (stopping at any branching) 33. At which value of k is there a single contig? 44. Find a mathematical relationship between ka, the smallest value of k for
which a genome can be assembled into a single contig, and `r , thelength of the longest exactly repeated substring in that genome.ka = `r + 1
39/75

PLAN
What is a de novo assemblyDescriptionShort Exercise
Some useful assembly theoryGraphsContigs constructionExercise
How to evaluate an assemblyReference-free metricsExercise
Assembly softwareDNA-seq assemblyRNA-seq assemblyTipsExercise
40/75

METRICS
Preamble: There is no trivial total order (i.e. ranking) betweenassemblies.
Why? > 2 independent criteria to optimize (e.g., total length, andaverage size of assembled sequences)
Example Would you rather have an assembly with good coverage andshort contigs, or an assembly with mediocre coverage andlong contigs?
41/75

OVERVIEW OF REFERENCE-FREE METRICS
Assume you have no close reference genome available.Metrics serve two purposes:
1. Individually evaluate a single assembly
2. Compare several assemblies made from different parameters orassemblers
Classical metrics:- Number of contigs/scaffolds
- Total length of the assembly
- Length of the largest contig/scaffold
- Percentage of gaps in scaffolds (’N’)
- N50/NG50 of contigs/scaffolds
- Number of predicted genes
- Number of core genes [CEGMA]
An easy tool to compute most of these is QUAST:
./quast.py assembly.fa
Recent assembly metrics are mostly based on:
- internal consistency
- likelihood of an assembly given the reads
42/75

REFERENCE-FREE METRICS: N50N50 = Largest contig lengthat which longer contigs cover50% of the total assemblylength
NG50 = Largest contiglength at which longer con-tigs cover 50% of the totalgenome length
If you didn’t know N50, write down the definition, there will be an exercise !
A practical way to compute N50:- Sort contigs by decreasing lengths- Take the first contig (the largest): does it cover 50% of the assembly?- If yes, its length is the N50 value.- Else, consider the two largest contigs, do they cover 50%?- If yes, then the N50 is the length of the second largest contig.- And so on..
43/75

INTERNAL CONSISTENCY
Rarely appears in assembly articles but almost the only way to detect errorsin de novo assemblies.
Internal consistency : Percentage of paired reads correctly aligned back tothe assembly (happy pairs).
Can also pinpoint certain misassemblies (mis-joins).Recent tools:
- REAPR3 [M Hunt, .. (Gen. Biol.) 2013]
- FRCurve4 [F. Vezzi, .. (Plos One) 2013]
3Google: REAPR assembly4Google: FRCurve
44/75

INTERNAL CONSISTENCY: EXAMPLE
Hawkeye software
45/75

ASSEMBLY LIKELIHOOD (1)
Principle: for an assembly A and a set of reads R,
L(A|R) = P(R|A) =∏
i
P(ri |A)
Where each p(ri |A),- is the probability that the read ri is sequenced if the genome was A.
- In practice, p(ri |A) can be estimated by aligning ri to the assembly.
Recent software:
- ALE [S. Clark, .. (Bioinf.) 2013]
- CGAL [A. Rahman, .. (Gen. Biol.) 2013]
- a third one from M. Pop’s group
46/75

ASSEMBLY LIKELIHOOD (2)
From my exp., ALE is easier to use/faster, but still not fully automated (needsyou to pre-align the reads).
./ALE reads_aligned_to_assembly.sam assembly.fa
Returns:
ALE_score: -194582491.814571
47/75

ASSEMBLY LIKELIHOOD (3)
(higher likelihood is better)
Likelihood-based metrics are comparative; i.e. computing them for a singleassembly would be meaningless.
48/75
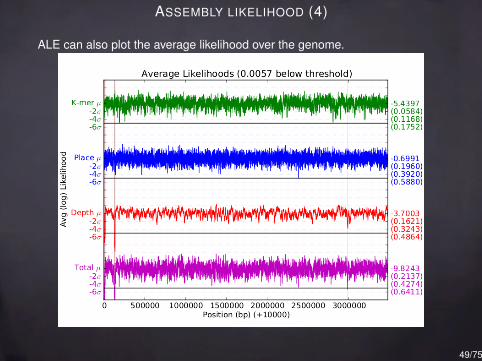
ASSEMBLY LIKELIHOOD (4)
ALE can also plot the average likelihood over the genome.
49/75

SUMMARY
Google ’assembly uncertainty’ for a nice summary, blog post by LexNederbragt.In summary:
- No total order for metrics
- Use QUAST
- Use CEGMA
- Try ALE
I am unsure if likelihood-based metrics are very robust indicators, might favorhigh-coverage assemblies..
50/75

EXERCISE
At some point in life, one may need to compare assemblies.
Here are two assemblies, aligned to the same reference:
- For each, compute the following metrics:I Total size of the assembly, N50, NG50 (bp)I Coverage (%)
- Which one is better than the other?51/75
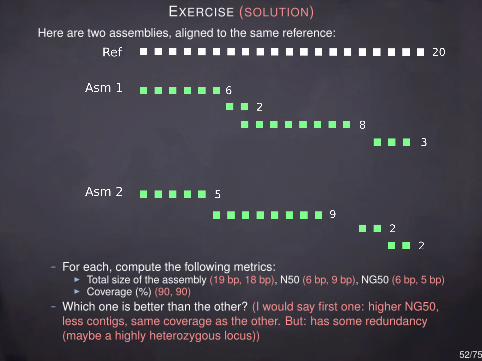
EXERCISE (SOLUTION)Here are two assemblies, aligned to the same reference:
- For each, compute the following metrics:I Total size of the assembly (19 bp, 18 bp), N50 (6 bp, 9 bp), NG50 (6 bp, 5 bp)I Coverage (%) (90, 90)
- Which one is better than the other? (I would say first one: higher NG50,less contigs, same coverage as the other. But: has some redundancy(maybe a highly heterozygous locus))
52/75

PLAN
What is a de novo assemblyDescriptionShort Exercise
Some useful assembly theoryGraphsContigs constructionExercise
How to evaluate an assemblyReference-free metricsExercise
Assembly softwareDNA-seq assemblyRNA-seq assemblyTipsExercise
53/75

LANDSCAPE OF ASSEMBLERS
- Before the Illumina Hi-Seq: 454 (Newbler), Illumina reads < 100 bp (anyde Bruijn graph assembler).
- newer Illumina: 200-500 bp reads (when merged), high coverage, matepairs: grey area for assembly software.
- PacBio: > 2 kbp reads, low coverage: Gaining momentum for DNA-seq.Do not use a de Bruijn graph assembler. Use any string graphassembler (with pre-assembly error-correction).
54/75

PERSONAL EXPERIENCE (FOR ILLUMINA ASSEMBLY)
Your data follows the Broad recipe Allpaths-LG
Small (meta)genome SPAdes
To get a second opinion SOAPdenovo2
If not enough memory Minia
454 Newbler
PacBio HGAP
RNA-Seq Trinity
Large metagenome Megahit
55/75

RNA-SEQ AND ASSEMBLY
Goal: reconstruct mRNA sequences
56/75

RNA-SEQ ASSEMBLY
- Short contigs average mRNA length: 2 kbp
- Uneven coverage varying expression levels
- Contigs are re-used alternative splicing
57/75

RNA-SEQ ASSEMBLY
Despite these differences, DNA-seq assembly methods apply:
- Construct a de Bruijn graph (same as DNA)
- Output contigs (same as DNA)
- Allow to re-use the same contig in many different transcripts (new part)
58/75

RNA-SEQ ASSEMBLY: TRINITY
Quick overview of Trinity steps:
- Inchworm
- Chrysalis
- Butterfly
59/75

RNA-SEQ ASSEMBLY: TRINITY
- Inchworm de Bruijn graph construction, part 1
- Chrysalis de Bruijn graph construction, part 2, then partitioning
- Butterfly Graph traversal using reads, isoforms enumeration
60/75

RNA-SEQ ASSEMBLY: TRINITY - 1
- Inchworm - de Bruijn graph construction, part 1
Using k-mers, construct contigs carelessly.
Contigs might correspond to the most abundant isoform, but no guarantee.
61/75

RNA-SEQ ASSEMBLY: TRINITY - 2- Chrysalis - de Bruijn graph construction, part 2, then reads partitioning
By overlapping Inchworm contigs, construct the true de Bruijngraph.
Then,Partition the graph and output the reads aligning to each partition.
62/75
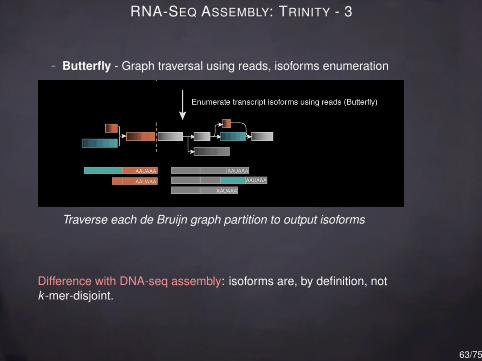
RNA-SEQ ASSEMBLY: TRINITY - 3
- Butterfly - Graph traversal using reads, isoforms enumeration
Traverse each de Bruijn graph partition to output isoforms
Difference with DNA-seq assembly: isoforms are, by definition, notk -mer-disjoint.
63/75

ASSEMBLY PIPELINES
No Adapters
Correction
Scaffolder
Gapfiller
Annotation
KmerGeniePreQC
Diginorm
Assembler
64/75

INITIAL STEPS
No Adapters
Correction
Scaffolder
Gapfiller
Annotation
KmerGeniePreQC
Diginorm
Assembler
A good assembly is typically done with severalpre-correction stages:
- low-quality reads removal
- trimming
- overlapping paired reads merged into singlereads
65/75

ERROR CORRECTION
No Adapters
Correction
Scaffolder
Gapfiller
Annotation
KmerGeniePreQC
Diginorm
Assembler
Error-correction generally improves Illuminaassemblies.It is mandatory (and automatic) for PacBio data.For Illumina:
- SPAdes does it automatically
- For larger genomes, Allpaths-LG stand-aloneerror corrector (highly recommended)
- SOAPdenovo stand-alone corrector
- Quake
In my experience, with high-coverage data, findinggood parameters for the assembler achievessimilar effects as error correction.
66/75

THE k PARAMETER (ILLUMINA)
No Adapters
Correction
Scaffolder
Gapfiller
Annotation
KmerGeniePreQC
Diginorm
Assembler
The optimal k -mer size varies with each dataset.
A few things to keep in mind:
- Low limit: For common genomes sizes (10Mbp - 1 Gbp), there is a high chance that any≈ 12-mer will be repeated in many locations(412 = 16 · 106 ).
- High limit: Read length
- Ideally, you want to set k as high as possible,such that, in the reads, non-erroneousk -mers are present significantly more thanerroneous k -mers.
- Practically try at least two k values (e.g.31, 61).
- My tool KmerGenie can help choose k . JaredSimpson’s PreQC does pre-assembly qualitycontrol.
67/75

SCAFFOLDERS
No Adapters
Correction
Scaffolder
Gapfiller
Annotation
KmerGeniePreQC
Diginorm
Assembler
(Not for RNA-Seq)Scaffolding is the step that maps paired reads tocontigs to order them.
Most assemblers include a scaffolder(SOAPdenovo2, SGA, ABySS, Velvet, Newbler..).
Scaffolding is where most assembly errors arelikely to be made.
For better assemblies, you may try to:
- Use another assembler’s scaffolder(SOAPdenovo2’s)
- Use a stand-alone scaffolders (e.g. SSPACE,BESST, Bambus 2, Opera, etc..)
- Simply skip scaffolding, sometimes contigsare good enough.
SSPACE is easy to use:
perl SSPACE_Basic_v2.0.pl \
-l small_config_file.txt -s assembly.fa
68/75

GAPFILLERS
No Adapters
Correction
Scaffolder
Gapfiller
Annotation
KmerGeniePreQC
Diginorm
Assembler
(Not for RNA-Seq)Gap-filling is the step that fills the gaps insidescaffolds.
Gap-filling can increase contigs length by an orderof magnitude. But mistakes may happen at shorttandem repeats.
Few assemblers include a gap-filler(SOAPdenovo2, Allpaths-LG).
- SOAPdenovo2 GapCloser can be usedstandalone, Allpaths not.
- Other stand-alone gap-fillers (GapFiller,FinIS) have limitations.
GapCloser is quite easy to use:
./GapCloser -b soap_config_file \
-a contigs.fa -o scaffolds
69/75

TO CREATE A DRAFT GENOME FROM SHORT READS
My recommendations:
1. Sequencing strategies:I Broad recipe (many Illumina libraries)I PacBio high coverage
2. Read either the GAGE paper, GAGE-B (Illumina, bacteria),Assemblathon 2 (large genomes), HGAP paper (PacBio, bacteria), orTwitter/blogs (PacBio assembly)
3. Pick one (two is better) assemblers from the papers above
4. Run each assembler with several sets of parameters
5. Run a program to compare these assemblies
70/75

LAST EXERCISE
Reads:
1. AGTC
2. TCAA
3. AATT
4. GTCT
5. TATT
6. TCTA
7. TCAA
8. TCTA
1. Assemble these reads
2. What was special about this genome?
71/75

LAST EXERCISE (DETAILED SOLUTION)Step by step:
- Choose an assembly model: de Bruijn graph or string graph- The reads are short, let’s choose the de Bruijn model- Choose a k-mer size:- Tempting to use k = 3, as it is the highest value such that (k + 1)-mers
exist in the reads. However, to obtain a good assembly, all 4-mers fromthe (unknown) sequenced genome need to be seen in the reads. Takefor instance the 3-mer CAA, there is no 4-mer starting with it, so onecould guess that coverage is insufficient. Hence, let’s pick a smaller k,k = 2.
- The nodes of the graph are all the distinct 2-mers in the reads: AG, GT,TC, CT, TA, CA, AA, AT, TT, GT
- The edges of the graph are all the distinct 3-mers in the reads: AGT,GTC, TCA, CAA, AAT, ATT, TCT, TAT, CTA
- Those last two pieces of information are sufficient to draw the graph:
AG GT TC
CT
CA AA
AT
TA
TT
72/75

LAST EXERCISE (DETAILED SOLUTION)
Just out of curiosity, let’s draw the de Bruijn graph for k = 3:
- The nodes of the graph are all the distinct 3-mers: AGT, GTC, TCA,CAA, AAT, ATT, TCT, TAT, CTA
- The edges of the graph are all the distinct 4-mers (here, the distinctreads): AGTC. TCAA, AATT, GTCT, TATT, TCTA
- We have less edges than nodes, so clearly the read coverage is notsufficient for the graph to be connected.
AGT GTC
TCA CAA AAT
ATT
TCT CTA TAT
73/75

LAST EXERCISE (DETAILED SOLUTION)
AG GT TC
CT
CA AA
AT
TA
TT
- To assemble this graph, using the contigs construction used before,there would be 4 contigs. Depending on where one includes branchingk-mers (TC, AT) in contigs, a possible solution is: AGTC, CTA, CAA, ATT.
- But we can actually do better. There are two ways to traverse this graph,yielding an assembly of two haplotypes:AGTCAATT
AGTCTATT
- This could be a tiny diploid genome with an heterozygous SNP. Thebubble is unlikely to be a sequencing error, as I have purposely addedreads 7 and 8, to have larger coverage in both paths of the bubble. If itwas a sequencing error, one of the paths would typically have lowcoverage.
- An assembler would collapse this bubble and output only one of the twohaplotypes.
74/75
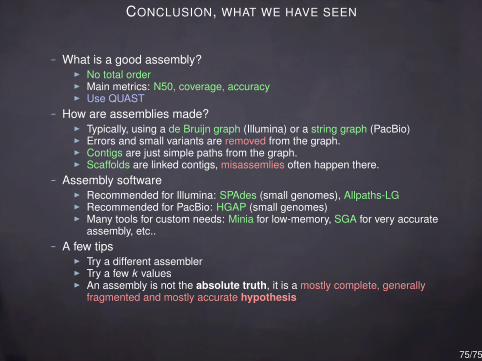
CONCLUSION, WHAT WE HAVE SEEN
- What is a good assembly?I No total orderI Main metrics: N50, coverage, accuracyI Use QUAST
- How are assemblies made?I Typically, using a de Bruijn graph (Illumina) or a string graph (PacBio)I Errors and small variants are removed from the graph.I Contigs are just simple paths from the graph.I Scaffolds are linked contigs, misassemlies often happen there.
- Assembly softwareI Recommended for Illumina: SPAdes (small genomes), Allpaths-LGI Recommended for PacBio: HGAP (small genomes)I Many tools for custom needs: Minia for low-memory, SGA for very accurate
assembly, etc..- A few tips
I Try a different assemblerI Try a few k valuesI An assembly is not the absolute truth, it is a mostly complete, generally
fragmented and mostly accurate hypothesis
75/75


