
© 2015, Amazon Web Services, Inc. or its Affiliates. All rights reserved.
Adam Savitzky, Yahoo!
Tina Adams, AWS
October 2015
DAT308
How Yahoo! Analyzes Billions of Events with
Amazon Redshift

Fast, simple, petabyte-scale data warehousing for $1,000/TB/Year
Amazon Redshift a lot faster
a lot cheaper
a lot simpler
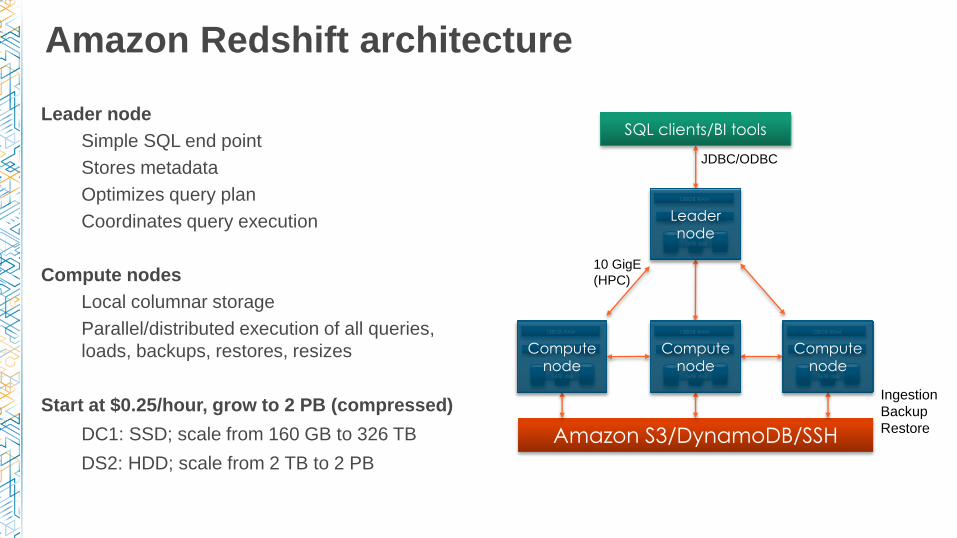
Amazon Redshift architecture
Leader node
Simple SQL end point
Stores metadata
Optimizes query plan
Coordinates query execution
Compute nodes
Local columnar storage
Parallel/distributed execution of all queries,
loads, backups, restores, resizes
Start at $0.25/hour, grow to 2 PB (compressed)
DC1: SSD; scale from 160 GB to 326 TB
DS2: HDD; scale from 2 TB to 2 PB
10 GigE
(HPC)
Ingestion
Backup
Restore
JDBC/ODBC
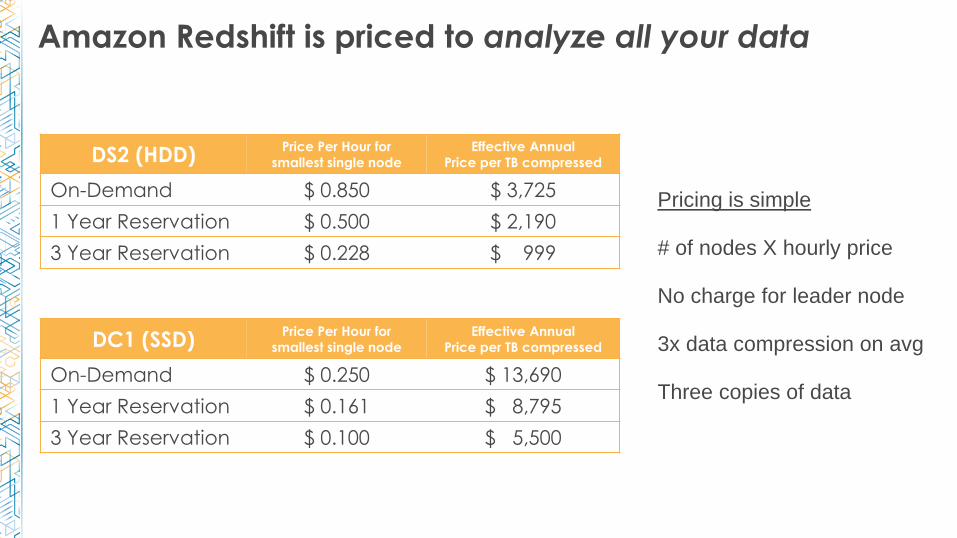
Amazon Redshift is priced to analyze all your data
Pricing is simple
# of nodes X hourly price
No charge for leader node
3x data compression on avg
Three copies of data
DS2 (HDD)Price Per Hour for
smallest single node
Effective Annual
Price per TB compressed
On-Demand $ 0.850 $ 3,725
1 Year Reservation $ 0.500 $ 2,190
3 Year Reservation $ 0.228 $ 999
DC1 (SSD)Price Per Hour for
smallest single node
Effective Annual
Price per TB compressed
On-Demand $ 0.250 $ 13,690
1 Year Reservation $ 0.161 $ 8,795
3 Year Reservation $ 0.100 $ 5,500
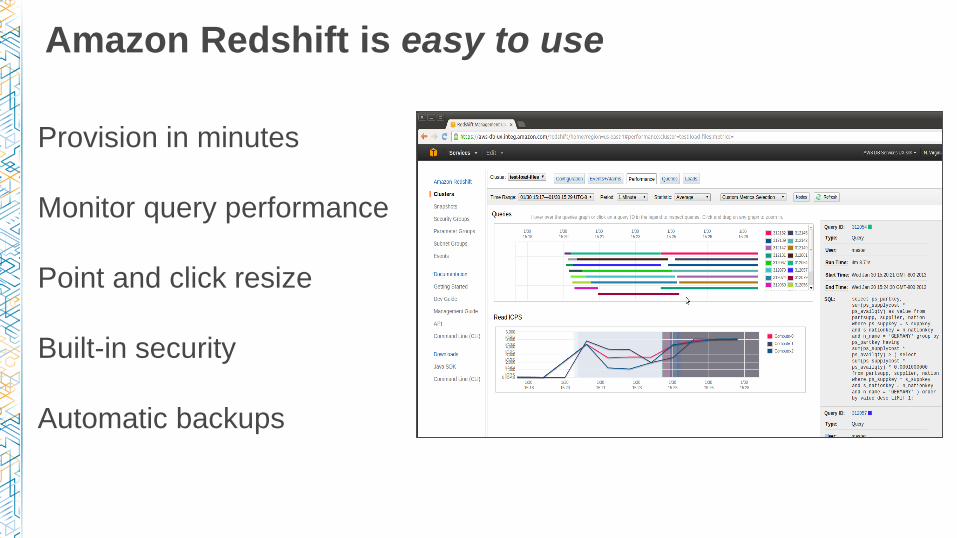
Amazon Redshift is easy to use
Provision in minutes
Monitor query performance
Point and click resize
Built-in security
Automatic backups
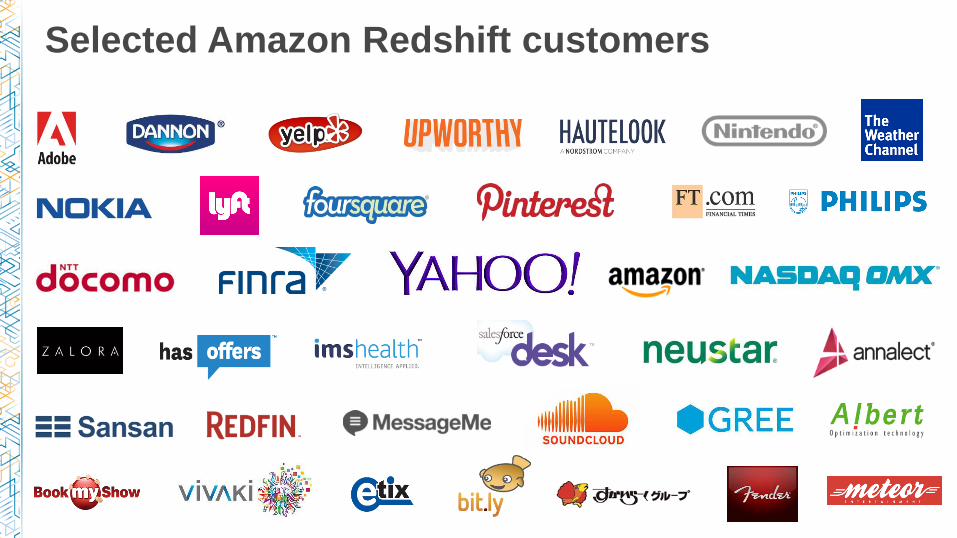
Selected Amazon Redshift customers

Analytics at Yahoo

What to expect from the session
• What does analytics mean for Yahoo?
• Learn how our extract, transform, load (ETL) process runs
• Learn about our Amazon Redshift architecture
• Do’s, don’ts, and best practices for working with
Amazon Redshift
• Deep dive into advanced analytics, featuring how we
define and report user retention

Setting the stage
“We are returning an iconic company
to greatness.”—Marissa Mayer
Guiding principles

Guiding principles
“You can’t grow a product that hasn’t
reached product market fit.”—Arjun Sethi, @arjset

Guiding principles
Analytics is critical for growth

Overall volume
0
10
20
30
40
50
60
70
80
90
Yahoo Events Auto MilesDriven
GoogleSearches
McDonald'sFries Served
Babies Born
Billi
on
s
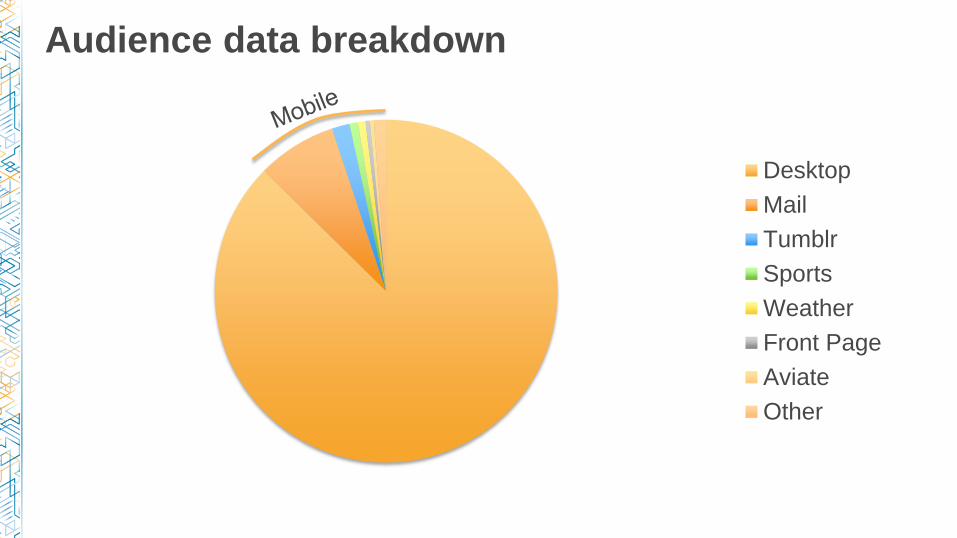
Audience data breakdown
Desktop
Tumblr
Sports
Weather
Front Page
Aviate
Other

Hadoop
Clusters Nodes Data centers Data
14 42,000 3 500 PB
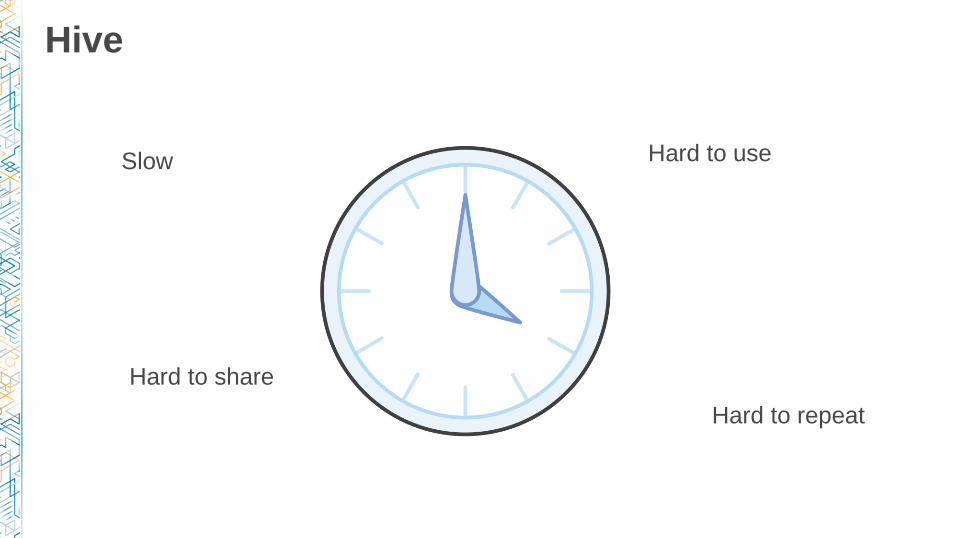
Hive
Slow Hard to use
Hard to share
Hard to repeat

Hive

And many others…

Benchmarks (lower is better)
1
10
100
1000
10000
CountDistinctDevices
Count AllEvents
FilterClauses
Joins
Seco
nd
s
Amazon Redshift
Vertica
Impala

Amazon Redshift at Yahoo
Nodes Events per Day Queries per Day Data
21dc1.8xl 2B 1,200 27TB

Architecture

Extract, transform, load (ETL)
Hadoop • Pig
S3 • Airflow
Amazon Redshift
• Looker
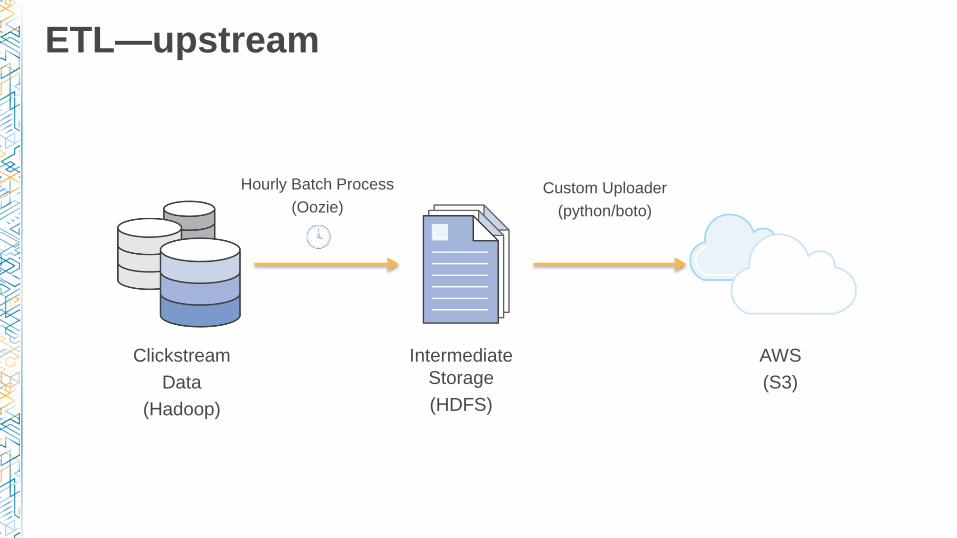
ETL—upstream
Clickstream
Data
(Hadoop)
Intermediate
Storage
(HDFS)
AWS
(S3)
Hourly Batch Process
(Oozie)
Custom Uploader
(python/boto)
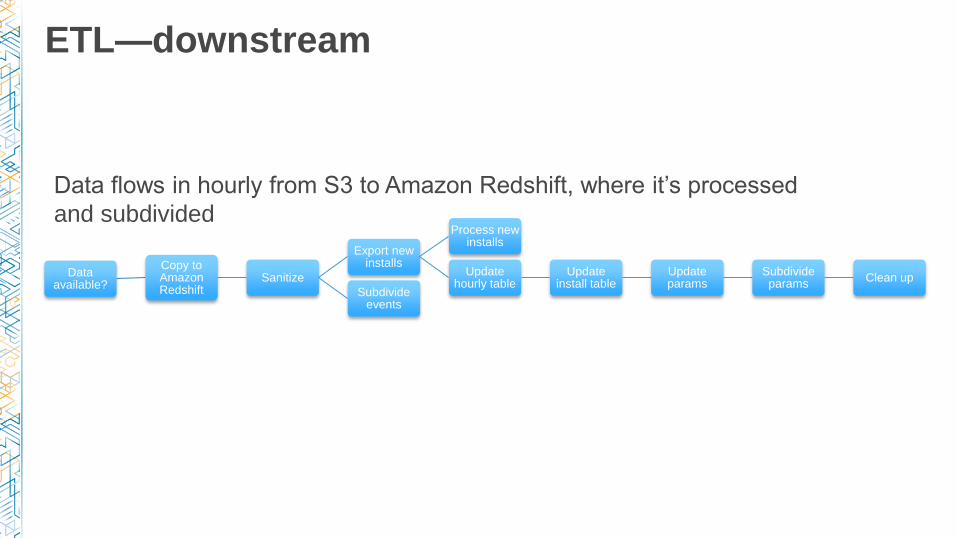
ETL—downstream
Data available?
Copy to Amazon Redshift
Sanitize
Export new installs
Process new installs
Update hourly table
Update install table
Update params
Subdivide params
Clean up
Subdivide events
Data flows in hourly from S3 to Amazon Redshift, where it’s processed
and subdivided
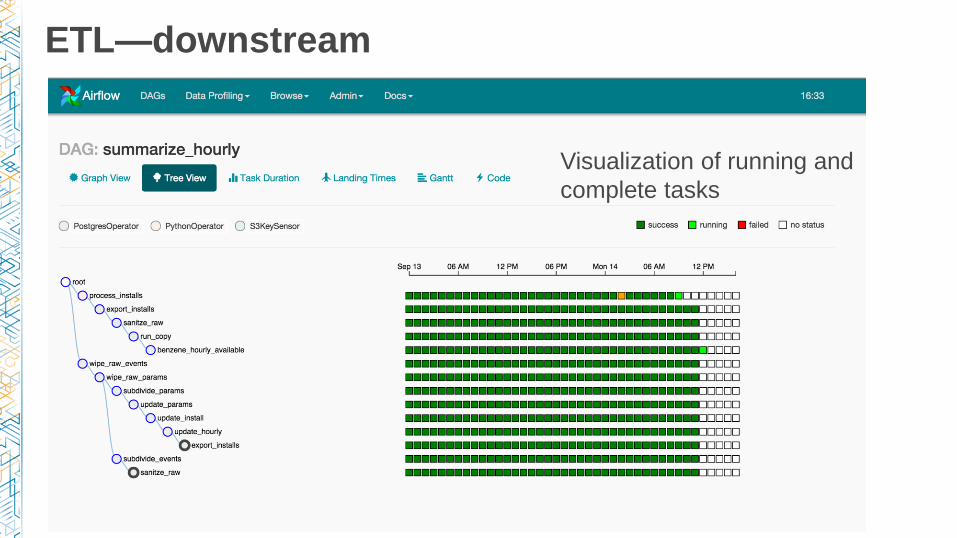
ETL—downstream
Visualization of running and
complete tasks
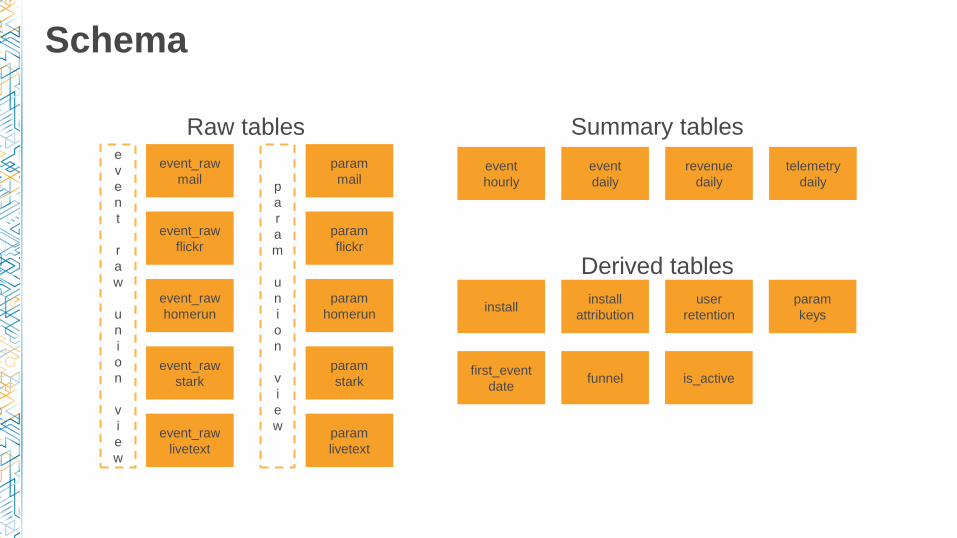
Schema
event_raw
mailevent
hourly
event
daily
installinstall
attribution
event_raw
flickr
event_raw
homerun
event_raw
stark
event_raw
livetext
e
v
e
n
t
r
a
w
u
n
i
o
n
v
i
e
w
user
retention
funnelfirst_event
date
param
param
flickr
param
homerun
param
stark
param
livetext
p
a
r
a
m
u
n
i
o
n
v
i
e
w
is_active
param
keys
telemetry
daily
revenue
daily
Raw tables Summary tables
Derived tables
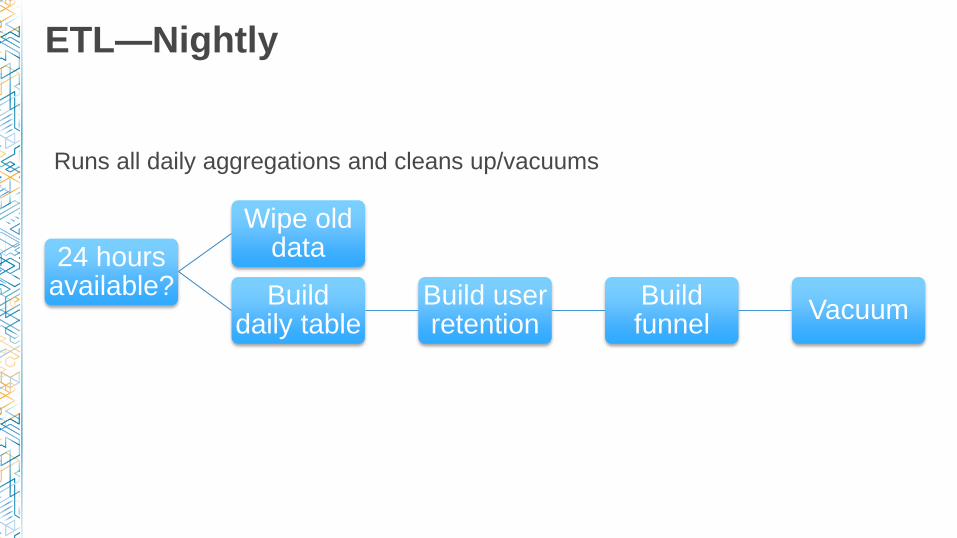
ETL—Nightly
24 hours available?
Wipe old data
Build daily table
Build user retention
Build funnel
Vacuum
Runs all daily aggregations and cleans up/vacuums

Do’s and don’ts
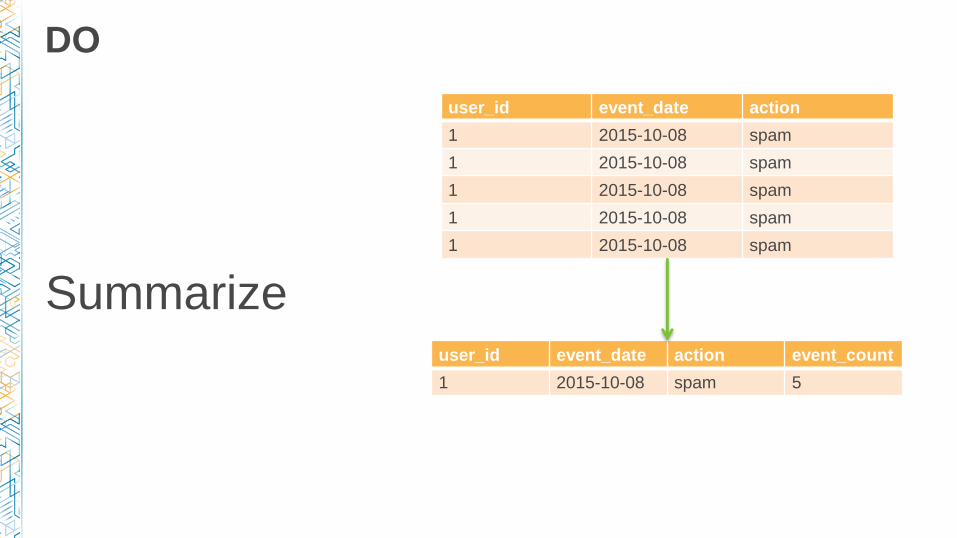
DO
Summarize
user_id event_date action
1 2015-10-08 spam
1 2015-10-08 spam
1 2015-10-08 spam
1 2015-10-08 spam
1 2015-10-08 spam
user_id event_date action event_count
1 2015-10-08 spam 5
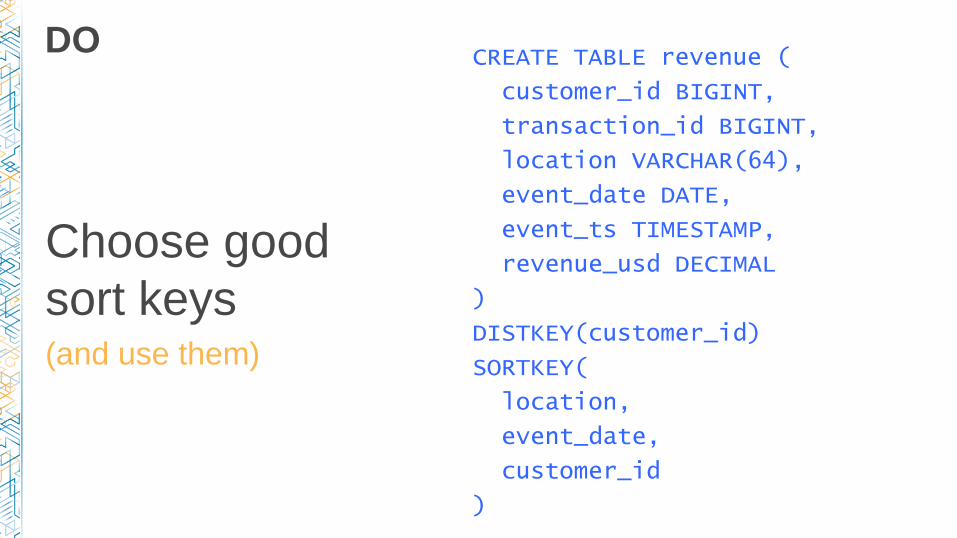
DO
Choose good
sort keys (and use them)
CREATE TABLE revenue (
customer_id BIGINT,
transaction_id BIGINT,
location VARCHAR(64),
event_date DATE,
event_ts TIMESTAMP,
revenue_usd DECIMAL
)
DISTKEY(customer_id)
SORTKEY(
location,
event_date,
customer_id
)

DO
Vacuum nightly(or weekly and tell people you do it nightly)
DO
Avoid joinswhere possible—and learn mitigation strategies for when
you must join
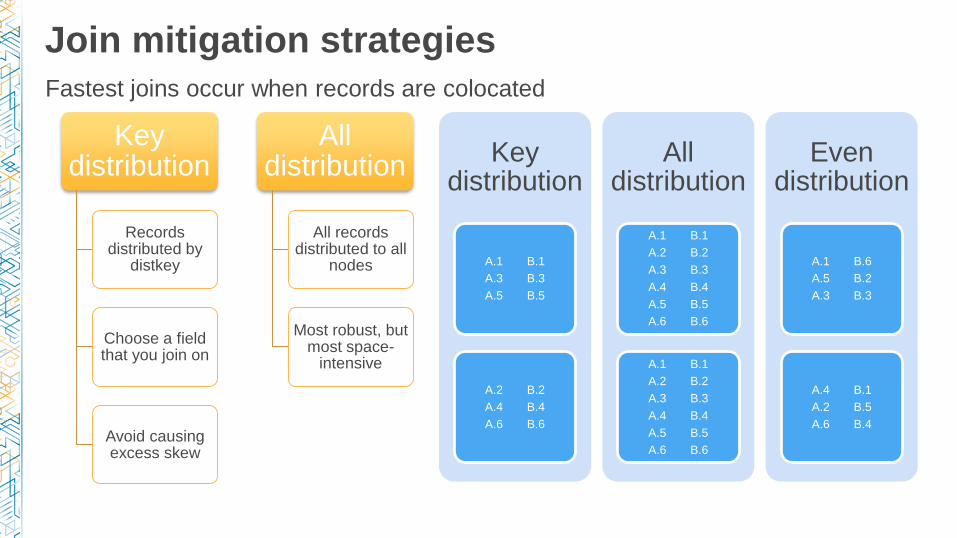
Join mitigation strategies
Key distribution
Records distributed by
distkey
Choose a field that you join on
Avoid causing excess skew
All distribution
All records distributed to all
nodes
Most robust, but most space-
intensive
Fastest joins occur when records are colocated
Key distribution
A.1 B.1
A.3 B.3
A.5 B.5
A.2 B.2
A.4 B.4
A.6 B.6
All distribution
A.1 B.1
A.2 B.2
A.3 B.3
A.4 B.4
A.5 B.5
A.6 B.6
A.1 B.1
A.2 B.2
A.3 B.3
A.4 B.4
A.5 B.5
A.6 B.6
Even distribution
A.1 B.6
A.5 B.2
A.3 B.3
A.4 B.1
A.2 B.5
A.6 B.4

DO
Automate

DON’T
Fill the cluster(leave more than you think)

DON’T
Run ETL in the default queueWorkload management (WLM) is your friend

Example WLM configuration
Queue Concurrency User Groups Timeout (ms) Memory (%)
1 1 etl 50
2 10 60,000 50
Two queues: ETL and ad hoc
Purpose: Insulate normal users from ETL and free up plenty of memory for big
batch jobs

DON’T
Use CREATE TABLE ASFor permanent tables

DON’T
Email SQL aroundFind a good reporting tool
Deep dive: user retention

User retention is…
User retention is…
The most important* quality metric for
your product* kinda
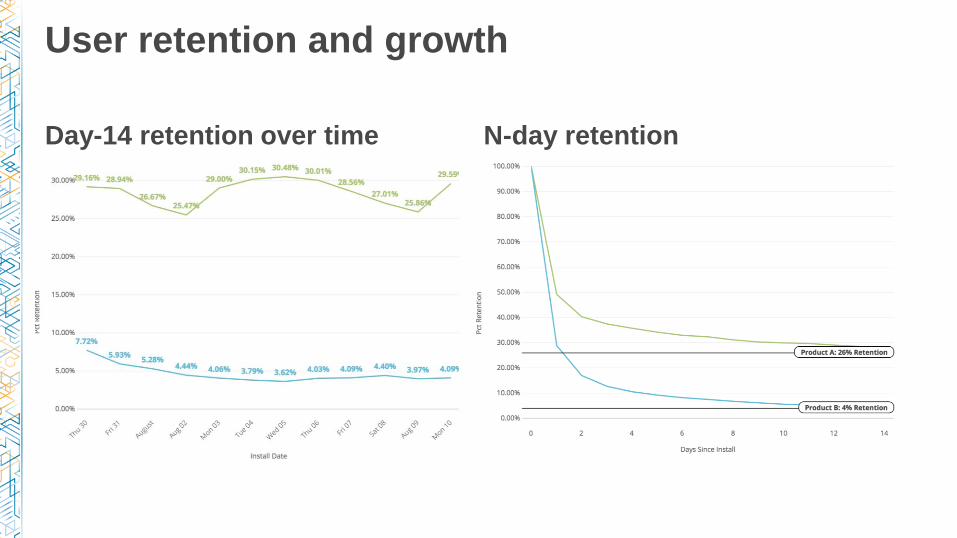
Day-14 retention over time
User retention and growth
N-day retention
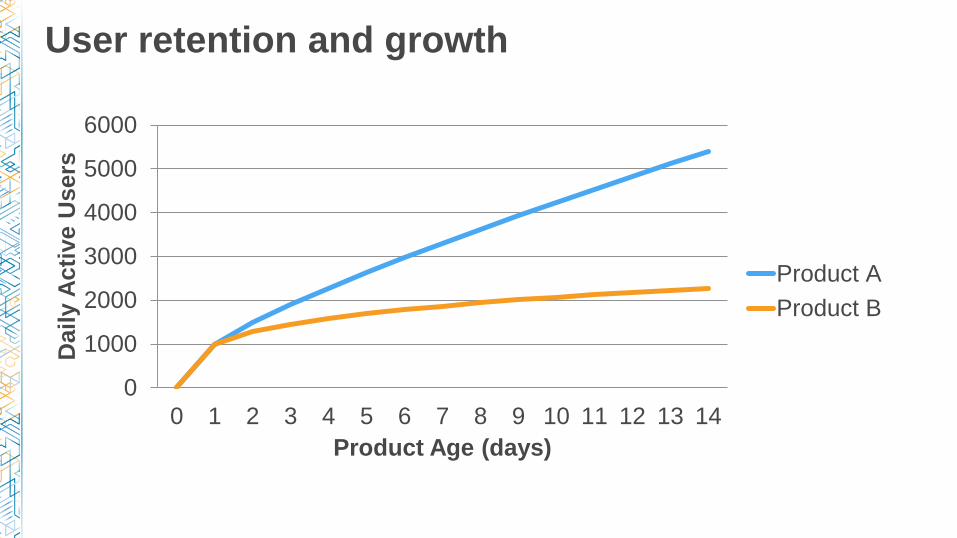
User retention and growth
0
1000
2000
3000
4000
5000
6000
0 1 2 3 4 5 6 7 8 9 10 11 12 13 14
Daily A
cti
ve U
sers
Product Age (days)
Product A
Product B

High churn = wasted ad dollars
$-
$5,000.00
$10,000.00
$15,000.00
$20,000.00
$25,000.00
1 2 3 4 5 6 7 8 9 10 11 12 13 14
Product age (days)
Product A
Product B
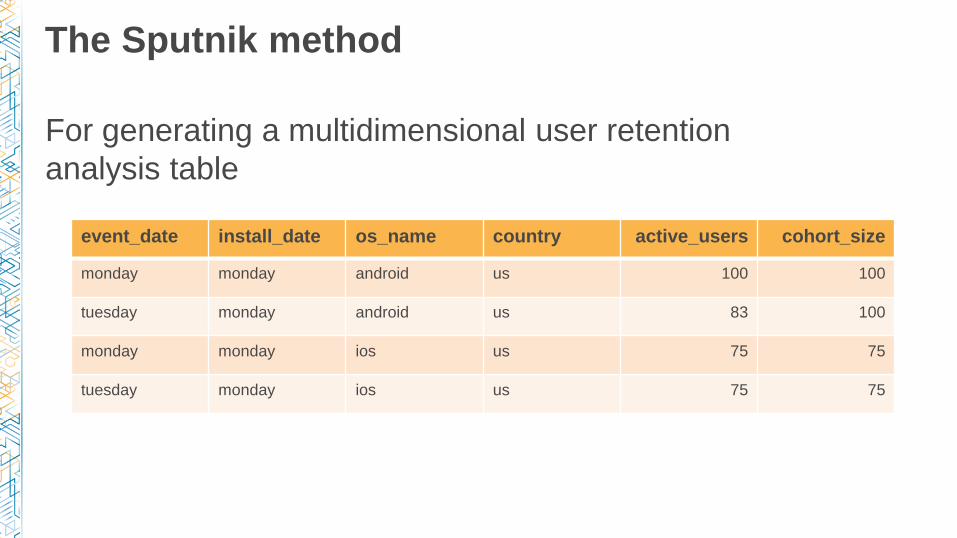
The Sputnik method
For generating a multidimensional user retention
analysis table
event_date install_date os_name country active_users cohort_size
monday monday android us 100 100
tuesday monday android us 83 100
monday monday ios us 75 75
tuesday monday ios us 75 75

Get one-day retention
SELECT
SUM(active_users) AS active_users,
SUM(cohort_size) AS cohort_size,
SUM(active_users) / SUM(cohort_size) AS retention
FROM user_retention
WHERE
event_date – install_date = 1 AND
CURRENT_DATE – 1 > event_date;

Get one-day retention
event_date install_date os_name country active_users cohort_size
monday monday android us 100 100
tuesday monday android us 83 100
monday monday ios us 75 75
tuesday monday ios us 75 75
Active Users: 83 + 75 = 158Cohort Size: 100 + 75 = 175
-------------------------------Pct Retention = 158 / 175 = 90%
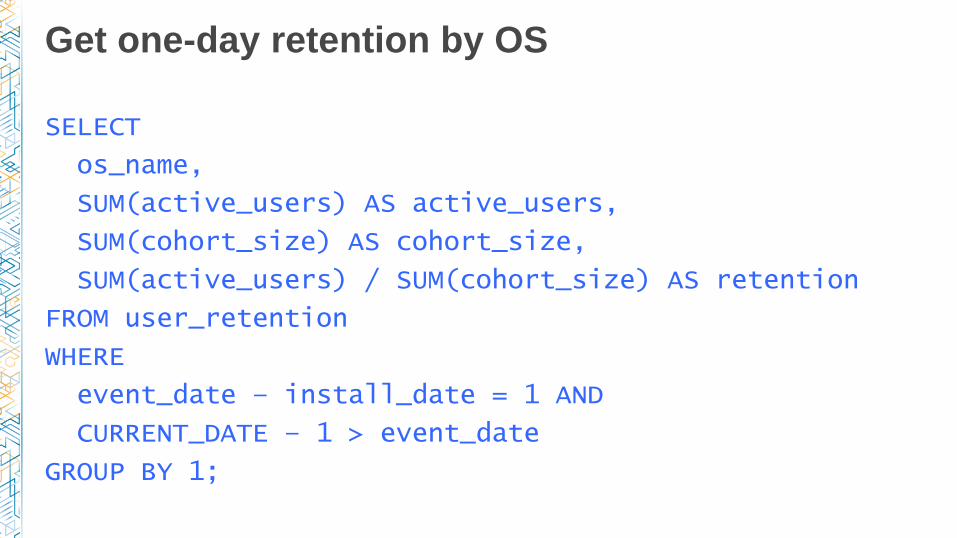
Get one-day retention by OS
SELECT
os_name,
SUM(active_users) AS active_users,
SUM(cohort_size) AS cohort_size,
SUM(active_users) / SUM(cohort_size) AS retention
FROM user_retention
WHERE
event_date – install_date = 1 AND
CURRENT_DATE – 1 > event_date
GROUP BY 1;
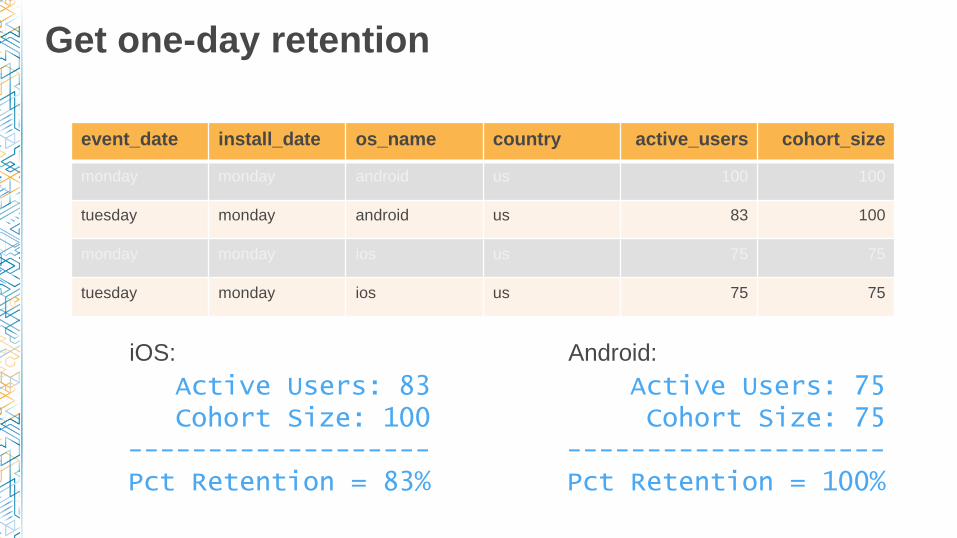
Get one-day retention
event_date install_date os_name country active_users cohort_size
monday monday android us 100 100
tuesday monday android us 83 100
monday monday ios us 75 75
tuesday monday ios us 75 75
Active Users: 83Cohort Size: 100
-------------------Pct Retention = 83%
Active Users: 75Cohort Size: 75
--------------------Pct Retention = 100%
iOS: Android:
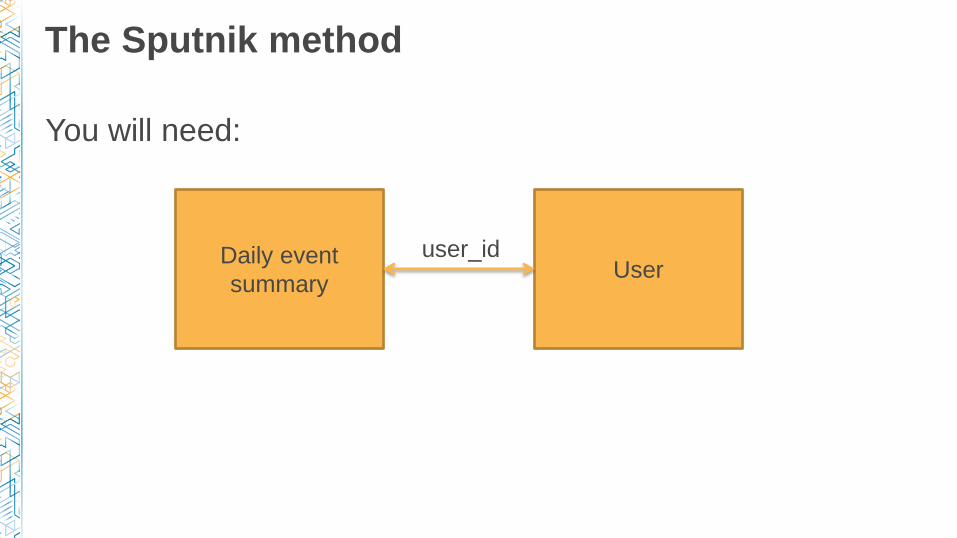
The Sputnik method
You will need:
Daily event
summaryUser
user_id

The Sputnik method
Calculate cohort sizes
• Count users by all dimensions
• For example: Male, iOS, in USA, who installed today
Determine user activity
• For each day, for each user, were they active
• Create a table with user_id and event_date
Join and aggregate
• Join user table to user_activity on user_id
• SUM active users by cohort and join to cohort sizes

Calculate cohort sizes
user_id install_date os_name country
1 2015-10-02 iOS us
2 2015-10-01 android ca
3 2015-10-01 android ca
SELECT
install_date, os_name, country,
COUNT(*) AS cohort_size
FROM user
GROUP BY 1,2,3;
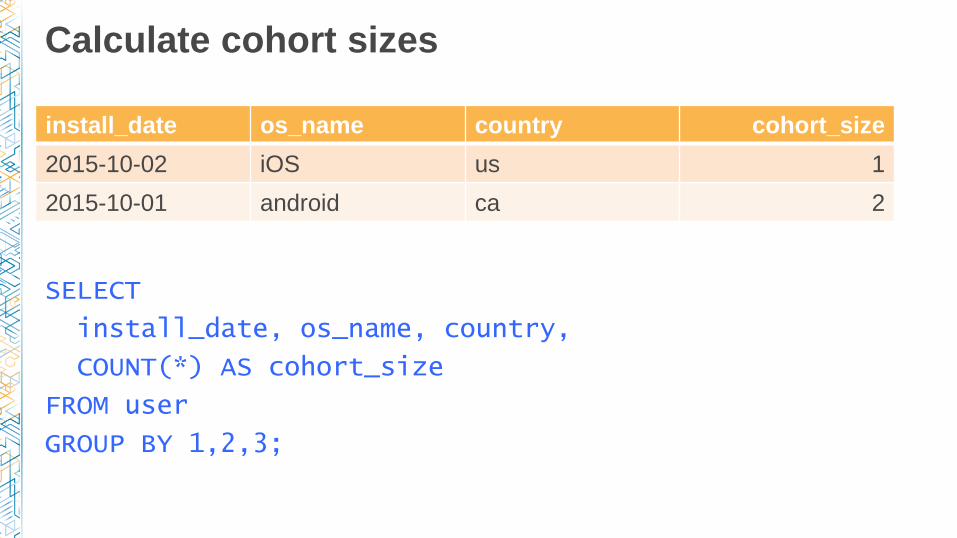
Calculate cohort sizes
install_date os_name country cohort_size
2015-10-02 iOS us 1
2015-10-01 android ca 2
SELECT
install_date, os_name, country,
COUNT(*) AS cohort_size
FROM user
GROUP BY 1,2,3;

Determine user activity
user_id event_date action
1 2015-10-02 app_open
1 2015-10-02 spam
1 2015-10-03 app_open
CREATE TEMP TABLE user_activity AS
SELECT
DISTINCT user_id, event_date
FROM event_daily
WHERE action = ‘app_open’;
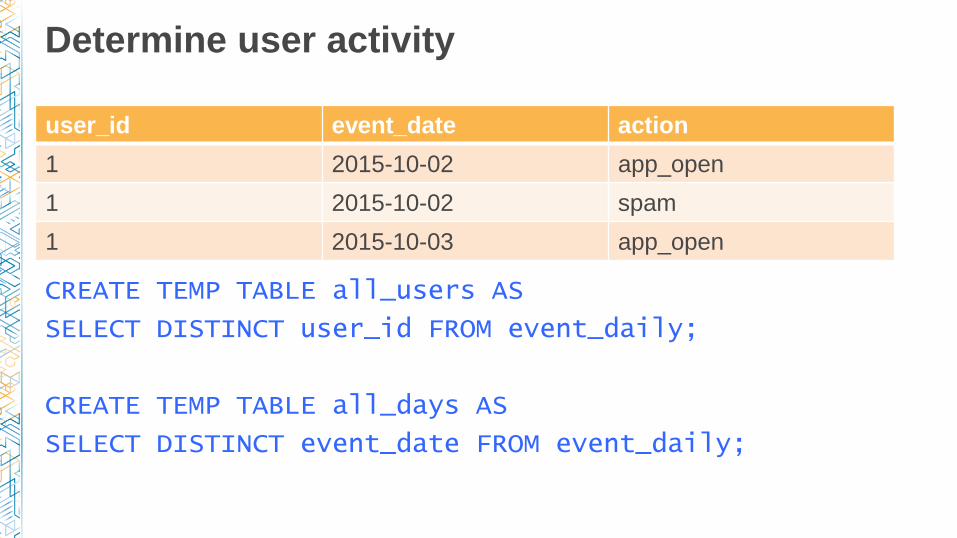
Determine user activity
user_id event_date action
1 2015-10-02 app_open
1 2015-10-02 spam
1 2015-10-03 app_open
CREATE TEMP TABLE all_users AS
SELECT DISTINCT user_id FROM event_daily;
CREATE TEMP TABLE all_days AS
SELECT DISTINCT event_date FROM event_daily;
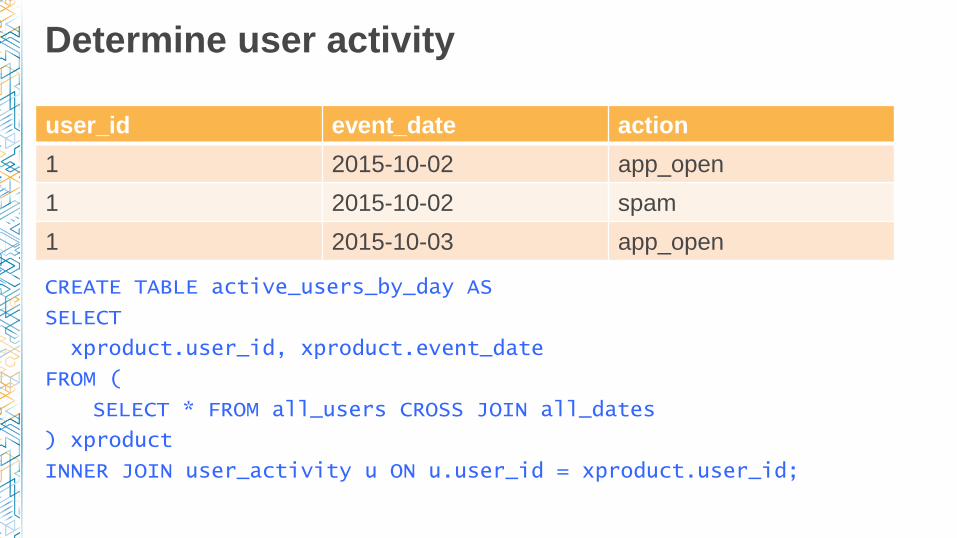
Determine user activity
user_id event_date action
1 2015-10-02 app_open
1 2015-10-02 spam
1 2015-10-03 app_open
CREATE TABLE active_users_by_day AS
SELECT
xproduct.user_id, xproduct.event_date
FROM (
SELECT * FROM all_users CROSS JOIN all_dates
) xproduct
INNER JOIN user_activity u ON u.user_id = xproduct.user_id;
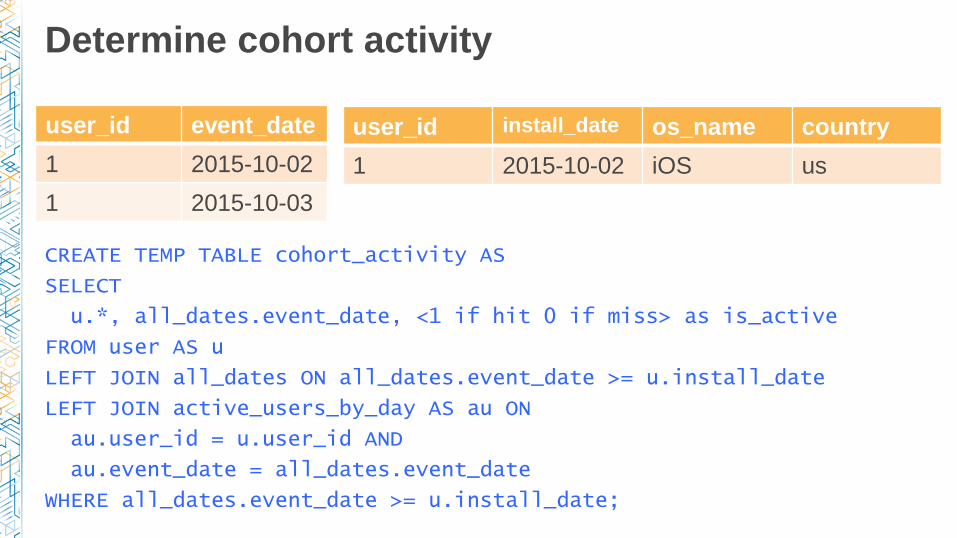
Determine cohort activity
user_id event_date
1 2015-10-02
1 2015-10-03
CREATE TEMP TABLE cohort_activity AS
SELECT
u.*, all_dates.event_date, <1 if hit 0 if miss> as is_active
FROM user AS u
LEFT JOIN all_dates ON all_dates.event_date >= u.install_date
LEFT JOIN active_users_by_day AS au ON
au.user_id = u.user_id AND
au.event_date = all_dates.event_date
WHERE all_dates.event_date >= u.install_date;
user_id install_date os_name country
1 2015-10-02 iOS us
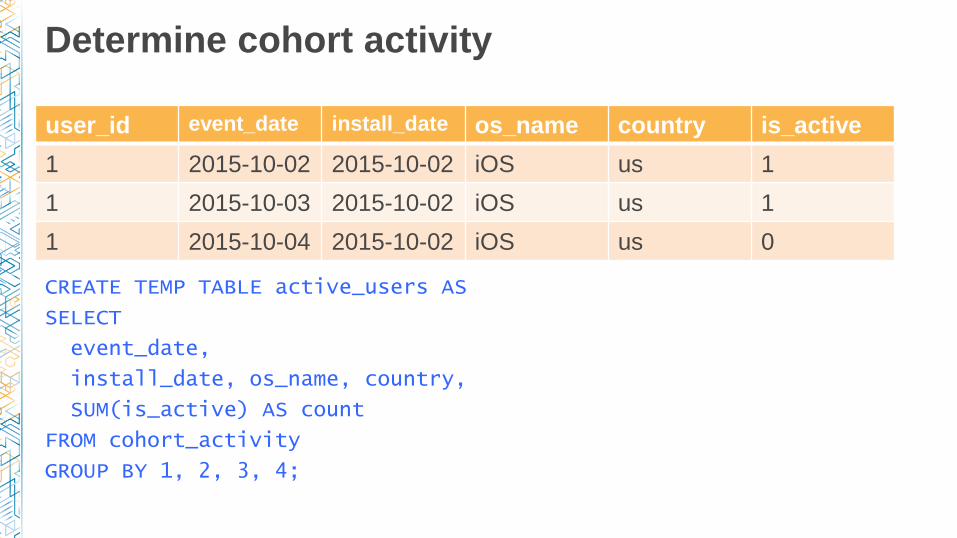
Determine cohort activity
user_id event_date install_date os_name country is_active
1 2015-10-02 2015-10-02 iOS us 1
1 2015-10-03 2015-10-02 iOS us 1
1 2015-10-04 2015-10-02 iOS us 0
CREATE TEMP TABLE active_users AS
SELECT
event_date,
install_date, os_name, country,
SUM(is_active) AS count
FROM cohort_activity
GROUP BY 1, 2, 3, 4;

Determine cohort activity
event_date install_date os_name country is_active
2015-10-
03
2015-10-
02
iOS us 100
2015-10-
03
2015-10-
02
android us 350
2015-10-
03
2015-10-
02
iOS ca 50 Join these
two tables on
matching cohort
dimensions
install_date os_name country cohort_size
2015-10-02 iOS us 200
2015-10-02 android us 400
2015-10-02 iOS ca 60
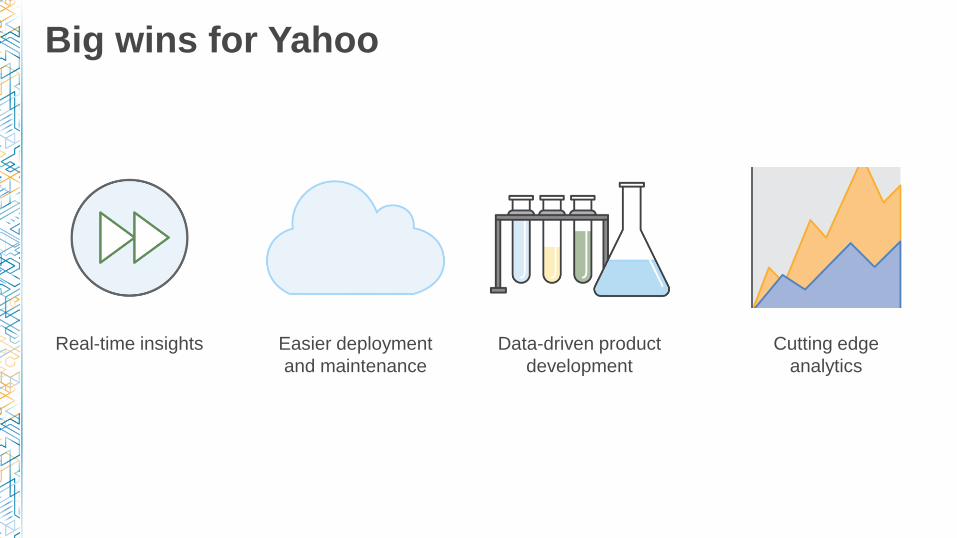
Big wins for Yahoo
Real-time insights Easier deployment
and maintenance
Data-driven product
development
Cutting edge
analytics
Thank you!
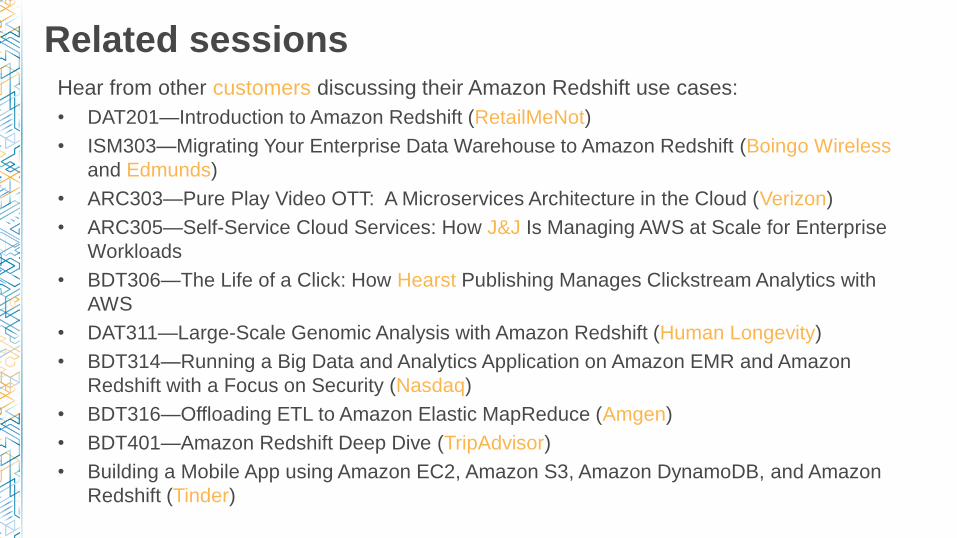
Related sessionsHear from other customers discussing their Amazon Redshift use cases:
• DAT201—Introduction to Amazon Redshift (RetailMeNot)
• ISM303—Migrating Your Enterprise Data Warehouse to Amazon Redshift (Boingo Wireless
and Edmunds)
• ARC303—Pure Play Video OTT: A Microservices Architecture in the Cloud (Verizon)
• ARC305—Self-Service Cloud Services: How J&J Is Managing AWS at Scale for Enterprise
Workloads
• BDT306—The Life of a Click: How Hearst Publishing Manages Clickstream Analytics with
AWS
• DAT311—Large-Scale Genomic Analysis with Amazon Redshift (Human Longevity)
• BDT314—Running a Big Data and Analytics Application on Amazon EMR and Amazon
Redshift with a Focus on Security (Nasdaq)
• BDT316—Offloading ETL to Amazon Elastic MapReduce (Amgen)
• BDT401—Amazon Redshift Deep Dive (TripAdvisor)
• Building a Mobile App using Amazon EC2, Amazon S3, Amazon DynamoDB, and Amazon
Redshift (Tinder)


