Page 1
Grains & Oilseeds Outlook
May 2015
Daryna Kovalska
Macquarie Agricultural Commodities [email protected]
+44 20 3037 2732
Macquarie Capital (Europe) Ltd Ropemaker Place, 28 Ropemaker Street, London, EC2Y 9HD, United Kingdom
In preparing this research, we did not take into account the investment objectives, financial situation and particular needs of the reader. Before making an investment decision on the basis of this research, the reader needs to consider, with or without the assistance of an adviser, whether the advice is appropriate in light of their particular investment needs, objectives and financial circumstances. Please see disclaimer.
Page 2
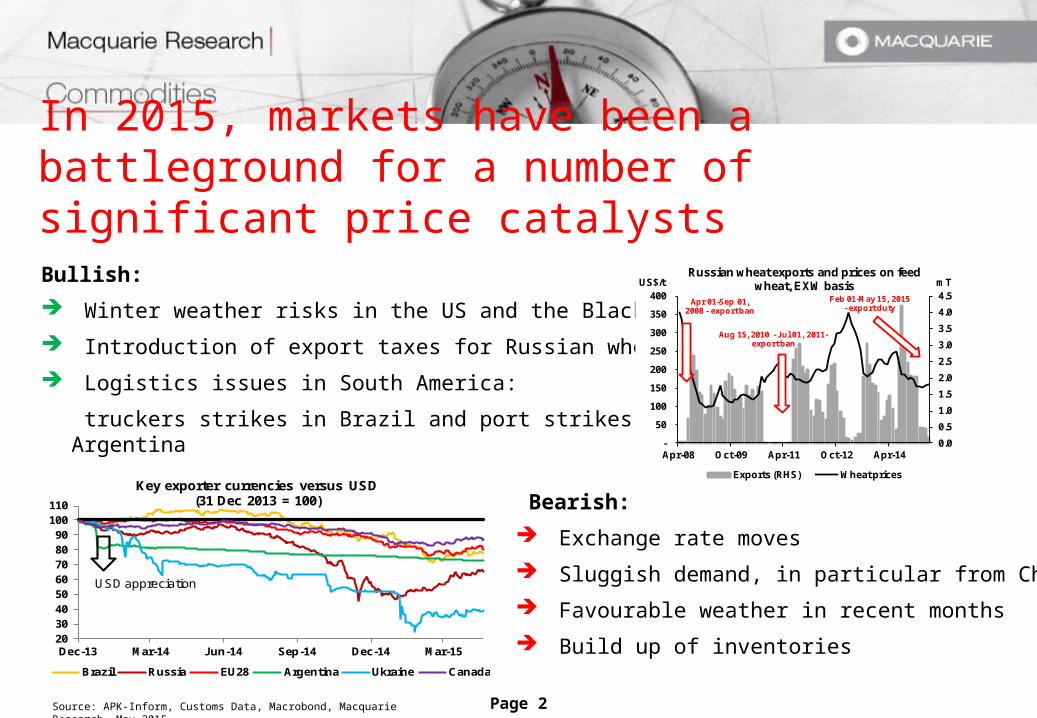
In 2015, markets have been a battleground for a number of significant price catalystsBullish:
Winter weather risks in the US and the Black Sea
Introduction of export taxes for Russian wheat
Logistics issues in South America:
truckers strikes in Brazil and port strikes in Argentina 0.0
0.5
1.0
1.5
2.0
2.5
3.0
3.5
4.0
4.5
-
50
100
150
200
250
300
350
400
Apr-08 Oct-09 Apr-11 Oct-12 Apr-14
mTUS$/tRussian wheat exports and prices on feed
wheat, EXW basis
Exports (RHS) Wheat prices
Apr 01-Sep 01, 2008 - export ban
Aug 15, 2010 - Jul 01, 2011-export ban
Feb 01-May 15, 2015 - export duty
Source: APK-Inform, Customs Data, Macrobond, Macquarie Research, May 2015
Bearish:
Exchange rate moves
Sluggish demand, in particular from China
Favourable weather in recent months
Build up of inventories2030405060708090
100110
Dec-13 Mar-14 Jun-14 Sep-14 Dec-14 Mar-15
Key exporter currencies versus USD (31 Dec 2013 = 100)
Brazil Russia EU28 Argentina Ukraine Canada
USD appreciation

Page 3
Net-net, we have seen continued weakness in grains and oilseeds prices in 2015
Source: Reuters, Macquarie Research, May 2015
450
500
550
600
650
700
750
USc/bu CBOT Wheat Price Continuation
320
340
360
380
400
420
440
460
480
500
520
USc/buCBOT Corn Price Continuation
850
950
1,050
1,150
1,250
1,350
1,450
1,550
USc/bu CBOT Soybean Price Continuation

Page 4
High stocks remain the key challenge for agricultural markets
Source: USDA, Macquarie Research, May 2015
175
138
56
190 174
63
201 193
86
5
55
105
155
205
Wheat Corn Soybeans
mTWorld Ending Stocks
2012/13 2013/14 2014/15f

Page 5
Grains & Oilseeds 3 month view Supply Growth Demand Inventory
Corn Neutral Stable OK High
Wheat Bearish Stable Weak High
Soybeans Neutral Strong OK High
Bearish Neutral Bullish
Legend: Views are relative to today's flat price:
In the short-term, we see no upside for prices, as grains & oilseeds struggle to absorb supply
Source: Macquarie Research, May 2015
Ample supplies globally
Demand undermined by strong USD
Ethanol production is robust, limiting downside
Slower supply growth, but significant stocks globally
Anaemic seaborne demand, given shift in Chinese consumption towards barley and sorghum
Significant supply growth and existing inventories, especially in N and S America
Increase in Chinese demand will provide some support
Page 6
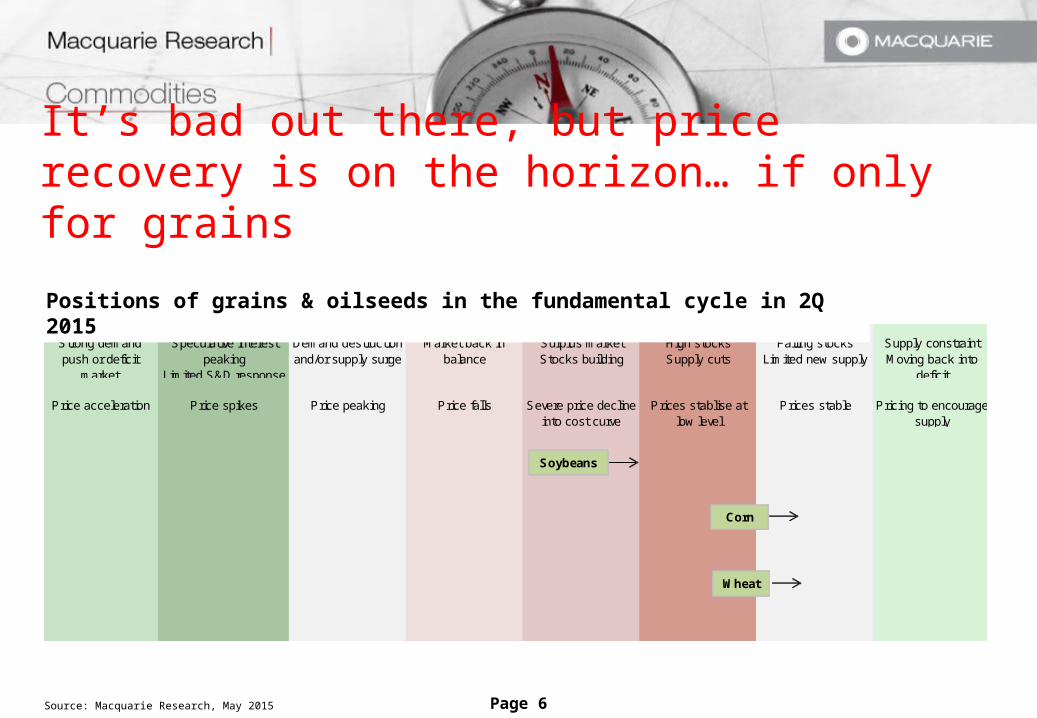
It’s bad out there, but price recovery is on the horizon… if only for grains
Source: Macquarie Research, May 2015
Strong demand push or deficit
market
Speculative interest peaking
Limited S&D response
Demand destruction and/or supply surge
Market back in balance
Surplus market Stocks building
High stocks Supply cuts
Falling stocks Limited new supply
Supply constraint Moving back into
deficit
Price acceleration Price spikes Price peaking Price falls Severe price decline into cost curve
Prices stablise at low level
Prices stable Pricing to encourage supply
Soybeans
Corn
Wheat
Positions of grains & oilseeds in the fundamental cycle in 2Q 2015
Page 7
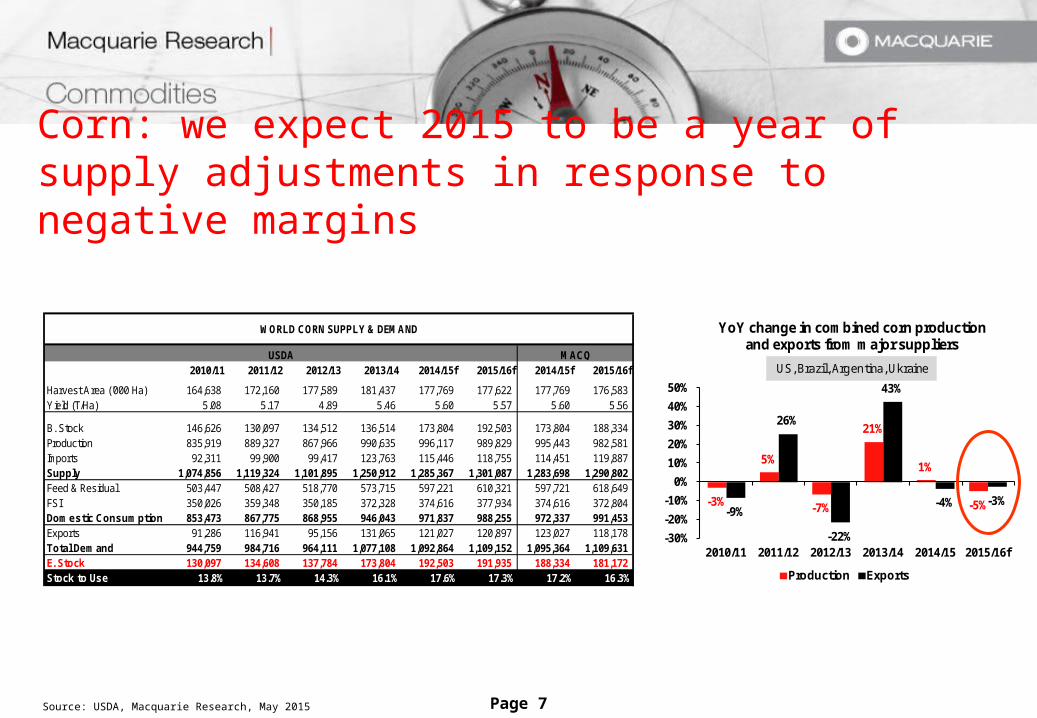
Corn: we expect 2015 to be a year of supply adjustments in response to negative margins
Source: USDA, Macquarie Research, May 2015
2010/11 2011/12 2012/13 2013/14 2014/15f 2015/16f 2014/15f 2015/16f
Harvest Area ('000 Ha) 164,638 172,160 177,589 181,437 177,769 177,622 177,769 176,583 Yield (T/Ha) 5.08 5.17 4.89 5.46 5.60 5.57 5.60 5.56
B. Stock 146,626 130,097 134,512 136,514 173,804 192,503 173,804 188,334 Production 835,919 889,327 867,966 990,635 996,117 989,829 995,443 982,581 Imports 92,311 99,900 99,417 123,763 115,446 118,755 114,451 119,887 Supply 1,074,856 1,119,324 1,101,895 1,250,912 1,285,367 1,301,087 1,283,698 1,290,802 Feed & Residual 503,447 508,427 518,770 573,715 597,221 610,321 597,721 618,649 FSI 350,026 359,348 350,185 372,328 374,616 377,934 374,616 372,804 Domestic Consumption 853,473 867,775 868,955 946,043 971,837 988,255 972,337 991,453 Exports 91,286 116,941 95,156 131,065 121,027 120,897 123,027 118,178 Total Demand 944,759 984,716 964,111 1,077,108 1,092,864 1,109,152 1,095,364 1,109,631 E. Stock 130,097 134,608 137,784 173,804 192,503 191,935 188,334 181,172 Stock to Use 13.8% 13.7% 14.3% 16.1% 17.6% 17.3% 17.2% 16.3%
MACQ
WORLD CORN SUPPLY & DEMAND
USDA
-3%
5%
-7%
21%
1%
-5%-9%
26%
-22%
43%
-4% -3%
-30%
-20%
-10%
0%
10%
20%
30%
40%
50%
2010/11 2011/12 2012/13 2013/14 2014/15 2015/16f
YoY change in combined corn production and exports from major suppliers
Production Exports
US, Brazil, Argentina, Ukraine
Page 8
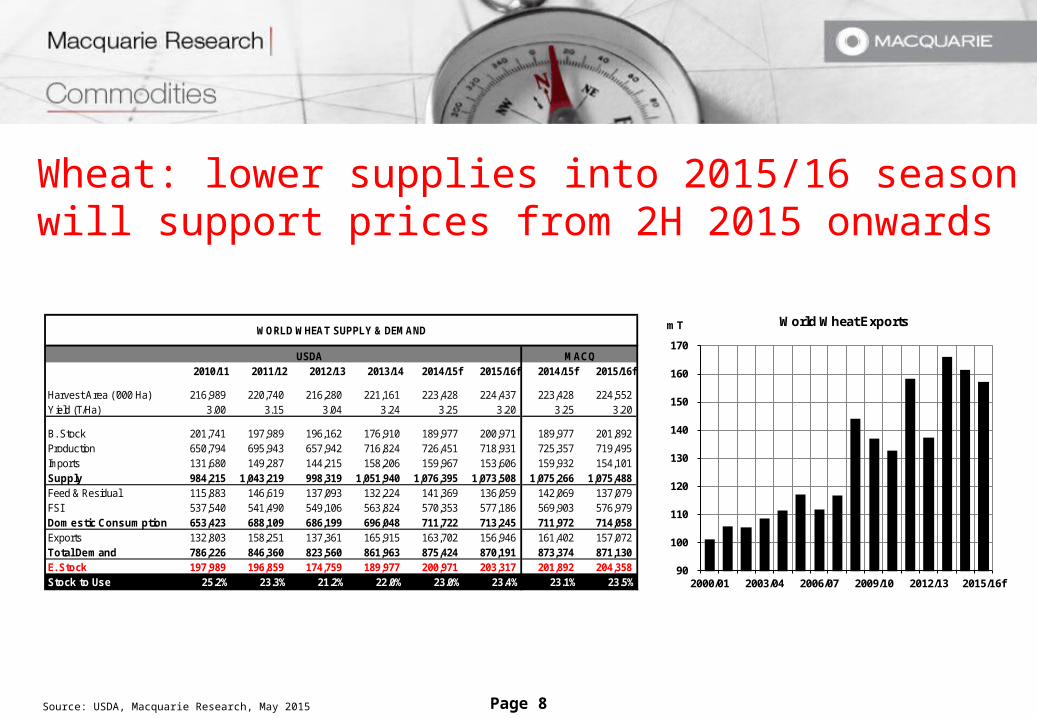
Wheat: lower supplies into 2015/16 season will support prices from 2H 2015 onwards
2010/11 2011/12 2012/13 2013/14 2014/15f 2015/16f 2014/15f 2015/16f
Harvest Area ('000 Ha) 216,989 220,740 216,280 221,161 223,428 224,437 223,428 224,552 Yield (T/Ha) 3.00 3.15 3.04 3.24 3.25 3.20 3.25 3.20
B. Stock 201,741 197,989 196,162 176,910 189,977 200,971 189,977 201,892 Production 650,794 695,943 657,942 716,824 726,451 718,931 725,357 719,495 Imports 131,680 149,287 144,215 158,206 159,967 153,606 159,932 154,101 Supply 984,215 1,043,219 998,319 1,051,940 1,076,395 1,073,508 1,075,266 1,075,488 Feed & Residual 115,883 146,619 137,093 132,224 141,369 136,059 142,069 137,079 FSI 537,540 541,490 549,106 563,824 570,353 577,186 569,903 576,979 Domestic Consumption 653,423 688,109 686,199 696,048 711,722 713,245 711,972 714,058 Exports 132,803 158,251 137,361 165,915 163,702 156,946 161,402 157,072 Total Demand 786,226 846,360 823,560 861,963 875,424 870,191 873,374 871,130 E. Stock 197,989 196,859 174,759 189,977 200,971 203,317 201,892 204,358 Stock to Use 25.2% 23.3% 21.2% 22.0% 23.0% 23.4% 23.1% 23.5%
USDA
WORLD WHEAT SUPPLY & DEMAND
MACQ
Source: USDA, Macquarie Research, May 2015
90
100
110
120
130
140
150
160
170
2000/01 2003/04 2006/07 2009/10 2012/13 2015/16f
mT World Wheat Exports

Page 9
Soybeans: as we move into the 2015/16 season, the world should see far more plentiful supplies of beans
2010/11 2011/12 2012/13 2013/14 2014/15f 2015/16f 2014/15f 2015/16f
Harvest Area ('000 Ha) 103,060 103,141 109,421 113,123 118,135 120,366 118,135 119,298 Yield (T/Ha) 2.56 2.32 2.45 2.50 2.69 2.64 2.68 2.64
B. Stock 60,947 70,304 53,403 56,469 63,401 85,542 63,401 83,783 Production 263,888 239,525 268,063 283,253 317,253 317,300 316,679 315,187 Imports 88,760 93,456 95,888 111,251 114,147 119,631 115,943 120,532 Supply 413,595 403,285 417,354 450,973 494,801 522,473 496,023 519,503 Feed & Residual 15,302 14,128 15,440 17,958 20,575 20,792 20,925 20,533 Food 14,950 15,344 15,497 16,068 16,705 17,261 16,705 16,965 Crush 221,337 228,112 229,597 240,608 254,482 266,223 257,340 264,620 Domestic Consumption 251,589 257,584 260,534 274,634 291,762 304,276 294,970 302,118 Exports 91,702 92,157 100,540 112,938 117,497 121,977 117,269 123,550 Total Demand 343,291 349,741 361,074 387,572 409,259 426,253 412,240 425,668 E. Stock 70,304 53,544 56,280 63,401 85,542 96,220 83,783 93,835 Stock to Use 20.5% 15.3% 15.6% 16.4% 20.9% 22.6% 20.3% 22.0%
WORLD SOYBEAN SUPPLY & DEMAND
MACQUSDA
Source: USDA, Macquarie Research, May 2015
-
10
20
30
40
50
60
70
2000/01 2003/04 2006/07 2009/10 2012/13 2015/16f
mT Major Exporter Soybean Stocks
US Brazil Argentina

Page 10
Supply side of the story Farm economics
Plantings
Weather risks and rewards: El Niño in focus
Page 11
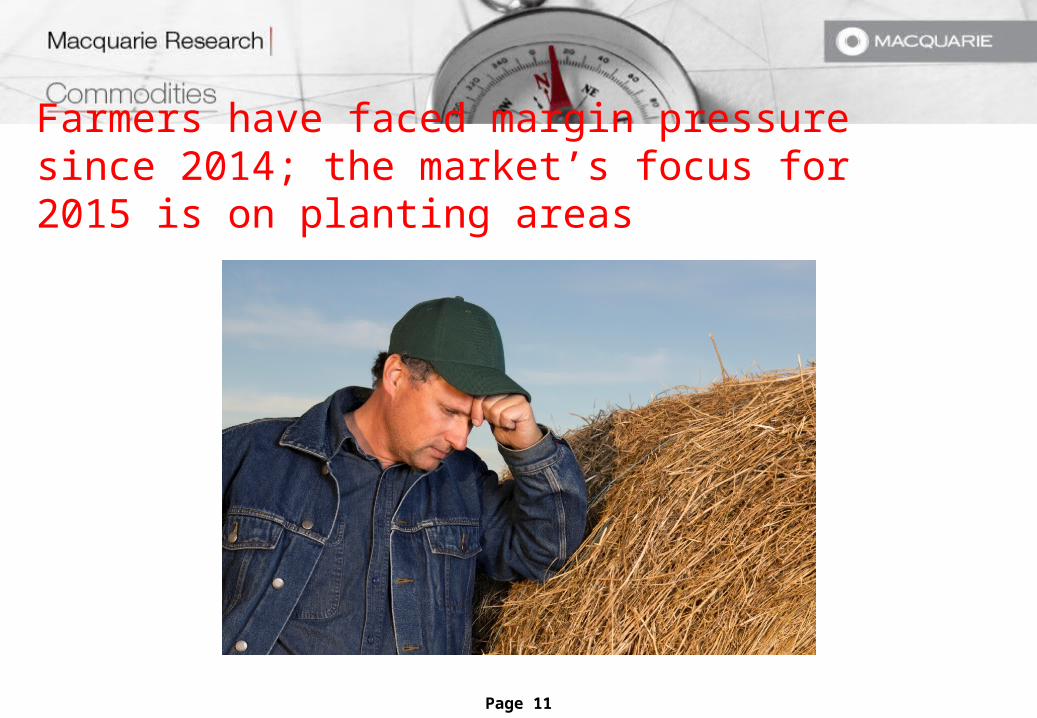
Farmers have faced margin pressure since 2014; the market’s focus for 2015 is on planting areas

Page 12
The ‘magic’ soy:corn ratio underperformed in Jan-Feb
Source: Reuters, Macquarie Research, May 2015
1.8
2.0
2.2
2.4
2.6
2.8
3.0
3.2
Jan Feb Mar Apr May Jun Jul Aug Sep Oct Nov
USc/bu CBOT Soybean:Corn Ratio
10 Yr Range 10 Yr Ave 2014 2015

Page 13
... but soybeans are still more profitable on a relative basis
Source: Reuters, Macquarie Research, May 2015
$1
$2
$3
$4
$5
$6
$7
$8
$9
$2
$4
$6
$8
$10
$12
$14
$16
$18CORN US$/buSOYBEAN US$/bu
Historical Prices Versus Marginal Costs
Soybean (LHS) Marginal Cost Corn (RHS)

Page 14
As such, US corn plantings continue to fall
-10%
-5%
0%
5%
10%
15%
20%
2000/01 2003/04 2006/07 2009/10 2012/13 2015/16f
US Corn Plantings, YoY % change
78.3
93.5
86.0 86.4 88.2 91.9
97.3 95.4 90.6 88.8
60
70
80
90
100
2006 2007 2008 2009 2010 2011 2012 2013 2014 2015f
m acres US Corn Plantings
Source: USDA, Macquarie Research, May 2015

Page 15
...losing area to soybeans
75.5
64.7
75.7 77.5 77.475.0 77.2 76.8
83.7 85.0
55
60
65
70
75
80
85
2006 2007 2008 2009 2010 2011 2012 2013 2014 2015f
m acres US Soybean Plantings
-20%
-15%
-10%
-5%
0%
5%
10%
15%
20%
2000/01 2003/04 2006/07 2009/10 2012/13 2015/16f
US Soybean Plantings, YoY % change
Source: USDA, Macquarie Research, May 2015

Page 16
US yields are likely to see some mean reversion in 2015 after reaching record highs last season
40
60
80
100
120
140
160
180
1960 1971 1982 1993 2004 2015f
bu/acreUS Corn yields
20
25
30
35
40
45
50
1960 1971 1982 1993 2004 2015f
bu/acre US Soybean yields
20142015f
Source: USDA, Macquarie Research, May 2015

Page 17
Good planting progress and the development of El Niño this year may help crops in the US though
Source: USDA, NOAA, Macquarie Research, May 2015
-20%
-15%
-10%
-5%
0%
5%
10%
15%
-1.5 -0.5 0.5 1.5 2.5Y
ield
dif
fere
nce
to tr
end
ENSO SIGNAL
IOWA Corn Yields VS. ENSO Signal
0%
20%
40%
60%
80%
100%US Corn Planting Progress
20 Yr Range 20 Yr Ave 2014 2015

Page 18
Similar to the US, Brazilian farmers prefer soybeans to corn; Ukraine plants less corn too
Source: USDA, CONAB, Macquarie Research, May 2015
-10%
-5%
0%
5%
10%
15%
20%
2003/04 2006/07 2009/10 2012/13 2015/16f
Brazilian Corn and Soybean Plantings, YoY % change
Corn Soybeans
2.0 2.3
1.7
1.7 1.9 2.
4
2.1 2.
6
3.5
4.4 4.
8
4.6
4.4
0
1
2
3
4
5
2003/04 2006/07 2009/10 2012/13 2015/16f
mHa Ukrainian Corn Harvest Area

Page 19
Corn yields in Ukraine are likely to underperform given poor investment in the crop; favourable weather will help Brazilian yields
Source: USDA, CONAB, Macquarie Research, May 2015
2.0
3.0
4.0
5.0
6.0
7.0
1990 1995 2000 2005 2010 2015f
T/Ha Ukrainian Corn Yields
2015f2014
1.0
1.5
2.0
2.5
3.0
3.5
4.0
4.5
5.0
5.5
6.0
6.5
1991 1994 1997 2000 2003 2006 2009 2012 2015
T/Ha Mato Grosso Corn Yield
f
1.0
1.5
2.0
2.5
3.0
3.5
4.0
4.5
5.0
5.5
6.0
1991 1994 1997 2000 2003 2006 2009 2012 2015
T/Ha Parana Corn Yield
f
Page 20
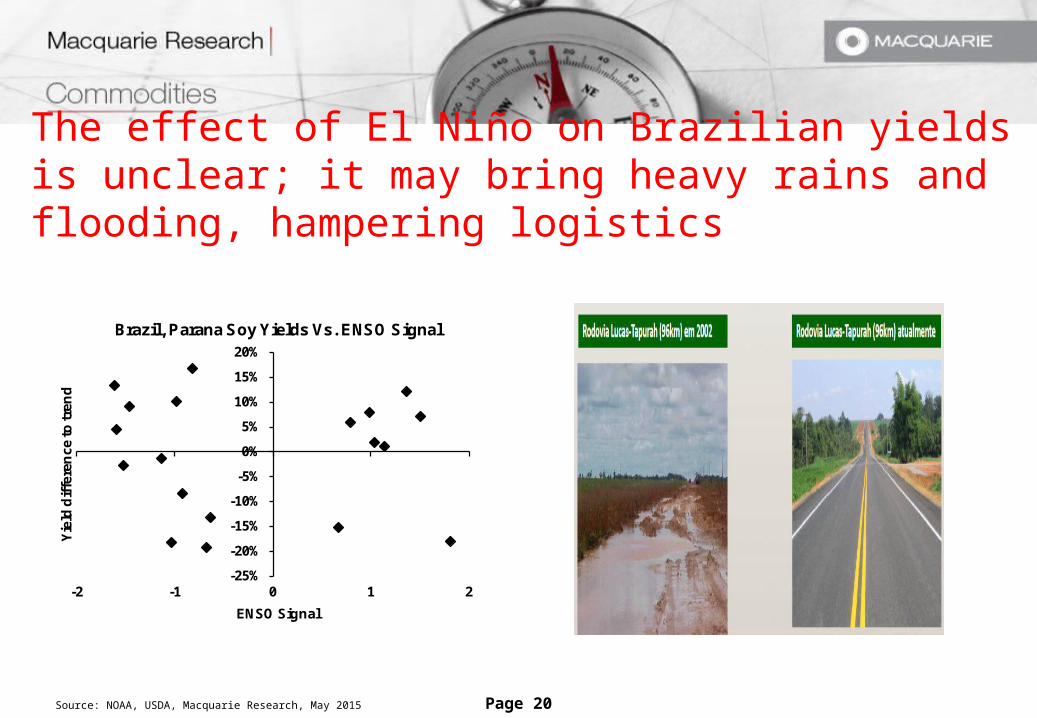
The effect of El Niño on Brazilian yields is unclear; it may bring heavy rains and flooding, hampering logistics
Source: NOAA, USDA, Macquarie Research, May 2015
-25%
-20%
-15%
-10%
-5%
0%
5%
10%
15%
20%
-2 -1 0 1 2
Yie
ld d
iffe
ren
ce to
tren
d
ENSO Signal
Brazil, Parana Soy Yields Vs. ENSO Signal
Page 21
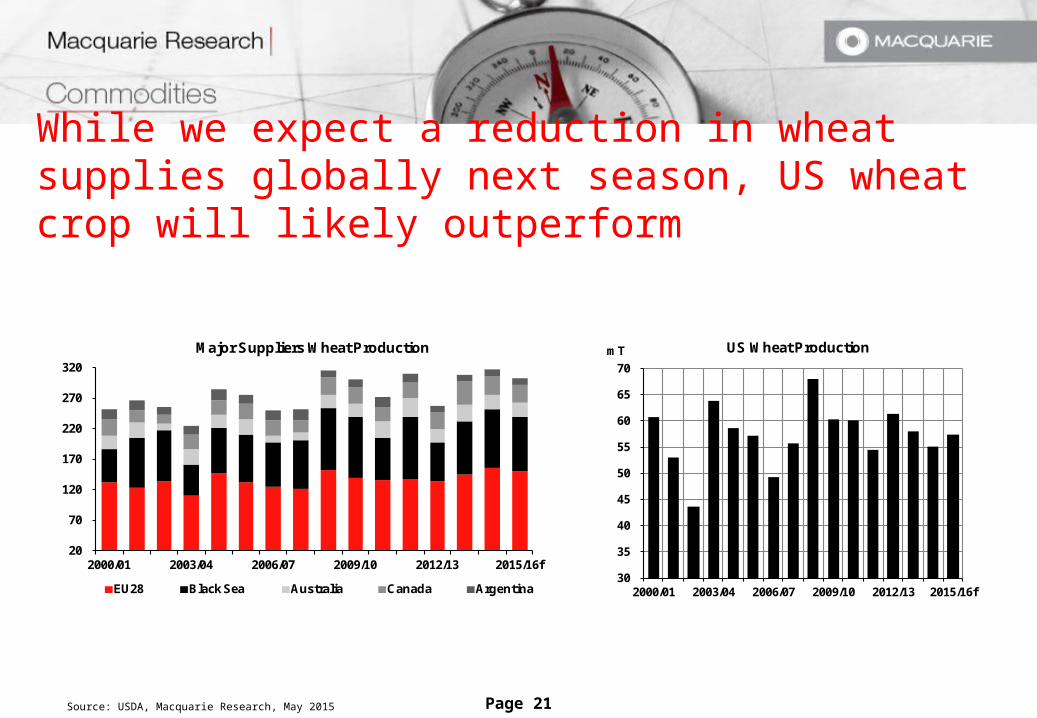
While we expect a reduction in wheat supplies globally next season, US wheat crop will likely outperform
30
35
40
45
50
55
60
65
70
2000/01 2003/04 2006/07 2009/10 2012/13 2015/16f
mT US Wheat Production
20
70
120
170
220
270
320
2000/01 2003/04 2006/07 2009/10 2012/13 2015/16f
Major Suppliers Wheat Production
EU28 Black Sea Australia Canada Argentina
Source: USDA, Macquarie Research, May 2015

Page 22
The key wild card in the wheat market over the next few months will be Russia
Source: USDA, RosStat, Reuters, Macquarie Research, May 2015
60
65
70
75
80
85
Jan Feb Mar Apr May Jun Jul Aug Sep Oct Nov Dec
NDVIStavropol Veg Index
15 Yr Range 15 Yr Ave 2014 2015
60
65
70
75
80
Jan Feb Mar Apr May Jun Jul Aug Sep Oct Nov Dec
NDVI Volgograd Veg Index
15 Yr Range 15 Yr Ave 2014 2015
60
65
70
75
80
85
90
95
Jan Feb Mar Apr May Jun Jul Aug Sep Oct Nov Dec
NDVI Voronezh Veg Index
15 Yr Range 15 Yr Ave 2014 2015
Page 23
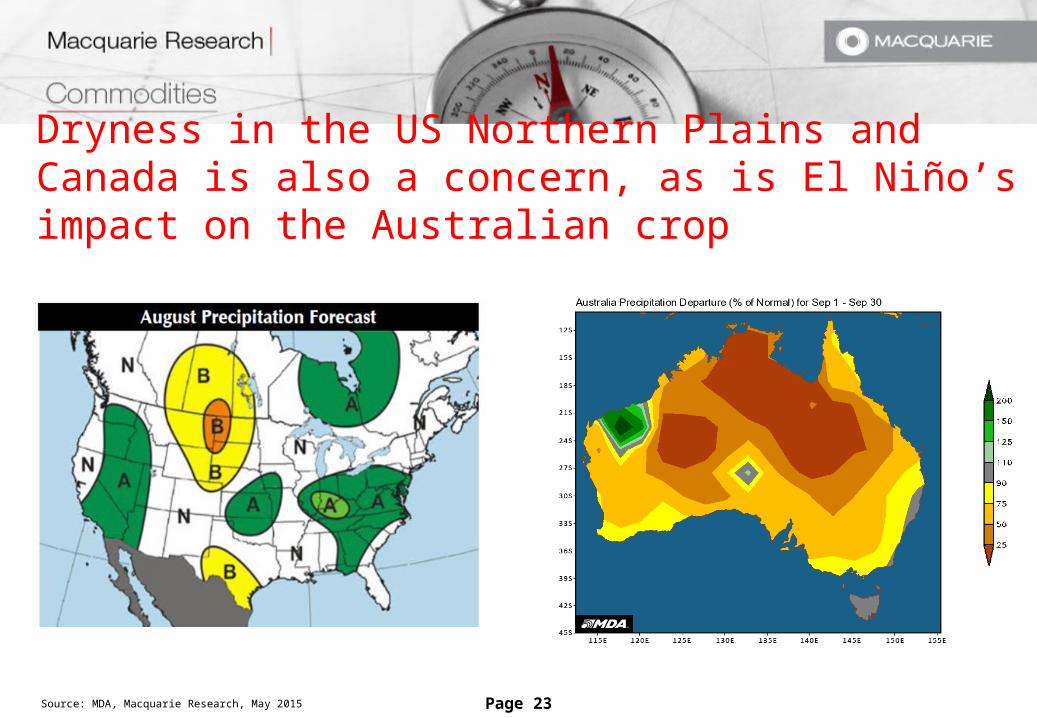
Dryness in the US Northern Plains and Canada is also a concern, as is El Niño’s impact on the Australian crop
Source: MDA, Macquarie Research, May 2015
Page 24
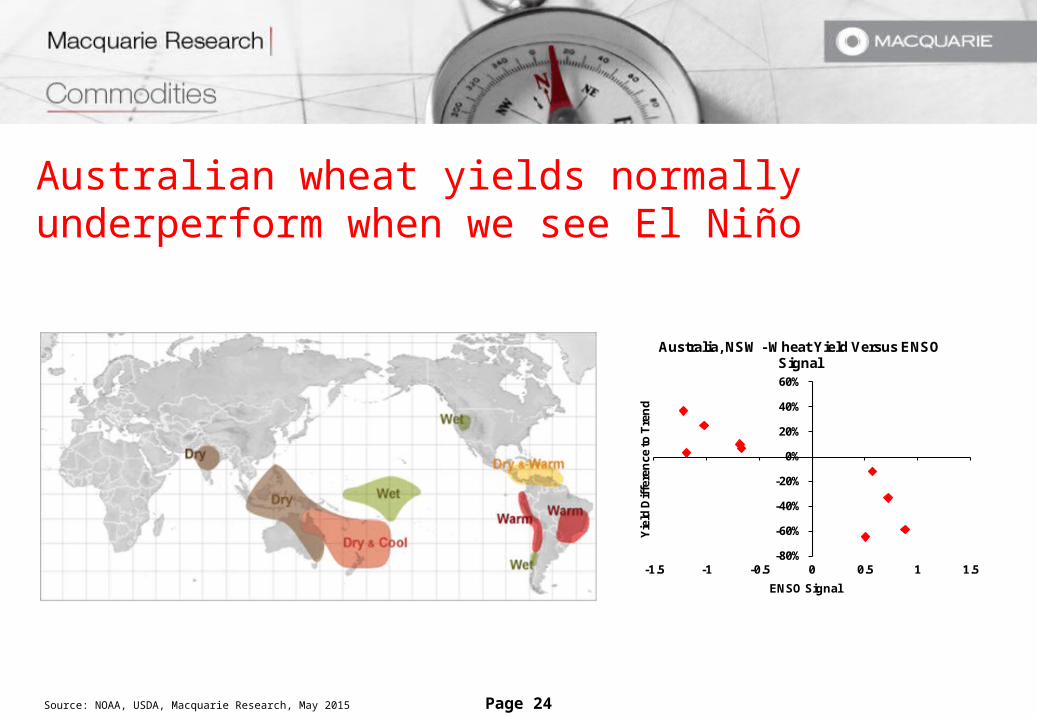
Australian wheat yields normally underperform when we see El Niño
Source: NOAA, USDA, Macquarie Research, May 2015
-80%
-60%
-40%
-20%
0%
20%
40%
60%
-1.5 -1 -0.5 0 0.5 1 1.5
Yie
ld D
iffe
ren
ce to
Tre
nd
ENSO Signal
Australia, NSW - Wheat Yield Versus ENSO Signal

Page 25
Demand side of the story Chinese feed grain distortion
US Ethanol and feed demand
Global soybean consumption
Implications of conflict on demand in MENA countries

Page 26
In 2014, corn shipments to China ran very low, as imports shifted towards barley and sorghum
Source: USDA, Customs Data, Macquarie Research, May 2015
0
2
4
6
8
10
12
14
2008/09 2009/10 2010/11 2011/12 2012/13 2013/14 2014/15
mT Chinese Grain Imports (Sep-Mar)
Barley Sorghum DDGS Corn
6.5mT
3.6mT-44% YoY

Page 27
China has reduced barley availability globally, so other countries will need to switch their feed ration to grains
20%
25%
30%
35%
40%
45%
2000/01 2002/03 2004/05 2006/07 2008/09 2010/11 2012/13 2014/15
EU28 Animal Feed Ration
Wheat Corn Barley
Source: USDA, Macquarie Research, May 2015
1.9
2.5
3.2 3.4 3.6 3.8 3.9
0.0
1.0
2.0
3.0
4.0
2009/10 2011/12 2013/14 2015/16f
mT Australian Feed Wheat Use
5.9
2.4
2.5
7.1
14
.1
2.5
2.8
7.4
6.1
11
.4
15
.9
7.0
13
.0
0
2
4
6
8
10
12
14
16
2003/04 2006/07 2009/10 2012/13 2015/16f
mT EU28 Corn Imports
Page 28
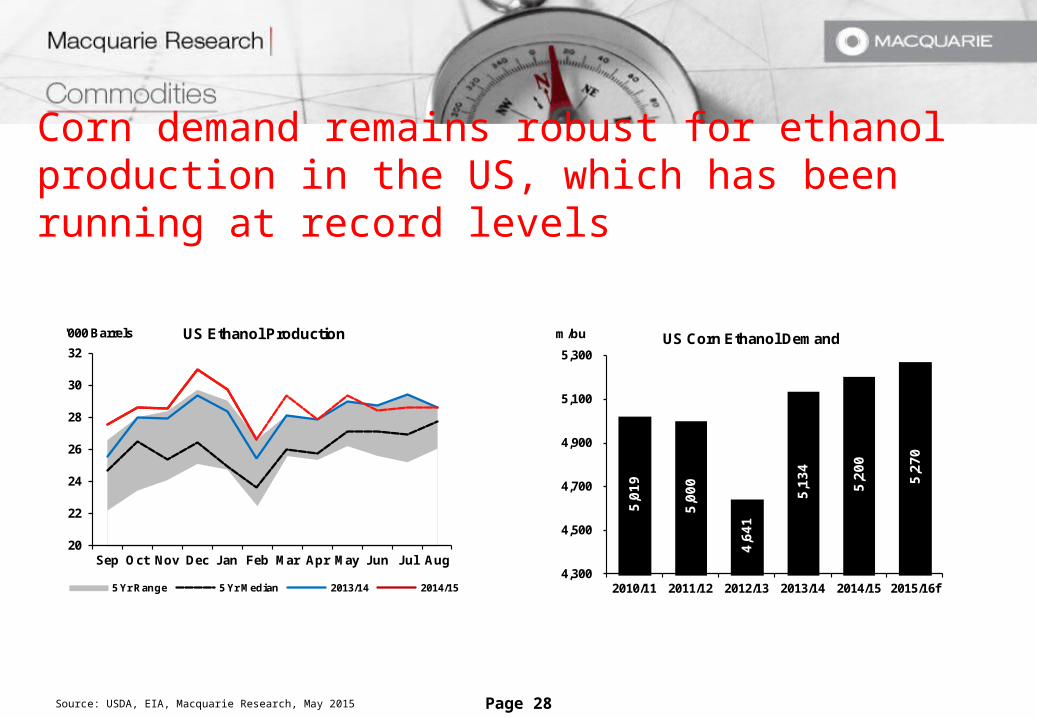
Corn demand remains robust for ethanol production in the US, which has been running at record levels
Source: USDA, EIA, Macquarie Research, May 2015
20
22
24
26
28
30
32
Sep Oct Nov Dec Jan Feb Mar Apr May Jun Jul Aug
'000 Barrels US Ethanol Production
5 Yr Range 5 Yr Median 2013/14 2014/15
5,0
19
5,0
00
4,6
41
5,1
34
5,2
00
5,2
70
4,300
4,500
4,700
4,900
5,100
5,300
2010/11 2011/12 2012/13 2013/14 2014/15 2015/16f
m/bu US Corn Ethanol Demand

Page 29
US feed demand will increase further, driven by herd expansion in the livestock sector
Source: USDA, Macquarie Research, May 2015
190
195
200
205
210
215
220
Jan Feb Mar Apr May Jun Jul Aug Sep Oct Nov Dec
lb US Hogs monthly slaughter avg dressed weights
10 Yr Range 10 Yr Median 2014 2015
5.7
5.8
5.9
6.0
6.1
6.2
6.3
2001 2003 2005 2007 2009 2011 2013 2015
m HEAD US Hogs kept for breeding
2.0
2.2
2.4
2.6
2.8
3.0
3.2
Jan Feb Mar Apr May Jun Jul Aug Sep Oct Nov Dec
m HEAD US Cattle slaughter count
10 Yr Range 10 Yr Median 2014 2015
720
740
760
780
800
820
840
Jan Feb Mar Apr May Jun Jul Aug Sep Oct Nov Dec
lbs US Cattle monthly slaughter avg dressed weights
10 Yr Range 10 Yr Median 2014 2015
5.2
5.4
5.6
5.8
6.0
6.2
Jan Feb Mar Apr May Jun Jul Aug Sep Oct Nov Dec
lb US Broiler monthly slaughter avg dressed weights
10 Yr Range 10 Yr Median 2014 2015
150
155
160
165
170
175
Jan-14 May-14 Sep-14 Jan-15 May-15
'000 HEADUS Broiler chicks placed for meat
production
Page 30
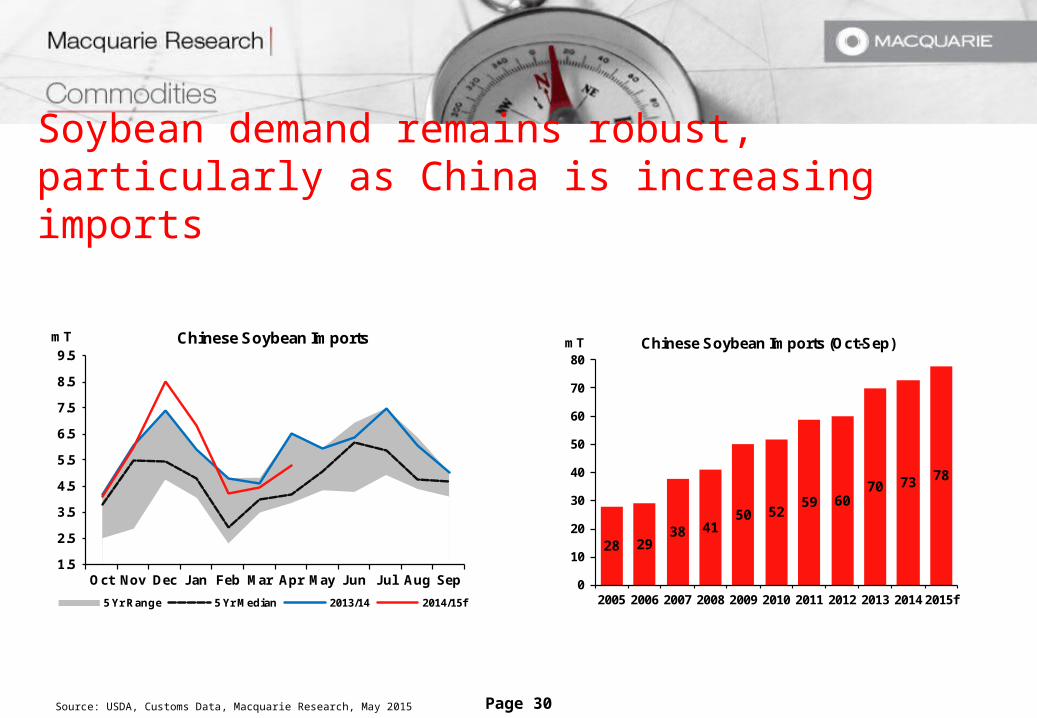
Soybean demand remains robust, particularly as China is increasing imports
Source: USDA, Customs Data, Macquarie Research, May 2015
28 2938 41
50 5259 60
70 73 78
0
10
20
30
40
50
60
70
80
2005 2006 2007 2008 2009 2010 2011 2012 2013 2014 2015f
mT Chinese Soybean Imports (Oct-Sep)
1.5
2.5
3.5
4.5
5.5
6.5
7.5
8.5
9.5
Oct Nov Dec Jan Feb Mar Apr May Jun Jul Aug Sep
mT Chinese Soybean Imports
5 Yr Range 5 Yr Median 2013/14 2014/15f
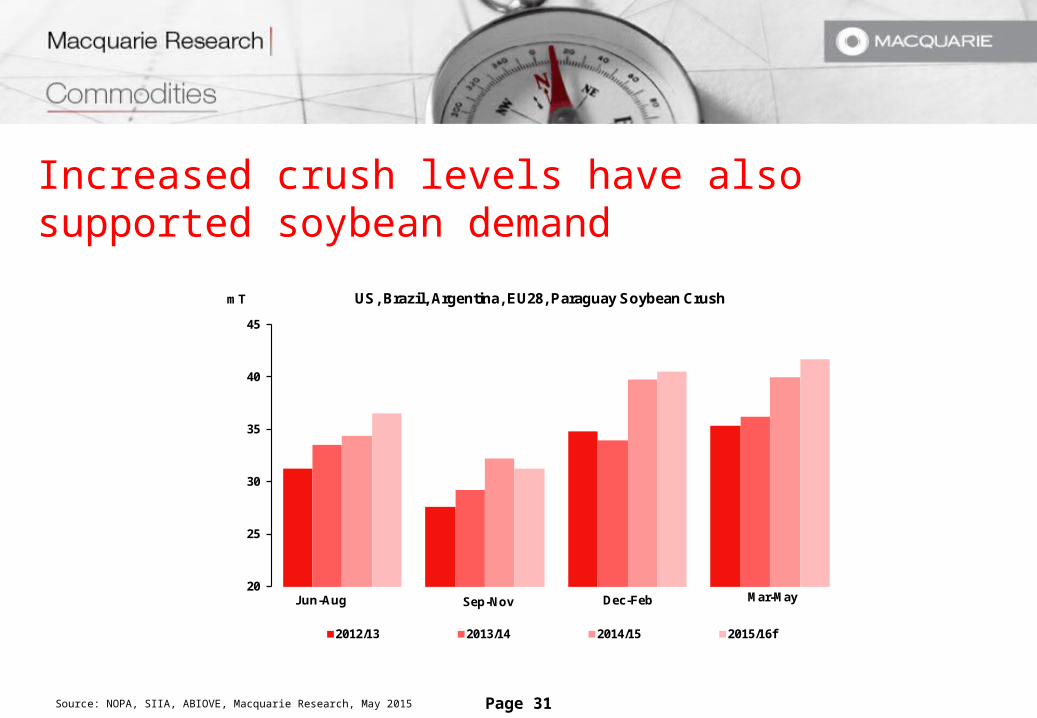
Page 31
Increased crush levels have also supported soybean demand
Source: NOPA, SIIA, ABIOVE, Macquarie Research, May 2015
20
25
30
35
40
45
mT US, Brazil, Argentina, EU28, Paraguay Soybean Crush
2012/13 2013/14 2014/15 2015/16f
Jun-Aug Sep-Nov Dec-Feb Mar-May

Page 32
...to meet growing soybean meal and oil demand across the world
Source: USDA, Customs Data, ABIOVE, Macquarie Research, May 2015
0.0
0.5
1.0
1.5
2.0
2.5
3.0
3.5
4.0
4.5
2000/01 2003/04 2006/07 2009/10 2012/13 2015/16f
Chinese and Indian Soyoil Imports
China India
0
500
1,000
1,500
2,000
2,500
3,000
3,500
2008 2009 2010 2011 2012 2013 2014 2015f
m/liters Brazilian Biodiesel Production Based on Soybean Oil
23
24
25
26
27
28
29
30
31
32
2006 2007 2008 2009 2010 2011 2012 2013 2014 2015f
mT US Soymeal Consumption

Page 33
Meanwhile, conflicts in the MENA region restrict import demand, in particular for wheat from Syria and Iraq
Source: Customs Data, Macquarie Research, May 2015
0.0
0.1
0.2
0.3
0.4
Jun Jul Aug Sep Oct Nov Dec Jan Feb Mar Apr May
mTWheat Exports to Syria
5 Yr Range 5 Yr Median 2013 2014
0.0
0.1
0.2
0.3
0.4
0.5
0.6
0.7
0.8
Jun Jul Aug Sep Oct Nov Dec Jan Feb Mar Apr May
mTWheat Exports to Iraq
5 Yr Range 5 Yr Median 2013 2014

Page 34
However, exports into Turkey are running at all-time highs. Is wheat leaking across the border from Turkey?
0.0
0.1
0.2
0.3
0.4
0.5
0.6
0.7
0.8
0.9
Jun Jul Aug Sep Oct Nov Dec Jan Feb Mar Apr May
mTWheat Exports to Turkey
5 Yr Range 5 Yr Median 2013 2014
Source: USDA, Macquarie Research, May 2015
Page 35
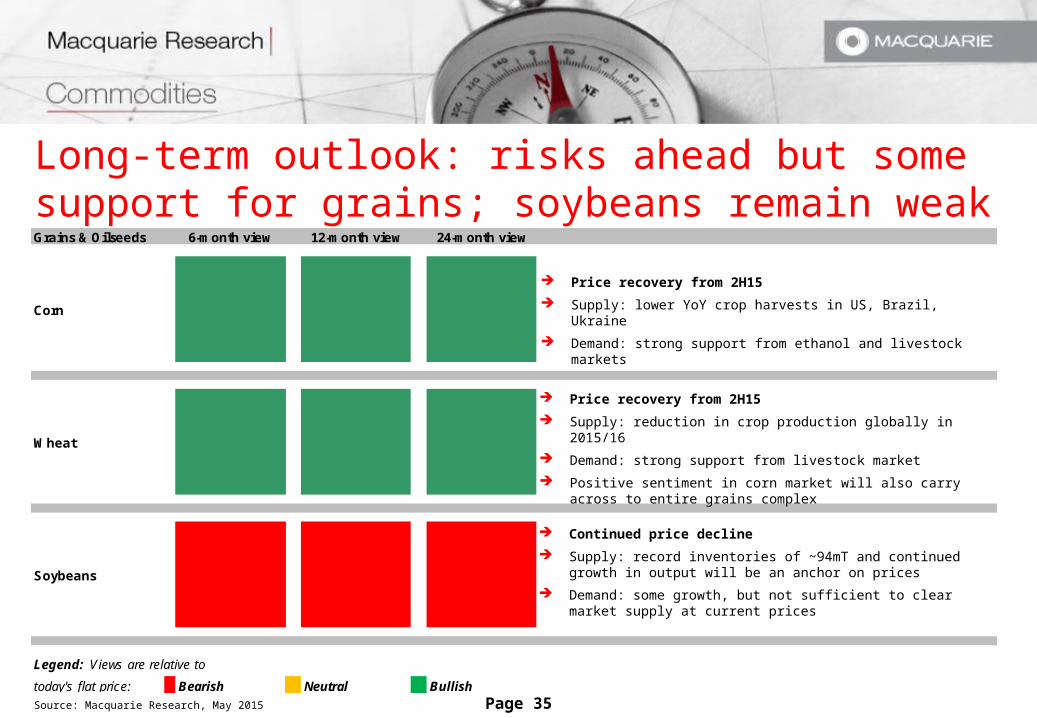
Grains & Oilseeds 6-month view 12-month view 24-month view
Corn
Wheat
Soybeans
today's flat price: Bearish Neutral Bullish
Legend: Views are relative to
Long-term outlook: risks ahead but some support for grains; soybeans remain weak
Source: Macquarie Research, May 2015
Price recovery from 2H15
Supply: reduction in crop production globally in 2015/16
Demand: strong support from livestock market
Positive sentiment in corn market will also carry across to entire grains complex
Price recovery from 2H15
Supply: lower YoY crop harvests in US, Brazil, Ukraine
Demand: strong support from ethanol and livestock markets
Continued price decline
Supply: record inventories of ~94mT and continued growth in output will be an anchor on prices
Demand: some growth, but not sufficient to clear market supply at current prices

Page 36
Important disclosures:
Recommendation definitions
Macquarie - Australia/New Zealand
Outperform – return > 3% in excess of benchmark return Neutral – return within 3% of benchmark return Underperform – return > 3% below benchmark return
Benchmark return is determined by long term nominal GDP growth plus 12 month forward market dividend yield
Macquarie – Asia/Europe
Outperform – expected return >+10%Neutral – expected return from -10% to +10%Underperform – expected <-10%
Macquarie First South - South Africa
Outperform – return > 10% in excess of benchmark returnNeutral – return within 10% of benchmark returnUnderperform – return > 10% below benchmark return
Macquarie - Canada
Outperform – return > 5% in excess of benchmark returnNeutral – return within 5% of benchmark returnUnderperform – return > 5% below benchmark return
Macquarie - USA
Outperform – return > 5% in excess of benchmark returnNeutral – return within 5% of benchmark returnUnderperform – return > 5% below benchmark return
Volatility index definition*This is calculated from the volatility of historic price movements.
Very high–highest risk – Stock should be expected to move up or down 60-100% in a year – investors should be aware this stock is highly speculative.
High – stock should be expected to move up or down at least 40-60% in a year – investors should be aware this stock could be speculative.
Medium – stock should be expected to move up or down at least 30-40% in a year.
Low–medium – stock should be expected to move up or down at least 25-30% in a year.
Low – stock should be expected to move up or down at least 15-25% in a year.
* Applicable to Australian/NZ stocks only
Recommendation – 12 months
Note: Quant recommendations may differ from Fundamental Analyst recommendations
Financial definitions
All "Adjusted" data items have had the following adjustments made:
Added back: goodwill amortisation, provision for catastrophe reserves, IFRS derivatives & hedging, IFRS impairments & IFRS interest expenseExcluded: non recurring items, asset revals, property revals, appraisal value uplift, preference dividends & minority interests
EPS = adjusted net profit /efpowa*ROA = adjusted ebit / average total assetsROA Banks/Insurance = adjusted net profit /average total assetsROE = adjusted net profit / average shareholders fundsGross cashflow = adjusted net profit + depreciation*equivalent fully paid ordinary weighted average number of shares
All Reported numbers for Australian/NZ listed stocks are modelled under IFRS (International Financial Reporting Standards).
Recommendation proportions – For quarter ending 31 March 2015
AU/NZ Asia RSA USA CA EUROutperform 48.99% 59.51% 49.30% 43.79% 59.59% 52.20% (for US coverage by MCUSA, 7.42% of stocks followed are investment banking clients) Neutral 34.12% 26.62% 35.21% 50.29% 34.93% 31.32% (for US coverage by MCUSA, 5.68% of stocks followed are investment banking clients) Underperform 16.89% 13.87% 15.49% 5.93% 5.48% 16.48% (for US coverage by MCUSA, 0.87% of stocks followed are investment banking clients)
Page 37
Company-Specific Disclosures: Important disclosure information regarding the subject companies covered in this report is available at www.macquarie.com/disclosures.
Analyst Certification: The views expressed in this research accurately reflect the personal views of the analyst(s) about the subject securities or issuers and no part of the compensation of the analyst(s) was, is, or will be directly or indirectly related to the inclusion of specific recommendations or views in this research. The analyst principally responsible for the preparation of this research receives compensation based on overall revenues of Macquarie Group Ltd ABN 94 122 169 279 (AFSL No. 318062) (MGL) and its related entities (the Macquarie Group) and has taken reasonable care to achieve and maintain independence and objectivity in making any recommendations.
General Disclaimers: Macquarie Securities (Australia) Ltd; Macquarie Capital (Europe) Ltd; Macquarie Capital Markets Canada Ltd; Macquarie Capital Markets North America Ltd; Macquarie Capital (USA) Inc; Macquarie Capital Securities Ltd and its Taiwan branch; Macquarie Capital Securities (Singapore) Pte Ltd; Macquarie Securities (NZ) Ltd; and Macquarie First South Securities (Pty) Limited; Macquarie Capital Securities (India) Pvt Ltd; Macquarie Capital Securities (Malaysia) Sdn Bhd; Macquarie Securities Korea Limited and Macquarie Securities (Thailand) Ltd are not authorized deposit-taking institutions for the purposes of the Banking Act 1959 (Commonwealth of Australia), and their obligations do not represent deposits or other liabilities of Macquarie Bank Limited ABN 46 008 583 542 (MBL) or MGL. MBL does not guarantee or otherwise provide assurance in respect of the obligations of any of the above mentioned entities. MGL provides a guarantee to the Monetary Authority of Singapore in respect of the obligations and liabilities of Macquarie Capital Securities (Singapore) Pte Ltd for up to SGD 35 million. This research has been prepared for the general use of the wholesale clients of the Macquarie Group and must not be copied, either in whole or in part, or distributed to any other person. If you are not the intended recipient you must not use or disclose the information in this research in any way. If you received it in error, please tell us immediately by return e-mail and delete the document. We do not guarantee the integrity of any e-mails or attached files and are not responsible for any changes made to them by any other person. MGL has established and implemented a conflicts policy at group level (which may be revised and updated from time to time) (the "Conflicts Policy") pursuant to regulatory requirements (including the FCA Rules) which sets out how we must seek to identify and manage all material conflicts of interest. Nothing in this research shall be construed as a solicitation to buy or sell any security or product, or to engage in or refrain from engaging in any transaction. In preparing this research, we did not take into account your investment objectives, financial situation or particular needs. Before making an investment decision on the basis of this research, you need to consider, with or without the assistance of an adviser, whether the advice is appropriate in light of your particular investment needs, objectives and financial circumstances. There are risks involved in securities trading. The price of securities can and does fluctuate, and an individual security may even become valueless. International investors are reminded of the additional risks inherent in international investments, such as currency fluctuations and international stock market or economic conditions, which may adversely affect the value of the investment. This research is based on information obtained from sources believed to be reliable but we do not make any representation or warranty that it is accurate, complete or up to date. We accept no obligation to correct or update the information or opinions in it. Opinions expressed are subject to change without notice. No member of the Macquarie Group accepts any liability whatsoever for any direct, indirect, consequential or other loss arising from any use of this research and/or further communication in relation to this research. Clients should contact analysts at, and execute transactions through, a Macquarie Group entity in their home jurisdiction unless governing law permits otherwise.
Disclaimer: The information contained in this e-mail is confidential and has been furnished to you solely for your use. You may not disclose, reproduce or distribute the information in any way. Macquarie does not guarantee the integrity of this e-mail or attached files.
Macquarie Capital (USA) Inc. affiliate research reports and affiliate employees are not subject to the disclosure requirements of FINRA rules. Any persons receiving this report directly from Macquarie Capital (USA) Inc. and wishing to effect a transaction in any security described herein should do so with Macquarie Capital (USA) Inc. In Germany, this research is issued and/or distributed by Macquarie Capital (Europe) Limited, Niederlassung Deutschland, which is authorised and regulated by the UK Financial Conduct Authority and in Germany by BaFin.
Macquarie salespeople, traders and other professionals may provide oral or written market commentary or trading strategies to our clients that reflect opinions which are contrary to the opinions expressed in this research. Macquarie Research produces a variety of research products including, but not limited to, fundamental analysis, macro-economic analysis, quantitative analysis, and trade ideas. Recommendations contained in one type of research product may differ from recommendations contained in other types of research, whether as a result of differing time horizons, methodologies, or otherwise.

Page 38
Country-Specific Disclaimers: Australia: In Australia, research is issued and distributed by Macquarie Securities (Australia) Ltd (AFSL No. 238947), a participating organisation of the Australian Securities Exchange. New Zealand: In New Zealand, research is issued and distributed by Macquarie Securities (NZ) Ltd, a NZX Firm. Canada: In Canada, research is prepared, approved and distributed by Macquarie Capital Markets Canada Ltd, a participating organisation of the Toronto Stock Exchange, TSX Venture Exchange & Montréal Exchange. Macquarie Capital Markets North America Ltd., which is a registered broker-dealer and member of FINRA, accepts responsibility for the contents of reports issued by Macquarie Capital Markets Canada Ltd in the United States and sent to US persons. Any US person wishing to effect transactions in the securities described in the reports issued by Macquarie Capital Markets Canada Ltd should do so with Macquarie Capital Markets North America Ltd. The Research Distribution Policy of Macquarie Capital Markets Canada Ltd is to allow all clients that are entitled to have equal access to our research. United Kingdom: In the United Kingdom, research is issued and distributed by Macquarie Capital (Europe) Ltd, which is authorised and regulated by the Financial Conduct Authority (No. 193905). Germany: In Germany, research is issued and distributed by Macquarie Capital (Europe) Ltd, Niederlassung Deutschland, which is authorised and regulated in the United Kingdom by the Financial Conduct Authority (No. 193905). France: In France, research is issued and distributed by Macquarie Capital (Europe) Ltd, which is authorised and regulated in the United Kingdom by the Financial Conduct Authority (No. 193905). Hong Kong & Mainland China : In Hong Kong, research is issued and distributed by Macquarie Capital Securities Ltd, which is licensed and regulated by the Securities and Futures Commission. In Mainland China, Macquarie Securities (Australia) Limited Shanghai Representative Office only engages in non-business operational activities excluding issuing and distributing research. Only non-A share research is distributed into Mainland China by Macquarie Capital Securities Ltd. Japan: In Japan, research is Issued and distributed by Macquarie Capital Securities (Japan) Limited, a member of the Tokyo Stock Exchange, Inc., Osaka Securities Exchange Co. Ltd. (Financial Instruments Firm, Kanto Financial Bureau (kin-sho) No. 231, a member of Japan Securities Dealers Association and The Financial Futures Association of Japan and Japan Investment Advisers Association). India: In India, research is issued and distributed by Macquarie Capital Securities (India) Pvt. Ltd. (CIN: U65920MH1995PTC090696), formerly known as Macquarie Capital (India) Pvt. Ltd., 92, Level 9, 2 North Avenue, Maker Maxity, Bandra Kurla Complex, Bandra (East), Mumbai – 400 051, India, which is a SEBI registered stockbroker having membership with National Stock Exchange of India Limited (INB231246738) and BSE Limited (INB011246734). Malaysia: In Malaysia, research is issued and distributed by Macquarie Capital Securities (Malaysia) Sdn. Bhd. (Company registration number: 463469-W) which is a Participating Organisation of Bursa Malaysia Berhad and a holder of Capital Markets Services License issued by the Securities Commission. Taiwan: In Taiwan, research is issued and distributed by Macquarie Capital Securities Ltd, Taiwan Branch, which is licensed and regulated by the Financial Supervisory Commission. No portion of the report may be reproduced or quoted by the press or any other person without authorisation from Macquarie. Nothing in this research shall be construed as a solicitation to buy or sell any security or product. Research Associate(s) in this report who are registered as Clerks only assist in the preparation of research and are not engaged in writing the research. Thailand: In Thailand, research is produced, issued and distributed by Macquarie Securities (Thailand) Ltd. Macquarie Securities (Thailand) Ltd. is a licensed securities company that is authorized by the Ministry of Finance, regulated by the Securities and Exchange Commission of Thailand and is an exchange member of the Stock Exchange of Thailand. The Thai Institute of Directors Association has disclosed the Corporate Governance Report of Thai Listed Companies made pursuant to the policy of the Securities and Exchange Commission of Thailand. Macquarie Securities (Thailand) Ltd does not endorse the result of the Corporate Governance Report of Thai Listed Companies but this Report can be accessed at: http://www.thai-iod.com/en/publications.asp?type=4. South Korea: In South Korea, unless otherwise stated, research is prepared, issued and distributed by Macquarie Securities Korea Limited , which is regulated by the Financial Supervisory Services. Information on analysts in MSKL is disclosed at http://dis.kofia.or.kr/websquare/index.jsp?w2xPath=/wq/fundMgr/DISFundMgrAnalystStut.xml&divisionId=MDIS03002001000000&serviceId=SDIS03002001000 . South Africa: In South Africa, research is issued and distributed by Macquarie First South Securities (Pty) Limited, a member of the JSE Limited. Singapore: In Singapore, research is issued and distributed by Macquarie Capital Securities (Singapore) Pte Ltd (Company Registration Number: 198702912C), a Capital Markets Services license holder under the Securities and Futures Act to deal in securities and provide custodial services in Singapore. Pursuant to the Financial Advisers (Amendment) Regulations 2005, Macquarie Capital Securities (Singapore) Pte Ltd is exempt from complying with sections 25, 27 and 36 of the Financial Advisers Act. All Singapore-based recipients of research produced by Macquarie Capital (Europe) Limited, Macquarie Capital Markets Canada Ltd, Macquarie First South Securities (Pty) Limited and Macquarie Capital (USA) Inc. represent and warrant that they are institutional investors as defined in the Securities and Futures Act. United States: In the United States, research is issued and distributed by Macquarie Capital (USA) Inc., which is a registered broker-dealer and member of FINRA. Macquarie Capital (USA) Inc, accepts responsibility for the content of each research report prepared by one of its non-US affiliates when the research report is distributed in the United States by Macquarie Capital (USA) Inc. Macquarie Capital (USA) Inc.’s affiliate’s analysts are not registered as research analysts with FINRA, may not be associated persons of Macquarie Capital (USA) Inc., and therefore may not be subject to FINRA rule restrictions on communications with a subject company, public appearances, and trading securities held by a research analyst account. Information regarding futures is provided for reference purposes only and is not a solicitation for purchases or sales of futures. Any persons receiving this report directly from Macquarie Capital (USA) Inc. and wishing to effect a transaction in any security described herein should do so with Macquarie Capital (USA) Inc. Important disclosure information regarding the subject companies covered in this report is available at www.macquarie.com/disclosures, or contact your registered representative at 1-888-MAC-STOCK, or write to the Supervisory Analysts, Research Department, Macquarie Securities, 125 W.55th Street, New York, NY 10019. © Macquarie Group


