
Caesium Workshop –Session 3
Cs and Sr transfers in Chernobyl Pilot Site soils
(Chernobyl Exclusion Zone)
Simonucci Caroline (Geochemist)
French Institute for Radioprotection and Nuclear Safety (IRSN)
▌Context
▌Site characterization
▌Modelling and system understanding
▌Summary & Perspectives for EPIC
▌Transfer to F-TRACE?

Caesium Workshop –Session 3
THE CHERNOBYL NPP ACCIDENT Ac
tivi
této
tale
dan
s l’
envi
ronn
emen
t (P
Bq)
Temps après l’accident (années)
Cs-137
I-131
Sr-90
Pu-241
Pu-239+240Am-241Ac
tivi
této
tale
dan
s l’
envi
ronn
emen
t (P
Bq)
Temps après l’accident (années)
Cs-137
I-131
Sr-90
Pu-241
Pu-239+240Am-241
Time after the accident (years)
Tota
l ac
tivi
ty in
the
en
viro
nmen
t (P
Bq)
(adapted from Smith & Beresford, 2005).
25
Cs-137
I-131
Sr-90
Pu-241
Am-241
• 04/26/1986: Explosion of Chernobyl NPP’s reactor n°4
• during 10 days: ~13650 PBq of radionuclides (RN) rejected in atmosphere (till 10 km high)
• Volatile elements: 131I, 133I, 137Cs, 90Sr, 129Te, 132Te, 103Ru et 106Ru
• Inert gases: 85Kr, 133Xe • Refractory elements : Pu isotopes
3/20
THE PILOT SITE (EPIC) N
Map indicating the location of different temporary waste deposit zones in Chernobyl exclusion zone and Sr-90 contaminated
underground waters (Antropov et al., 2001)
Reactor n°4 Chernobyl NPP
Map indicating the location of trenches and mounds in the « Red Forest » zone. T=trench, B=mound (Antropov et al., 2001)
N
Pilot Site (EPIC)
4/20 Caesium Workshop –Session 3
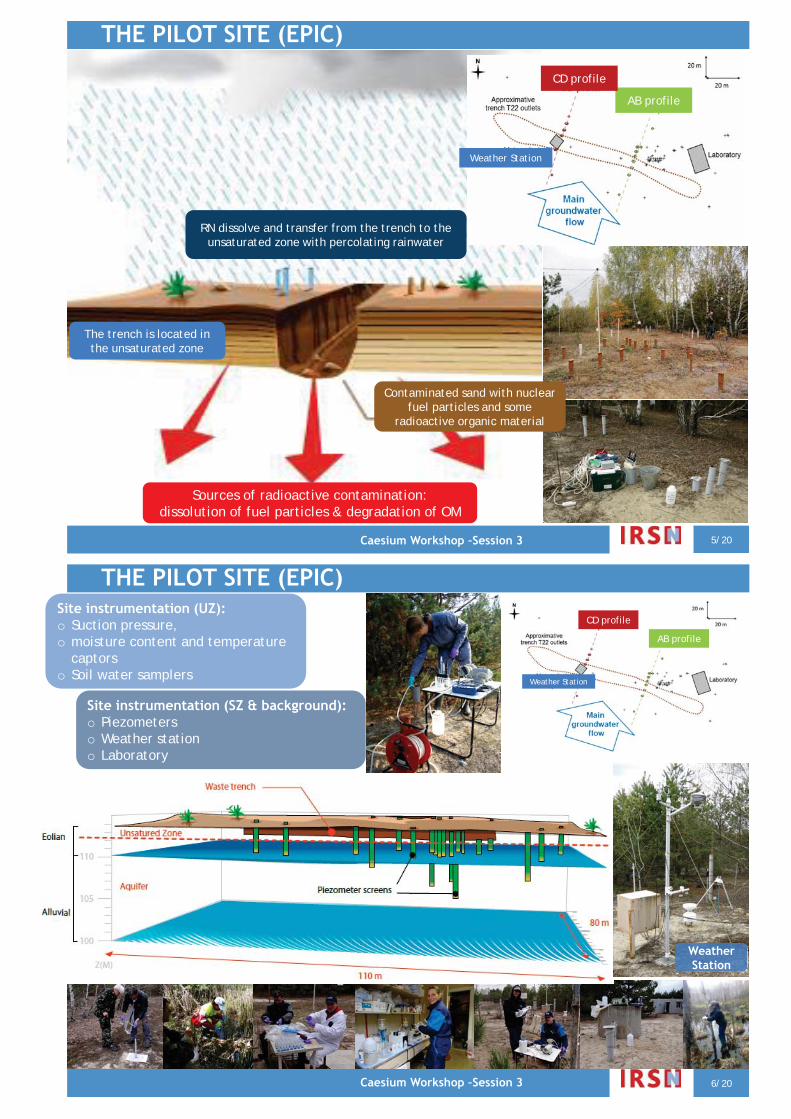
AB profile
CD profile
Weather Station
The trench is located in the unsaturated zone
Sources of radioactive contamination: dissolution of fuel particles & degradation of OM
RN dissolve and transfer from the trench to the unsaturated zone with percolating rainwater
Contaminated sand with nuclear fuel particles and some
radioactive organic material
5/20 Caesium Workshop –Session 3
THE PILOT SITE (EPIC)
THE PILOT SITE (EPIC)
Site instrumentation (SZ & background): o Piezometers o Weather station o Laboratory
Weather Station
AB profile
CD profile
Weather Station
6/20
Site instrumentation (UZ): o Suction pressure, o moisture content and temperature
captors o Soil water samplers
Caesium Workshop –Session 3

THE PILOT SITE (EPIC)
7/20 Caesium Workshop –Session 3
• Quartz (98-99%) • Heavy minerals (1-2%) • Organic carbon (<0.3%)
MEB observations of Pripyat Zaton sands, x 35 (Ardois et al., 2002)
Clay fraction (<1%): -illite, smectite, chlorite -feldspaths
quartz (90-94%) feldspath K-Na (5-9%) heavy minerals (<0.5%) hydromica, montmorillonite, cristalline calcite, quartz, amorphic iron oxides (<0.5%)
Eolian layer
Allulvial layer
Dep
th (
m)
% contribution of a granulometric class to the total composition
DERIVATION OF Cs AND Sr DATABASE
Site instrumentation (SZ & background): o Piezometers o Weather station o Laboratory
8/20
Site instrumentation (UZ): o Suction pressure, moisture
content and temperature captors
o Soil water samplers
Caesium Workshop –Session 3
Monitoring data
CHERNOBYL database

THE SOURCE TERM Uranium oxide particles: UO2
& UO2+x
Uranium & zirconium oxide particles:
ZrUyOx
kUO2+x
kUO2
pH=5
(Van Meir et al., 2009).
9/20
Kinetic modeling of Fuel Particles dissolution (FP)
kUO2+x
kUO2
pH=5
Particles dissolution (FP)
25 years after the accident:
* All the soluble particles should have been dissolved (UO2+x type), a priori * All RN from dissolved FP should have been released into soil solution, a priori
Mainly the less degradable compounds are left (UO2 & ZrUyOx types)?
Decrease of available stocks and of Sr fluxes?
outside T22 T22
Specific activity in 137Cs & 90Sr in the trench 22 is ~105 to 106 Bq/kg (Guillou et al., 2000 ; Kashparov et al., 2004 ; Dewière et al., 2004)
THE SOURCE TERM: Cs and Sr distribution
Reworked layer
ZNS
Reworked layer

Ancien puits
TWS
BGA
TLA
Ancien puits
TWS
BGA
TLA
(Kashparov et al., 2003, 2012)
N
Spatial distribution of 137Cs in the trench (3D model)
• Integration of 137Cs activity ponctual data
• Interpolation of these data by kriging method
Results : -2D and 3D spatial distribution of 137Cs in the trench
- a better definition of the trench layout
THE SOURCE TERM: Cs and Sr distribution
Layout of the trench–3D model
Ancien puits
TWS
BGA
TLA
Ancien puits
TWS
BGA
TLA
N
•
(Bugai et al., 2012)
(Van Meir et al., 2009)

(Bugai et al., 2011)
Extension of the plume: 200 m length 10 m depth
Stationary conditions - 2D model
Global model - Kinetic model of fuel particles dissolution (dynamic model) - Stationary model for the saturated zone (plume)
NUMERICAL SIMULATION OF Sr90-PLUME EVOLUTION
Extension of the plume: 60 m length 4 m depth
13/20
(Bugai et al., 2011)
Extension of the plume: 200 m length 10 m depth
Stationary conditions - 2D model
Global model - Kinetic model of fuel particles dissolution (dynamic model) - Stationary model for the saturated zone (plume)
NUMERICAL SIMULATION OF Sr90-PLUME EVOLUTION
Extension of the plume: 60 m length 4 m depth
14/20 14/20
Transport model in the groundwater: •No chemical-physical variations •No variations of groundwater flow •No seasonality •No OM as part of the source term

o migration velocity 137Cs : ~0.16 cm/y (Szenknect, 2003; Guillou et al., 2000) o Low content in 137Cs measured in the aquifer downgradient T22 : <0,1 Bq/L o 2011-12: above detection limit concentrations in the groundwater: >3 Bq/L o 137Cs activities in T22 soil solution: 45-52 Bq/L >> 0,03 Bq/L in Pripyat river o Strong affinity of Cs with OM (cf. fig) o Cs is used by the plant (competing with nutrients like; Ca, K, etc.)
137Cs is mainly located in the trench and use by the vegetation
What about the Cs plume at T22?
y = 637,04x + 37731R2 = 0,9393
y = 246,07x - 2947R2 = 0,2589
0,E+00
1,E+05
2,E+05
3,E+05
4,E+05
5,E+05
6,E+05
7,E+05
8,E+05
0 200 400 600 800 1000 1200
SH extraites (mgCorg/L)
Cs1
37 (B
q/kg
)
T22
Hors T22
22
21 234
123
10
1
8
20
(F. Coppin, communication personnelle)
THE SOURCE TERM: Cs and Sr distribution
Kinetic of organic decaying: • fast decaying of easily degradable compounds (T1/2= 3-4 years) for fine liter (Pausas, 1997) • slow decaying of less degradable compounds (T1/2= 7-42 years) for coarser materials (Currie et al., 2002
THE SECONDARY SOURCE TERM
• tree-trunks • forest contaminated soils + liter (OM 3-6%) • vegetable debris: needles, branches, … • other sup. plants: herbs, shrubs, …
pines birches
ICOBTE 2013 – Environmental Radioactivity: Legacy Sites, Chernobyl and Fukushima 16/20
25 years after the accident:
Most of the organic compounds easily degradable have been transformed Mainly the less degradable compounds are left (ex.: trunks)?

BIOTIC MIGRATION OF RADIONUCLIDES
17/20
1998
2008
RN activity in trees (2001) 90Sr - 0.6 – 6.7 MBq/kg
137Cs - 0.01 – 2.1 MBq/kg (Kashparov et al., 2002)
Vegetation on the top of the trench: 47 pines, 14 birch trees, 49 bushes
(at approx. 400 m2 area)
Chronicle of 90Sr fluxes evolution in the aquifer vs. water-table fluctuations
trench bottom
2013
18/20

19/20
Mai 2013 EPIC Site
Chronicle of 90Sr fluxes evolution in the aquifer vs. water-table fluctuations
(Bugai et al., 2012)
Evolution of 90Sr fluxes coming out of the trench and to the aquifer
20/20
Explicative processes: • stock of soluble fuel particles
• stock of easily degradable organic matter • modification of the physical-chemical environment
• of transfers (cations & RN) to the superior plants with of their biomass
Role of vegetation: - direct RN uptake; - nutrient element (Ca,K…) uptake, which influences GW geochemistry and hence - RN mobility

Evolution of 137Cs fluxes coming out of the trench and to the aquifer
21/20
Explicative processes: • stock of soluble fuel particles
• stock of easily degradable organic matter • modification of the physical-chemical environment
• of transfers (cations & RN) to the superior plants with of their biomass
Role of vegetation: - direct RN uptake; - nutrient element (Ca,K…) uptake, which influences GW geochemistry and hence - RN mobility
137Cs flux 137Cs flux
2011-2012
VCs ~ 0.16 cm/y VCs ~ 0.16 cm/y
VCs ~ ?
137Cs flux
(based Bugai et al., 2012)
Cs < 0.1Bq/L (DL: 0.03Bq/L) Cs ~ 0.1Bq/L Cs ~ 3-5 Bq/L
(Martin-Garin et al., 2012)
22/20
90Sr fluxes from the trench may be controlled by: • Dynamic of bio-physical-chemical modifications linked with stocks of buried OM and with their kinetic of degradation • Transfers towards plants which lead to an increase with time of plant biomass • Seasonality

WHAT DID WE LEARN? • Complex relationships between hydrogeological, geochemical and biological processes observed in the “real world” of a contaminated site such as the Red Forest (EPIC site)
require the achievement of interdisciplinary researches • The realization of relevant predictive calculation requires the use of a GLOBAL MODEL coupling transfers and RN migration in every compartment of interests (atmosphere, UZ,
SZ, vegetable cover), and to consider the influence of the main geochemical and biological factors
23/20
SUMMARY & PERSPECTIVES
WHAT DID WE LEARN? • Complex relationships between hydrogeological, geochemical and biological processes observed in the “real world” of a contaminated site such as the Red Forest (EPIC site)
require the achievement of interdisciplinary researches • The realization of relevant predictive calculation requires the use of a GLOBAL MODEL coupling transfers and RN migration in every compartment of interests (atmosphere, UZ,
SZ, vegetable cover), and to consider the influence of the main geochemical and biological factors
SUMMARY & PERSPECTIVES
WHAT IS NEXT? • Global numerical modeling coupling biogeochemistry-transport for Sr, Cs
• Evolution of the buried source term 25 years after: reevaluation of inventories for FP and OM. What is the main process that rule the dynamic of their evolution?; What is the
role of microorganisms and their influence?; Water-table fluctuation influence (flood of the bottom of the trench) vs. precipitation influence on the dynamic of RN release?
24/20

WHAT DID WE LEARN? • Complex relationships between hydrogeological, geochemical and biological processes observed in the “real world” of a contaminated site such as the Red Forest (EPIC site)
require the achievement of interdisciplinary researches • The realization of relevant predictive calculation requires the use of a GLOBAL MODEL coupling transfers and RN migration in every compartment of interests (atmosphere, UZ,
SZ, vegetable cover), and to consider the influence of the main geochemical and biological factors
• Dynamic of the RN uptake by plants (bioavailability, translocation, bioaccumulation) • The importance and the impact of a new source term, more diffuse on soil surface
(contaminated liters); modification of RN speciation and their reactivity? • Scale changing: from the pilot site to the exclusion zone (water-basin scale)
WHAT IS NEXT? • Global numerical modeling coupling biogeochemistry-transport for Sr, Cs
• Evolution of the buried source term 25 years after: reevaluation of inventories for FP and OM. What is the main process that rule the dynamic of their evolution?; What is the
role of microorganisms and their influence?; Water-table fluctuation influence (flood of the bottom of the trench) vs. precipitation influence on the dynamic of RN release?
• Modeling of the most complex cases (Pu, U, etc.)? These last will need the use of other coupling (e.g. colloids role; interaction with microorganisms; factors controlling speciation
variations, …)
25/20
SUMMARY & PERSPECTIVES
How to: • Manage soil decontamination in a post-accidental situation? • Remove radionuclides from soils? • Manage remediation wastes? • Organize the return of population and under what exposure conditions? • Manage land reuse when population returns? • Manage/organize monitoring after the return of population?
Yuichi Onda
Post-accidental situation: What can we learn? Contribution to F-TRACE

Integrated Modeling Laboratory Studies
& Field Observations
• Long-term predictions of RN transfers • Impact assessment • Upscaling • Remediation solutions • Population return and use of land
How geochemistry and hydrology can help?
How geostatistics can help?
How biochemistry can help?
How modeling can help?
Which tools can we use?
28/20
DGT can be used for many different purposes, including: • In situ measurements • Monitoring (time averaged concentrations) • Speciation (labile inorganic and/or organic species) • Bioavailability (effective concentration) • Trace metals, phosphate, sulphide and RN • Fluxes & conc. in sediments/soils & fresw./seaw. • Kinetic and thermodynamic constants • High spatial resolution measurements (sub-mm) • 2D concentration images
DET can be used for in situ measurements of solute
concentrations at high spatial resolution
DET: Diffusive Equilibration in Thin films DGT: Diffusive Gradient in Thin-films
DGT & DET were invented by Bill Davison and Hao Zhang
0
depth
Concentration or flux

How geostatistics can help?
- How to improve RN mass estimate from an optimized sampling plan? - How to assess uncertainty on contaminated volumes of soils?
Which tools can we use?
How biochemistry can help?
What about Fukushima Contaminated Soils? Delmont et al. 2011
Which biochemical functions are lost in a contaminated soil? Metagenomic analysis (i.e. analysis of the DNA of all the soil microorganisms) could help to: - assess the contamination impact - better identify biochemical reactions occurring in the contaminated soils and whether they impact RN fate
Which tools can we use?

THANK YOU VERY MUCH FOR YOUR
ATTENTION!


