
COWAL SITE VISITJOHN PENHALL – GENERAL MANAGER
31 March 2021

ACKNOWLEDGEMENT OF COUNTRY
2
We would like to acknowledge
the Wiradjuri people who are the
Traditional Custodians of the Land.
We would also like to pay respect
to the Elders both past and
present of the Wiradjuri Nation
and extend that respect to other
Indigenous Australians who are
present.
“We are all visitors to this time, this place. We are just passing through. Our purpose here is to
observe, to learn, to grow, to love… and then we return home.”
Aboriginal Proverb

3
These materials prepared by Evolution Mining Limited (or “the Company”) include forward looking statements. Often, but not always, forward looking statements can
generally be identified by the use of forward looking words such as “may”, “will”, “expect”, “intend”, “plan”, “estimate”, “anticipate”, “continue”, and “guidance”, or other
similar words and may include, without limitation, statements regarding plans, strategies and objectives of management, anticipated production or construction
commencement dates and expected costs or production outputs.
Forward looking statements inherently involve known and unknown risks, uncertainties and other factors that may cause the Company’s actual results, performance and
achievements to differ materially from any future results, performance or achievements. Relevant factors may include, but are not limited to, changes in commodity
prices, foreign exchange fluctuations and general economic conditions, increased costs and demand for production inputs, the speculative nature of exploration and
project development, including the risks of obtaining necessary licenses and permits and diminishing quantities or grades of reserves, political and social risks, changes to
the regulatory framework within which the Company operates or may in the future operate, environmental conditions including extreme weather conditions, recruitment
and retention of personnel, industrial relations issues and litigation.
Forward looking statements are based on the Company and its management’s good faith assumptions relating to the financial, market, regulatory and other relevant
environments that will exist and affect the Company’s business and operations in the future. The Company does not give any assurance that the assumptions on which
forward looking statements are based will prove to be correct, or that the Company’s business or operations will not be affected in any material manner by these or other
factors not foreseen or foreseeable by the Company or management or beyond the Company’s control.
Although the Company attempts and has attempted to identify factors that would cause actual actions, events or results to differ materially from those disclosed in forward
looking statements, there may be other factors that could cause actual results, performance, achievements or events not to be as anticipated, estimated or intended, and
many events are beyond the reasonable control of the Company. Accordingly, readers are cautioned not to place undue reliance on forward looking statements. Forward
looking statements in these materials speak only at the date of issue. Subject to any continuing obligations under applicable law or any relevant stock exchange listing
rules, in providing this information the Company does not undertake any obligation to publicly update or revise any of the forward looking statements or to advise of any
change in events, conditions or circumstances on which any such statement is based.
This presentation has been approved for release by Evolution’s Board of Directors.
AUD:USD exchange rate assumption of 0.75 used throughout this presentation unless stated otherwise.
FORWARD LOOKING STATEMENT
44
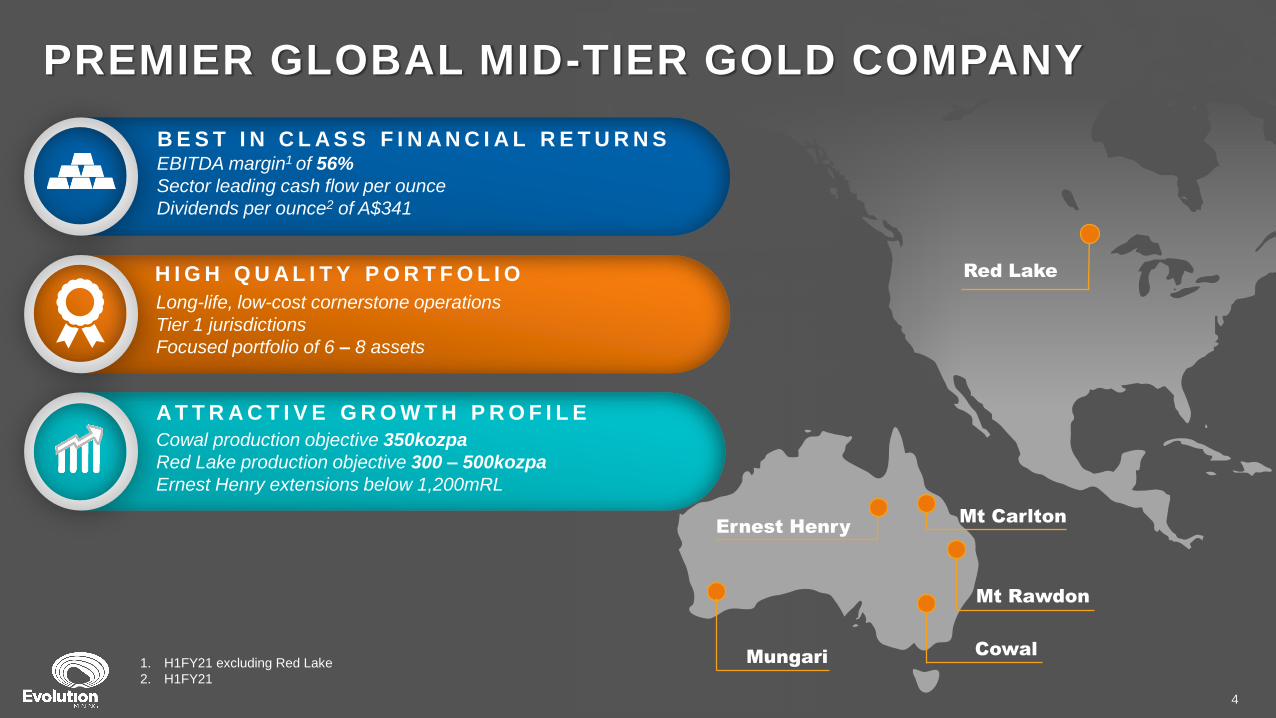
PREMIER GLOBAL MID-TIER GOLD COMPANY
Red Lake
A T T R A C T I V E G R O W T H P R O F I L E
Cowal production objective 350kozpa
Red Lake production objective 300 – 500kozpa
Ernest Henry extensions below 1,200mRL
2.8
H I G H Q U A L I T Y P O R T F O L I O
Long-life, low-cost cornerstone operations
Tier 1 jurisdictions
Focused portfolio of 6 – 8 assets
B E S T I N C L A S S F I N A N C I A L R E T U R N S EBITDA margin1 of 56%
Sector leading cash flow per ounce
Dividends per ounce2 of A$341
Mt Carlton
Mungari Cowal
Mt Rawdon
Ernest Henry
1. H1FY21 excluding Red Lake
2. H1FY21

OUR VALUES: SAFETY EXCELLENCE ACCOUNTABILITY RESPECT
The objective of our sustainability efforts is to deliver long-term stakeholder value through
safe, low-cost gold production in an environmentally and socially responsible manner
Be an employer of choice
attracting the most
talented people and foster
a safe, diverse and
inclusive workplace
Demonstrate robust risk
management and safety
leadership
Contribute positively to
local, regional and
national sustainability
efforts by achieving an
outstanding level of
environmental
stewardship
Actively manage climate
related risks and
opportunities including
improving energy efficiency
and the responsible
management of water
Protect and enhance our
reputation as a trusted
partner and provide
community benefits that
endure beyond the life of
our mines
Advance the outcomes for
indigenous peoples and
protect their Cultural
Heritage
Be transparent at all levels of
Corporate Governance,
comply with applicable laws &
regulations and operate at the
highest standards of financial
and ethical behaviour
Respect the human rights
of all our stakeholders Relentlessly drive for
operational excellence
through an innovative
culture and inspired
people delivering to plan
5
SUSTAINABILITY PRINCIPLES
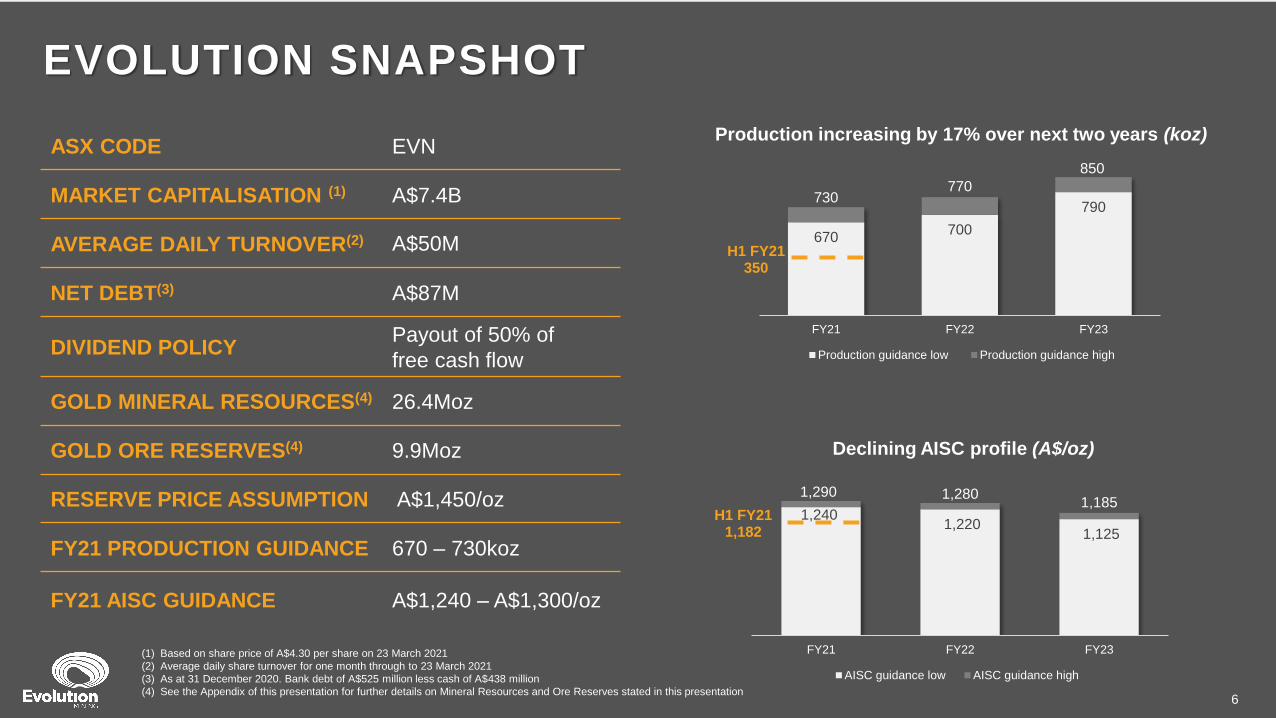
EVOLUTION SNAPSHOT
(1) Based on share price of A$4.30 per share on 23 March 2021
(2) Average daily share turnover for one month through to 23 March 2021
(3) As at 31 December 2020. Bank debt of A$525 million less cash of A$438 million
(4) See the Appendix of this presentation for further details on Mineral Resources and Ore Reserves stated in this presentation
ASX CODE EVN
MARKET CAPITALISATION (1) A$7.4B
AVERAGE DAILY TURNOVER(2) A$50M
NET DEBT(3) A$87M
DIVIDEND POLICYPayout of 50% of
free cash flow
GOLD MINERAL RESOURCES(4) 26.4Moz
GOLD ORE RESERVES(4) 9.9Moz
RESERVE PRICE ASSUMPTION A$1,450/oz
FY21 PRODUCTION GUIDANCE 670 – 730koz
FY21 AISC GUIDANCE A$1,240 – A$1,300/oz
6
Production increasing by 17% over next two years (koz)
Declining AISC profile (A$/oz)
670700
790730
770
850
H1 FY21350
FY21 FY22 FY23
Production guidance low Production guidance high
1,240 1,220
1,125
1,290 1,2801,185
H1 FY21 1,182
FY21 FY22 FY23
AISC guidance low AISC guidance high

COWAL CONTRIBUTION
TO EVOLUTION GROUP
Cowal29%
OPERATING CASH FLOW
H1 FY21 (A$M)
Cowal37%
MINERAL RESOURCES DECEMBER 2020
(OUNCES)
Cowal46%
ORE RESERVES DECEMBER 2020
(OUNCES)
Cowal31%
PRODUCTION H1 FY21 (OUNCES)
COWAL – A CORNERSTONE ASSET
Building towards sustainable, reliable, low-cost production of 350,000 ounces per annum
Continued growth opportunities from high-grade underground ore body which remains open
Open pit Ore Reserves provide long-term production base
Low-cost processing plant (permitted to 9.8Mtpa)
Supportive stakeholders, community and government
Potential for new discoveries
7

LocationApproximately 38km north-east of West
Wyalong in New South Wales, Australia
Property
Mining Lease (ML 1535 & ML1791)
encompasses an area of 2,886 hectares and
lies within Evolution’s total property holding
of ~14,200 hectares
Commencement Mining commenced 2005 and processing 2006
Approval Operation currently approved until 2032
Mining method Conventional open pit
Owner-Miner
Minerals Gold
Mineralisation type
Structurally hosted epithermal to
mesothermal sheeted veins and shear hosted
lodes
Tenement package 1,358km2
Process methodGrinding, gravity, flotation and cyanide
leaching circuits
Plant capacity ~9Mtpa – permitted to 9.8Mtpa
Ore Reserves 137.9Mt at 1.04g/t Au for 4.6Moz Au
Mineral Resources 290.2Mt at 1.04g/t Au for 9.7Moz Au
AccessSealed road connecting to West Wyalong
and major regional highways
PowerGrid power supplied to the mine by
132kV transmission line
Workforce Residential
Employees and
contractors~500
Time roster 7:7, 8:6, 5:2:4:3
Sydney
COWAL – A WORLD CLASS DEPOSIT
8
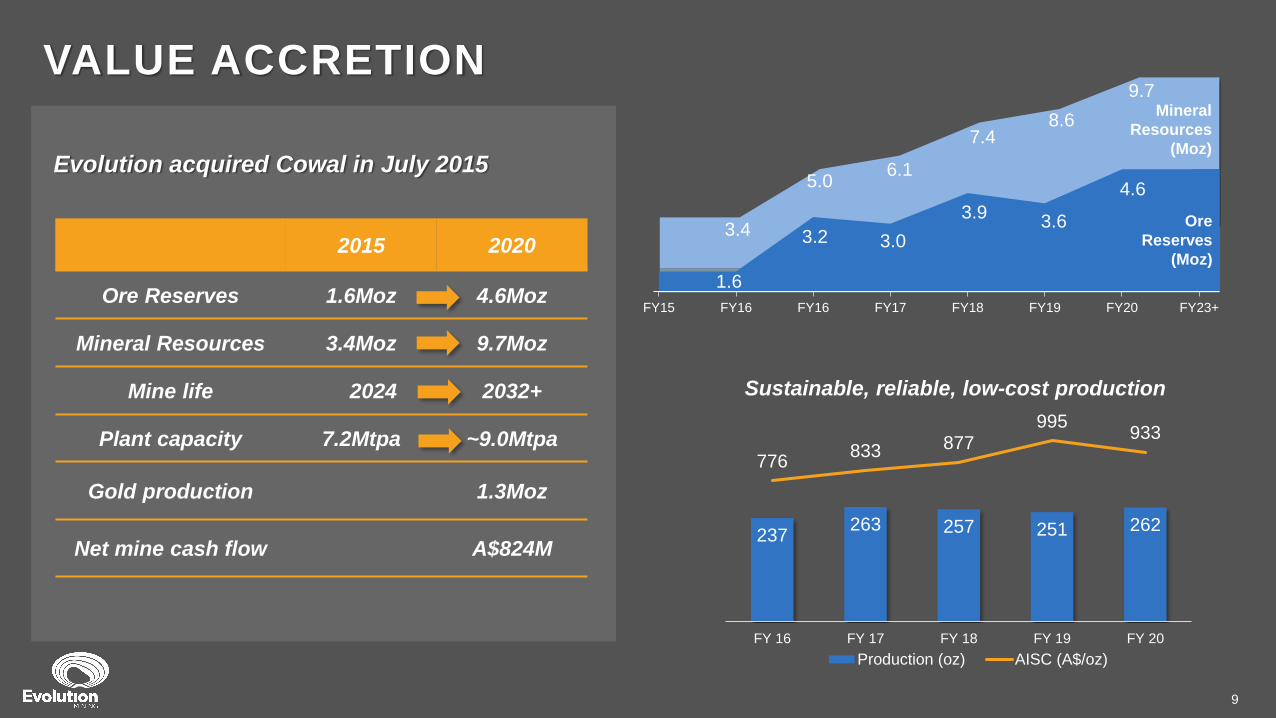
2015 2020
Ore Reserves 1.6Moz 4.6Moz
Mineral Resources 3.4Moz 9.7Moz
Mine life 2024 2032+
Plant capacity 7.2Mtpa ~9.0Mtpa
Gold production 1.3Moz
Net mine cash flow A$824M
1.6
3.2 3.0
3.9 3.64.63.4
5.06.1
7.48.6
9.7Mineral
Resources
(Moz)
FY15 FY16 FY16 FY17 FY18 FY19 FY20 FY23+
3.2
1.6
3.0
3.93.6
4.6
237263 257 251 262
776833 877
995933
FY 16 FY 17 FY 18 FY 19 FY 20
Production (oz) AISC (A$/oz)
Sustainable, reliable, low-cost production
Ore
Reserves
(Moz)
Evolution acquired Cowal in July 2015
VALUE ACCRETION
9

Governance
Health, Safety and Wellbeing
Environment
Cultural Heritage
Diversity
Economic Contributions
Social Responsibility
Climate-related Risk
SUSTAINABILITYINTEGRATED INTO EVERYTHING WE DO
▪ Water Management
▪ Increased return water for reuse from
Integrated Waste Landform (+20%/day)
▪ Saline water to reduce reliance on
freshwater resources
▪ Extreme weather support for the community
▪ Developing energy and emissions reduction
pathways toward net zero
▪ ~5% Indigenous workers, advancing cultural
competency
▪ ~18% female workers
▪ Diversity and Inclusion focus
▪ A$18M of NSW Royalties paid in FY20
▪ Local procurement spend ~A$37Mpa
▪ COVID-19 enhanced business continuity
planning
▪ Strong reporting, investigation and
learning culture
▪ Risk based decision approach supported
by policies & standards
▪ Risk Management framework aligned with
Australian and International standards
and guidelines
▪ Signatories to the International Cyanide
Management Code
▪ ISO14001 certified
▪ Integrated Waste Landform (IWL)
▪ Zero incidents of material harm
▪ Digitisation of data monitoring
▪ Increased biodiversity in lake due to good
land management
▪ ~500+ local jobs (>70% reside in
region)
▪ Partnership with Wiradjuri Condobolin
Corporation
▪ Supportive stakeholders, community
and government
▪ Developing long-term strategic
partnerships assuring cultural heritage
with traditional custodians
10
Leadership
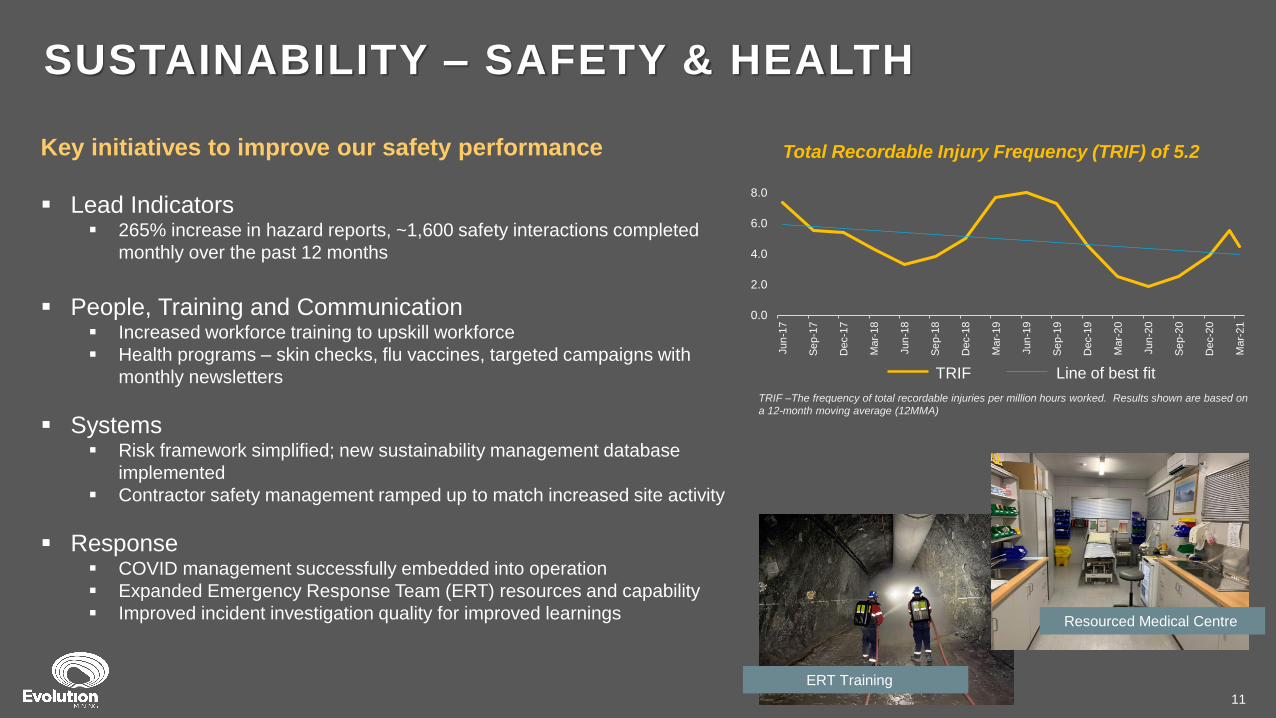
SUSTAINABILITY – SAFETY & HEALTH
Key initiatives to improve our safety performance
▪ Lead Indicators▪ 265% increase in hazard reports, ~1,600 safety interactions completed
monthly over the past 12 months
▪ People, Training and Communication▪ Increased workforce training to upskill workforce
▪ Health programs – skin checks, flu vaccines, targeted campaigns with
monthly newsletters
▪ Systems▪ Risk framework simplified; new sustainability management database
implemented
▪ Contractor safety management ramped up to match increased site activity
▪ Response▪ COVID management successfully embedded into operation
▪ Expanded Emergency Response Team (ERT) resources and capability
▪ Improved incident investigation quality for improved learnings
Total Recordable Injury Frequency (TRIF) of 5.2
TRIF –The frequency of total recordable injuries per million hours worked. Results shown are based on
a 12-month moving average (12MMA)
11
0.0
2.0
4.0
6.0
8.0
Jun
-17
Se
p-1
7
Dec-1
7
Ma
r-18
Jun
-18
Se
p-1
8
Dec-1
8
Ma
r-19
Jun
-19
Se
p-1
9
Dec-1
9
Ma
r-20
Jun
-20
Se
p-2
0
Dec-2
0
Ma
r-21
TRIF Line of best fit
ERT Training
Resourced Medical Centre

COWAL GROWTH STRATEGY
Building towards consistent, reliable, low-cost
production for 20+ years
▪ Underground development – pathway to 350kozpa
▪ Underground Feasibility Study underway
▪ 3.0Moz Mineral Resource, 1.0Moz Ore Reserve
▪ High-grade orebodies open at depth
▪ Process permitting to 9.8Mtpa for long-term optionality
▪ Open pits provides long-term base load ore feed
▪ Stage H cutback
▪ Pre-feasibility study: potential E42 extensions
beyond Stage H, E41 and E46 satellite pits
▪ Continued transformational organic growth driven by
discovery
▪ World-class gold-copper geologic setting
12

UNDERGROUND FEASIBILITY STUDY
North
Leveraging opportunity
• Delivered increased Resources and Reserves
• Optimising mine design to prioritise higher grade
Progressing design and procurement
• Early contractor involvement in mining and construction design
• Engineering design 30% complete – on track
Progressing permitting
• Low environmental impact
• Mod16, State Significant Development
• Strong community support
Reducing risk
• Geotechnical drilling
• Metallurgical test work
• Execution planning
VALUE DEFINITION
RELIABLE EXECUTION LICENCE TO OPERATE
Feasibility Study Life of Mine design of
underground development and stopes
13
Decline
Fresh air intake
Air exhaust
Ore drives
Uphole stopes
Downhole stopes100m

FY2017 – 2018 FY2019 – 2020FY2016
Mine permit extended to
2032
Dalwhinnie underground
discovery
Regulatory approval to
expand plant to
9.8Mtpa
Integrated Waste
Landform commenced
Stage H Cutback
commenced
Acquired in July
2015
Mine permit to 2024
Plant capacity
7.5Mtpa
Warragaunderground exploration decline
Plant capacity increased to 9.0 Mtpa - low-cost processing
Float Tails Leach
Underground
Feasibility Study
underway and
Regulatory
approvals submitted
✓ Expanded Underground gold Mineral
Resources (3.0Moz) and Ore Reserves
(1.0Moz)
▪ Underground Feasibility Study – on
schedule
▪ Regulatory approval for underground mine
▪ Development of primary decline and
primary vent
▪ Paste Fill plant construction
▪ Accommodation village construction
▪ Development of non-processing
infrastructure
▪ First underground production
FY2021 – FY2023 FY2024 +
▪ Accelerate underground
production through mining
higher grade in early years
Platform for future growth
▪ Continued growth in
underground resources and
reserves – higher grade
orebodies remain open
▪ Production from open pits
beyond E42 Stage H
▪ Regional exploration
Achievements
PATHWAY TO INCREASE ANNUAL PRODUCTION TO 350KOZ+
AVERAGE ANNUAL PRODUCTION ~250KOZ AT AISC A$880/OZ (US$660/OZ)
Key milestones to 350kozpa+
UNDERGROUND DEVELOPMENT
PATHWAY TO >350KOZPA OF LOW-COST PRODUCTION

0 4,000m
GRE46
E42
E41
E39
E43 Marsden
Milly
MillySouth Cowal
Marsden South
World class geologic setting for gold and copper-
gold deposits
1,358 km2 landholding in the Junee-Narromine Belt
of the Macquarie Arc
Multiple target styles:
▪ Epithermal gold deposits (eg E42, GRE46, E41)
▪ Porphyry copper-gold deposits (Cadia, North
Parkes, Marsden)
REGIONAL OPPORTUNITY
15
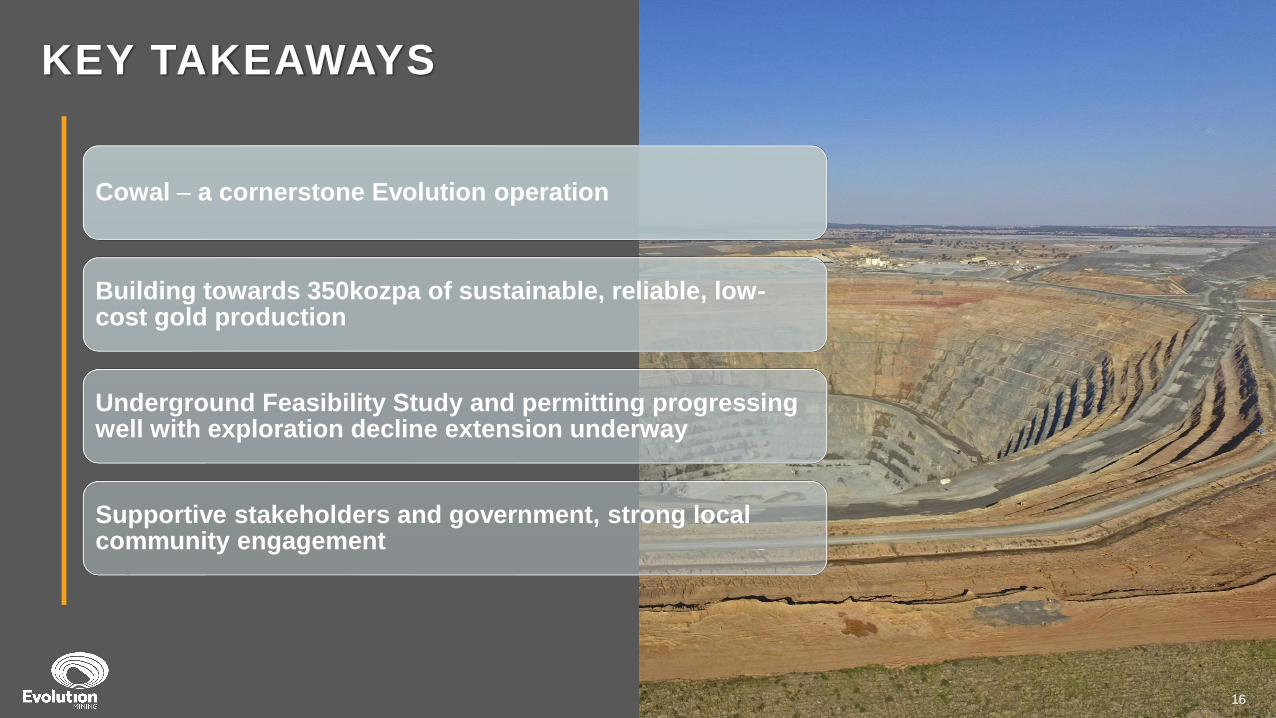
KEY TAKEAWAYS
16
Cowal – a cornerstone Evolution operation
Building towards 350kozpa of sustainable, reliable, low-cost gold production
Underground Feasibility Study and permitting progressing well with exploration decline extension underway
Supportive stakeholders and government, strong local community engagement
16

APPENDIX

COWAL SITE LAYOUT
Integrated Waste Landform E42 Open Pit
Processing plant
18
Current Underground Portal
Lookout – Lake Cowal
Lookout – E42 Open Pit
Lake
Cowal
kilometres
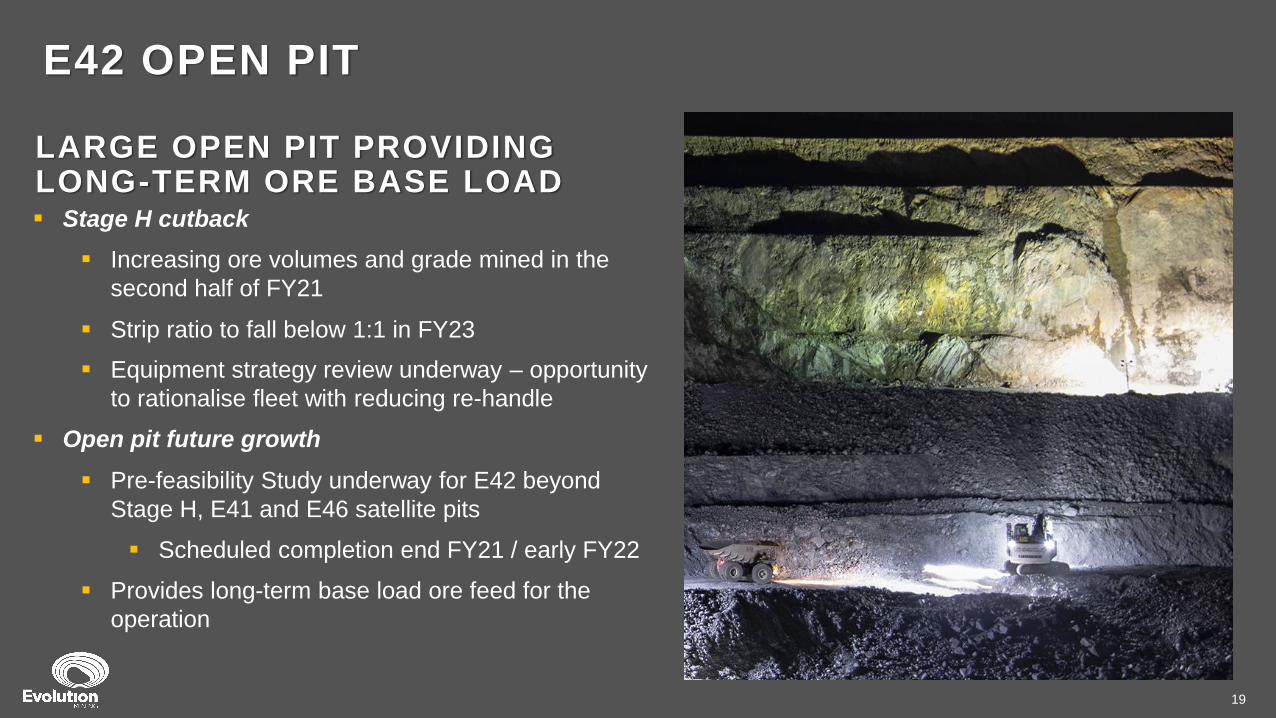
E42 OPEN PIT
▪ Stage H cutback
▪ Increasing ore volumes and grade mined in the
second half of FY21
▪ Strip ratio to fall below 1:1 in FY23
▪ Equipment strategy review underway – opportunity
to rationalise fleet with reducing re-handle
▪ Open pit future growth
▪ Pre-feasibility Study underway for E42 beyond
Stage H, E41 and E46 satellite pits
▪ Scheduled completion end FY21 / early FY22
▪ Provides long-term base load ore feed for the
operation
LARGE OPEN PIT PROVIDING LONG-TERM ORE BASE LOAD
19

Haulage/mine trucks
• 20 x Cat 789C Dump Trucks
• 3 x Cat 785C Dump Trucks
Drilling equipment
• 6 x Atlas Copco D65 (Hired)
• 1 x Drill rigs Australia GC600
Dozers
• 5 x CAT D10T Tracked Dozers
• 1 x CAT834H Wheel Dozer
Shovels/excavators/loaders
• 1 x Liebherr 9400 Excavator
• 1 x Liebherr 994B Excavator
• 1 x Liebherr 9200 Excavator
• 1 x Hitachi EX1200 Excavator
• 3 x Cat 992G Loaders
Haul road maintenance equipment
• 2 x Cat 16H Graders
• 1 x Cat 345 Excavator
• 2 x Cat 777D Water Carts
IWL Equipment
• 3 x Hitachi Excavators
• 4 x 777F Caterpillar Haul trucks
• 5 x 745 Caterpillar Articulated Haul
trucks
• 2 x Watercarts
• 1 x 992 G Caterpillar Loader
• 4 x Caterpillar Track dozers
• 4 X Rollers
• 1 x 14M Caterpillar Grader
MINING FLEET
20

RESOURCE AND RESERVE EXPANSION
Section of Cowal GRE46 underground area. Orange shows the outline
of the December 2018 mineable shape optimiser (MSO) outlines and
yellow shows the December 2020 MSO outlines. Planned drilling from
the exploration decline is shown in blue
Long projection of the GRE46 structure looking west showing the
location of drilling and associated results highlights completed
during the December 2020 quarter
GRE46 results are extracted from the report entitled “December 2020 Quarterly Report” released to the ASX 28 January 2021 and available to view at www.evolutionmining.com.au. The Company confirms
that it is not aware of any new information or data that materially affects the information in the original market announcement. The Company confirms that the form and context in which the Competent
Persons’ findings are presented have not been materially modified from the original market announcement.
▪ Investment in drilling expected to continue to grow Mineral Resources and Ore Reserves
21
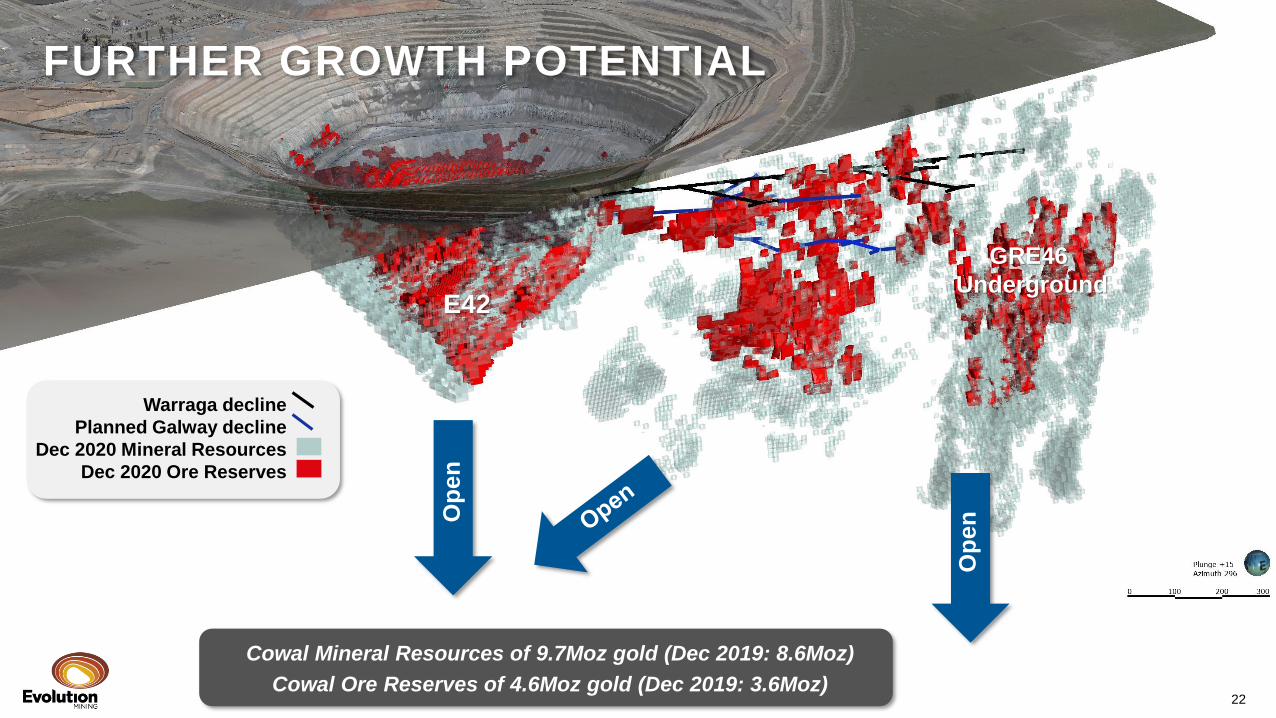
FURTHER GROWTH POTENTIAL
GRE46
UndergroundE42
Warraga decline
Planned Galway decline
Dec 2020 Mineral Resources
Dec 2020 Ore Reserves
Op
enO
pe
n
Cowal Mineral Resources of 9.7Moz gold (Dec 2019: 8.6Moz)
Cowal Ore Reserves of 4.6Moz gold (Dec 2019: 3.6Moz)22
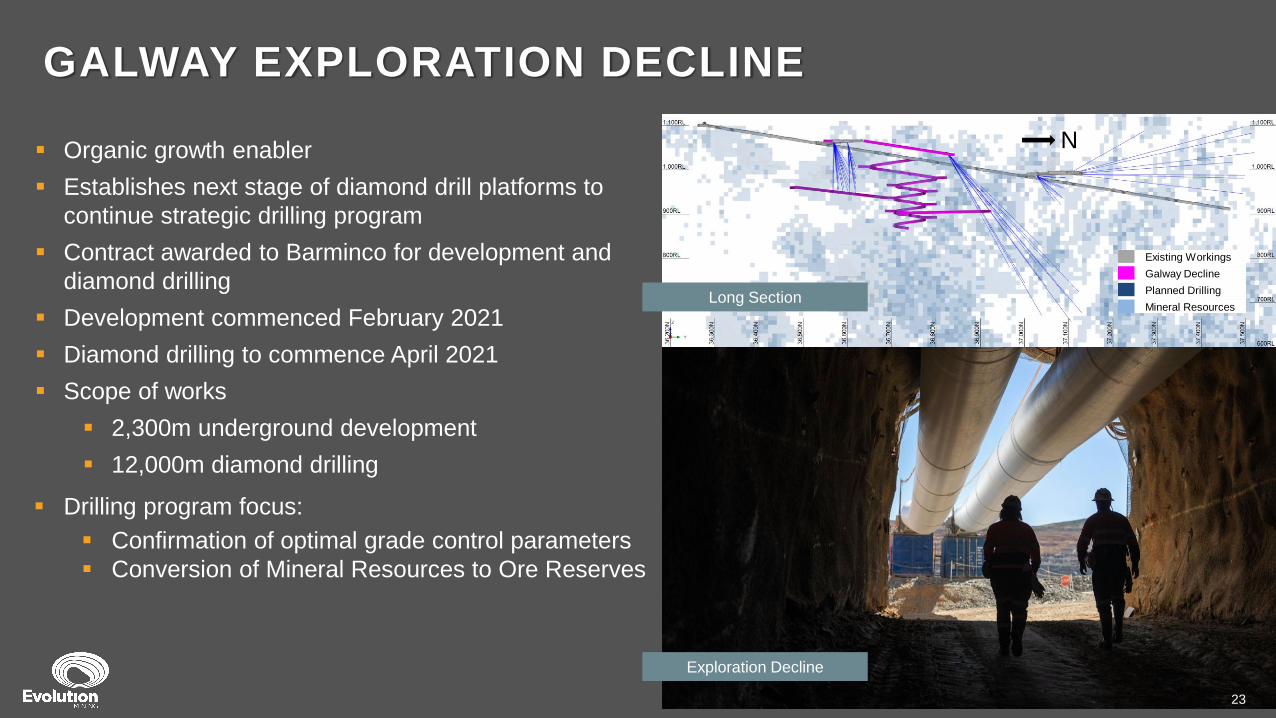
GALWAY EXPLORATION DECLINE
▪ Organic growth enabler
▪ Establishes next stage of diamond drill platforms to
continue strategic drilling program
▪ Contract awarded to Barminco for development and
diamond drilling
▪ Development commenced February 2021
▪ Diamond drilling to commence April 2021
▪ Scope of works
▪ 2,300m underground development
▪ 12,000m diamond drilling
▪ Drilling program focus:
▪ Confirmation of optimal grade control parameters
▪ Conversion of Mineral Resources to Ore Reserves
N
Existing Workings
Galway Decline
Planned Drilling
Mineral Resources
23
Exploration Decline
Long Section

PROCESS FLOWSHEET
24

Power supplied from NSW Grid – AGL
• Primary crushing: Metso 54-75 Superior MK-II gyratory crusher
Grinding
• FFE 36’ x 20.5’ SAG mill, FFE 22’ x 36.5’ ball mill
• Forged steel 125mm balls (SAG), high chrome 80mm balls
(ball mill)
Screening
• Schenck Vibrating screens (SAG discharge), Delkor Linear
(COF)
Recycle crusher
• 2 x Sandvik H6800 hydrocone cone crushers
Mineral liberation/recovery
• Method: flotation, regrind, CIL of concentrate and Float tails
• Equipment: 2 x SK1200 and 10 x OK200TC (flotation), Metso
Vertimill (VTM1000WB), 2 x Metso 355kW SMDs, 4,000m3,
Pre-Ox, 2 x 4,000m3 and 6 x 1,000m3 CIL tanks; FTL 7 * tank
leach circuit with Kemix inter-stage screens and SMBS Cyanide
destruct tanks
• Cyanide supply – Orica
• Lime supply – Graymont
Refining
• 10t AARL elution circuit, Regeneration kiln, 4 x Electrowinning
cells
Gravity Circuit
• Falcon Concentrator / Acacia Reactor
PROCESS EQUIPMENT
25

PLANT PERFORMANCE
Increased plant availability and throughput
▪ Twinning of critical pumps completed
▪ Change from three to six monthly planned
major shutdowns
Float Tails Leach benefits being realised
▪ Blending of high-grade oxide ore feed (+20%
of plant feed in FY21)
▪ Recovery improvement of 2.3% in FY21
Permit to 9.8Mtpa provides long-term optionality
▪ Near term incremental improvement targeting
~9.0 Mtpa
600
700
800
900
1,000
1,100
1,200
Jul-
06
Jan
-07
Jul-
07
Jan
-08
Jul-
08
Jan
-09
Jul-
09
Jan
-10
Jul-
10
Jan
-11
Jul-
11
Jan
-12
Jul-
12
Jan
-13
Jul-
13
Jan
-14
Jul-
14
Jan
-15
Jul-
15
Jan
-16
Jul-
16
Jan
-17
Jul-
17
Jan
-18
Jul-
18
Jan
-19
Jul-
19
Jan
-20
Jul-
20
Jan
-21
Tonnes p
er
opera
ting h
our
Mill Throughput
Actual Throughput Design (6.4 Mtpa / 812 tpoh) 9.0 Mtpa / 1081 tpoh
26
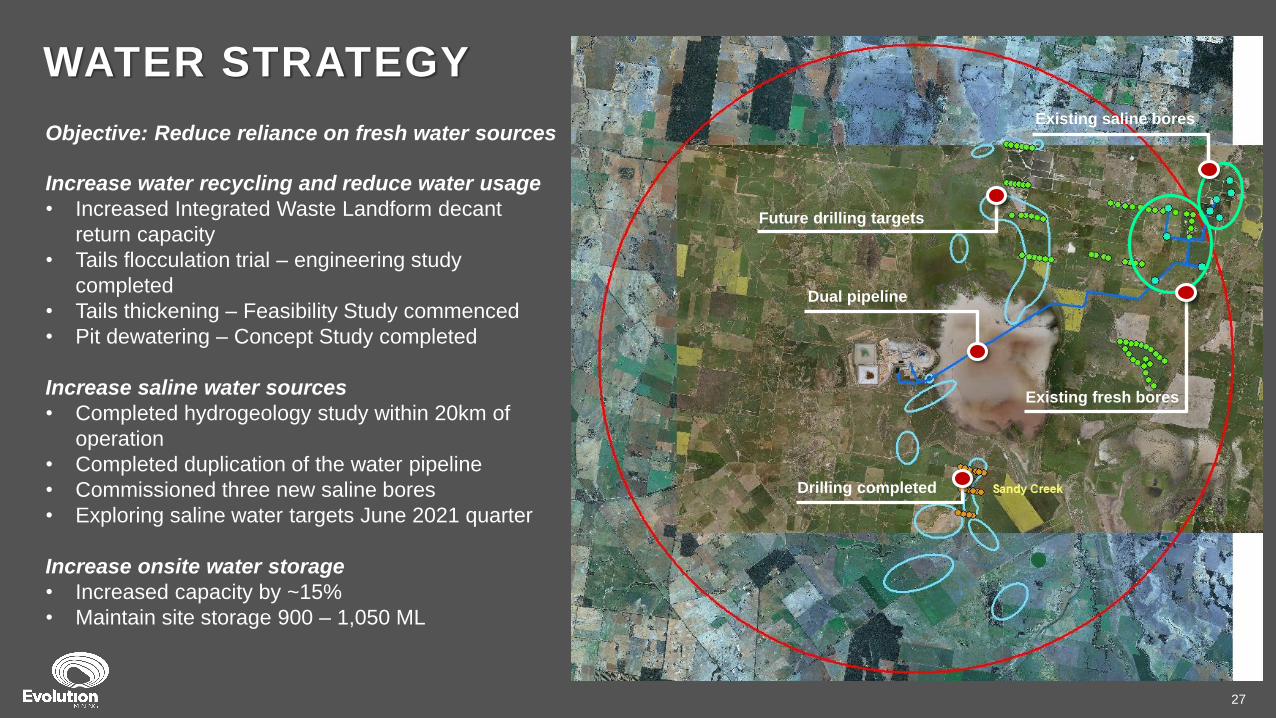
WATER STRATEGY
27
Increase water recycling and reduce water usage
• Increased Integrated Waste Landform decant
return capacity
• Tails flocculation trial – engineering study
completed
• Tails thickening – Feasibility Study commenced
• Pit dewatering – Concept Study completed
Increase saline water sources
• Completed hydrogeology study within 20km of
operation
• Completed duplication of the water pipeline
• Commissioned three new saline bores
• Exploring saline water targets June 2021 quarter
Increase onsite water storage
• Increased capacity by ~15%
• Maintain site storage 900 – 1,050 ML
Objective: Reduce reliance on fresh water sources
Future drilling targets
Dual pipeline
Drilling completed
Existing saline bores
Existing fresh bores

INNOVATION
Industry Step Change Technology – GlyCat™
▪ Technology that uses glycine and cyanide during the
cyanidation process of gold ore for potential significant
cost savings and environmental benefits
▪ Lab trials completed successfully
▪ Next phase: pilot plant trial for variability tests and
long-term environmental impacts
Technology Trials – Augmented and Virtual Reality
▪ HoloLens for maintenance collaboration
▪ 3D training – fire fighting simulation training
Data Analytics
▪ Remote monitoring and analysis of grinding mill
operating data with improvement in grind from p80 –
212 µm to a p80 of 160 µm
Glycat Pilot Plant at the MPS laboratory, Perth
HoloLens mobile maintenance trials in the open pit
28
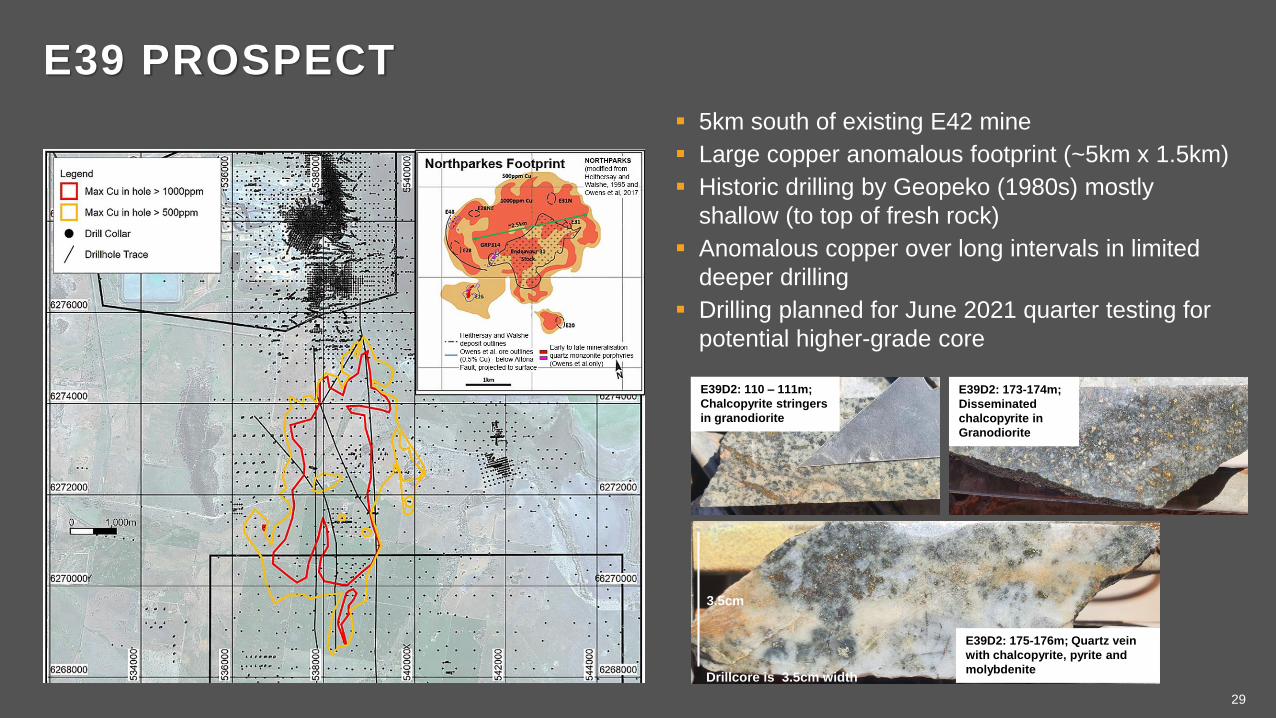
E39 PROSPECT
▪ 5km south of existing E42 mine
▪ Large copper anomalous footprint (~5km x 1.5km)
▪ Historic drilling by Geopeko (1980s) mostly
shallow (to top of fresh rock)
▪ Anomalous copper over long intervals in limited
deeper drilling
▪ Drilling planned for June 2021 quarter testing for
potential higher-grade core
E39D2: 110 – 111m;
Chalcopyrite stringers
in granodiorite
E39D2: 173-174m;
Disseminated
chalcopyrite in
Granodiorite
E39D2: 175-176m; Quartz vein
with chalcopyrite, pyrite and
molybdeniteDrillcore is 3.5cm width
3.5cm
29
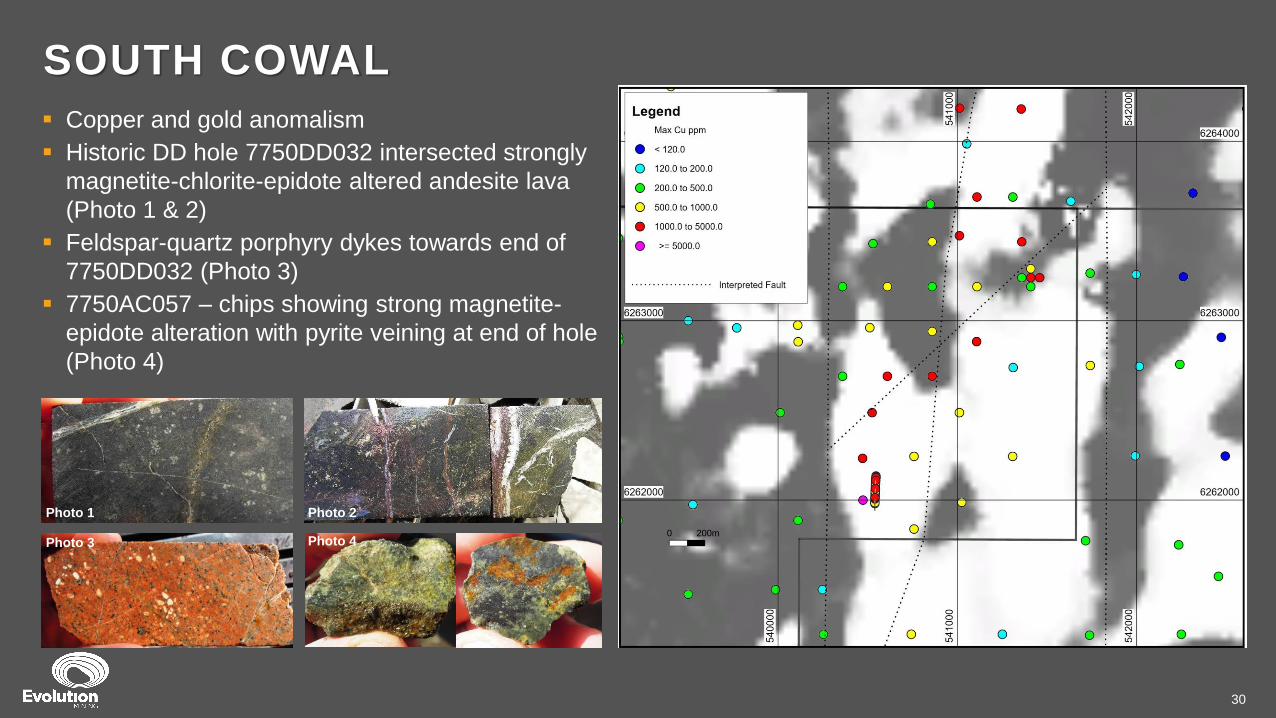
SOUTH COWAL▪ 5km south of existing E42 mine
▪ Large copper anomalous footprint (~5km x 1.5km)
▪ Historic drilling by Geopeko (1980’s) mostly
shallow (to top of fresh rock)
▪ Anomalous copper over long intervals in limited
deeper drilling
▪ Drilling planned for Q4 FY21, testing for potential
higher grade core
0 200m
▪ Copper and gold anomalism
▪ Historic DD hole 7750DD032 intersected strongly
magnetite-chlorite-epidote altered andesite lava
(Photo 1 & 2)
▪ Feldspar-quartz porphyry dykes towards end of
7750DD032 (Photo 3)
▪ 7750AC057 – chips showing strong magnetite-
epidote alteration with pyrite veining at end of hole
(Photo 4)
Photo 1 Photo 2
Photo 3 Photo 4
30

EVOLUTION 2020 GOLD MINERAL RESOURCES
Data is reported to significant figures to reflect appropriate precision and may not sum precisely due to rounding. Mineral Resources are reported inclusive of Ore Reserves. ‘UG’ denotes underground.
1Includes stockpiles 2 Ernest Henry Operation cut-off 0.9% CuEq 3 Red Lake cut-off is 3.3g/t Au except for Cochenour (3.0g/t Au) and HG Young (3.2g/t Au) deposits4Group Mineral Resources Competent Person (CP) Notes refer to 1. James Biggam; 2. Dean Fredericksen; 3. Brad Daddow; 4. Tim Murphy; 5. Ben Coutts; 6. Jessica Shiels (Glencore)5The Mineral Resource for the Mt Carlton A39 underground deposit has been estimated using a AuEq (g/t) cut-off of 4.4g/t to enable quotation of this silver rich deposit as equivalent gold ounces.
The gold equivalent (AuEq) calculation accounts for silver recoveries determined from metallurgical test work and uses an assumed silver price of A$26/oz and gold price of A$2,000/oz as per the below equation.
AuEq=26/2,000*0.8203*silver grade (Silver price/Gold price*silver recovery*silver grade). It is the Competent Persons opinion that the assigned cut-off criteria satisfies the JORC Code requirement that the reported Mineral Resource meets reasonable prospects of eventual economic
extraction and that the silver present within the A39 deposit can be economically recovered.
Full details of the Evolution Mineral Resources and Ore Reserves are provided in the report entitled “Annual Mineral Resources an Ore Reserves Statement” released to the ASX on 17 February 2021 and available to view at www.evolutionmining.com.au
Full details of the Ernest Henry Mineral Resources and Ore Reserves are provided in the report entitled “Glencore Resources and Reserves as at 31 December 2020” released 3 February 2021 and available to view at www.glencore.com.
The Company confirms that it is not aware of any new information or data that materially affects the information included in the Reports and that all material assumptions and parameters underpinning the estimates in the Reports continue to apply and have not materially changed. The
Company confirms that the form and context in which the Competent Persons’ findings are presented have not been materially modified from the Reports. Evolution Mining has an economic interest earning rights to 100% of the revenue from future gold production and 30% of future copper
and silver produced from an agreed area, and 49% of future gold, copper and silver produced from the Ernest Henry Resource outside the agreed area. The Ernest Henry Resource is reported here on the basis of economic interest and not the entire mine resource. The above reported
figures constitute 77% of the total Ernest Henry gold resource.
Gold Measured Indicated Inferred Total Resource
CP4
Dec 19
Resource
Gold Metal
(koz)
Project Type Cut-OffTonnes
(Mt)
Gold
Grade (g/t)
Gold
Metal
(koz)
Tonnes
(Mt)
Gold
Grade
(g/t)
Gold
Metal
(koz)
Tonnes
(Mt)
Gold
Grade
(g/t)
Gold
Metal
(koz)
Tonnes
(Mt)
Gold
Grade
(g/t)
Gold
Metal
(koz)
Cowal1 Open pit 0.35 20.63 0.46 306 209.19 0.85 5,724 22.90 0.84 615 252.71 0.82 6,645 1 6,0891
Cowal UG 1.5 - - - 22.78 2.55 1,868 14.75 2.43 1,151 37.53 2.50 3,019 1 2,502
Cowal1 Total 20.63 0.46 306 231.97 1.02 7,593 37.65 1.46 1,765 290.24 1.04 9,664 1 8,591
Red Lake3 Total 3.3 - - - 28.09 7.45 6,371 19.72 6.82 4,322 47.81 7.19 11,053 2 -
Mungari1 Open pit 0.5 - - - 37.55 1.19 1,443 6.80 1.35 296 44.36 1.22 1,739 3 1,849
Mungari UG 1.8 0.34 5.09 56 1.78 3.25 187 2.58 2.46 204 4.71 2.95 448 3 560
Mungari1 Total 0.34 5.09 56 39.34 1.29 1,629 9.39 1.66 500 49.07 1.39 2,186 3 2,409
Mt Rawdon1 Total 0.21 7.29 0.34 81 32.91 0.60 630 10.47 0.52 175 50.66 0.54 885 4 1,062
Mt Carlton1 Open pit 0.35 - - - 6.96 0.70 157 2.17 2.56 178 9.12 1.14 335 5 3431
Mt Carlton3 UG 2.55 - - - 0.33 4.26 45 0.08 3.19 7.88 0.40 4.05 52 5 75
Mt Carlton1 Total - - - 7.28 0.86 201 2.24 2.58 186 9.53 1.26 387 5 418
Ernest Henry2 Total 0.9 4.29 0.51 70 45.43 0.61 896 8.98 0.61 177 58.70 0.61 1,143 6 1,288
Marsden Total 0.2 - - - 119.83 0.27 1,031 3.14 0.22 22 122.97 0.27 1,053 1 1,053
Total 32.55 0.49 513 504.85 1.15 18,711 91.59 2.43 7,147 628.99 1.30 26,371 15,167
31

EVOLUTION 2020 GOLD ORE RESERVES
Data is reported to significant figures to reflect appropriate precision and may not sum precisely due to rounding
1Includes stockpiles 2 Ernest Henry Operation cut-off 0.9% CuEq 3Red Lake cut-off is 4.3g/t Au except for Lower Campbell (4.4g/t Au) and Upper Campbell (2.5g/t Au) deposits4Group Ore Reserve Competent Person (CP) Notes refer to 1. Ryan Kare; 2: Joshua Northfield; 3.Brad Armstrong; 4: Ken Larwood; 5. Thomas Lethbridge; 6. Anton Kruger; 7. Michael Corbett (Glencore)5The Ore Reserve for the Mt Carlton A39 underground deposit has been estimated using a AuEq (g/t) cutoff of 6.1g/t to enable quotation of this silver rich deposit as equivalent gold ounces.
The gold equivalent (AuEq) calculation accounts for silver recoveries determined from metallurgical test work and uses an assumed silver price of A$20/oz and gold price of A$1,450/oz as per the below equation.
AuEq = 20/1,450*0.8203*silver grade (Silver price/Gold price*silver recovery*silver grade). It is the Competent Persons opinion that the assigned cut-off criteria meets the minimum acceptable criteria to support economic extraction and that the silver present within the A39 deposit can be
economically recovered.
Full details of the Evolution Mineral Resources and Ore Reserves are provided in the report entitled “Annual Mineral Resources an Ore Reserves Statement” released to the ASX on 17 February 2021 and available to view at www.evolutionmining.com.au
Full details of the Ernest Henry Mineral Resources and Ore Reserves are provided in the report entitled “Glencore Resources and Reserves as at 31 December 2020” released 3 February 2021 and available to view at www.glencore.com.
The Company confirms that it is not aware of any new information or data that materially affects the information included in the Reports and that all material assumptions and parameters underpinning the estimates in the Reports continue to apply and have not materially changed. The
Company confirms that the form and context in which the Competent Persons’ findings are presented have not been materially modified from the Reports. Evolution Mining has an economic interest earning rights to 100% of the revenue from future gold production and 30% of future copper
and silver produced from an agreed area, and 49% of future gold, copper and silver produced from the Ernest Henry Resource outside the agreed area. The Ernest Henry Resource is reported here on the basis of economic interest and not the entire mine resource. The above reported
figures constitute 86% of the total Ernest Henry gold reserve.
Gold Proved Probable Total ReserveCompetent
Person4
Dec 19
Reserves
Project Type Cut-OffTonnes
(Mt)
Gold
Grade (g/t)
Gold Metal
(koz)
Tonnes
(Mt)
Gold Grade
(g/t)
Gold Metal
(koz)
Tonnes
(Mt)
Gold
Grade (g/t)
Gold Metal
(koz)
Gold Metal
(koz)
Cowal1 Open pit 0.45 20.60 0.46 306 104.72 0.96 3,241 125.32 0.88 3,547 1 3,6341
Cowal Underground 1.8 - - - 12.55 2.59 1,045 12.55 2.59 1,045 2
Cowal Total 20.60 0.46 306 117.27 1.14 4,287 137.87 1.04 4,593 4,438
Red Lake3 Total 4.4 - - - 13.16 6.90 2,929 13.16 6.90 2,929 3
Mungari Underground 2.9 - - - 0.30 3.57 35 0.30 3.57 35 4 68
Mungari1 Open pit 0.75 - - - 9.68 1.35 419 9.68 1.35 419 4 500
Mungari1 Total - - - 9.98 1.41 454 9.98 1.41 454 4 568
Mt Rawdon1 Open pit 0.3 4.26 0.41 56 15.82 0.67 342 20.08 0.62 398 5 538
Mt Carlton1 Open pit 0.8 - - - 6.13 0.63 124 6.13 0.63 124 6 2701
Mt Carlton5 Underground 3.2 - - - 0.30 4.52 44 0.30 4.52 44 6 40
Mt Carlton1 Total - - - 6.43 0.81 168 6.43 0.81 168 6 311
Ernest Henry2 Underground 0.9 2.67 0.81 70 29.94 0.47 455 32.62 0.50 525 7 660
Marsden Open pit 0.3 - - - 65.17 0.39 817 65.17 0.39 817 6 817
Total 27.54 0.49 432 257.77 1.14 9,452 285.31 1.08 9,884 6,642
32
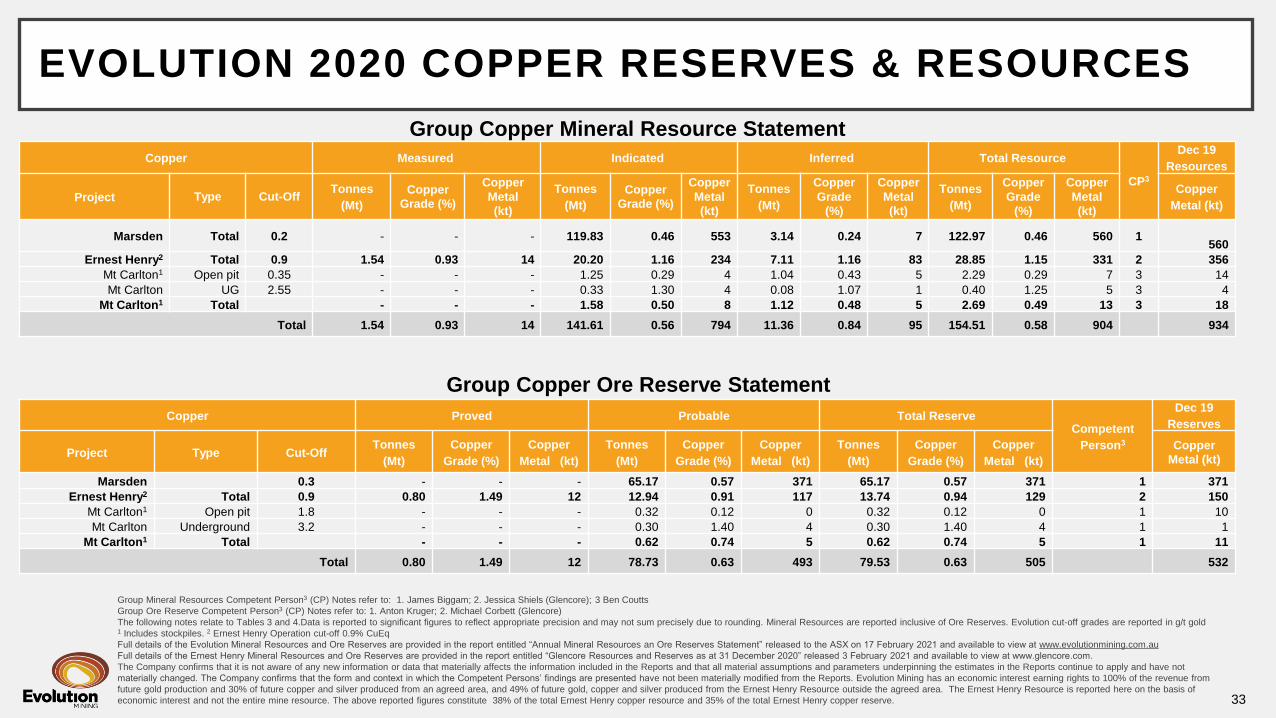
EVOLUTION 2020 COPPER RESERVES & RESOURCES
Group Mineral Resources Competent Person3 (CP) Notes refer to: 1. James Biggam; 2. Jessica Shiels (Glencore); 3 Ben Coutts
Group Ore Reserve Competent Person3 (CP) Notes refer to: 1. Anton Kruger; 2. Michael Corbett (Glencore)
The following notes relate to Tables 3 and 4.Data is reported to significant figures to reflect appropriate precision and may not sum precisely due to rounding. Mineral Resources are reported inclusive of Ore Reserves. Evolution cut-off grades are reported in g/t gold1 Includes stockpiles. 2 Ernest Henry Operation cut-off 0.9% CuEq
Full details of the Evolution Mineral Resources and Ore Reserves are provided in the report entitled “Annual Mineral Resources an Ore Reserves Statement” released to the ASX on 17 February 2021 and available to view at www.evolutionmining.com.au
Full details of the Ernest Henry Mineral Resources and Ore Reserves are provided in the report entitled “Glencore Resources and Reserves as at 31 December 2020” released 3 February 2021 and available to view at www.glencore.com.
The Company confirms that it is not aware of any new information or data that materially affects the information included in the Reports and that all material assumptions and parameters underpinning the estimates in the Reports continue to apply and have not
materially changed. The Company confirms that the form and context in which the Competent Persons’ findings are presented have not been materially modified from the Reports. Evolution Mining has an economic interest earning rights to 100% of the revenue from
future gold production and 30% of future copper and silver produced from an agreed area, and 49% of future gold, copper and silver produced from the Ernest Henry Resource outside the agreed area. The Ernest Henry Resource is reported here on the basis of
economic interest and not the entire mine resource. The above reported figures constitute 38% of the total Ernest Henry copper resource and 35% of the total Ernest Henry copper reserve.
Group Copper Mineral Resource Statement
Group Copper Ore Reserve Statement
Copper Measured Indicated Inferred Total Resource
CP3
Dec 19
Resources
Project Type Cut-OffTonnes
(Mt)
Copper
Grade (%)
Copper
Metal
(kt)
Tonnes
(Mt)
Copper
Grade (%)
Copper
Metal
(kt)
Tonnes
(Mt)
Copper
Grade
(%)
Copper
Metal
(kt)
Tonnes
(Mt)
Copper
Grade
(%)
Copper
Metal
(kt)
Copper
Metal (kt)
Marsden Total 0.2 - - - 119.83 0.46 553 3.14 0.24 7 122.97 0.46 560 1560
Ernest Henry2 Total 0.9 1.54 0.93 14 20.20 1.16 234 7.11 1.16 83 28.85 1.15 331 2 356
Mt Carlton1 Open pit 0.35 - - - 1.25 0.29 4 1.04 0.43 5 2.29 0.29 7 3 14
Mt Carlton UG 2.55 - - - 0.33 1.30 4 0.08 1.07 1 0.40 1.25 5 3 4
Mt Carlton1 Total - - - 1.58 0.50 8 1.12 0.48 5 2.69 0.49 13 3 18
Total 1.54 0.93 14 141.61 0.56 794 11.36 0.84 95 154.51 0.58 904 934
Copper Proved Probable Total ReserveCompetent
Person3
Dec 19
Reserves
Project Type Cut-OffTonnes
(Mt)
Copper
Grade (%)
Copper
Metal (kt)
Tonnes
(Mt)
Copper
Grade (%)
Copper
Metal (kt)
Tonnes
(Mt)
Copper
Grade (%)
Copper
Metal (kt)
Copper
Metal (kt)
Marsden 0.3 - - - 65.17 0.57 371 65.17 0.57 371 1 371
Ernest Henry2 Total 0.9 0.80 1.49 12 12.94 0.91 117 13.74 0.94 129 2 150
Mt Carlton1 Open pit 1.8 - - - 0.32 0.12 0 0.32 0.12 0 1 10
Mt Carlton Underground 3.2 - - - 0.30 1.40 4 0.30 1.40 4 1 1
Mt Carlton1 Total - - - 0.62 0.74 5 0.62 0.74 5 1 11
Total 0.80 1.49 12 78.73 0.63 493 79.53 0.63 505 532
33
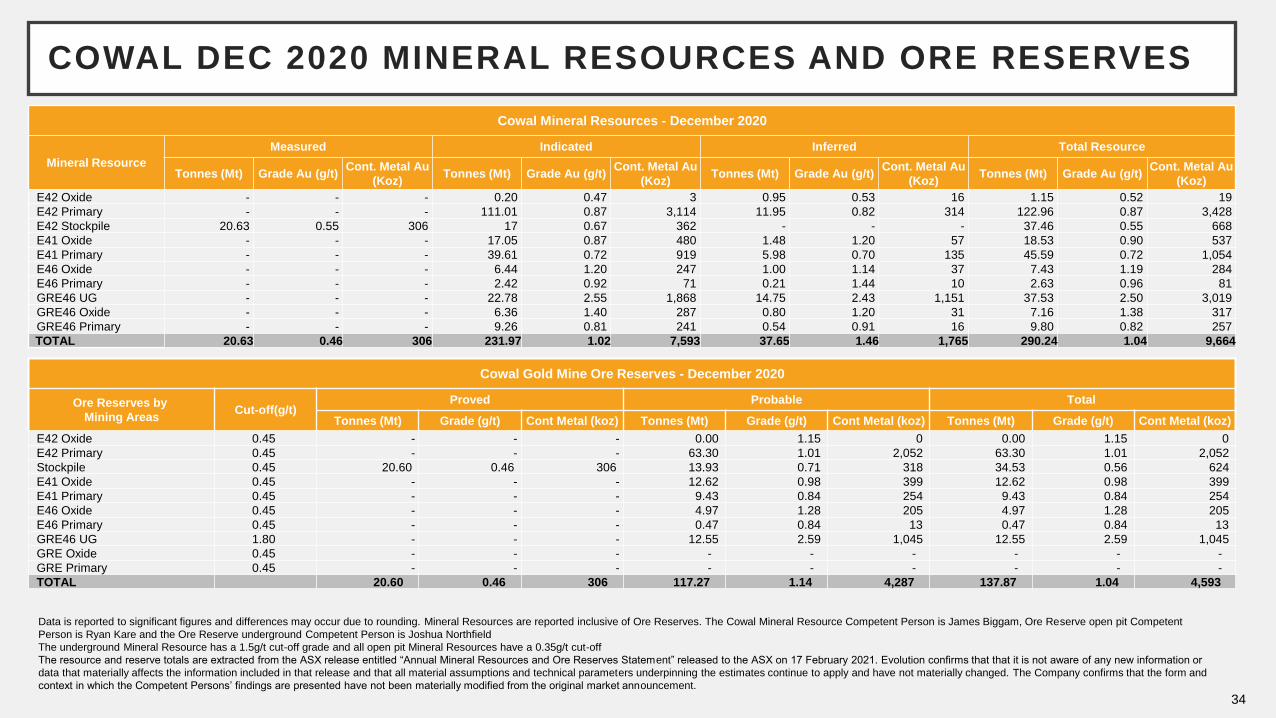
Data is reported to significant figures and differences may occur due to rounding. Mineral Resources are reported inclusive of Ore Reserves. The Cowal Mineral Resource Competent Person is James Biggam, Ore Reserve open pit Competent
Person is Ryan Kare and the Ore Reserve underground Competent Person is Joshua Northfield
The underground Mineral Resource has a 1.5g/t cut-off grade and all open pit Mineral Resources have a 0.35g/t cut-off
The resource and reserve totals are extracted from the ASX release entitled “Annual Mineral Resources and Ore Reserves Statement” released to the ASX on 17 February 2021. Evolution confirms that that it is not aware of any new information or
data that materially affects the information included in that release and that all material assumptions and technical parameters underpinning the estimates continue to apply and have not materially changed. The Company confirms that the form and
context in which the Competent Persons’ findings are presented have not been materially modified from the original market announcement.
Cowal Mineral Resources - December 2020
Mineral Resource
Measured Indicated Inferred Total Resource
Tonnes (Mt) Grade Au (g/t)Cont. Metal Au
(Koz)Tonnes (Mt) Grade Au (g/t)
Cont. Metal Au
(Koz)Tonnes (Mt) Grade Au (g/t)
Cont. Metal Au
(Koz)Tonnes (Mt) Grade Au (g/t)
Cont. Metal Au
(Koz)
E42 Oxide - - - 0.20 0.47 3 0.95 0.53 16 1.15 0.52 19
E42 Primary - - - 111.01 0.87 3,114 11.95 0.82 314 122.96 0.87 3,428
E42 Stockpile 20.63 0.55 306 17 0.67 362 - - - 37.46 0.55 668
E41 Oxide - - - 17.05 0.87 480 1.48 1.20 57 18.53 0.90 537
E41 Primary - - - 39.61 0.72 919 5.98 0.70 135 45.59 0.72 1,054
E46 Oxide - - - 6.44 1.20 247 1.00 1.14 37 7.43 1.19 284
E46 Primary - - - 2.42 0.92 71 0.21 1.44 10 2.63 0.96 81
GRE46 UG - - - 22.78 2.55 1,868 14.75 2.43 1,151 37.53 2.50 3,019
GRE46 Oxide - - - 6.36 1.40 287 0.80 1.20 31 7.16 1.38 317
GRE46 Primary - - - 9.26 0.81 241 0.54 0.91 16 9.80 0.82 257
TOTAL 20.63 0.46 306 231.97 1.02 7,593 37.65 1.46 1,765 290.24 1.04 9,664
Cowal Gold Mine Ore Reserves - December 2020
Ore Reserves by
Mining AreasCut-off(g/t)
Proved Probable Total
Tonnes (Mt) Grade (g/t) Cont Metal (koz) Tonnes (Mt) Grade (g/t) Cont Metal (koz) Tonnes (Mt) Grade (g/t) Cont Metal (koz)
E42 Oxide 0.45 - - - 0.00 1.15 0 0.00 1.15 0
E42 Primary 0.45 - - - 63.30 1.01 2,052 63.30 1.01 2,052
Stockpile 0.45 20.60 0.46 306 13.93 0.71 318 34.53 0.56 624
E41 Oxide 0.45 - - - 12.62 0.98 399 12.62 0.98 399
E41 Primary 0.45 - - - 9.43 0.84 254 9.43 0.84 254
E46 Oxide 0.45 - - - 4.97 1.28 205 4.97 1.28 205
E46 Primary 0.45 - - - 0.47 0.84 13 0.47 0.84 13
GRE46 UG 1.80 - - - 12.55 2.59 1,045 12.55 2.59 1,045
GRE Oxide 0.45 - - - - - - - - -
GRE Primary 0.45 - - - - - - - - -
TOTAL 20.60 0.46 306 117.27 1.14 4,287 137.87 1.04 4,593
COWAL DEC 2020 MINERAL RESOURCES AND ORE RESERVES
34

1893Gold first
discovered in
West Wyalong
1988North Limited
undertakes
extensive
exploration at Lake
Cowal
1999NSW government
issues development
consent conditions
for the Cowal gold
project
2000North Limited is
acquired by Rio
Tinto
2002Homestake Mining
merges with Barrick
Gold
2001Cowal gold project
is sold to
Homestake Mining
2004Construction
commences on
Cowal gold project
2006First gold is
poured in April
2006
2015Evolution Mining
acquires Cowal
Gold Operation
with 1.6Moz Ore
Reserve
Evolution increases
Ore Reserves by
40% to 2.2Moz
2016Evolution increases
Ore Reserves by
30% to 2.9Moz
2017Mine life is extended
to 2032
Dalwhinnie UG
discovery
Ore Reserves
increased by 12%
to 3.2Moz
2014Cowal gold
operation is granted
extension of
mine life through to
2024
2018Regulatory approval
of plant expansion
from 7.5Mtpa to 9.8
Mtpa
2019Underground
exploration decline
commenced
2020Maiden UG reserve
804koz
Galway decline
commenced
Underground Feasibility
Study underway
Regulatory approvals
submitted
2021UG resources increased
to 3.0Moz and total UG
resources increased to
9.7Moz
UG reserve increased to
1.0Moz and total reserves
increased to 4.6Moz
Satellite pits PFS
commenced
HISTORY OF COWAL
35


