
Costs-Benefit Analysis for natural disaster management:
methodological background
Reinhard Mechler
Session“Cost-Benefit Analysis of Natural Disaster Management:
WCDR, KobeJanuary 18, 2005

Overview
• Challenges and background• Elements of CBA • Pros and Cons• Evidence of return on natural disaster risk management• Users of CBA• Conclusions

Challenges
Building a culture of prevention is not easy. While the costs of prevention have to be paid in the present, its benefits lie in a distant future. Moreover, the benefits are not
tangible; they are the disasters that did NOT happen. (Kofi Annan 1999)
• Costs certain, benefits not, disincentives for political andinstitutional actors in context of very scarce resources
• Need for long-term commitment, longer planning horizons
• Often post-event period as window of opportunity

Background
• CBA can demonstrate benefits of and need for undertaking riskmanagement measures („return“ on risk management)
• Guidelines exist, however, natural disaster risk often notconsidered in project appraisal due to difficulties with
- Complexity (LPHC events): probabilistic analysis required, - Accounting for non-monetary values: value of life, „safety“
• CBA manual developed at GTZ as complementary effort for specific context with often little data and resources, and for application in a developing country context
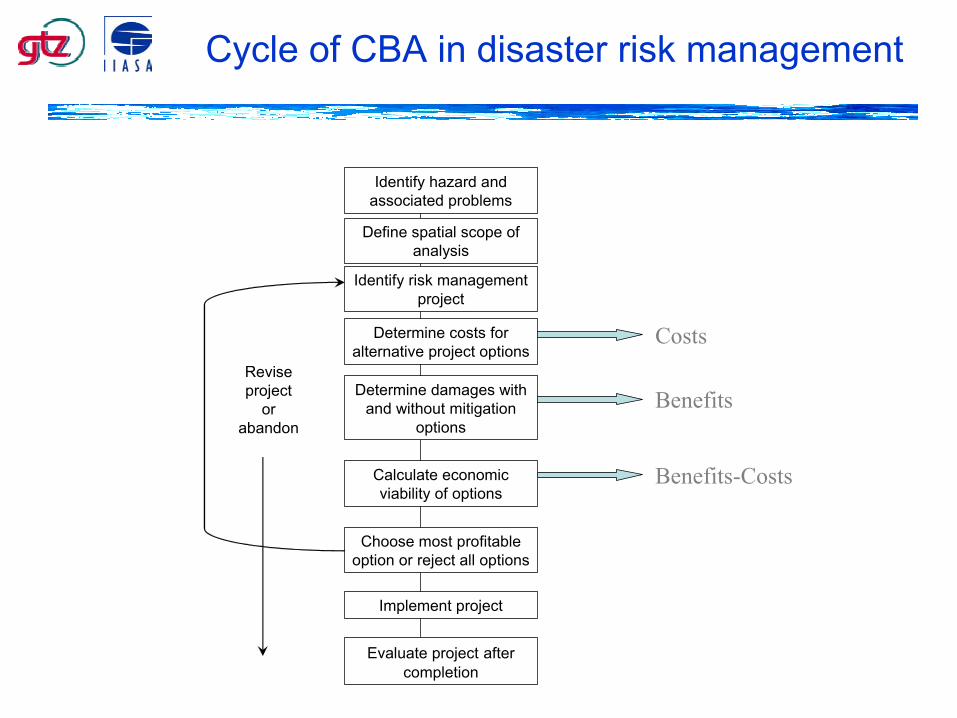
Cycle of CBA in disaster risk management
Identify risk management project
Determine costs for alternative project options
Determine damages withand without mitigation
options
Calculate economic viability of options
Choose most profitable option or reject all options
Evaluate project after completion
Implement project
Identify hazard and associated problems
Define spatial scope of analysis
Costs
Benefits
Benefits-Costs
Revise project
orabandon
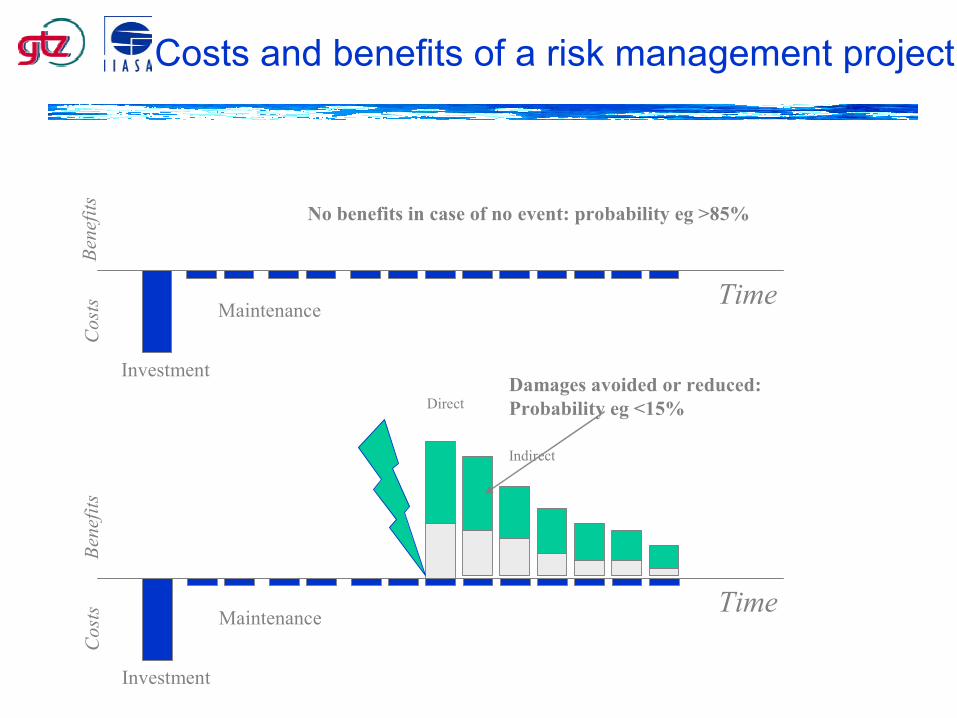
Costs and benefits of a risk management projectC
osts
Bene
fits
Time
Investment
Maintenance
Damages avoided or reduced: Probability eg <15%
Cos
ts Time
Investment
Maintenance
Bene
fits
Direct
Indirect
No benefits in case of no event: probability eg >85%
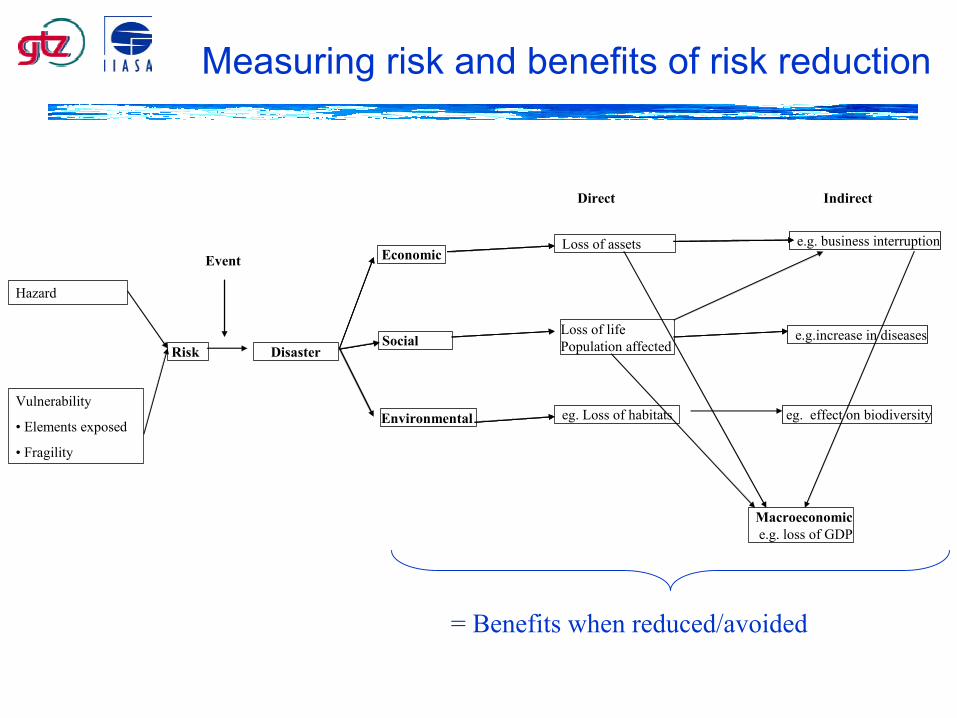
Measuring risk and benefits of risk reduction
Risk
Economic
Social
Macroeconomice.g. loss of GDP
Direct
Loss of assets
Indirect
e.g. business interruption
Environmental
Hazard
Vulnerability
• Elements exposed
• Fragility
Loss of lifePopulation affected
eg. Loss of habitats
e.g.increase in diseasesDisaster
Event
eg. effect on biodiversity
= Benefits when reduced/avoided
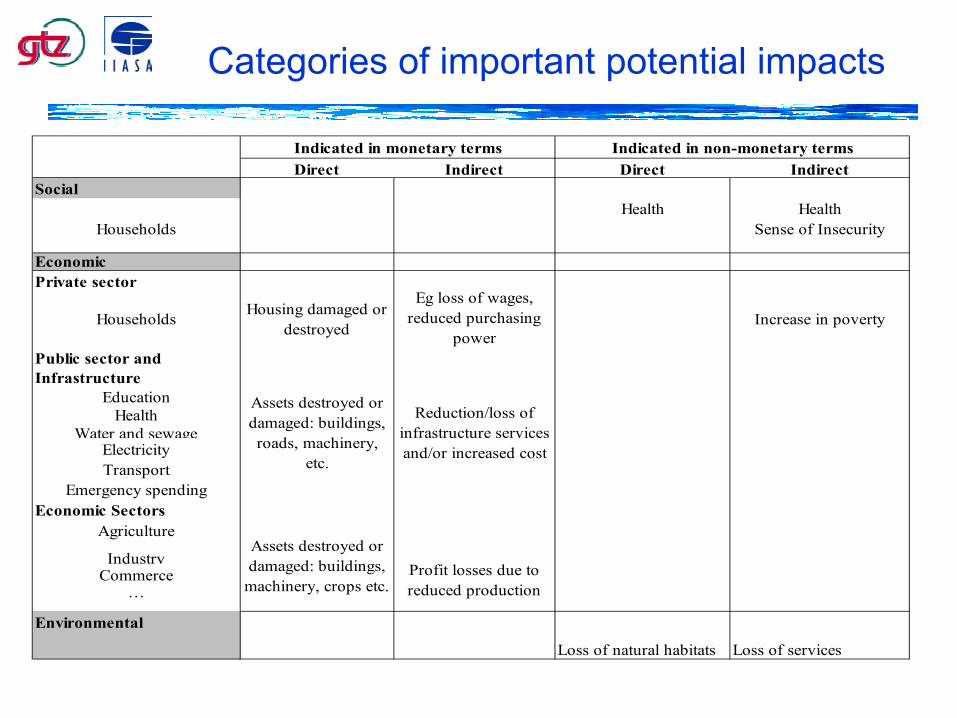
Categories of important potential impacts
Direct Indirect Direct IndirectSocial
Health HealthHouseholds Sense of Insecurity
EconomicPrivate sector
Households Housing damaged or destroyed
Eg loss of wages, reduced purchasing
powerIncrease in poverty
Public sector and Infrastructure
EducationHealth
Water and sewageElectricityTransport
Emergency spendingEconomic Sectors
Agriculture
IndustryCommerce
…
Environmental
Loss of natural habitats Loss of services
Reduction/loss of infrastructure services and/or increased cost
Assets destroyed or damaged: buildings, roads, machinery,
etc.
Assets destroyed or damaged: buildings,
machinery, crops etc.
Indicated in monetary terms Indicated in non-monetary terms
Profit losses due to reduced production
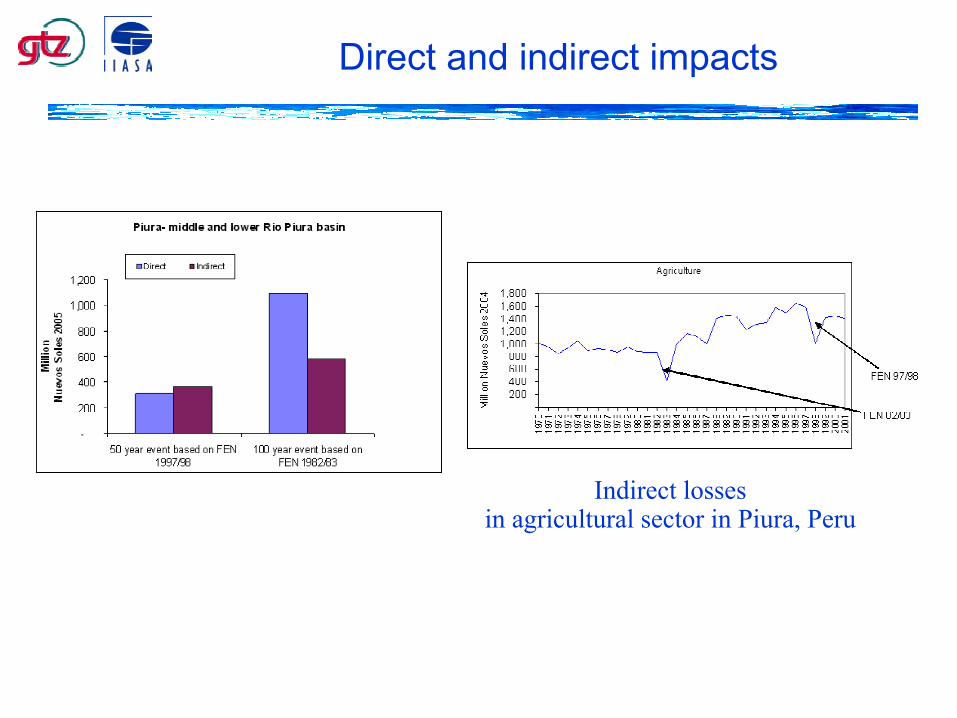
Direct and indirect impacts
Indirect losses in agricultural sector in Piura, Peru
Pros and Cons of CBA of natural disaster risk management
Pros
• Monetary framework for coherent and systematic decision-making
• Outlines monetary dimensions and benefits of natural disaster risk management
Cons
• Difficulty of accounting for non-market values, often left out,thus focus on easily measurable economic effects andinvestments only

Evidence I: Polder in Piura, Peru
Planned PoldersystemProtected Area
Project alternative Characteristics Costs (2005 values) Protection in medium and lower Rio Piura
20 km dikes: 84 million Soles construction costs, 1 million Soles annual operation and maintenance cost
Polder
Up to 100 year event 2,600 ha will be flooded in case of event

• Impact-based assessment: El Ninos in 82/83 (~100 year event)and 97/98 (~50 year event)
• Good data on hazard and exposure, less on fragility
• Direct and indirect economic impacts • Direct social impacts: loss of life
Direct Indirect Direct IndirectSocial
Number of casualties Increase of diseasesHouseholds Number of injured Stress symptoms
Number affectedEconomicPrivate sector
Households Housing damaged or destroyed
Loss of wages, reduced purchasing
powerIncrease in poverty
Public sectorEducation
HealthWater and sewage
ElectricityTransport
Emergency spendingEconomic Sectors
AgricultureIndustry
Commerce…
Environmental Loss of natural habitats Effects on biodiversity
Loss of infrastructure services
Assets destroyed or damaged: buildings,
roads, machinery, etc.
Assets destroyed or damaged: buildings, machinery, crops etc.
Monetary Non-monetary
Loss due to reduced production
Best estimate Costs: +30% Without loss of life
Without indirect losses
Without increases in exposure
Sum: NPV (millions) 260 233 259 114 218 C/B ratio 3.8 2.9 3.8 2.2 3.4 IRR 31% 22% 31% 14% 29%
Evidence I: Polder in Piura, Peru
Results: best estimate and sensitivity analysis

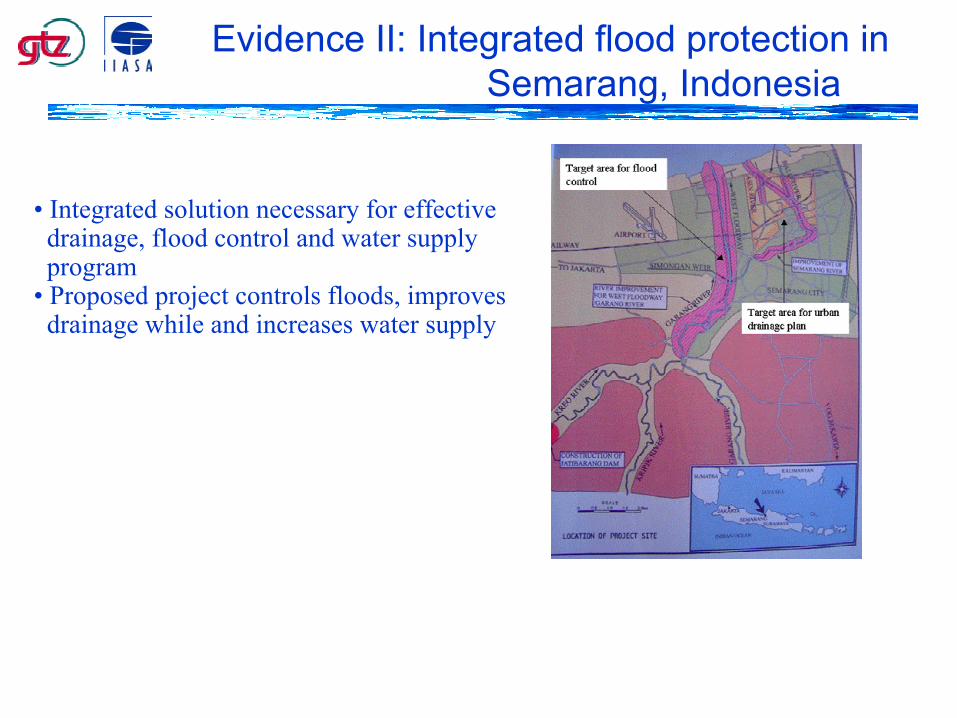
Evidence II: Integrated flood protection in Semarang, Indonesia
• City subject to seaside inundation due to land subsidenceand riverine flooding in rainy season
• Land subsidence caused by (illegal) groundwater extraction
Elevation in 2003
Elevation in 2013 (scenario)

Important issue: dynamics
-
50
100
150
200
250
300
2005 2015 2025 2035 2045 2055
Billio
n R
upia
h (2
005
cons
tant
)
Annual losses due to inundation
Annual average losses due to flooding
Development of annualized losses in Semarang 2005-2055exposure and hazard
Evidence II: Integrated flood protection in Semarang, Indonesia
Evidence II: Integrated flood protection in Semarang, Indonesia
• Integrated solution necessary for effectivedrainage, flood control and water supplyprogram
• Proposed project controls floods, improvesdrainage while and increases water supply

Evidence II: Integrated flood protection in Semarang, Indonesia
Direct Indirect Direct IndirectSocial
Number of casualties Increase of diseasesHouseholds Number of injured Stress symptoms
Number affectedEconomicPrivate sector
Households Housing damaged or destroyed
Loss of wages, reduced
purchasing powerIncrease in poverty
Public sectorEducation
HealthWater and sewage
ElectricityTransport
Emergency spendingEconomic Sectors
AgricultureIndustry
Commerce…
Environmental Loss of natural habitat Effects on biodiversity
Loss due to reduced
production
Monetary
Assets destroyed or damaged: buildings,
roads, machinery, etc.
Loss of infrastructure
services
Assets destroyed or damaged: buildings, machinery, crops etc.
Non-monetary• Risk based assessment: good data on hazard, exposure and fragility, little on impacts• Potential direct and indirect
economic impacts assessed• Future increase in exposure and
subsidence accounted for
Results: best estimate and sensitivity analysisBest
estimateNo exposure
increaseNo subsidence
increaseNo exposure and
subsidence increaseNPV (billion Rupiah) 369 296 330 257C/B ratio 2.3 2.0 2.2 1.9IRR 23% 19% 21% 18%

Users of results
• Project practitioners • Local, regional and central government institutions concerned with project planning and financing
• International donors
Planning agency in local government in Indonesia
Involvement of local farmers in project planning in Peru

Conclusions
• CBA demonstrates benefits of and need for undertaking risk management measures („return“ on risk management)
• Tool for systematic and coherent decisionmaking• Context of risk to be acknowledged in analysis• CBA involves some technical knowledge, therefore closecollaboration between analysts and users necessary
• „Returns“ on risk management can be large as evidencedemonstrates


