
Consolidated Integrated Vulnerability Assessment
Report for the Adelaide Hills and
Fleurieu Peninsula

Consolidated Integrated Vulnerability
Assessment Report for the Adelaide Hills
and Fleurieu Peninsula
A report prepared for the Resilient Hills and Coasts project
Prepared by Together with
Seed Consulting Services URPS
106 Gilles Street, Adelaide, SA 5000 Suite 12/154 Fullarton Rd, Rose Park, SA 5067
www.seedcs.com.au www.urps.com.au
Prepared for Resilient Hills and Coasts
Report should be cited as:
Resilient Hills and Coasts (2016). Integrated Vulnerability Assessment Report for the Adelaide Hills
and Fleurieu Peninsula. A report prepared for Alexandrina Council by Seed Consulting Services and
URPS.
Document Control
Document Information
Information
Document Owner Alexandrina Council
Project ID 600 RHC
Last Saved Date 05 February 2016
File Name Final_IVAreport_Consolidated_050216
Document History
Version Issue Date Changes
V1 Draft 03 November 2015
V2 Draft 05 February 2016 Edits from steering committee incorporated/addressed
Document Approvals
Role Name Signature Date
Project Director Mark Siebentritt
Written By Mark Siebentritt
03/11/15
Checked Andy Chambers
03/11/15
Jenni Garden
04/02/16
Disclaimer
The information contained in this Seed Consulting Services (Seed) report is given in good faith and has been
derived from sources believed to be reliable and accurate. Seed accepts no legal liability for the accuracy of field
data, analytical results or mapping data provided as part of this report or for any associated loss in productivity,
business or such like through third part use of this data.
Seed accepts no legal liability for failure of third parties to obtain any necessary government or other agency
permits or approvals with respect to any issue raised in this report where approvals may be required.
The material and opinions in this report may include the views or recommendations of third parties, which may
not necessarily reflect the views of Seed, or indicate Seed’s recommendation regarding a particular course of
action.
Seed does not provide advice of an investment or commercial valuation nature. Seed does not accept any liability
for investment decisions made on the basis of environmental or other information provided in this report.

Contents Acronyms ....................................................................................................................... 1
Executive summary ....................................................................................................... 2
1 Introduction ............................................................................................................. 5 1.1 Resilient Hills and Coasts overview .................................................................................................. 5 1.2 Study region ...................................................................................................................................... 6 1.3 Purpose and structure of this report .................................................................................................. 8
2 Approach to assessing vulnerability .................................................................... 9 2.1 Integrated Vulnerability Assessment (IVA) overview ........................................................................ 9 2.2 Sectors and indicators ..................................................................................................................... 11 2.3 Calculating vulnerability .................................................................................................................. 11
2.3.1 Climate change projections ............................................................................................................................. 11 2.3.2 Exposure scores ............................................................................................................................................. 12 2.3.3 Sensitivity and adaptive capacity scores ........................................................................................................ 13
3 Results of the Integrated Vulnerability Assessment ......................................... 15 3.1 Indicator vulnerability ...................................................................................................................... 15 3.2 Sector vulnerability .......................................................................................................................... 18 3.3 Climate variables ............................................................................................................................. 19 3.4 Indicators and climate variables ...................................................................................................... 20
4 Discussion ............................................................................................................ 25 4.1 Priority areas of vulnerability ........................................................................................................... 25 4.2 Opportunities ................................................................................................................................... 27 4.3 Identifying key areas of decision making ........................................................................................ 27 4.4 Next steps ....................................................................................................................................... 28
5 References ............................................................................................................ 29
Appendix A - Indicators used for IVA ........................................................................ 30
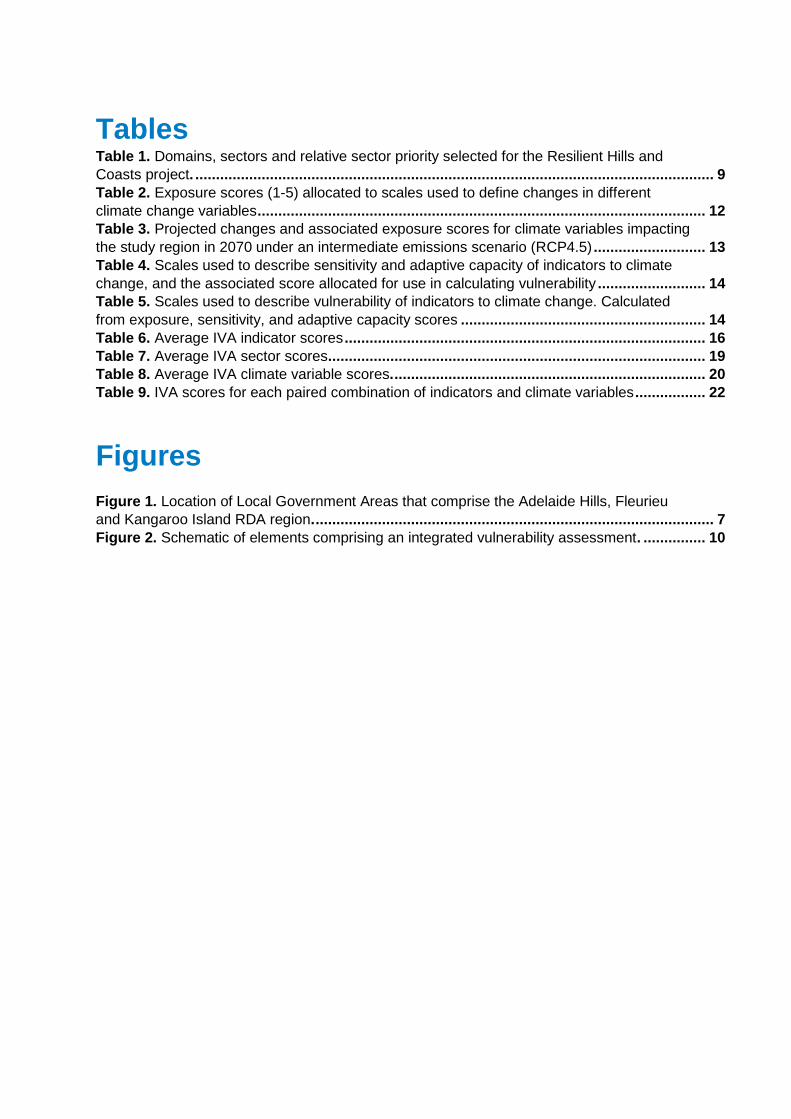
Tables Table 1. Domains, sectors and relative sector priority selected for the Resilient Hills and
Coasts project. ............................................................................................................................. 9 Table 2. Exposure scores (1-5) allocated to scales used to define changes in different
climate change variables ............................................................................................................ 12 Table 3. Projected changes and associated exposure scores for climate variables impacting
the study region in 2070 under an intermediate emissions scenario (RCP4.5) ........................... 13 Table 4. Scales used to describe sensitivity and adaptive capacity of indicators to climate
change, and the associated score allocated for use in calculating vulnerability .......................... 14 Table 5. Scales used to describe vulnerability of indicators to climate change. Calculated
from exposure, sensitivity, and adaptive capacity scores ........................................................... 14 Table 6. Average IVA indicator scores ....................................................................................... 16 Table 7. Average IVA sector scores ........................................................................................... 19 Table 8. Average IVA climate variable scores. ........................................................................... 20 Table 9. IVA scores for each paired combination of indicators and climate variables ................. 22
Figures
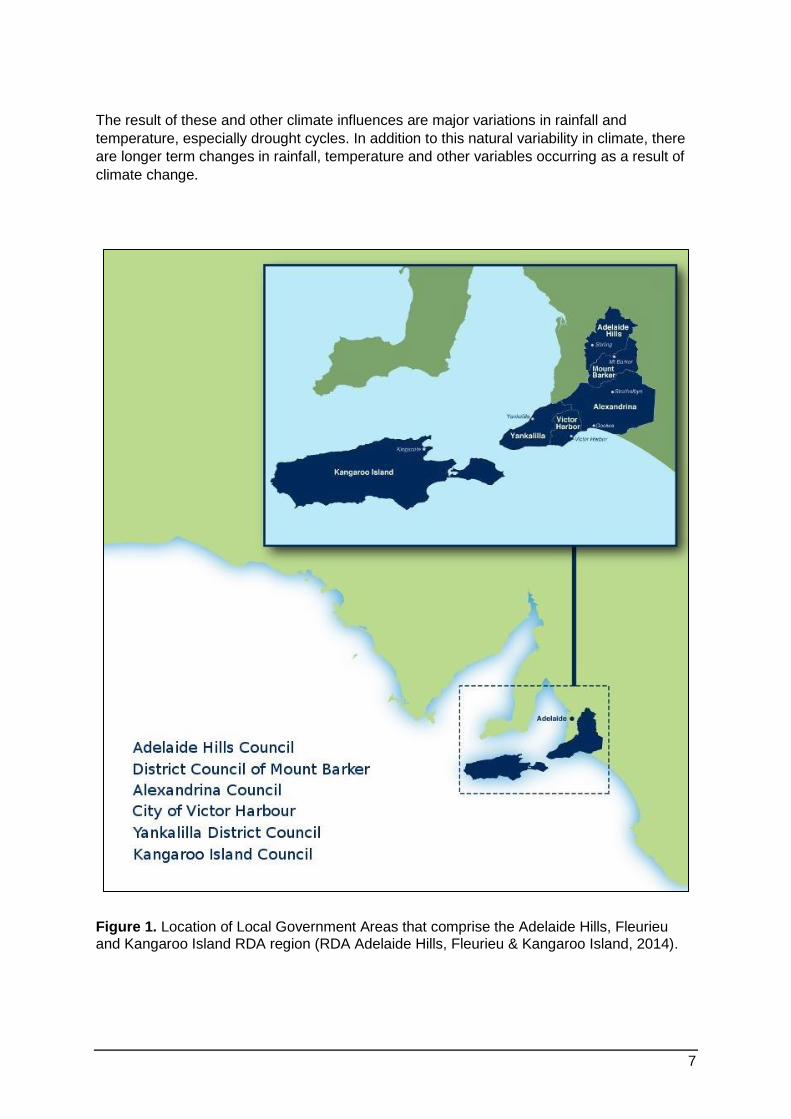
Figure 1. Location of Local Government Areas that comprise the Adelaide Hills, Fleurieu
and Kangaroo Island RDA region. ................................................................................................ 7 Figure 2. Schematic of elements comprising an integrated vulnerability assessment. ............... 10

1
Acronyms BOM - Bureau of Meteorology ENSO - El Niño Southern Oscillation IOD - Indian Ocean Dipole IPCC – Intergovernmental Panel on Climate Change IVA – Integrated Vulnerability Assessment LGA SA - Local Government Association of South Australia RCP – Representative Concentration Pathway RDA - Regional Development Australia RH&C - Resilient Hills and Coasts

2
Executive summary Resilient Hills & Coasts (RH&C) is a partner project between Local Government, NRM
Boards and State and Federal Governments to develop a Regional Climate Change
Adaptation Action Plan (the Adaptation Plan) for Adelaide Hills, Fleurieu Peninsula and
Kangaroo Island region. As part of this process an Integrated Vulnerability Assessment (IVA)
was undertaken to identify priority features or systems in the region that are most vulnerable
to the impacts of climate change so as to help focus adaptation planning. This report
presents the results of the IVA for the Adelaide Hills and Fleurieu Peninsula part of the
region. An IVA assessment for Kangaroo Island has previously been completed (Resilient
Hills and Coasts, 2014a). The findings from both IVA assessments will be combined in the
next project stage in order to produce a single climate change adaptation plan for the whole
region.
The IVA was undertaken for 53 indicators covering 10 sectors relevant to the following four
domains:
social and community;
assets and infrastructure;
regional economy; and
environment and natural resources.
The IVA was based on the most up-to-date available climate projections to 2070 for the
intermediate emissions scenario (representative concentration pathway RCP4.5)1. This
timeframe was chosen because many decisions made in relation to key sectors for the
region were identified as having lifetimes of at least 50 years. IVA assessments were
underpinned by information derived from a combination of literature reviews and interviews,
focus groups and workshops with subject matter experts.
The assessment found the sectors that will be most affected as a whole are from the social
and community, and environment and natural resources domains. However, there were also
many combinations of indicators and individual climate variables outside of these sectors
that resulted in high vulnerability scores, such as the impact of sea level rise on coastal zone
communities and public coastal assets. As such, a broad range of indicators were found to
be potentially highly vulnerable to the impacts of climate change.
The IVA results were used to develop “key areas of decision making” that will become the
focus of the adaptation plan in the next stage of the project. The context for setting key areas
of decision making for the Adelaide Hills and Fleurieu Peninsula differs somewhat from other
regions of the State, as climate change impacts in this region will also include a number of
opportunities due to the current more favourable climate and expected population growth.
For example, the already cooler weather experienced in the region compared to other parts
of the State is likely to lead to benefits for the tourism and retail industries as visitors and
residents are likely to increase across the region as people seek refuge from increasing
1 In the most recently updated reports released by the Intergovernmental Panel on Climate Change (IPCC)
(IPCC, 2013), representative concentration pathways (RCPs) replace the emissions scenarios (e.g. A1, B2, A1FI) used in previous report.

3
temperatures and extreme heat days in other parts. Such opportunities presented by climate
change are not necessarily captured well by the IVA process but will be specifically
considered in the following adaptation plan stage of the project.
Based on the results of the IVA together with consideration of emerging opportunities, the
following 10 key areas of decision making are proposed as the basis for further adaptation
planning:
1. Agriculture - How do we maintain agricultural productivity and water security, especially for horticulture, viticulture and dryland grazing, given projected declining rainfall and increasing temperature?
2. Water-dependent ecosystems - How do we protect water-dependent ecosystems given projected declining rainfall and increasing temperature and fire risk?
3. Natural landscapes - How do we maintain the condition of natural landscapes (plains,
flanks, uplands) given projected declines in rainfall and increasing temperature and fire risk?
4. Coastal ecosystems - How do we maintain the condition and extent of sedimentary
coastal ecosystems given projected increases in sea levels?
5. Public coastal assets - How do we maintain the condition of public coastal assets given projected increases in sea levels?
6. Vulnerable members of the community - How do we enhance the health, safety and
well-being of vulnerable members of the community as the risk of extreme events such as fire, extreme heat and flooding (as a consequence of rainfall intensity and sea level rise) increases?
7. Emergency management services - How do we respond to the growing demand for
emergency management services across multiple sectors as the risk of extreme events such as fire, extreme heat and flooding (as a consequence of rainfall intensity and sea level rise) increases?
8. Community facilities and open space areas - How do we maintain and expand
community facilities and open space areas for sport and recreation to meet a growing community’s demands given projected declines in rainfall and increasing temperature and fire risk coupled with increasing population and development?
9. Infrastructure assets - How do we maintain and expand infrastructure assets, such as
roads and energy networks, given projected declines in rainfall and increasing temperature and fire risk?
10. Homes and buildings - How do we maintain the condition of existing homes and buildings (public and private) and enhance their effective operation as the risk of extreme events such as fire, extreme heat and flooding as a consequence of rainfall intensity and sea level rise increases?
The next stage of the RH&C project is to prepare the Climate Change Adaptation Plan for
the whole region (i.e. Adelaide Hills, Fleurieu Peninsula and Kangaroo Island). The primary
aim of the adaptation planning process will be to consider the key areas of decision making
4
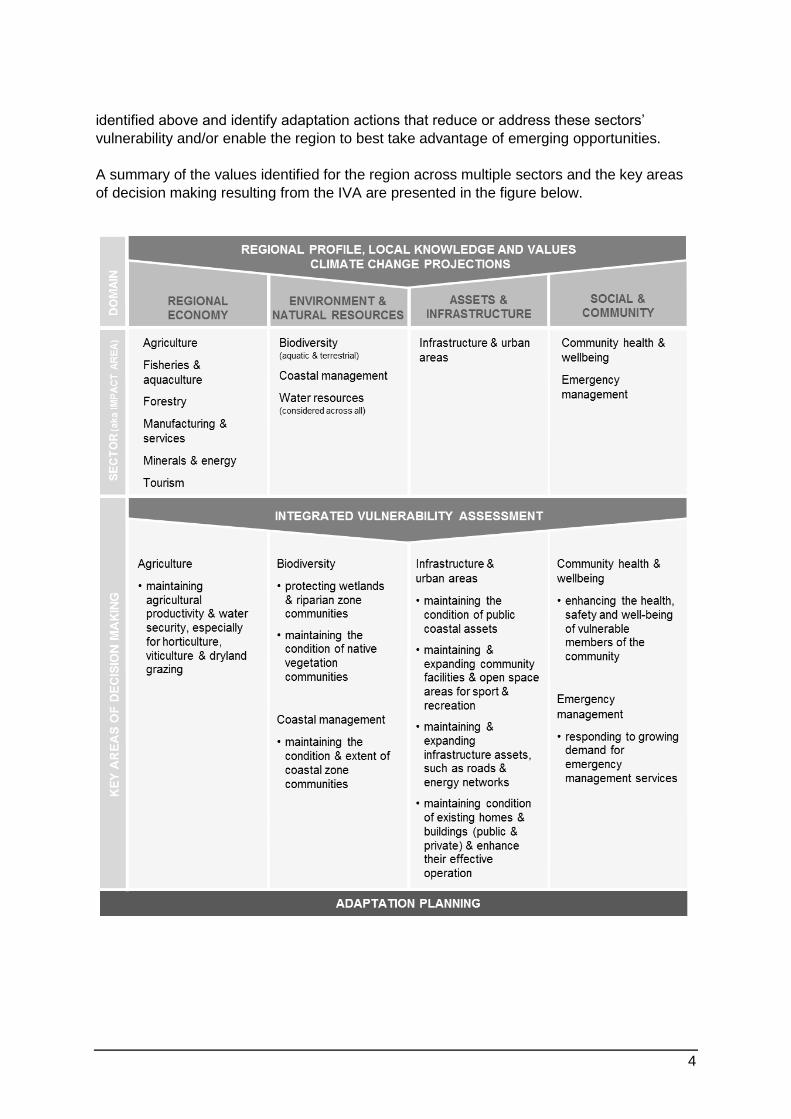
identified above and identify adaptation actions that reduce or address these sectors’
vulnerability and/or enable the region to best take advantage of emerging opportunities.
A summary of the values identified for the region across multiple sectors and the key areas
of decision making resulting from the IVA are presented in the figure below.
5
1 Introduction
1.1 Resilient Hills and Coasts overview
Resilient Hills and Coasts (RH&C) is a climate change adaptation planning project covering
the Adelaide Hills, Fleurieu and Kangaroo Island Regional Development Australia (AHFKI
RDA) region (Figure 1). The RH&C name is also used to refer to the region covered.
The project partners are:
Adelaide Hills Council;
Alexandrina Council;
City of Victor Harbor;
District Council of Mount Barker;
District Council of Yankalilla;
Kangaroo Island Council;
Department of Environment, Water & Natural Resources;
Natural Resources Adelaide and Mount Lofty Ranges;
Natural Resources Kangaroo Island;
Regional Development Australia Adelaide Hills, Fleurieu and Kangaroo Island; and
the Southern and Hills Local Government Association.
As a collective, project partners, with input from community, business, government, industry
and academia, undertook the initial phase of the RH&C project in 2014, completing:
a “Knowledge Audit” describing the regional profile;
community workshops summarised in a report that describes stakeholder issues and
values; and
an “Integrated Vulnerability Assessment for Kangaroo Island”.
The second stage is building on the work completed in 2014 and will consider social,
economic, environmental, and cultural factors to present a holistic set of adaptation actions
and recommendations. In particular, it will focus on regional priorities that will benefit from
multi-organisation cohesion and cooperation, and provide a strong evidence-base for
localised planning and action.
During the second stage, Resilient Hills & Coasts, with stakeholder input, will produce and
share:
up-to-date climate change projections for the region;
a vulnerability assessment describing the key sectors; and
a regional Climate Change Adaptation Plan.

6
1.2 Study region
The study region, for the purposes of this Integrated Vulnerability Assessment (IVA), covers
only the mainland portion of the RH&C project area (Figure 1), with an IVA previously being
conducted separately for Kangaroo Island (Resilient Hills and Coasts, 2014a). The study
region therefore covers a land area of approximately 4,354km2 characterised by a highly
variable topography and geology, from coastal dunes and rocky escarpments to inland fertile
hills and pasturelands.
The human population is approximately 120,000 people and is currently growing and aging,
which is changing the region’s demographics, though not consistently across all local
Council areas (Resilient Hills and Coasts, 2014b). For example, population growth rates tend
to be highest in Victor Harbor local government area and lowest in the Adelaide Hills area,
and the aging population is particularly prevalent in coastal townships on the Fleurieu
Peninsula, which present particularly attractive retirement destinations. Other local
government areas however, such as Mount Barker, are experiencing a growing younger
population, due largely to population growth from inland migration by working-aged people
and young families (Resilient Hills and Coasts, 2014b).
The region’s communities tend to be well educated and qualified, and on average are
physically healthier and have lower unemployment rates, compared to the State; though the
health and affluence of communities in the region also varies geographically (Resilient Hills
and Coasts, 2014b). For example, compared to the rest of the region, the Adelaide Hills has
the lowest unemployment rates as well as the highest proportion of education graduates. On
the mainland, almost half of the region’s large workforce commutes to areas outside of the
region for work, which is facilitated through good connections to the Adelaide Metropolitan
Area.
The region also supports a successful economy, with a strong and diverse primary
production sector, including dryland cropping, irrigated cropping, horticulture, viticulture and
livestock grazing. Forestry and commercial precincts, together with an increasingly growing
tourism industry add to the region’s overall economic prosperity (Resilient Hills and Coasts,
2014b).
The heterogeneous landscape of the region further underpins the occurrence of numerous
environmental assets, including terrestrial, coastal, aquatic and marine systems which
support a diverse assemblage of flora and fauna species (including threatened species), a
number of threatened plant communities, and nationally and internationally significant
wetlands (Resilient Hills and Coasts, 2014b).
The RH&C region has a Mediterranean climate and as such experiences natural variability in
weather during the year, characterised by hot dry summers and cold wet winters. Climate
patterns vary year to year as well with major climate influences including the (Bureau of
Meteorology 2015):
Indian Ocean Dipole (IOD), which affects the climate of Australia and other countries
that surround the Indian Ocean Basin, and is a significant contributor to rainfall
variability; and
El Niño Southern Oscillation (ENSO), the oscillation between El Niño and La Niña
conditions which affects rainfall and temperature in eastern Australia.
7
The result of these and other climate influences are major variations in rainfall and
temperature, especially drought cycles. In addition to this natural variability in climate, there
are longer term changes in rainfall, temperature and other variables occurring as a result of
climate change.
Figure 1. Location of Local Government Areas that comprise the Adelaide Hills, Fleurieu and Kangaroo Island RDA region (RDA Adelaide Hills, Fleurieu & Kangaroo Island, 2014).

8
1.3 Purpose and structure of this report
This report presents the consolidated results of the IVA conducted for 10 priority sectors
(Table 1) selected for the Adelaide Hills and Fleurieu Peninsula parts of the RH&C region.
An IVA assessment for priority sectors relevant to Kangaroo Island was previously
completed in 2014 (Resilient Hills and Coasts, 2014a).
Further information on the vulnerability scores for individual sectors and the information used
as the basis for his scoring is provided in the following reports:
High priority sector Integrated Vulnerability Assessment report for the Adelaide Hills and
Fleurieu Peninsula - Infrastructure and urban areas;
High priority sector Integrated Vulnerability Assessment report for the Adelaide Hills and
Fleurieu Peninsula – Emergency management;
High priority sector Integrated Vulnerability Assessment report for the Adelaide Hills and
Fleurieu Peninsula – Biodiversity;
High priority sector Integrated Vulnerability Assessment report for the Adelaide Hills and
Fleurieu Peninsula – Agriculture;
Medium Priority Sectors Research Paper for the Adelaide Hills and Fleurieu Peninsula -
Coastal management, community health and well-being, and tourism; and
Low Priority Sectors Research Paper for the Adelaide Hills and Fleurieu Peninsula -
Fisheries and aquaculture, forestry, and manufacturing and services.

9
2 Approach to assessing vulnerability
2.1 Integrated Vulnerability Assessment (IVA) overview
An IVA is a tool that helps to identify domains of a system that are vulnerable to the impacts
of climate change, and assists with identifying and prioritising adaptation actions. It differs
from a standard vulnerability assessment because it specifically considers together the
social, economic, built and environmental domains of a system, as opposed to any one of
these in isolation (Table 1).
The IVA approach described here and used for regional adaptation planning in South
Australia is consistent with the approach presented in the Local Government Association of
South Australia’s (LGA SA) Climate Adaptation Planning Guidelines (Local Government
Association of South Australia, 2014). This approach begins by project partners selecting
sectors to represent the social, economic, built and environmental domains of the region
(Table 1). Sectors are selected based on their relative importance to the region and
perceived risk from climate change impacts.
To help guide the IVA, a preliminary vulnerability assessment was conducted to prioritise
sectors as high, medium, or low (Table 1). Priority levels reflect the result of the preliminary
vulnerability assessment, not the priorities for adaptation, which will be discussed in the final
adaptation plan. The RH&C project conducted its IVA with different levels of resourcing
depending on whether sectors were categorised as high, medium or low priorities.
A subset of indicators representing each sector is then selected (see Appendix A for
selected indicators) by the project partners and these are assessed for their relative
vulnerability to climate change impacts. An indicator can describe the sectors and domains
of interest in a study region. For example, ‘the amount of land available for urban
development’ was assessed as an indicator for the Infrastructure and Urban Areas sector.
Indicators were assessed separately under respective sectors and then consolidated into a
single IVA spreadsheet to conduct the analysis that forms the basis of this report.
Table 1. Domains, sectors and relative sector priority selected for the Resilient Hills and Coasts project.
DOMAIN SECTORS PRIORITY
Social and community Community health & well being Medium
Assets and infrastructure Infrastructure & urban areas;
Emergency management
High
High
Regional economy
Manufacturing & services;
Fisheries & aquaculture;
Forestry;
Tourism;
Agriculture;
Low
Low
Low
Medium
High
Environment & natural resources Coastal management;
Biodiversity (marine, aquatic, terrestrial)
Medium
High

10
Five main elements are considered when calculating the vulnerability of indicators to climate
change: exposure, sensitivity, potential impact, adaptive capacity, and vulnerability (Figure
2). These were originally defined by the Allen Consulting Group (2005), with the modified
definitions for exposure and sensitivity provided below taken from the Resilient South IVA
report (Resilient South, 2014):
exposure: considers the likelihood of a feature or its function being subjected to a
climate variable. For example, beaches are exposed to coastal inundation, but not
exposed to increased frequency of bushfires;
sensitivity: considers the degree to which a feature or its functions are affected by a
climate variable;
potential impact: is the combined effect of exposure and sensitivity;
adaptive capacity: is the ability of a system to adjust to climate change (including
climate variability and extremes) to moderate potential damages, to take advantage of
opportunities, or to cope with the consequences. The more adaptive a system, the less
vulnerable it is; and
vulnerability: the degree to which systems are susceptible to, and unable to cope with,
the adverse impacts of climate change. It is a function of potential impact and adaptive
capacity.
Figure 2. Schematic of elements comprising an integrated vulnerability assessment.
11
2.2 Sectors and indicators
The IVA assessed 53 indicators across 10 selected sectors relevant to four domains
(Appendix A). Two additional sectors were also acknowledged as important in the region but
were not specifically considered for assessment in the IVA, these were:
water resources – while water was considered a priority for the region, it is also
understood to have direct importance for underpinning a number of the other sectors
and as such, water-related indicators were spread across other sectors. For example,
surface water and groundwater systems were considered under the agriculture sector
while infrastructure for potable and wastewater were considered under the infrastructure
an urban areas sector;
cultural heritage – this sector will be considered separately as part of developing the
adaptation plan with advice from Indigenous representatives.
This IVA was conducted with different levels of resourcing depending on whether sectors
identified by project partners were considered to be high, medium or low priorities (Table 1).
Priority levels were determined according to the results of a preliminary vulnerability
assessment and do not imply priorities for adaptation. Priorities for adaptation will be
informed by the IVA and broad consultation that will occur during the adaptation planning
phase of the project. The approach to the three priority levels was as follows:
high priority sector: literature search combined with interviews and/or a focus group with
subject matter experts;
medium priority sector: workshop with subject matter experts; and
low priority sector: literature review.
2.3 Calculating vulnerability
The IVA was undertaken by scoring each sector’s indicators for exposure, sensitivity and
adaptive capacity in relation to a selection of the climate variables (see Sections 2.3.1-2.3.3).
Together these are used to generate an overall average vulnerability score for each indicator
and sector.
In order to identify areas of high vulnerability for the entire region, the indicator scores were
consolidated and assessed in four ways: average indicator vulnerability score; average
sector vulnerability score, average vulnerability score per climate variable, and individual
combined scores for indicators and climate variables (see Section 3,0).
2.3.1 Climate change projections
Climate change projections used in this project were based on the intermediate
representative concentration pathways (RCPs) defined in the latest report by the
Intergovernmental Panel on Climate Change (IPCC, 2013). Hereafter, representative
concentration pathways will be generically referred to as emissions scenarios. Although the
IPCC report also indicates the Earth is currently tracking on the high emissions scenario
(RCP8.5) (IPCC, 2013), the project partners chose to use the intermediate emissions
scenario (RCP4.5) data based on the assumption that global mitigation efforts will avoid the
high emissions scenario. Project partners also acknowledged that while the intermediate
emissions scenario will be used to guide the IVA, ongoing management and implementation
of actions will naturally respond and adapt according to evidence available at the time. The
12
timeframe of 2070 was chosen based on the recognition that many of the decisions made by
Project Partners in the region have decision lifetimes2 of at least 30-50 years.
Climate change projections for the region are detailed in the “Climate Change Projections for
the Adelaide Hills, Fleurieu Peninsula and Kangaroo Island Region” report (Resilient Hills
and Coasts, 2015). The full range of climate variables examined and their projected changes
in the region presented in Section 3. In general, the region will experience warmer to hotter
average temperatures, with most models also showing a drier to much drier climate and
rising sea levels.
2.3.2 Exposure scores
Exposure scores are generated using climate projection data for specified combinations of
emissions scenarios and future time periods. For the purposes of this IVA, the intermediate
emissions scenario (RCP4.5) to 2070 was used to generate exposure scores for the nine
main climate variables identified in the “Climate Change Projections for the Adelaide Hills,
Fleurieu Peninsula and Kangaroo Island Region” report (Resilient Hills and Coasts, 2015).
Scores are generated using the scales presented in the LGA SA’s “Climate Adaptation
Planning Guidelines” report (Local Government Association of South Australia, 2014; Table
2). As exposure scores are linked to climate variables, they remain unchanged regardless of
the indicator being assessed.
The full range of climate variables examined, their projected changes in the region, and the
relevant exposure scores are presented in Table 3. The climate variables most relevant to
the indicators being assessed for the priority sectors are identified in each of the individual
sector reports.
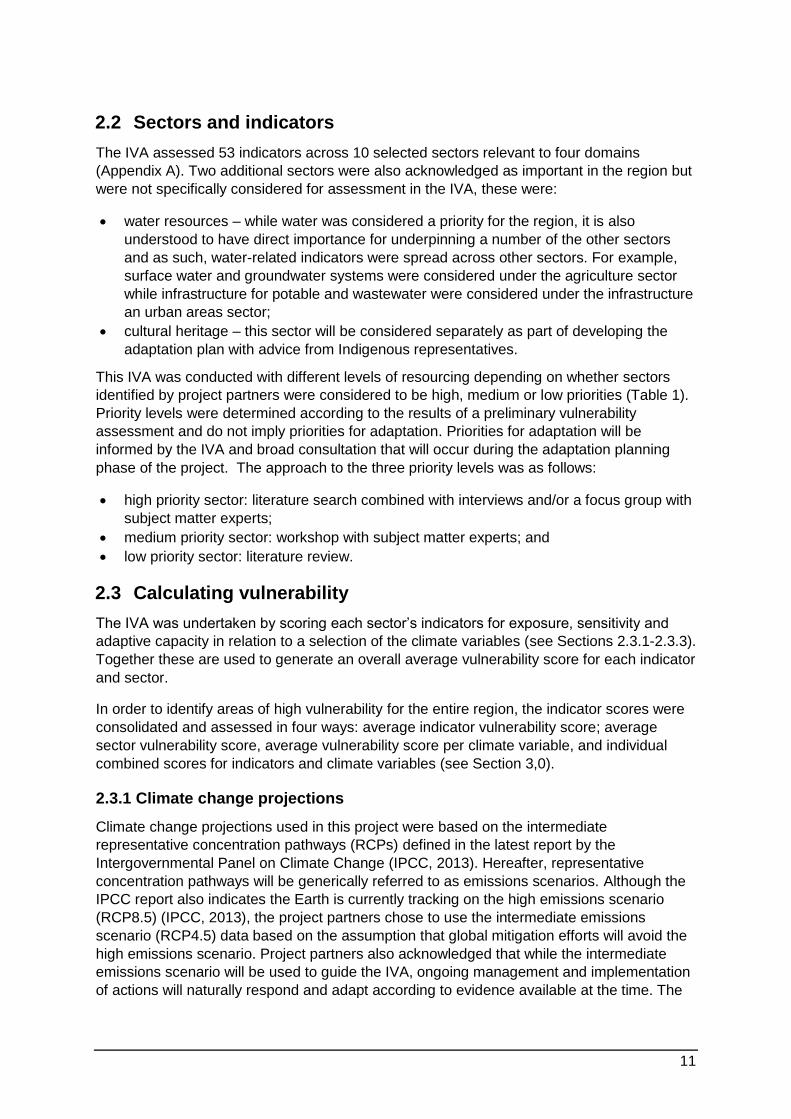
Table 2. Exposure scores (1-5) allocated to scales used to define changes in different
climate change variables. Modified from Table 1.5.1 in the LGA SA’s “Climate Adaptation
Planning Guidelines” report (Local Government Association of South Australia, 2014).
SCORE
SCALE 1 2 3 4 5
General description for
qualitative data (%) 0-20% 21-40% 41-60% 61-80% 81-100%
Absolute change in
temperature (ºC) 0.01-0.4 0.41 - 0.8 0.81 - 1.2 1.21 - 1.6 1.61 - 2.0
Change in rainfall from
baseline (%) 1-5% 5-10% 10-15% 15-20% 20-25%
Increase in sea level (m) 0.0-0.1 0.11-0.2 0.21-0.3 0.31-0.4 0.41-0.5
2 The concept of decision lifetimes is further described in Stafford Smith et al. (2010).

13
Table 3. Projected changes and associated exposure scores for climate variables impacting the study region in 2070 under an intermediate emissions scenario (RCP4.5).
CLIMATE VARIABLE PROJECTED
TREND
PROJECTED
CHANGE BY 2070*
EXPOSURE
SCORE
Rainfall
Annual median Decreasing 5.7% 2
Spring median Decreasing 16.4% 4
Summer median Decreasing 9.6% 2
Autumn median Decreasing 3.2% 1
Winter median Decreasing 6.0% 2
Intensity Increasing 11% 3
Temperature (atmospheric)
Annual median maximum Increasing 1.5ºC 4
Annual median minimum Increasing 1.2ºC 3
Annual number of days above 35ºC Increasing 57% 3
Annual number of days above 40ºC Increasing 150% 5
Spring median maximum Increasing 1.9ºC 5
Summer median maximum Increasing 1.5ºC 4
Autumn median maximum Increasing 1.5ºC 4
Winter median maximum Increasing 1.3ºC 4
Spring median minimum Increasing 1.2ºC 3
Summer median minimum Increasing 1.1ºC 3
Autumn median minimum Increasing 1.2ºC 3
Winter median minimum Increasing 1ºC 3
Fire
Annual number of severe fire risk days Increasing 65% 5
Gulf and ocean
Ocean acidity Increasing 41% by 2090 3
Sea level rise Increasing 33 cm 4
Sea surface temperature Increasing 1.2ºC by 2090 3
* Projections are those for the 2070 future time period, unless otherwise indicated.
2.3.3 Sensitivity and adaptive capacity scores
Sensitivity and adaptive capacity scores are generated for each of the indicators based on
the scales presented in the LGA SA’s “Climate Adaptation Planning Guidelines” report (Local
Government Association of South Australia, 2014; Table 4) and information derived from
existing research and expert knowledge. For the purposes of this research paper, that

14
information was sourced from the individual sector reports which used varying methods to
collate relevant information including: desktop literature reviews, targeted workshops, expert
focus groups, and one-on-one interviews with specific experts.
The scores are combined as follows to produce a vulnerability score (Table 5) for each
indicator:
Vulnerability = (Potential Impact – Adaptive Capacity) +10
where,
Potential Impact = Exposure + Sensitivity.
Table 4. Scales used to describe sensitivity and adaptive capacity of indicators to climate
change, and the associated score allocated for use in calculating vulnerability.
SENSITIVITY
SCALE
ADAPTIVE CAPACITY
SCALE ALLOCATED SCORE
Low Low 1
Low to Moderate Low 2
Moderate Low to Moderate 3
Moderate to High Low – Moderate 4
High Moderate 5
- Moderate 6
- Moderate to High 7
- Moderate to High 8
- High 9
- High 10
Table 5. Scales used to describe vulnerability of indicators to climate change. Calculated from exposure, sensitivity, and adaptive capacity scores.
VULNERABILITY SCALE
Very Low Low Medium High Very High
2-3 4-7 8-11 12-15 16-19

15
3 Results of the Integrated Vulnerability
Assessment This section presents the consolidated result of the Resilient Hills and Coasts IVA.
Experience shows that taking a simple average of indicators tends to mask what is
influencing vulnerability scores. Therefore, a four-way analysis is presented here to explore
potential conclusions regarding vulnerability and the underlying drivers.
Across the 53 indicators a total of 403 assessments were undertaken, resulting in 2,015
individual exposure, sensitivity, potential impact, adaptive capacity and vulnerability scores.
3.1 Indicator vulnerability
The impact of multiple climate variables was assessed for each indicator. Average
vulnerability scores for each indicator were then calculated as the average scores for all
climate variables assessed for an indicator. The highest 10% of average indicator
vulnerability scores exceeded 15.5 and the top 25% exceeded 14.2; the lowest 25% had
scores of lower than 10.9. Fifteen indicators represented the top 25% and all had adaptive
capacity scores of three or less and potential impact scores of more than 6.6. Additional
details of indicator scores can be found in the individual sector reports.
The 15 indicators comprising the top 25% of indicator scores represented five sectors:
community health and well-being (5 indicators);
biodiversity (5 indicators);
infrastructure and urban areas (3 indicators);
agriculture (1 indicator);and
coastal management (1 indicator).
The health and well-being of vulnerable members of the community was consistently one of
the most vulnerable types of indicator, with specific areas of concern being in relation to
people living in low income households, people aged over 75 and less than 15 years, and
people living with a disability. The other indicator from the community health and well-being
sector was community services and facilities meeting needs of all community members,
which is also relevant to infrastructure and urban areas.
The biodiversity indicators cover terrestrial and freshwater environments. The two terrestrial
indicators are condition and natural recruitment of scattered trees and condition and extent
of forest communities. It was noted during the biodiversity IVA focus group that in addition to
climate change related threats, scattered trees are highly vulnerable to threats from adjacent
livestock farming land-uses, mainly because of the exposure of seedlings to grazing
pressure. The freshwater ecosystem indicators were for riparian zone communities and
wetlands. All of these indicators were influenced by temperature, rainfall and fire related
climate variable scores.

16
The infrastructure and urban area indicators were diverse and relate to effective operation of
the road network, effective functioning, viability and vibrancy of retail and commercial
centres in towns, and condition of State and local heritage items (built items). The adaptive
capacity was low for all indicators and potential impact was moderate to high. The major
driver of higher vulnerability scores was projected extreme heat and fire risk.
The other high vulnerability indicators were demand for emergency management services,
condition of reef areas in marine habitats and the condition (quality and quantity) of surface
water systems. Emergency management services and the condition of surface water
systems are relevant to multiple sectors, such as agriculture and infrastructure and urban
areas.
Table 6. Average IVA indicator scores for: E= Exposure; S = Sensitivity; PI = Potential Impact; AC = Adaptive Capacity; V = Vulnerability. Vulnerability colour coding: = very high; = high; = medium; = low.
INDICATOR E S PI AC V
Health, safety and well-being of low income households 4.0 4.5 8.5 2.0 16.5
Condition and (natural) recruitment of scattered trees 3.8 4.5 8.3 2.0 16.3
Health, safety and well-being of vulnerable members of
the community (aged over 75)
3.8 4.2 8.0 1.8 16.2
Condition and extent of forest communities 3.4 4.4 7.9 1.9 16.0
Condition and extent of riparian zone communities 3.3 4.1 7.4 1.9 15.6
Demand for emergency management services 4.0 4.3 8.3 2.8 15.5
Health, safety and well-being of vulnerable members of
the community (aged under 15)
4.0 3.3 7.3 2.0 15.3
Health, safety and well-being of people with disability 3.6 4.6 8.2 3.0 15.2
Condition and extent of wetland ecosystems 2.9 4.1 7.0 1.9 15.1
Effective operation of road network 4.0 2.8 6.8 2.0 14.8
Condition of marine habitats - reef areas (off shore and
intertidal)
3.3 3.8 7.0 2.5 14.5
Effective functioning, viability and vibrancy of retail and
commercial centres in towns
4.0 3.5 7.5 3.0 14.5
Community services and facilities (incl. health and
education) meet needs of all community members
3.6 3.8 7.4 3.0 14.4
Condition (quality and quantity) of surface water systems 2.4 4.2 6.6 2.4 14.2
Condition of State and local heritage items (built) 3.6 3.6 7.2 3.0 14.2
Amenity and character provided by open space and
public realm
3.7 3.4 7.1 3.0 14.1
Effective operation of stormwater management
infrastructure
4.0 3.0 7.0 3.0 14.0
Condition and extent of woodland communities 3.9 4.4 8.3 4.6 13.7

17
INDICATOR E S PI AC V
Condition of ground water systems 2.5 3.5 6.0 2.3 13.7
Recreation opportunities provided by outdoor facilities
including open and green space
3.7 3.0 6.7 3.2 13.5
Community participation in clubs, organisations and
groups
3.7 3.5 7.2 3.7 13.5
Condition and extent of marine habitats - sea grass 3.3 4.0 7.3 3.8 13.5
Health services and facilities meet needs of all
community members
4.0 4.0 8.0 4.5 13.5
Effective operation of electricity supply network 4.0 4.3 8.3 5.0 13.3
Effective operation of onsite wastewater treatments 3.3 2.8 6.0 3.0 13.0
Regional economic contribution of the health care sector 3.5 2.5 6.0 3.0 13.0
Condition and extent of grassland communities 2.8 4.8 7.6 4.6 13.0
Productivity of forestry land uses 3.3 4.6 7.9 4.9 13.0
Condition of residential housing 4.0 4.0 8.0 5.0 13.0
Condition of Aboriginal heritage items and places 3.8 4.0 7.8 5.0 12.8
Effective operation of public transport services 4.0 3.5 7.5 5.0 12.5
Condition and extent of coastal zone communities 3.1 4.4 7.6 5.1 12.4
Availability of land for urban development 3.7 4.7 8.3 6.0 12.3
Regional economic contribution of the manufacturing
sector
3.5 4.0 7.5 5.3 12.2
Productivity of fisheries (commercial and recreational) 3.3 4.0 7.3 5.7 11.7
Effective operation of telecommunications infrastructure 4.0 3.5 7.5 6.0 11.5
Condition of sandy coasts 3.5 3.8 7.3 6.0 11.3
Volunteering to support emergency management 4.0 3.0 7.0 6.0 11.0
Education services and facilities meet needs of all
community members
4.0 4.0 8.0 7.0 11.0
Productivity of cropping activities - dryland 3.4 2.7 6.1 5.2 10.9
Regional economic contribution of the construction
sector
3.4 3.6 7.0 6.1 10.9
Productivity of viticultural land uses 3.3 3.7 7.0 6.2 10.8
Wealth, vibrancy and participation in events, celebrations
and activities
3.6 3.7 7.2 6.7 10.6
Productivity of horticultural land uses 3.3 3.2 6.4 6.2 10.3
Condition of public coastal assets 3.5 2.5 6.0 5.8 10.3
Regional economic contribution of tourism sector 3.4 3.0 6.4 7.0 9.4
Productivity of livestock - irrigated 3.3 2.3 5.5 6.4 9.1
Productivity of intensive livestock activities 3.3 2.3 5.6 6.7 8.9

18
INDICATOR E S PI AC V
Capacity of landholders to actively undertake sustainable
natural resource management
3.3 1.9 5.2 7.4 7.8
Effective operation of potable water supply 3.6 3.2 6.8 9.0 7.8
Effective operation of SA Water wastewater treatment
network
3.6 2.8 6.4 9.0 7.4
Productivity of extensive livestock / grazing 3.4 1.9 5.2 8.0 7.2
Regional economic contribution of food processing 3.3 1.5 4.8 8.5 6.3
3.2 Sector vulnerability
Average vulnerability scores for each sector were calculated by averaging the exposure,
sensitivity, potential impact, adaptive capacity and vulnerability scores for each related
sector indicator (Table 7).
At the sector scale, biodiversity, community health and well-being, and emergency
management had the highest average vulnerability scores (75th percentile) and so are
considered the most vulnerable sectors within the region. While the average potential impact
score was the same for each (7.6), and not the highest which was for forestry (7.9), these
three sectors had the lowest average adaptive capacity, which acted to increase the relative
vulnerability.
The lowest average sector vulnerability scores were for agriculture, tourism, and
manufacturing and services. For agriculture and tourism this was driven by the lowest
potential impact scores (5.8 and 6.8) and high adaptive capacity scores (6.5 and 6.8) for any
sector. The results do not imply that some sectors such as agriculture and tourism are not
vulnerable to the impact of climate change, instead that they are relatively less vulnerable
than other sectors assessed in the region, especially biodiversity and community health and
well-being.
19
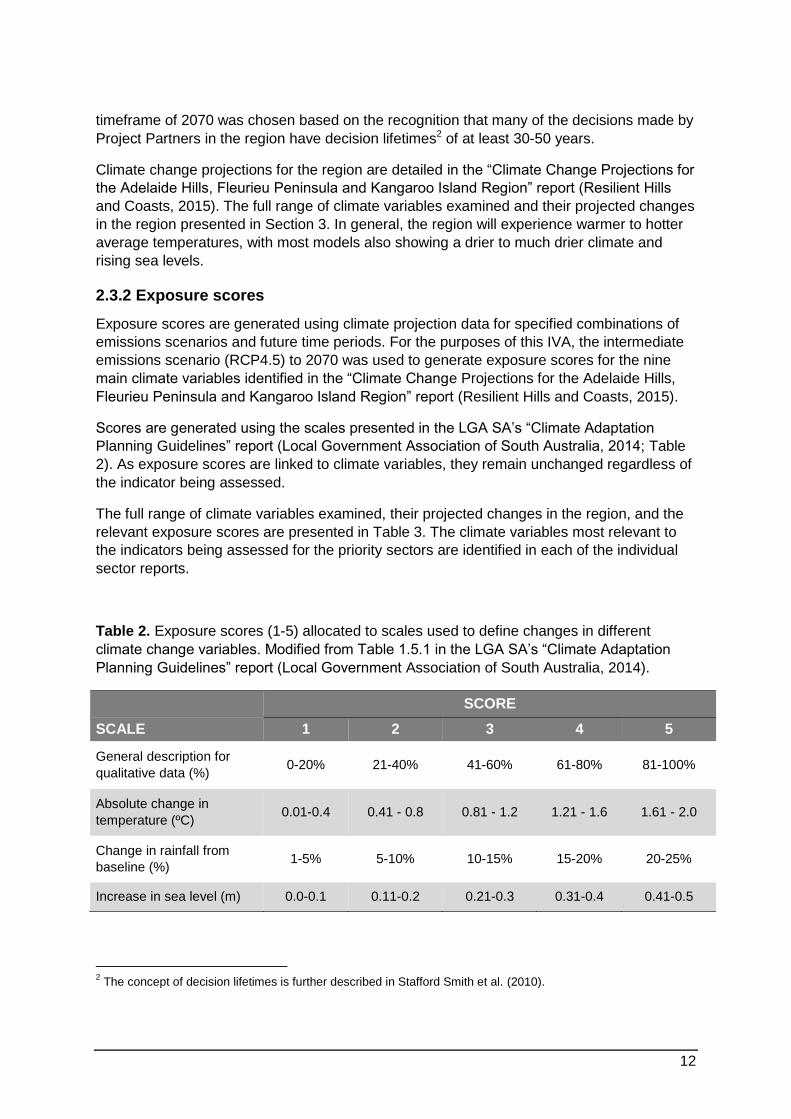
Table 7. Average IVA sector scores for: E= Exposure; S = Sensitivity; PI = Potential Impact; AC = Adaptive Capacity; V = Vulnerability. Where, vulnerability scores are: = high; = medium.
SECTOR E S PI AC V
Biodiversity 3.3 4.3 7.6 2.7 14.9
Community health & well-being 3.8 3.8 7.6 3.5 14.2
Emergency management 4.0 3.6 7.6 4.4 13.3
Forestry 3.3 4.6 7.9 4.9 13.0
Infrastructure & urban areas 3.8 3.3 7.1 4.6 12.5
Coastal management 3.3 3.8 7.1 4.7 12.4
Fisheries & aquaculture 3.5 4.0 7.5 5.3 12.3
Manufacturing & services 3.5 3.8 7.2 5.8 11.5
Tourism 3.5 3.3 6.8 6.8 9.9
Agriculture 3.2 2.5 5.8 6.5 9.3
3.3 Climate variables
Another option for analysing the results of the integrated vulnerability assessment is to
determine which climate variables contribute the most to high vulnerability scores. The
results of this analysis are presented in Table 8. Six climate variables were identified as
contributing the most to high vulnerability scores, being annual days above 40ºC, fire, spring
and winter median rainfall, rising sea levels and ocean acidity. The strong influence of
extreme heat and fire in particular was because of high potential impact and low adaptive
capacity scores.
Despite having moderate potential impact, ocean acidity had a major influence on
vulnerability scores because the adaptive capacity was assessed as being the lowest for all
climate variables. This conclusion while supported by stakeholders, was widely considered
as having low confidence given that there was virtually no known research available to
support assessment of adaptive capacity in relation to ocean acidity.

20
Table 8. Average IVA climate variable scores for: E= exposure; S = sensitivity; PI = potential impact; AC = adaptive capacity; v = Vulnerability. Vulnerability colour coding: = high; ……= medium; = low.
SECTOR E S PI AC V
Temperature - annual days above 40ºC increasing 5.0 4.1 9.1 4.3 14.7
Fire - annual number of severe fire days increasing 4.0 4.3 8.3 4.2 14.1
Rainfall - spring median declining 4.0 4.0 8.0 4.2 13.9
Sea level increasing 4.0 3.7 7.7 4.2 13.5
Ocean acidity increasing 3.0 3.1 6.1 3.4 12.7
Rainfall - winter median declining 2.0 4.1 6.1 4.2 11.9
Temperature - sea surface increasing 3.0 4.0 7.0 5.3 11.8
Rainfall - intensity increasing 3.0 3.3 6.3 4.8 11.5
Temperature - annual days above 35ºC increasing 3.0 3.6 6.6 5.2 11.4
Temperature - summer median maximum increasing 4.0 3.5 7.5 6.1 11.4
Temperature - spring median maximum increasing 5.0 2.9 7.9 6.6 11.3
Temperature - annual median maximum increasing 4.0 3.0 7.0 6.2 10.9
Rainfall - annual median declining 2.0 3.1 5.1 4.9 10.2
Rainfall - summer median declining 2.0 3.1 5.1 5.5 9.6
Temperature - autumn median maximum increasing 4.0 2.3 6.3 7.2 9.1
Temperature - winter median maximum increasing 4.0 2.2 6.2 7.3 8.9
Temperature - annual median minimum increasing 3.0 1.9 4.9 7.1 7.8
Temperature - spring median minimum increasing 3.0 1.7 4.7 7.1 7.6
Temperature - autumn median minimum increasing 3.0 1.7 4.7 7.4 7.2
Temperature - winter median minimum increasing 3.0 1.4 4.4 7.2 7.2
Rainfall - autumn median - declining 1.0 2.1 3.1 6.0 7.1
Temperature - summer median minimum - increasing 3.0 1.4 4.4 7.4 7.0
3.4 Indicators and climate variables
Individual combinations of indicators and climate variables can be analysed to determine
whether average indicator vulnerability scores are masking important drivers of vulnerability.
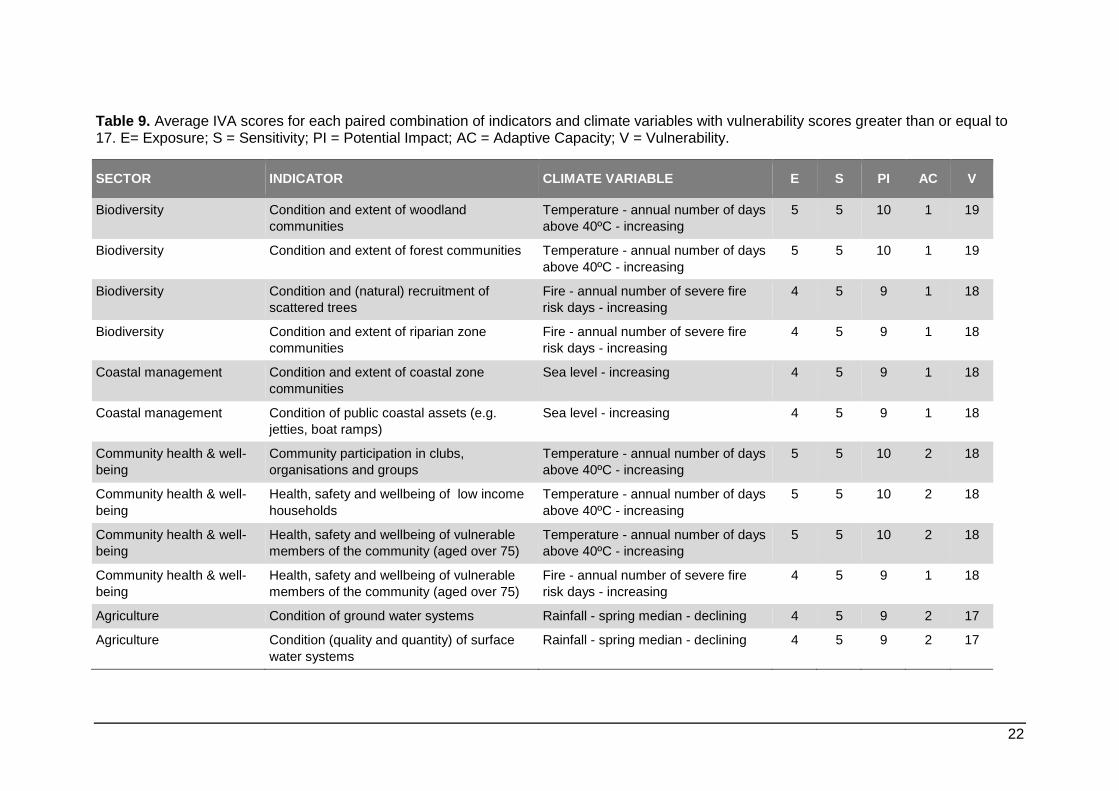
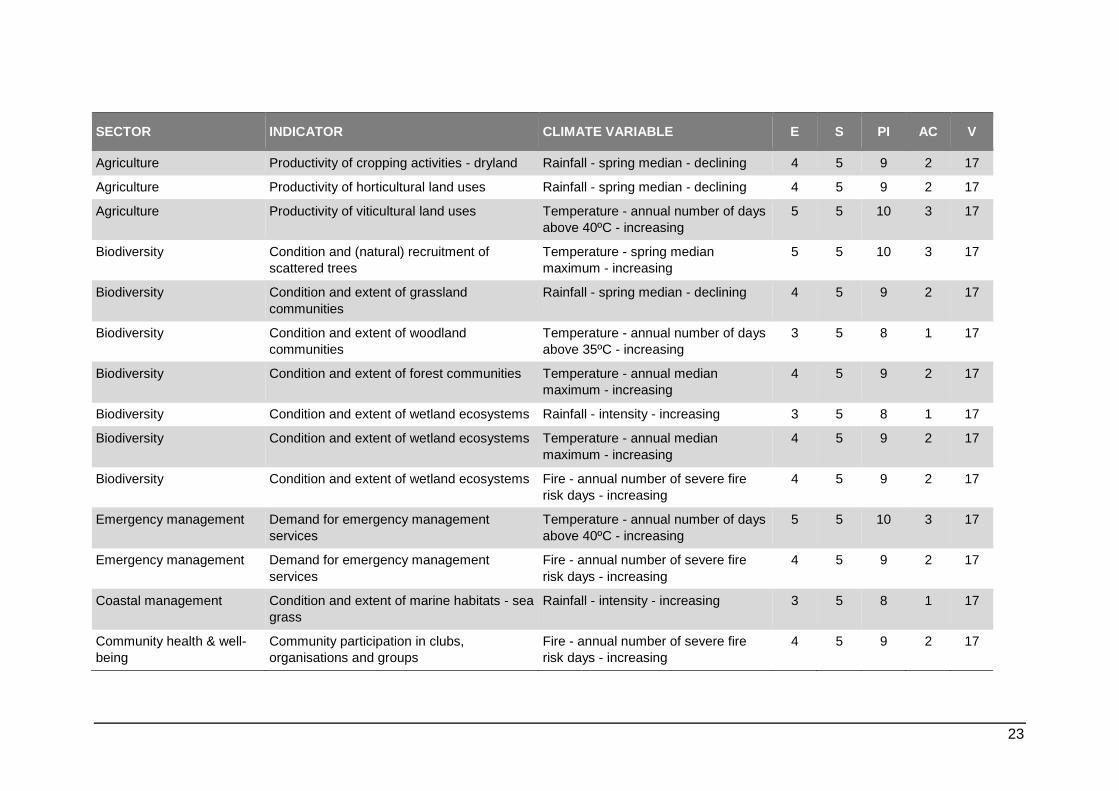
The results of this analysis are presented in Table 9.
Thirty three combinations of indicators and climate variables had scores of 17 or greater,
covering 22 indicators. The highset possible vulnerability score is 19, being a result of
exposure and sensitivity scores of 5 and an adaptive capacity score of 1. Only two
combinations had scores of 19, which related to the condition of forests and woodland
communities in relation to extreme heat:

21
The next highest score was 18, which occurred for the following combinations:
Condition and (natural) recruitment of scattered trees * Fire risk - increasing
Condition and extent of riparian zone communities * Fire risk - increasing
Condition and extent of coastal zone communities * Sea level - increasing
Condition of public coastal assets * Sea level - increasing
Community participation in clubs, organisations and groups * Temperature - annual
number of days above 40ºC - increasing
Health, safety and wellbeing of low income households * Temperature - annual number
of days above 40ºC - increasing
Health, safety and wellbeing of vulnerable members of the community (aged over 75) *
Temperature - annual number of days above 40ºC - increasing
Health, safety and wellbeing of vulnerable members of the community (aged over 75) *
Fire risk - increasing
The analysis identified 11 indicators with a high vulnerability in relation to one or more
climate variables (>17) that did not feature in the most vulnerable average indicators. This
demonstrates the masking of high vulnerability scores that can occur where only average
indicator scores are considered. Examples of indicators of this type were the condition and
extent of coastal zone communities and the condition of public coastal assets such as jetties
and boat ramps. Both indicators had high vulnerability to sea level rise but were also
assessed against rainfall and temperature, for which scores were low resulting in lower
indicator average scores.
While the analysis of combinations of indicators and climate variables identified high
vulnerability scores that had been masked out, it also re-enforced the reason why some
average indicator scores were high, such as the health, safety and wellbeing of people aged
over 75 which was highly vulnerable (scores of 18) to extreme heat and fire risk.
22
Table 9. Average IVA scores for each paired combination of indicators and climate variables with vulnerability scores greater than or equal to 17. E= Exposure; S = Sensitivity; PI = Potential Impact; AC = Adaptive Capacity; V = Vulnerability.
SECTOR INDICATOR CLIMATE VARIABLE E S PI AC V
Biodiversity Condition and extent of woodland
communities
Temperature - annual number of days
above 40ºC - increasing
5 5 10 1 19
Biodiversity Condition and extent of forest communities Temperature - annual number of days
above 40ºC - increasing
5 5 10 1 19
Biodiversity Condition and (natural) recruitment of
scattered trees
Fire - annual number of severe fire
risk days - increasing
4 5 9 1 18
Biodiversity Condition and extent of riparian zone
communities
Fire - annual number of severe fire
risk days - increasing
4 5 9 1 18
Coastal management Condition and extent of coastal zone
communities
Sea level - increasing 4 5 9 1 18
Coastal management Condition of public coastal assets (e.g.
jetties, boat ramps)
Sea level - increasing 4 5 9 1 18
Community health & well-
being
Community participation in clubs,
organisations and groups
Temperature - annual number of days
above 40ºC - increasing
5 5 10 2 18
Community health & well-
being
Health, safety and wellbeing of low income
households
Temperature - annual number of days
above 40ºC - increasing
5 5 10 2 18
Community health & well-
being
Health, safety and wellbeing of vulnerable
members of the community (aged over 75)
Temperature - annual number of days
above 40ºC - increasing
5 5 10 2 18
Community health & well-
being
Health, safety and wellbeing of vulnerable
members of the community (aged over 75)
Fire - annual number of severe fire
risk days - increasing
4 5 9 1 18
Agriculture Condition of ground water systems Rainfall - spring median - declining 4 5 9 2 17
Agriculture Condition (quality and quantity) of surface
water systems
Rainfall - spring median - declining 4 5 9 2 17
23
SECTOR INDICATOR CLIMATE VARIABLE E S PI AC V
Agriculture Productivity of cropping activities - dryland Rainfall - spring median - declining 4 5 9 2 17
Agriculture Productivity of horticultural land uses Rainfall - spring median - declining 4 5 9 2 17
Agriculture Productivity of viticultural land uses Temperature - annual number of days
above 40ºC - increasing
5 5 10 3 17
Biodiversity Condition and (natural) recruitment of
scattered trees
Temperature - spring median
maximum - increasing
5 5 10 3 17
Biodiversity Condition and extent of grassland
communities
Rainfall - spring median - declining 4 5 9 2 17
Biodiversity Condition and extent of woodland
communities
Temperature - annual number of days
above 35ºC - increasing
3 5 8 1 17
Biodiversity Condition and extent of forest communities Temperature - annual median
maximum - increasing
4 5 9 2 17
Biodiversity Condition and extent of wetland ecosystems Rainfall - intensity - increasing 3 5 8 1 17
Biodiversity Condition and extent of wetland ecosystems Temperature - annual median
maximum - increasing
4 5 9 2 17
Biodiversity Condition and extent of wetland ecosystems Fire - annual number of severe fire
risk days - increasing
4 5 9 2 17
Emergency management Demand for emergency management
services
Temperature - annual number of days
above 40ºC - increasing
5 5 10 3 17
Emergency management Demand for emergency management
services
Fire - annual number of severe fire
risk days - increasing
4 5 9 2 17
Coastal management Condition and extent of marine habitats - sea
grass
Rainfall - intensity - increasing 3 5 8 1 17
Community health & well-
being
Community participation in clubs,
organisations and groups
Fire - annual number of severe fire
risk days - increasing
4 5 9 2 17

24
SECTOR INDICATOR CLIMATE VARIABLE E S PI AC V
Community health & well-
being
Health, safety and wellbeing of low income
households
Fire - annual number of severe fire
risk days - increasing
4 5 9 2 17
Community health & well-
being
Health, safety and wellbeing of low income
households
Sea level - increasing 4 5 9 2 17
Community health & well-
being
Health, safety and wellbeing of people with
disability
Temperature - annual number of days
above 40ºC - increasing
5 5 10 3 17
Community health & well-
being
Health, safety and wellbeing of vulnerable
members of the community (aged over 75)
Sea level - increasing 4 5 9 2 17
Community health & well-
being
Health, safety and wellbeing of vulnerable
members of the community (aged under 15)
Temperature - annual number of days
above 40ºC - increasing
5 4 9 2 17
Fisheries & aquaculture Productivity of land based aquaculture Temperature - annual number of days
above 40ºC - increasing
5 5 10 3 17
Manufacturing & services Regional economic contribution of the
construction sector
Temperature - annual number of days
above 40ºC - increasing
5 5 10 3 17

25
4 Discussion
4.1 Priority areas of vulnerability
The aim of the IVA is to identify features or systems in the region that are most vulnerable to
the impacts of climate change. In addition, the focus is to identify issues that are regional in
scale and where possible, impact multiple sectors. Understanding these priority areas of
vulnerability can then inform the focus of the adaptation plan. The IVA results suggest that
climate change will affect all sectors assessed in the Adelaide Hills and Fleurieu Peninsula,
but to differing degrees.
Sectors assessed to be most affected as a whole are those from the social and community,
and environment and natural resources domains. The prominence of community health and
well-being and biodiversity indicators reflects a prevailing view of these areas as having low
to very low adaptive capacity. This result has been echoed in other regions in South
Australia (e.g. Southern Metropolitan Adelaide, the South Australian Murray-Darling Basin).
Whether it reflects sector bias in some way (i.e. experts from a given sector consistently
scoring vulnerability higher or lower) can only be speculated on, but can be accounted for in
selecting key areas of decision making (Section 5.2) by ensuring a wide spread of sectors.
By considering both the average indicator scores, and combinations of indicators and
climate variables, the following areas of high vulnerability emerged from the analysis (in no
particular order):
1. Agricultural productivity, mostly in relation to horticulture, viticulture and dryland grazing 2. Condition of wetlands and riparian zone ecological communities 3. Condition of native vegetation (woodlands, forests, grasslands, scattered trees) 4. Condition of reefs and sea grass in marine habitats 5. Condition and extent of coastal zone ecological communities 6. Condition of public coastal assets 7. Health safety and well-being of vulnerable members of the community, defined as people
aged over 75 years and under 15 years, people with a disability, and people from low income households
8. Demand for emergency management services 9. Community participation in clubs, organisations and groups 10. Community services and facilities meet the needs of all community members 11. Condition and effective operation of public and privately owned buildings, including State
and local built heritage items and retail and commercial centres in towns 12. Effective operation of road network
As outlined in the results section, there were several climate variables that consistently led to
higher vulnerability scores, including extreme heat (annual days over 40ºC), fire risk, sea
level rise and to a lesser extent intense rainfall, with the latter two contributing to flood risk.
All of these variables relate to extreme climatic events and will create demand for
emergency management services, reflecting the importance of this issue as a cross sectoral
priority area of vulnerability.
Despite having higher vulnerability scores, not all of the areas identified above necessarily
need to be a focus for the adaptation plan. For example, they could relate to lower priority

26
issues, make only a small economic contribution to the region, could be localised in nature
or there may be a dearth of available adaptation options for them within the region.
The first high vulnerability area not recommended as a focus for the adaptation plan is land-
based aquaculture. This was assessed as having high vulnerability in relation to increasing
fire risk and extreme heat. The relatively small contribution that this sector makes to the
region’s economy means that while impacts may occur, it’s hard to see this area as a
regional priority. Adaptation options may still be pursued by businesses operating in this
industry but this can occur through working with research and development organisations
such as the South Australian Research & Development Institute.
The second high vulnerability area that does not need to be a focus of the adaptation plan is
the regional economic contribution of the construction sector. This area received a high
vulnerability score because of concerns about extreme heat impacts on working conditions.
Despite this, the average vulnerability score for the indicator was moderate and in the lower
25% of all vulnerability scores. This was because the construction sector will also likely
benefit from warmer and drier winters which will reduce the number of days off site during
cooler months and so offset potential lost days due to extreme heat. Another opportunity
which may offset negative impacts of climate change is that the construction sector may
benefit from continued population growth in the region, which is expected to underpin
continued expansion of residential housing as well as buildings and infrastructure at key
sites such as Victor Harbor, Goolwa and Mount Barker.
The third area of high vulnerability that does not require further detailed consideration in the
adaptation plan is the condition of reefs and sea grass in marine habitats. The high
vulnerability scores for these indicators were influenced by the risk of increasing rainfall
intensity, which could lead to increased turbidity either as a result of additional discharge
from creeks and rivers or as a consequence of run-off from cliffs. During the assessment
there was conjecture as to the extent to which this is a localised issue (e.g. confined to areas
in immediate proximity to the point of discharge) or whether it is mainly a consequence of
current land management practices and will not be exacerbated significantly by climate
change. It was also unclear whether winter-spring rainfall was a greater contributor to
discharges of highly turbid water or whether intense rainfall during summer was more
important. For these reasons this issue is not recommended as one of the priority areas of
vulnerability to focus on in the adaptation plan. However, monitoring may be warranted to
better understand the relationship between changing rainfall patterns, turbidity and the
condition of reefs and sea grass.
In addition to areas of high vulnerability, the IVA also identified areas with low vulnerability,
or, arguably, high resilience. This included a number of agriculture, water supply and tourism
related indicators. The reasons for the lower vulnerability scores differed, for example,
livestock production received low scores because despite the potential for declining
availability of feed it was determined that the climate of the Adelaide Hills and Fleurieu
Peninsula will still remain favourable for animal health compared to other parts of the State.
The regional economic contribution of the tourism sector on the other hand was considered
to have lower vulnerability because of the diversity of tourism experiences in the region and
because extreme heat and fire risk impacts during the summer period could be offset by
warmer and drier winters, which could directly benefit the region’s tourism economy.

27
4.2 Opportunities
Being a risk-based process, the IVA is not designed to identify opportunities and as such
these need to be considered separately. Whilst the region faces significant challenges in
adapting to climate change, it is better placed than many other regions in the State due to its
naturally cooler climate, and diversity of industries across the region. Another important
factor for the region is that the population is expected to grow further, especially in locations
such as Mount Barker, Victor Harbor and Goolwa.
These drivers present opportunities in responding to a changing climate. For example, the
preferable climate and increasing population could stimulate business activity such as in the
construction and service sectors. This could lead to opportunities such as:
encouraging the development of low carbon communities with housing that is
energy/water efficient and resilient to climate change;
incorporating “climate ready” design principles into new buildings and essential services
infrastructure; and
increasing interest in green infrastructure for residential developments.
4.3 Identifying key areas of decision making
Key areas of decision making describe the focus of an adaptation plan. They are typically
based on priority areas of vulnerability or emerging opportunities. A key area of decision
making should:
explain what is important for a region, making a connection between something of value
or importance to stakeholders such as an asset or service;
identify what responses are possible; and
describe how the important aspects could be impacted by climate change.
For RH&C, additional research conducted by AMLR NRM independently of this project was
also taken into consideration in developing the key areas of decision making. This
independent research (DEWNR, 2015) was relevant for informing key areas of decision
making related to biodiversity and summarises the vulnerability of different aspects of natural
landscapes in the region using a landscape scenario assessment.
Based on the results of the IVA together with consideration of emerging opportunities and
the results of the AMLR NRM landscape scenario assessment, the following key areas of
decision making are proposed as the basis for further adaptation planning:
1. How do we maintain agricultural productivity and water security, especially for horticulture, viticulture and dryland grazing, given projected declines in rainfall and increasing temperature?
2. How do we protect water-dependent ecosystems given projected declines in rainfall and increasing temperature and fire risk?
3. How do we maintain the condition of natural landscapes (plains, flanks, uplands) given
projected declines in rainfall and increasing temperature and fire risk?

28
4. How do we maintain the condition and extent of sedimentary coastal ecosystems given projected increases in sea levels?
5. How do we maintain the condition of public coastal assets given projected increases in
sea levels?
6. How do we enhance the health, safety and well-being of vulnerable members of the community as the risk of extreme events such as fire, extreme heat, flash flooding and sea level rise related coastal inundation increases?
7. How do we respond to the growing demand for emergency management services across
multiple sectors as the risk of extreme events such as fire, extreme heat, flash flooding and sea level rise related coastal inundation increases?
8. How do we maintain and expand community facilities and open space areas for sport
and recreation to meet growing community demand given projected declines in rainfall and increasing temperature and fire risk?
9. How do we maintain and expand infrastructure assets, such as roads and energy
networks, given projected declines in rainfall and increasing temperature and fire risk?
10. How do we maintain the condition of existing homes and buildings (public and private) and enhance their effective operation as the risk of extreme events such as fire, extreme heat, flash flooding and sea level rise related coastal inundation increases?
4.4 Next steps
This report has presented the consolidated results of the IVA conducted for Stage 2 of the
Resilient Hills and Coasts project. It was informed by the outputs of Stage 1, which included
a knowledge audit (Resilient Hills and Coasts, 2014b) and climate projections analysis
(Resilient Hills and Coasts, 2015). The report has outlined a clear list of priority key areas of
decision making relevant to the Adelaide Hills and Fleurieu Peninsula. When combined with
the results of the Kangaroo Island IVA, they will form a consolidated set of focal areas for
adaptation planning across the RH&C region.
The next stage of the RH&C project will focus on using a series of stakeholder forums to
identify, assess and prioritise adaptation options. The focus of identifying and assessing
adaptation options will be in relation to each of the key areas of decision making described in
Section 4.2. This will be undertaken at each forum by groups of subject matter experts and
key stakeholders with knowledge of and an interest in each of the key areas of decision
making. Assessment will include consideration of when options need to be implemented,
noting that as the impacts of climate change increase in the future, some options will no
longer be required and new options will need to commence.
The prioritisation of options, which will occur after the forums, will consider which options are
relevant to current funding opportunities, regional priorities (risk and opportunity based) and
what is best coordinated and implemented at a whole of region versus local scale.
29
5 References Allen Consulting Group, 2005. Climate Change Risk and Vulnerability, Canberra: Allen
Consulting Group.
DEWNR, 2015. Landscape Scenario Assessment for Biodiveristy , South Australia: DEWNR.
IPCC, 2013. Summary for policymakers. In: T. F. Stocker, et al. eds. Climate change 2013:
the physical science basis. Contribution of Working group I to the fifth assessment report of
the intergovernmental panel on climate change. Cambridge, United Kingdom and New York,
NY, USA: Cambridge University Press.
Local Government Association of South Australia, 2014. Climate Adaptation Planning
Guidelines, South Australia: LGA SA.
RDA Adelaide Hills, Fleurieu & Kangaroo Island, 2014. [Online] Available at:
http://rdahc.com.au/ [Accessed 2014].
Resilient Hills and Coasts, 2014a. Integrated Vulnerability Assessment for Kangaroo Island.,
South Australia: Prepared by Seed Consulting Services for Natural Resources Kangaroo
Island.
Resilient Hills and Coasts, 2014b. Knowledge audit for the Adelaide Hills, Fleurieu and
Kangaroo Island RDA Climate Change Adaptation Plan, South Australia: Prepared by Seed
Consulting Services and URPS as part of the Resilient Hills and Coasts cosultancy led by
Seed Consulting Services for Regional Development Australia Adelaide Hills, Flerieu and
Kangaroo Island.
Resilient Hills and Coasts, 2015. Climate Change Projections for the Adelaide Hills, Fleurieu
Peninsula and Kangaroo Island, South Australia: A report prepared for Alexandrina Council
on behalf of project partners by Seed Consulting Services.
Resilient South, 2014. Climate Change Risks, Opportunities and Vulnerabilities in the
Southern Region, prepared by URPS and Seed Consulting Services as part of the Resilient
South consultancy led by URPS, South Australia: for the Cities of Onkaparinga, Holdfast
Bay, Marion and Mitcham in association with the Government of South Australia and the
Australian Government.
Stafford Smith, M., Horrocks, L., Harvey, A. & Hamilton, C., 2010. Rethinking adaptation for
a 4°C world. Philosophical Transactions of the Royal Society of America, Volume 369, pp.
196-216.

30
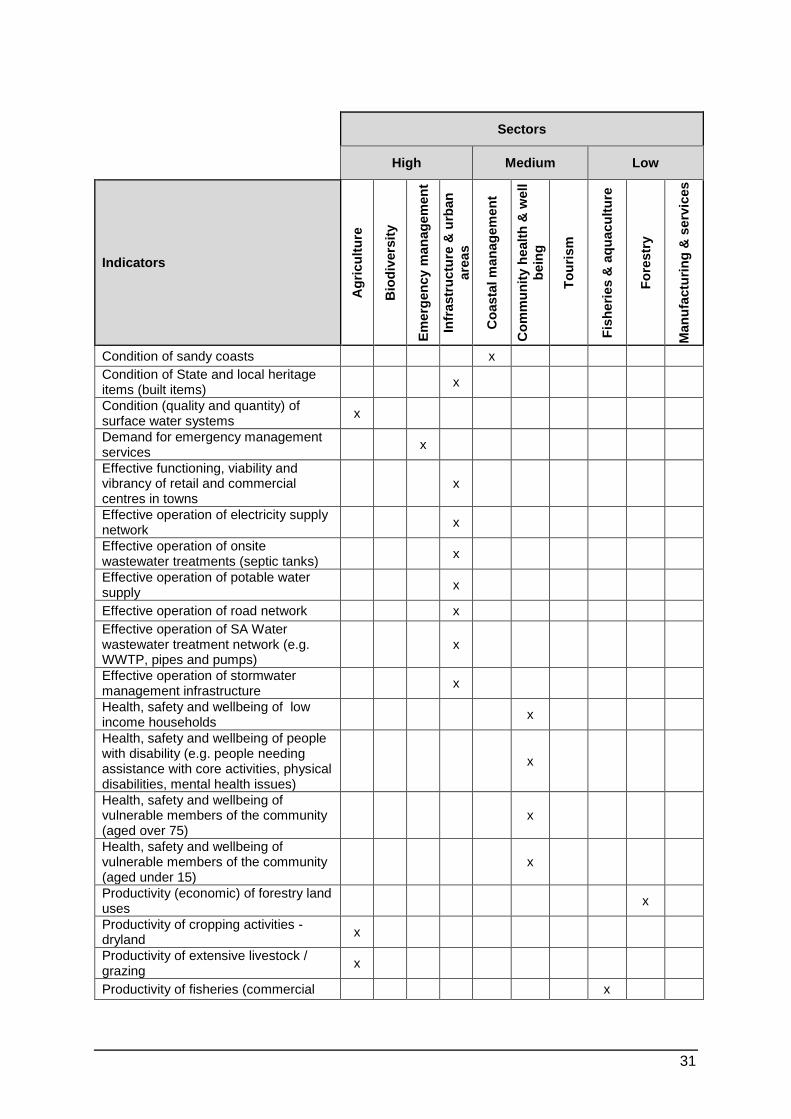
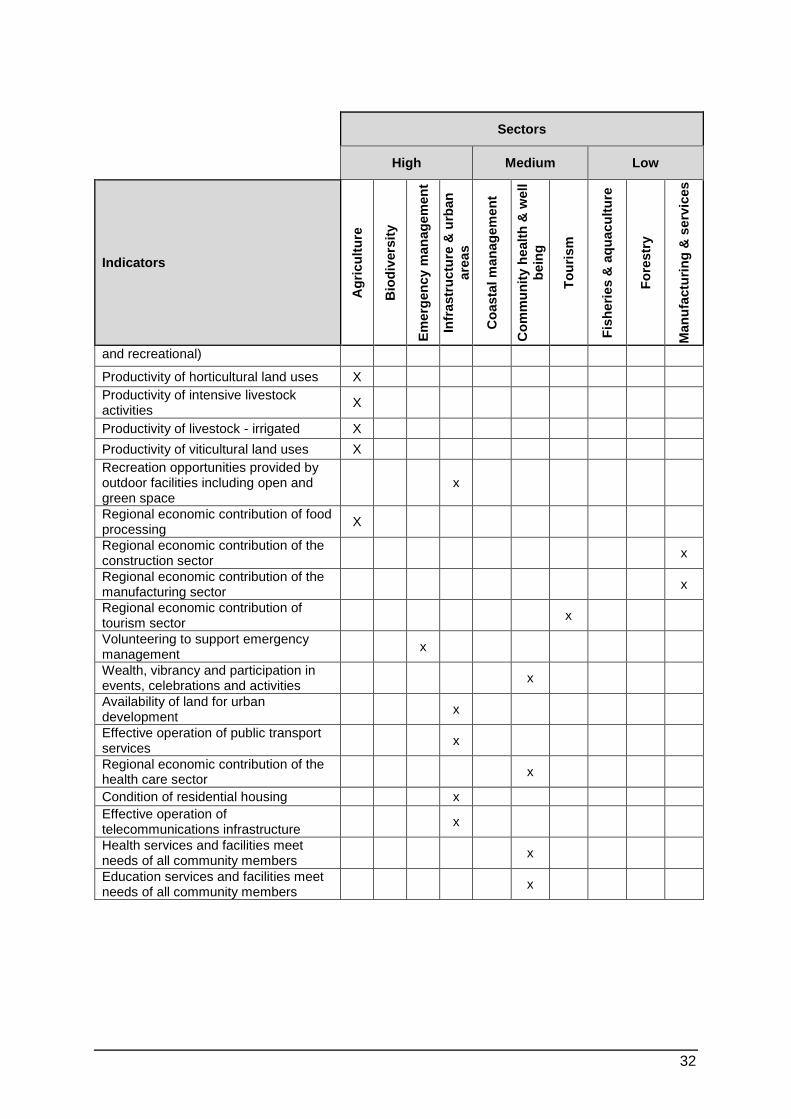
Appendix A - Indicators used for IVA Indicators used for the Adelaide Hills and Fleurieu component of the Resilient Hills and
Coasts Integrated Vulnerability Assessment. An “x” indicates which of the sectors the
indicator was chosen to represent. While not marked as such, many of the indicators are
relevant to multiple sectors.
Sectors
High Medium Low
Indicators
Ag
ricu
ltu
re
Bio
div
ers
ity
Em
erg
en
cy m
an
ag
em
en
t
Infr
astr
uctu
re &
urb
an
are
as
Co
asta
l m
an
ag
em
en
t
Co
mm
un
ity h
ealt
h &
well
bein
g
To
uri
sm
Fis
heri
es &
aq
uacu
ltu
re
Fo
restr
y
Man
ufa
ctu
rin
g &
se
rvic
es
Amenity and character provided by open space and public realm
x
Capacity of landholders to actively undertake sustainable natural resource management
x
Community participation in clubs, organisations and groups
x
Community services and facilities (incl. health and education) meet needs of all community members
x
Condition and (natural) recruitment of scattered trees
x
Condition and extent of riparian zone communities
x
Condition and extent of coastal zone communities
x
Condition and extent of grassland communities
x
Condition and extent of woodland communities
x
Condition and extent of forest communities
x
Condition and extent of marine habitats - sea grass
x
Condition and extent of wetland ecosystems
x
Condition of Aboriginal heritage items and places
x
Condition of ground water systems x
Condition of marine habitats - reef areas (off shore and intertidal)
x
Condition of public coastal assets (e.g. jetties, boat ramps)
x
31
Sectors
High Medium Low
Indicators
Ag
ricu
ltu
re
Bio
div
ers
ity
Em
erg
en
cy m
an
ag
em
en
t
Infr
astr
uctu
re &
urb
an
are
as
Co
asta
l m
an
ag
em
en
t
Co
mm
un
ity h
ealt
h &
well
bein
g
To
uri
sm
Fis
heri
es &
aq
uacu
ltu
re
Fo
restr
y
Man
ufa
ctu
rin
g &
se
rvic
es
Condition of sandy coasts x
Condition of State and local heritage items (built items)
x
Condition (quality and quantity) of surface water systems
x
Demand for emergency management services
x
Effective functioning, viability and vibrancy of retail and commercial centres in towns
x
Effective operation of electricity supply network
x
Effective operation of onsite wastewater treatments (septic tanks)
x
Effective operation of potable water supply
x
Effective operation of road network x
Effective operation of SA Water wastewater treatment network (e.g. WWTP, pipes and pumps)
x
Effective operation of stormwater management infrastructure
x
Health, safety and wellbeing of low income households
x
Health, safety and wellbeing of people with disability (e.g. people needing assistance with core activities, physical disabilities, mental health issues)
x
Health, safety and wellbeing of vulnerable members of the community (aged over 75)
x
Health, safety and wellbeing of vulnerable members of the community (aged under 15)
x
Productivity (economic) of forestry land uses
x
Productivity of cropping activities - dryland
x
Productivity of extensive livestock / grazing
x
Productivity of fisheries (commercial x
32
Sectors
High Medium Low
Indicators
Ag
ricu
ltu
re
Bio
div
ers
ity
Em
erg
en
cy m
an
ag
em
en
t
Infr
astr
uctu
re &
urb
an
are
as
Co
asta
l m
an
ag
em
en
t
Co
mm
un
ity h
ealt
h &
well
bein
g
To
uri
sm
Fis
heri
es &
aq
uacu
ltu
re
Fo
restr
y
Man
ufa
ctu
rin
g &
se
rvic
es
and recreational)
Productivity of horticultural land uses X
Productivity of intensive livestock activities
X
Productivity of livestock - irrigated X
Productivity of viticultural land uses X
Recreation opportunities provided by outdoor facilities including open and green space
x
Regional economic contribution of food processing
X
Regional economic contribution of the construction sector
x
Regional economic contribution of the manufacturing sector
x
Regional economic contribution of tourism sector
x
Volunteering to support emergency management
x
Wealth, vibrancy and participation in events, celebrations and activities
x
Availability of land for urban development
x
Effective operation of public transport services
x
Regional economic contribution of the health care sector
x
Condition of residential housing x
Effective operation of telecommunications infrastructure
x
Health services and facilities meet needs of all community members
x
Education services and facilities meet needs of all community members
x


