Confidence Interval
Assignment # 2
Briefly describe following with the help of examples: Point Estimation of Parameters Confidence Intervals Students’ t Distribution Chi Square Distribution Testing of Hypothesis
Hand Written assignments be submitted by 20 Dec 2012.
Copying and Late Submissions will have appropriate penalty.
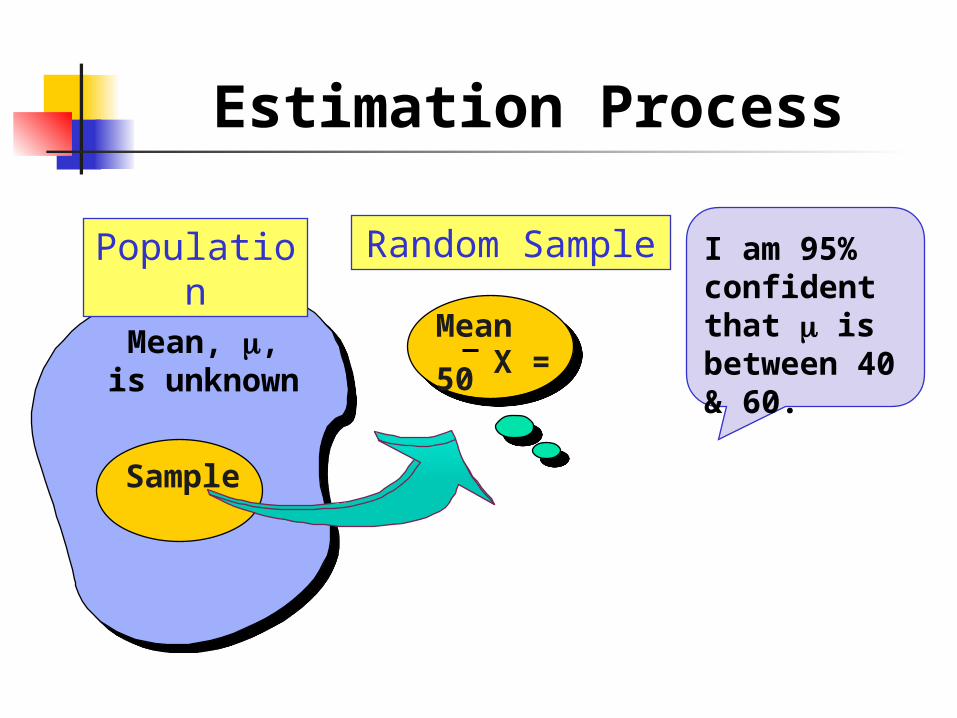
Estimation Process
Mean, , is unknown
Population Random SampleMean X = 50
Sample
I am 95% confident that is between 40 & 60.

Confidence Interval provides more information about a population characteristic than does a point estimate. It provides a confidence level for the estimate.
Point Estimate
Lower Confidence Limit
Width of
Confidence Interval
Upper
Confidence
Limit

Interval Estimates
Provides range of values Takes into consideration variation in
sample statistics from sample to sample Is based on observation from one sample Gives information about closeness to
unknown population parameters Is stated in terms of level of confidence Never 100% certain
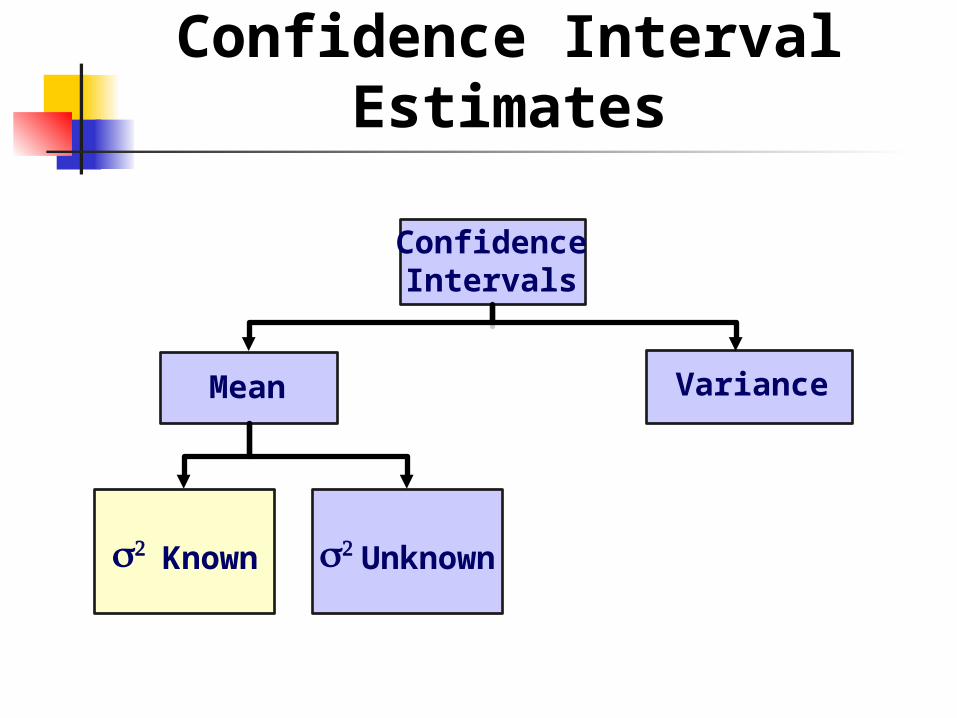
Confidence Interval Estimates
Mean
2 Unknown
ConfidenceIntervals
Variance
2 Known

Confidence Interval for µ( б2 Known)
Assumptions Population standard deviation is
known Population is normally distributed If population is not normal, use
large sample Confidence interval estimate
n
ckwherekxkxConf
..)..(

Steps to Determine Confidence Interval
Choose a Confidence Level γ (95%, 90%, etc) Determine the corresponding c [ Z(D) ]
Compute the mean x of the sample x1, x2,…, xn
Confidence interval estimate
n
ckwherekxkxConf
..)..(
γ 0.90 0.95 0.99 0.999
C 1.645 1.960 2.576 3.291
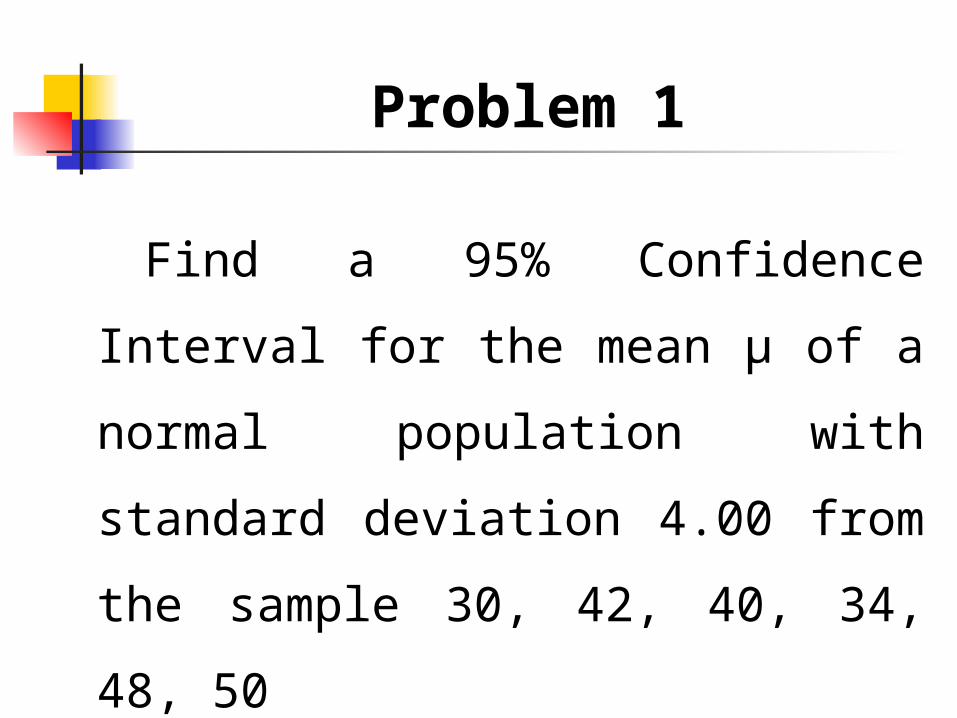
Problem 1
Find a 95% Confidence Interval
for the mean µ of a normal
population with standard
deviation 4.00 from the sample
30, 42, 40, 34, 48, 50
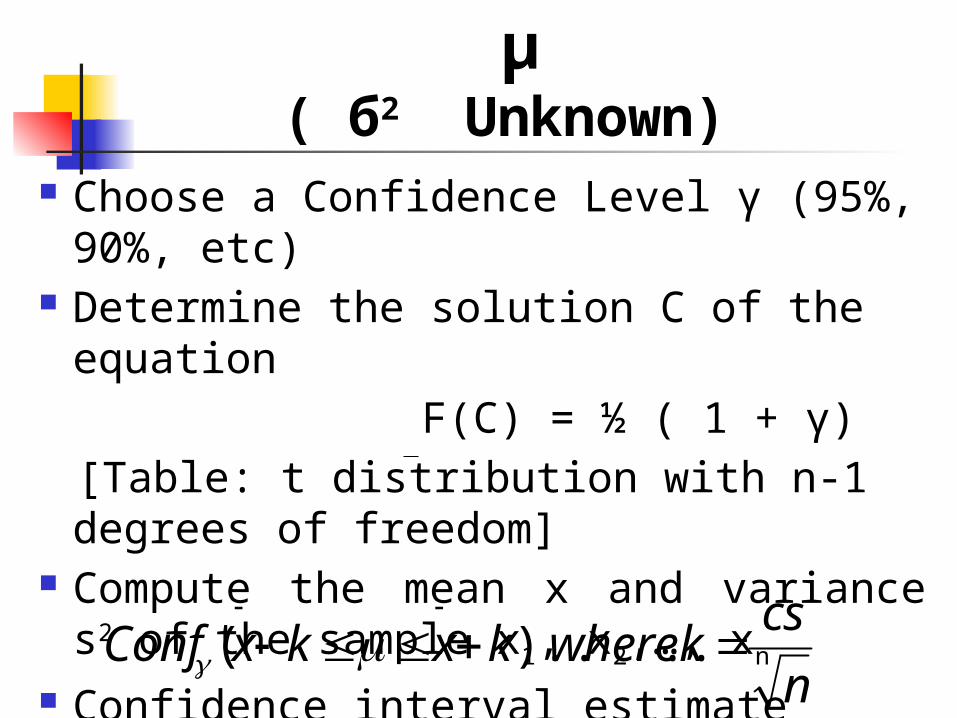
Confidence Interval for µ( б2 Unknown)
Choose a Confidence Level γ (95%, 90%, etc) Determine the solution C of the equation
F(C) = ½ ( 1 + γ)
[Table: t distribution with n-1 degrees of freedom] Compute the mean x and variance s2 of the
sample x1, x2,…, xn
Confidence interval estimate
n
cskwherekxkxConf
..)..(
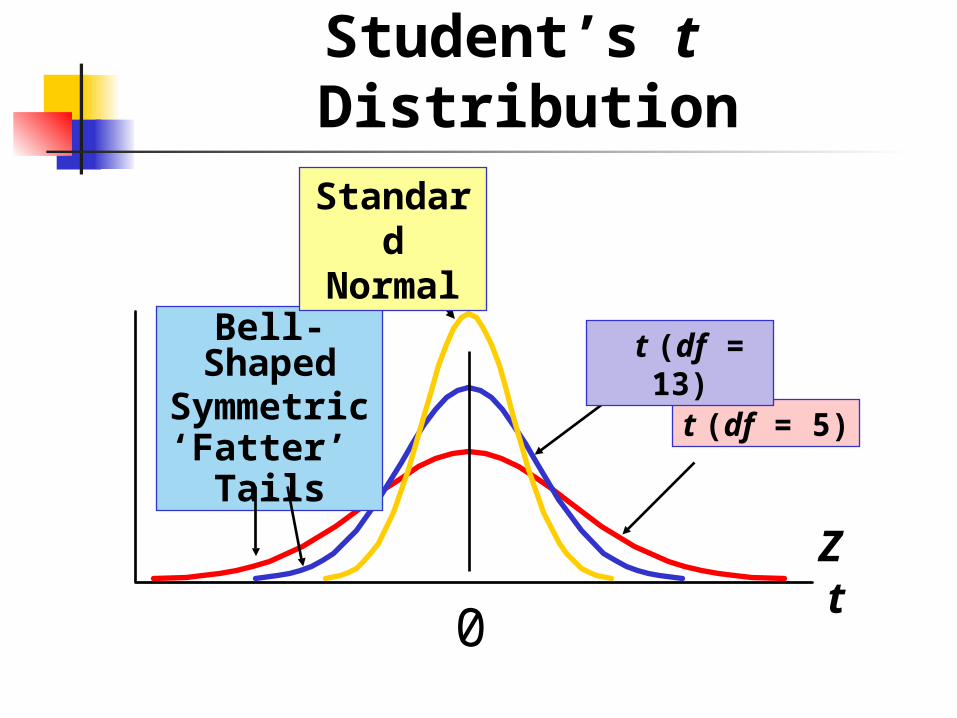
Student’s t Distribution
Zt
0
t (df = 5)
t (df = 13)Bell-ShapedSymmetric
‘Fatter’ Tails
Standard Normal
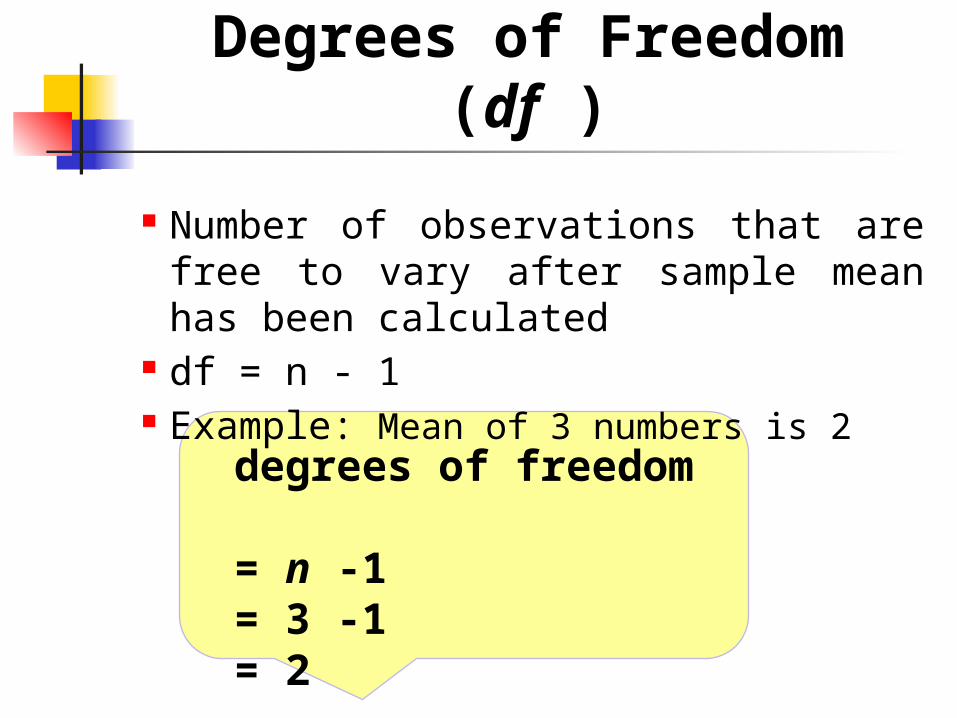
Degrees of Freedom (df )
Number of observations that are free to vary after sample mean has been calculated
df = n - 1 Example: Mean of 3 numbers is 2
degrees of freedom = n -1 = 3 -1= 2

Student’s t Distribution
Let X1, X2,…, Xn be independent random variables with the same mean µ and the same variance б2. Then, the random variable
has a t distribution with n-1 degrees of freedom
nS
xT
/
2
1
2 )(1
1
XXn
Sn
jj

Student’s t Table
Upper Tail Area
df .25 .10 .05
1 1.000 3.078 6.314
2 0.817 1.886 2.920
3 0.765 1.638 2.353
t0 2.920t Values
Let: n = 3 df = n - 1 = 2 = .10 /2 =.05
/ 2 = .05

Problem 1
Find a 95% Confidence Interval
for the mean µ of a normal
population with standard
deviation 4.00 from the sample
30, 42, 40, 34, 48, 50
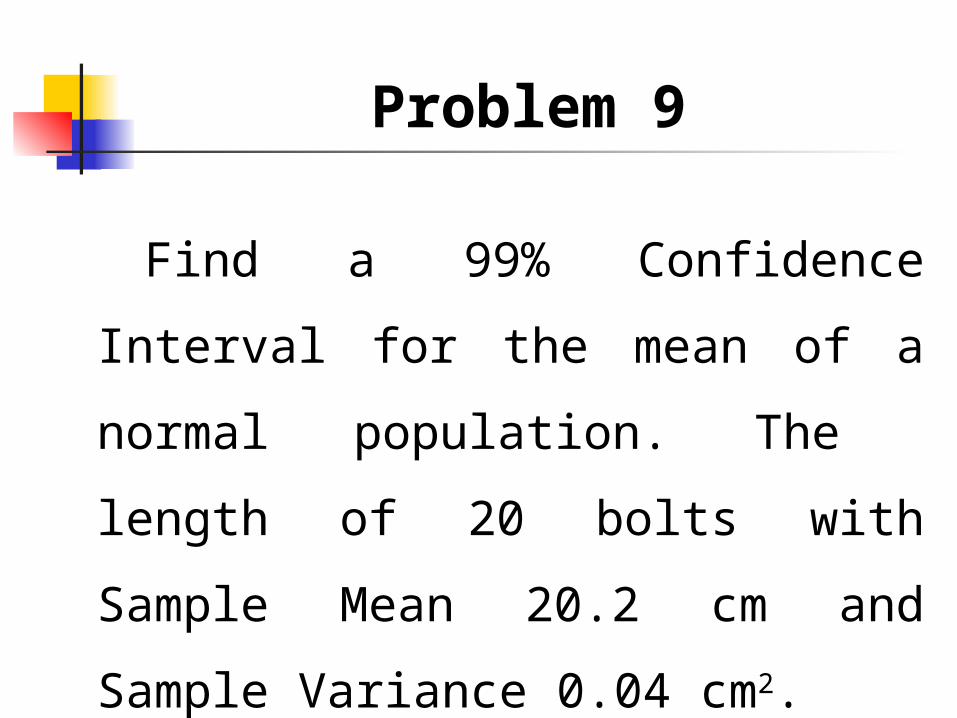
Problem 9
Find a 99% Confidence Interval
for the mean of a normal
population. The length of 20 bolts
with Sample Mean 20.2 cm and
Sample Variance 0.04 cm2.

Confidence Interval for the Variance
Choose a Confidence Level γ (95%, 90%, etc) Determine the solutions C1 and C2 of the equation
F(C1) = ½ ( 1 - γ) and F(C2) = ½ ( 1 + γ)
[Table A10: Chi Square distribution with n-1 degrees of freedom]
Compute (n-1)S2, where S2 is the variance of the sample x1, x2,…, xn
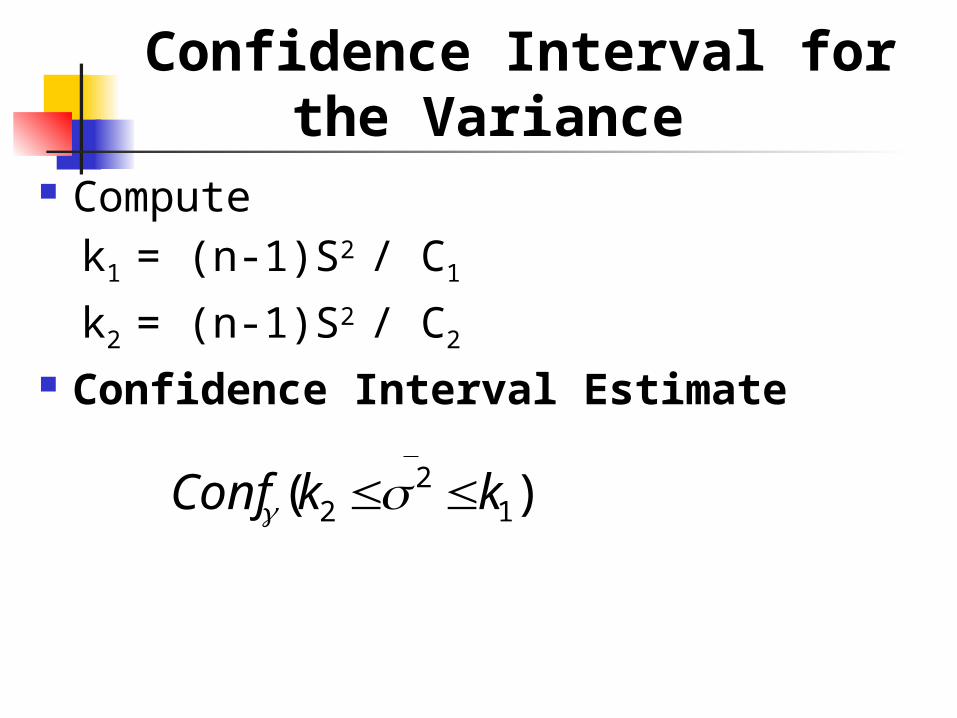
Confidence Interval for the Variance
Compute
k1 = (n-1)S2 / C1
k2 = (n-1)S2 / C2
Confidence Interval Estimate
)( 12
2 kkConf

Chi Square Distribution
Let X1, X2,…, Xn be independent random variables with the same mean µ and the same variance б2. Then, the random variable
With
2
2
)1(
Sn
2
1
2 )(1
1
XXn
Sn
jj
has a Chi Square distribution with n-1 degrees of freedom

Chi Square Distribution
CDF
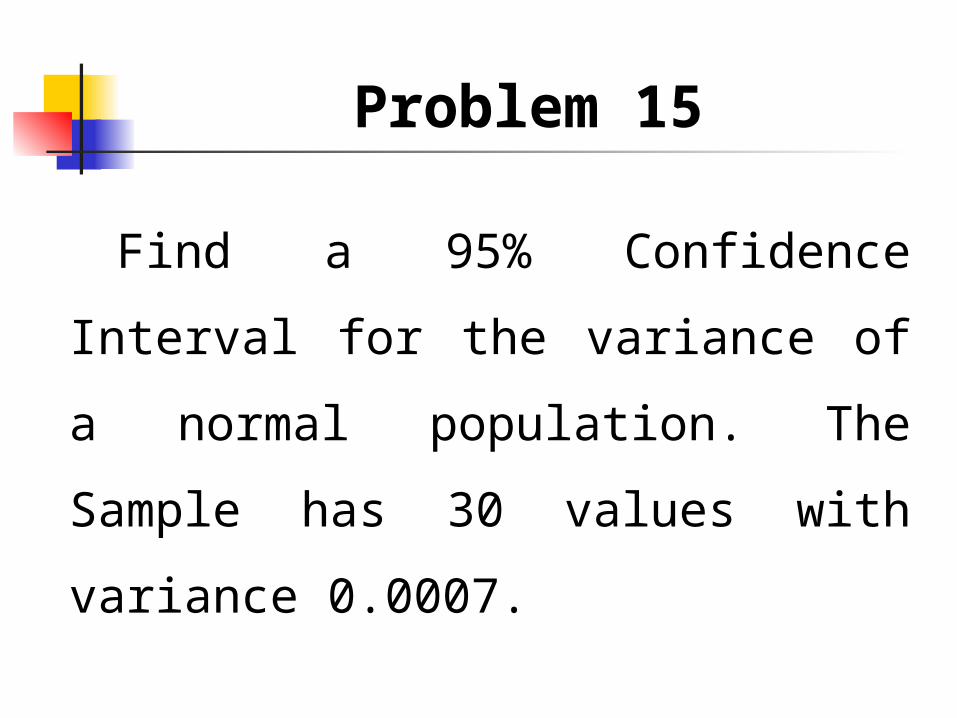
Problem 15
Find a 95% Confidence Interval
for the variance of a normal
population. The Sample has 30
values with variance 0.0007.
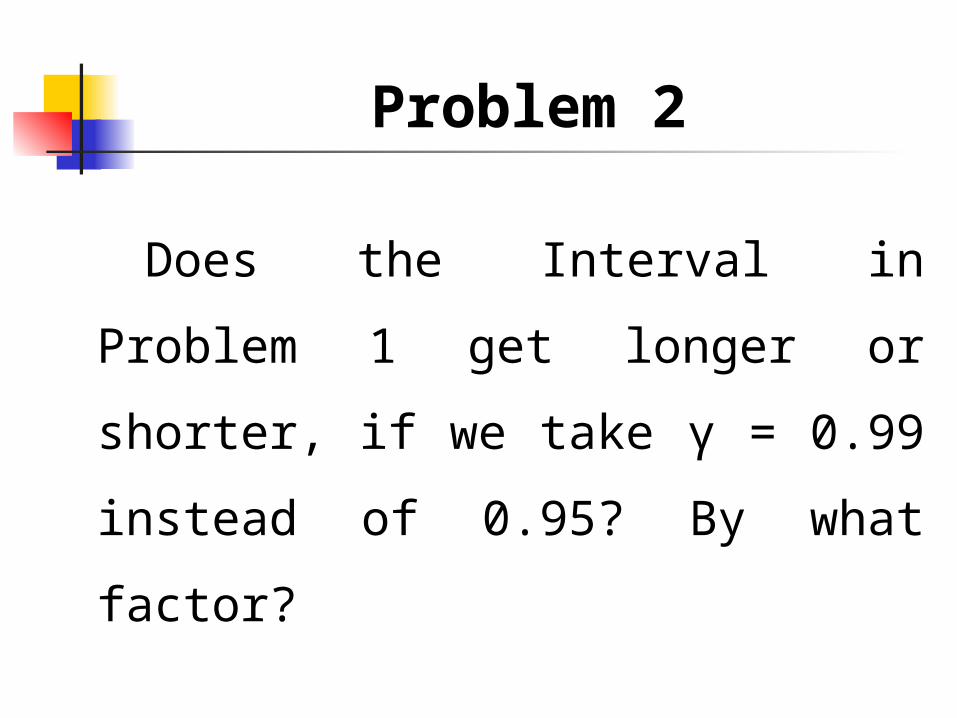
Problem 2
Does the Interval in Problem 1
get longer or shorter, if we take γ
= 0.99 instead of 0.95? By what
factor?
Problem 3
By what factor does the length
of the Interval in Problem 1
change, if we double the Sample
Size?

Problem 5
What Sample Size would be
needed for obtaining a 95%
Confidence Interval (3) of length 2
б? Of length б?
Problem 7
What Sample Size is needed to
obtain a 99% Confidence Interval
of length 2.0 for the mean of a
normal population with variance
25?

Problem 9
Find a 99% Confidence Interval
for the mean of a normal
population. The length of 20 bolts
with Sample Mean 20.2 cm and
Sample Variance 0.04 cm2.

Problem 11
Find a 99% Confidence Interval
for the mean of a normal
population. The Copper Content
(%) of brass is
66, 66, 65, 64, 66, 67, 64, 65, 63,
64

Problem 13
Find a 95% Confidence Interval for the percentage of cars on a certain highway that have poorly adjusted brakes, using a random sample of 500 cars stopped at a road block on a highway, 87 of which had poorly adjusted brakes.
Problem 17
Find a 95% Confidence Interval
for the variance of a normal
population. The Sample is the
Copper Content (%) of brass:
66, 66, 65, 64, 66, 67, 64, 65,
63, 64

Problem 19
Find a 95% Confidence Interval
for the variance of a normal
population. The Sample has Mean
Energy (keV) of delayed neutron
group (Group 3, half life 6.2 sec)
for uranium U235 fission:
435, 451, 430, 444, 438
Problem 21
If X is normal with mean 27 and
variance 16, what distribution do –
X, 3X and 5X-2 have?
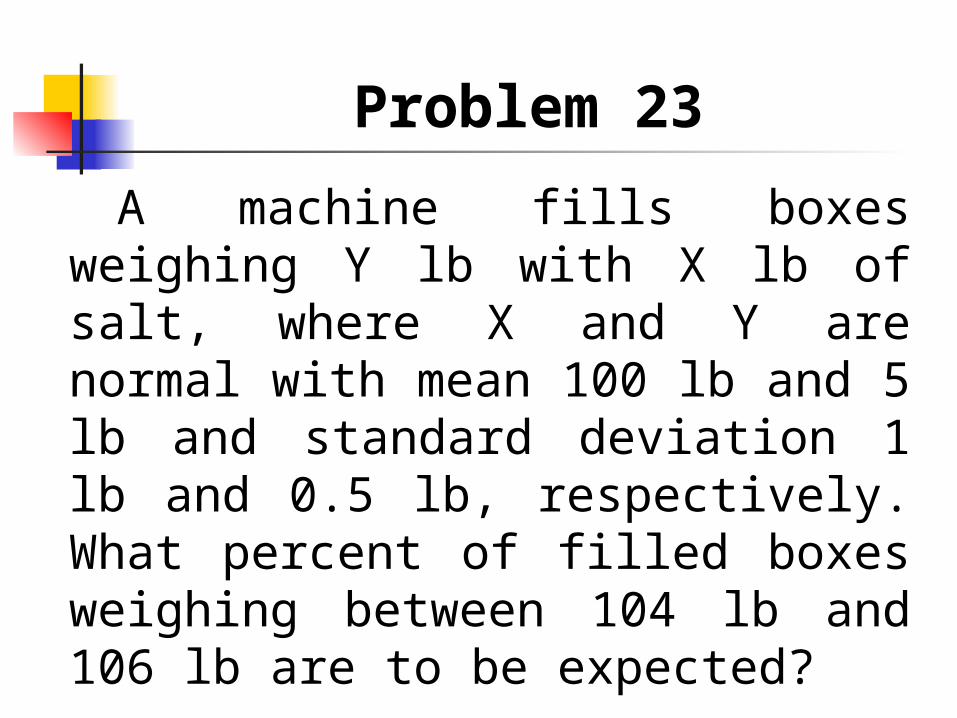
Problem 23
A machine fills boxes weighing Y lb with X lb of salt, where X and Y are normal with mean 100 lb and 5 lb and standard deviation 1 lb and 0.5 lb, respectively. What percent of filled boxes weighing between 104 lb and 106 lb are to be expected?
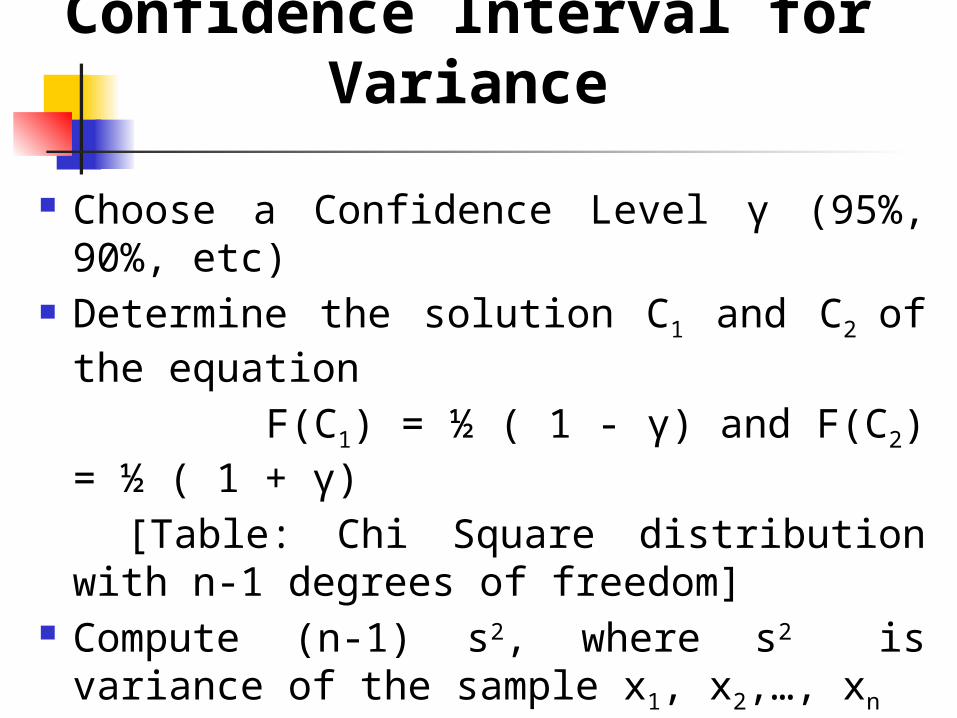
Confidence Interval for Variance
Choose a Confidence Level γ (95%, 90%, etc) Determine the solution C1 and C2 of the equation
F(C1) = ½ ( 1 - γ) and F(C2) = ½ ( 1 + γ)
[Table: Chi Square distribution with n-1 degrees of freedom]
Compute (n-1) s2, where s2 is variance of the sample x1, x2,…, xn

Confidence Interval for Variance
Compute k1 = (n-1) s2/C1
and k2 = (n-1) s2/C2
Confidence interval estimate
)( 12
2 kkConf

Elements of Confidence Interval
Estimation
Level of confidence Confidence in which the interval will
contain the unknown population parameter
Precision (range) Closeness to the unknown parameter
Cost Cost required to obtain a sample of
size n
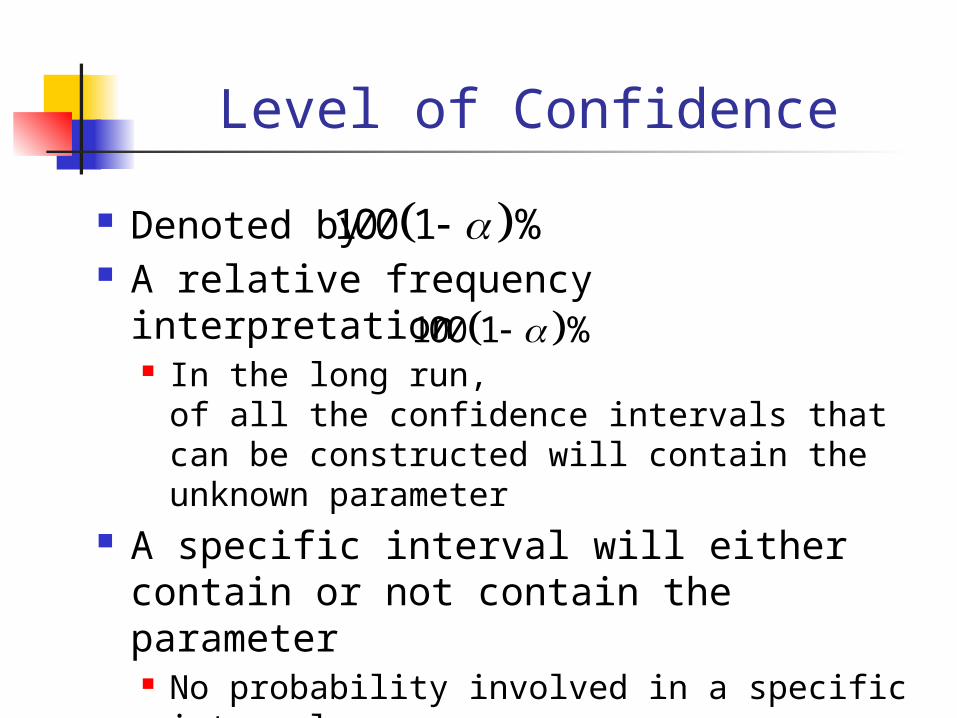
Level of Confidence
Denoted by A relative frequency interpretation
In the long run, of all the confidence intervals that can be constructed will contain the unknown parameter
A specific interval will either contain or not contain the parameter No probability involved in a specific interval
100 1 %
100 1 %
Chap 7-Confidence Intervals-
37
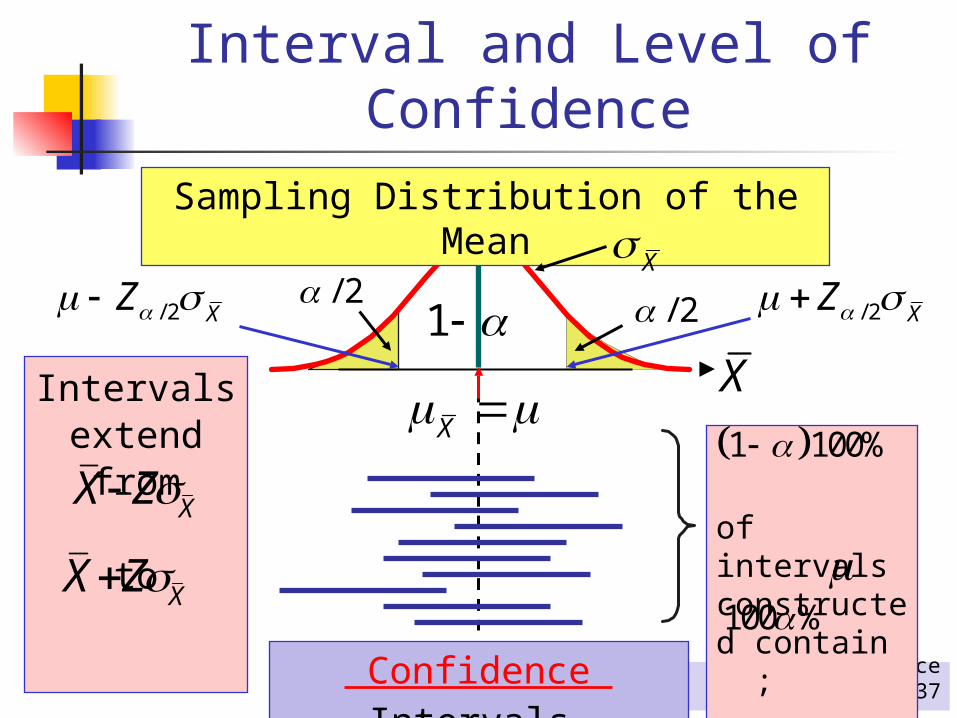
Interval and Level of Confidence
Confidence Intervals
Intervals extend from
to
of intervals constructed contain ;
do not.
_Sampling Distribution of the Mean
XX Z
X/ 2
/ 2
XX
1
XX Z
1 100%
100 %
/ 2 XZ / 2 XZ
Chap 7-Confidence Intervals-
38
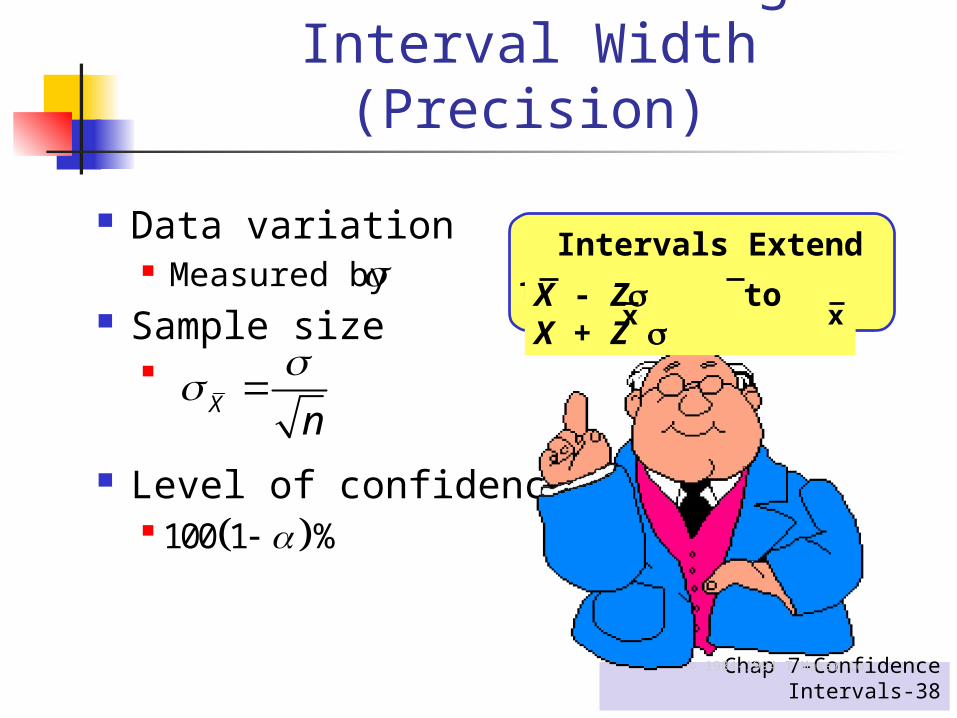
Factors Affecting Interval Width (Precision)
Data variation Measured by
Sample size
Level of confidence
Intervals Extend from
© 1984-1994 T/Maker Co.
X - Z to X + Z xx
Xn
100 1 %
Chap 7-Confidence Intervals-
39
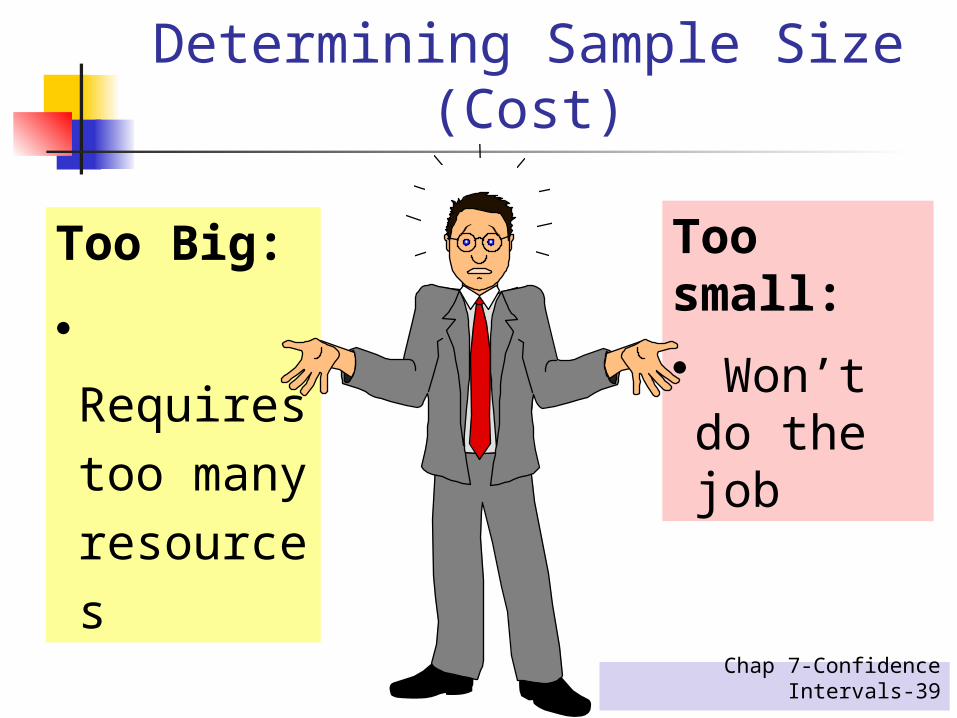
Determining Sample Size (Cost)
Too Big:
• Requires too many resources
Too small:
• Won’t do the job

Chap 7-Confidence Intervals-
40
Determining Sample Size for Mean
What sample size is needed to be 90% confident of being correct within ± 5? A pilot study suggested that the standard deviation is 45.
Round Up
2 22 2
2 2
1.645 45219.2 220
Error 5
Zn

Chap 7-Confidence Intervals-
41
Determining Sample Size for Mean in PHStat
PHStat | sample size | determination for the mean …
Example in excel spreadsheet

Chap 7-Confidence Intervals-
42
Assumptions Population standard deviation is unknown Population is normally distributed If population is not normal, use large sample
Use student’s t distribution Confidence interval estimate
Confidence Interval for( Unknown)
/ 2, 1 / 2, 1n n
S SX t X t
n n

Chap 7-Confidence Intervals-
43
Example
/ 2, 1 / 2, 1
8 850 2.0639 50 2.0639
25 2546.69 53.30
n n
S SX t X t
n n
A random sample of 25 has 50 and 8.
Set up a 95% confidence interval estimate for
n X S

Chap 7-Confidence Intervals-
44
Confidence Interval Estimate for Proportion p
Assumptions Two outcomes (0;1) Number of ‘1’ in n trials follows B(n,p) Normal approximation can be used if
and Confidence interval estimate
5np 1 5n p
/ 2 / 2
1 1S S S SS S
p p p pp Z p p Z
n n
Chap 7-Confidence Intervals-
45
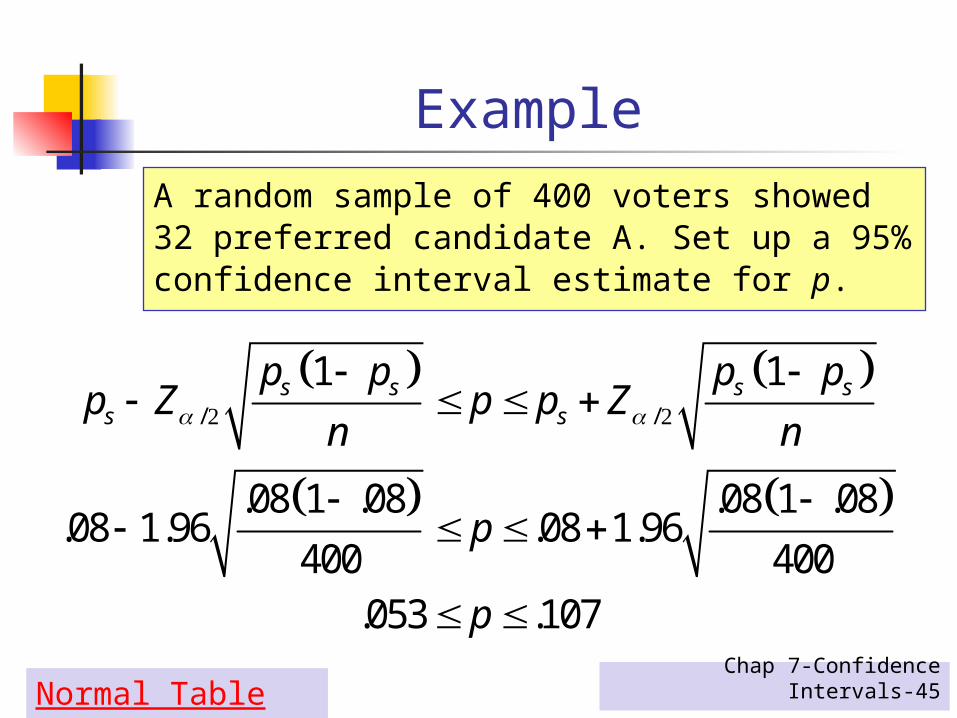
ExampleA random sample of 400 voters showed 32 preferred candidate A. Set up a 95% confidence interval estimate for p.
/ /
1 1
.08 1 .08 .08 1 .08.08 1.96 .08 1.96
400 400.053 .107
s s s ss s
p p p pp Z p p Z
n n
p
p
2 2
Normal Table

Chap 7-Confidence Intervals-
46
Confidence Interval Estimate for Proportion in PHStat
PHStat | confidence interval | estimate for the proportion …
Example in excel spreadsheet
Microsoft Excel Worksheet
Chap 7-Confidence Intervals-
47
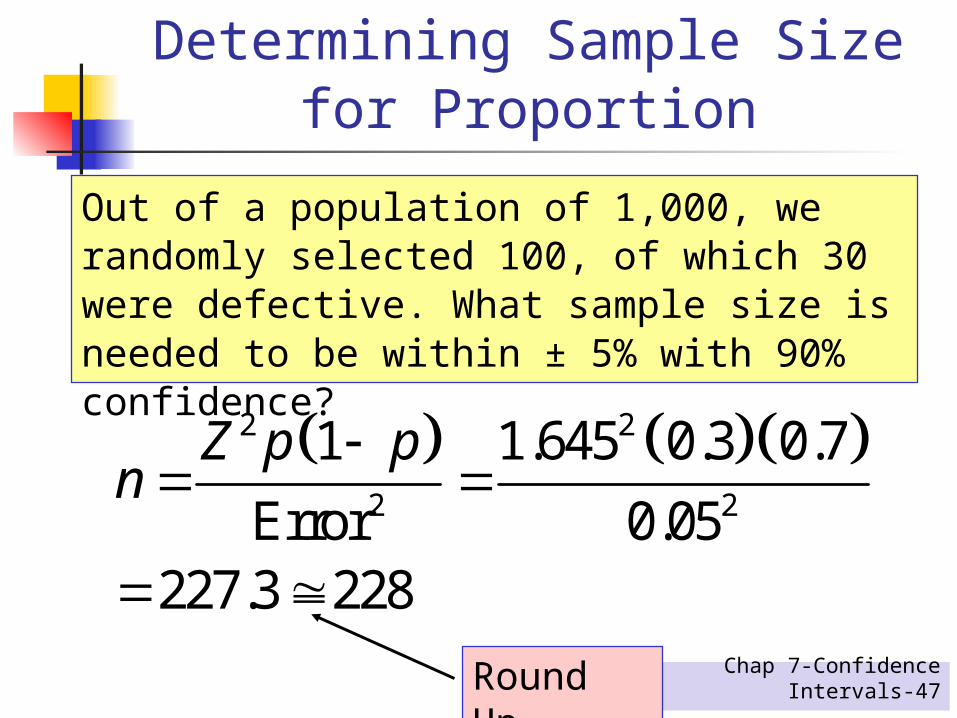
Determining Sample Size for Proportion
Out of a population of 1,000, we randomly selected 100, of which 30 were defective. What sample size is needed to be within ± 5% with 90% confidence?
Round Up
2 2
2 2
1 1.645 0.3 0.7
Error 0.05227.3 228
Z p pn

Chap 7-Confidence Intervals-
48
Determining Sample Size for Proportion in PHStat
PHStat | sample size | determination for the proportion …
Example in excel spreadsheet
Microsoft Excel Worksheet

Chap 7-Confidence Intervals-
49
Confidence Interval for Population Total Amount
Point estimate
Confidence interval estimate
NX
/ 2, 1 1n
N nSNX N t
Nn
Chap 7-Confidence Intervals-
50
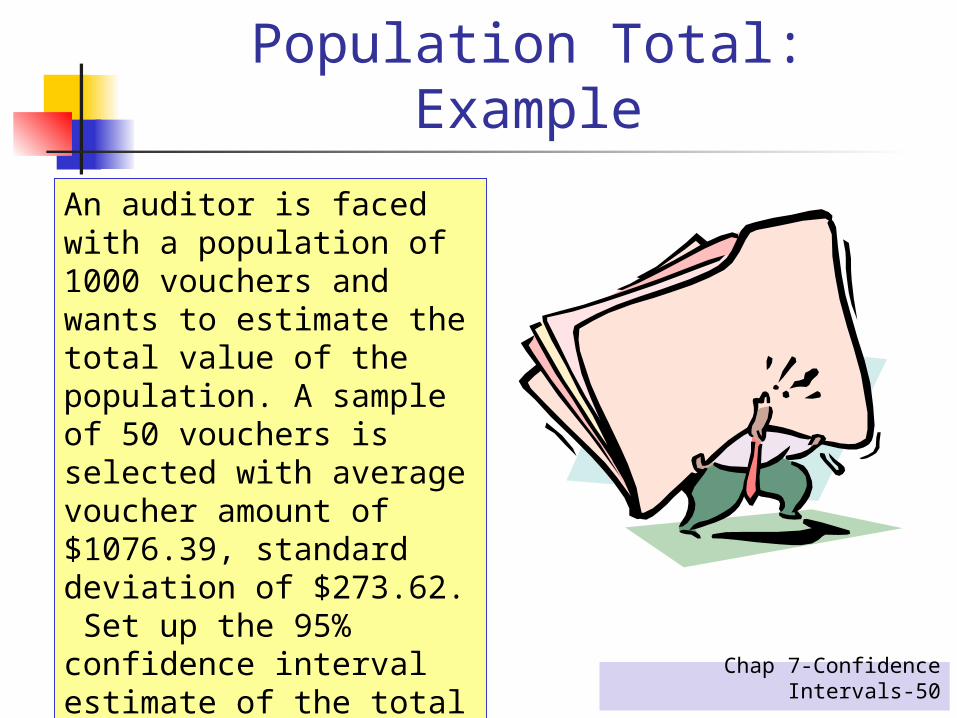
Confidence Interval for Population Total: Example
An auditor is faced with a population of 1000 vouchers and wants to estimate the total value of the population. A sample of 50 vouchers is selected with average voucher amount of $1076.39, standard deviation of $273.62. Set up the 95% confidence interval estimate of the total amount for the population of vouchers.
Chap 7-Confidence Intervals-
51
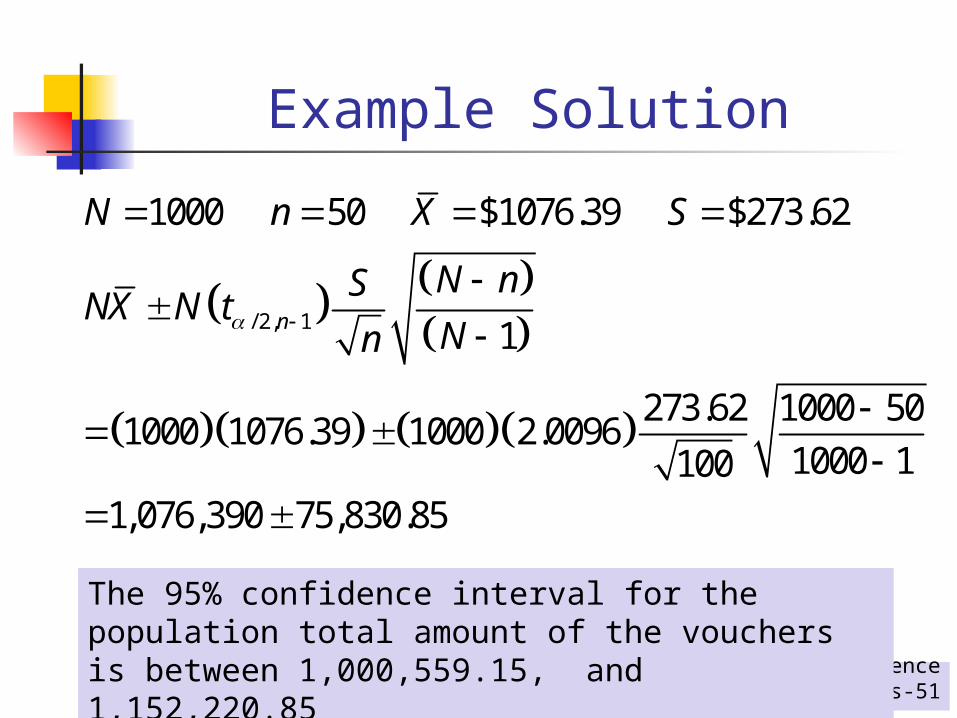
Example Solution
/ 2, 1
1000 50 $1076.39 $273.62
1
273.62 1000 501000 1076.39 1000 2.0096
1000 11001,076,390 75,830.85
n
N n X S
N nSNX N t
Nn
The 95% confidence interval for the population total amount of the vouchers is between 1,000,559.15, and 1,152,220.85
Chap 7-Confidence Intervals-
52
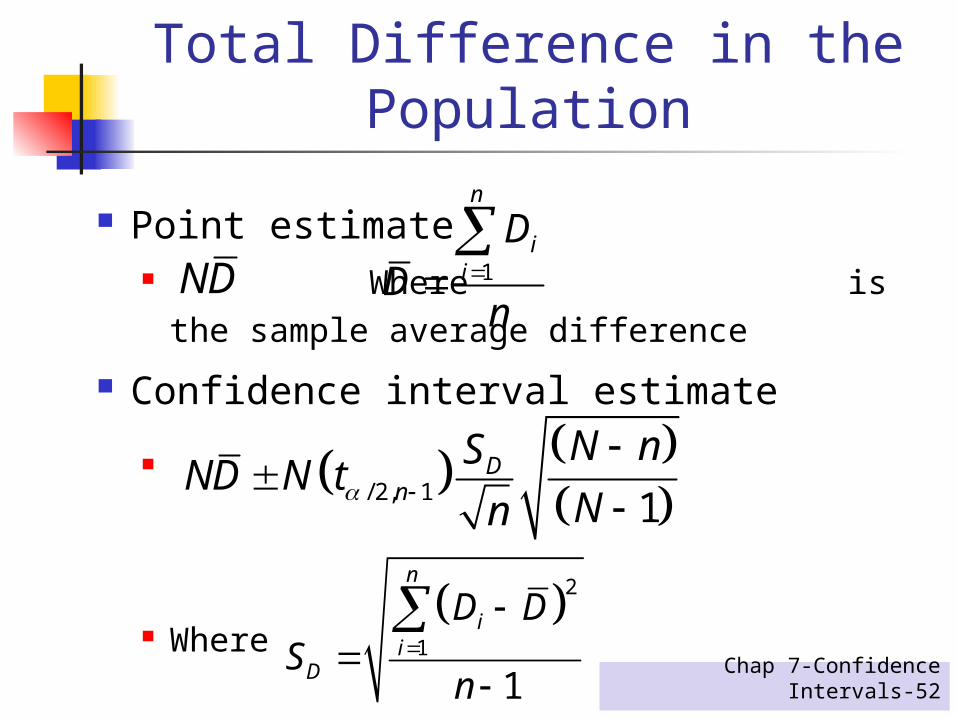
Confidence Interval for Total Difference in the Population
Point estimate Where is the sample
average difference
Confidence interval estimate
Where
ND 1
n
ii
DD
n
/ 2, 1 1
Dn
N nSND N t
Nn
2
1
1
n
ii
D
D DS
n

Chap 7-Confidence Intervals-
53
Estimation for Finite Population
Samples are selected without replacement Confidence interval for the mean
( unknown)
Confidence interval for proportion
/ 2, 1 1n
N nSX t
Nn
/ 2
1
1S S
S
p p N np Z
n N

Chap 7-Confidence Intervals-
54
Sample Size Determination for Finite Population
Samples are selected without replacement When estimating the mean
When estimating the proportion
2 2/ 2
0 2
Zn
e
2/ 2
0 2
1Z p pn
e
Chap 7-Confidence Intervals-
55
Ethical Considerations
Report confidence interval (reflect sampling error) along with the point estimate
Report the level of confidence Report the sample size Provide an interpretation
of the confidence interval estimate
Chap 7-Confidence Intervals-
56
Chapter Summary
Illustrated estimation process Discussed point estimates Addressed interval estimates Discussed confidence interval
estimation for the mean ( known) Addressed determining sample size Discussed confidence interval
estimation for the mean ( unknown)
Chap 7-Confidence Intervals-
57
Chapter Summary Discussed confidence interval
estimation for the proportion Addressed confidence interval
estimation for population total Discussed confidence interval
estimation for total difference in the population
Addressed estimation and sample size determination for finite population
Addressed confidence interval estimation and ethical issues
(continued)


