
THE CITY OF NEW YORKOFFICE OF THE COMPTROLLER
March 20, 2017
COMMON INVESTMENT MEETINGPublic Session

PERFORMANCE REPORTINGOverview – Fourth Quarter 2016

Asset Class Index Fourth Quarter 2016
FYTD 3 Year 5 Year Expected*
Equities - U.S. Russell 3000 4.2% 8.8% 8.4% 14.7% 7.8%
Equities - Developed Intl MSCI EAFE -0.7% 5.7% -1.6% 6.5% 8.9%
Equities - Emerging Intl MSCI EMF -4.2% 4.5% -2.6% 1.3% 11.0%
Debt – US Treasuries Long Duration Citigroup Treasury 20+ -12.1% -12.6% 8.4% 2.5% 2.1
Debt - US Government NYC Treas/Agency +5 -7.3% -7.8% 4.6% 1.9% 2.8%
Debt - Investment Grade NYC IG Credit -3.1% -1.7% 3.9% 3.8% 3.4%
Debt - High Yield Citigroup BB & B 1.6% 6.8% 4.4% 6.7% 6.1%
3
Market Returns: Q4-2016
Source: State Street
*Average of consultant long-term arithmetic expected returns, as of 2016
Prepared by the New York City Comptroller's Office Bureau of Asset Management

4
REGIME SHIFTQ4 Themes:
1) US Election/Republican sweep – markets expecting stronger GDP growth and higher earnings based on anticipated policy changes in three key areas.
- Business and personal income tax reform.
- Reduction in business regulations.
- Increase in fiscal spending (infrastructure and defense)
Rotation within US Equities Q4 2016 3 Year
Vulcan Materials Co. (Infrastructure Proxy)
10.22% 32.62% 28.67%
Rotation within US Equities Q4 2016 3 YearRussell 3000 Index 4.21% 12.74% 8.43%Russell 2000 Index 8.83% 21.31% 6.74%Russell 3000 Growth Index 1.20% 7.39% 8.27%Russell 3000 Value Index 7.24% 18.40% 8.55%
Rotation within US Equities Q4 2016 3 YearFinancial Equity ETF 21.02% 22.59% -2.80%Energy Equity ETF 7.24% 28.00% 11.52%
Prepared by the New York City Comptroller's Office Bureau of Asset Management
5
REGIME SHIFT
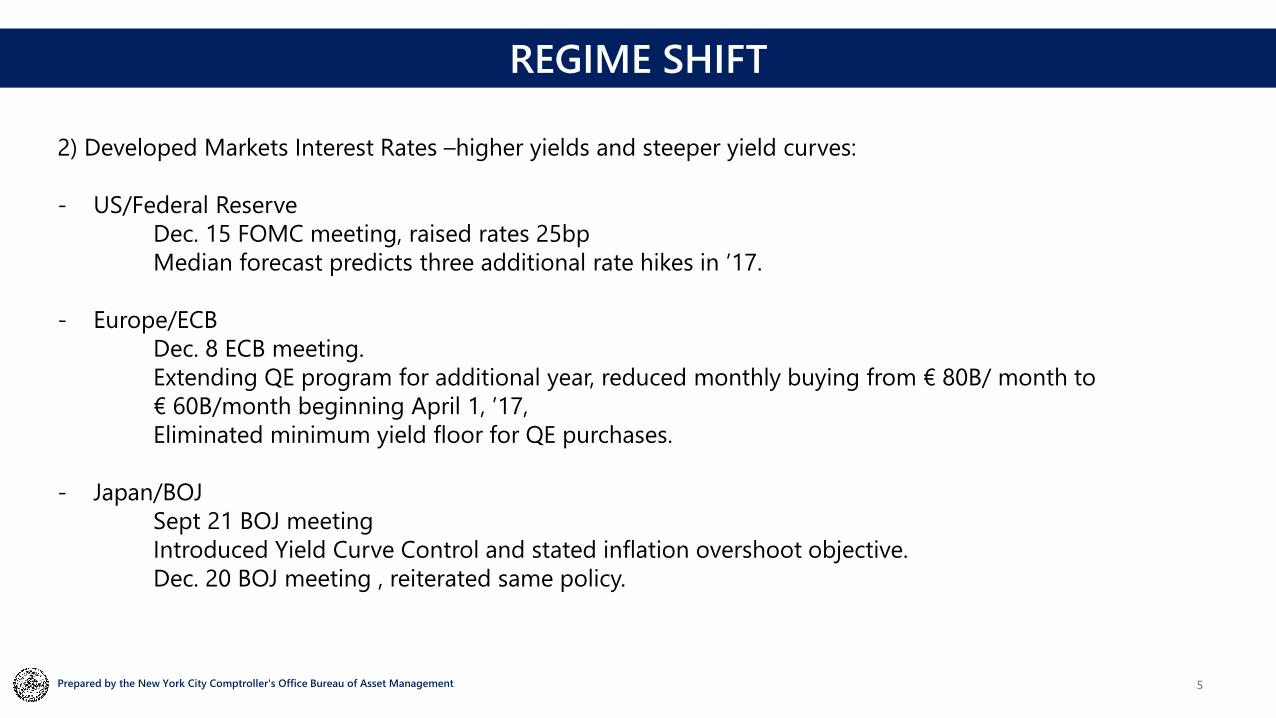
2) Developed Markets Interest Rates –higher yields and steeper yield curves:
- US/Federal ReserveDec. 15 FOMC meeting, raised rates 25bpMedian forecast predicts three additional rate hikes in ’17.
- Europe/ECB Dec. 8 ECB meeting.Extending QE program for additional year, reduced monthly buying from € 80B/ month to € 60B/month beginning April 1, ’17, Eliminated minimum yield floor for QE purchases.
- Japan/BOJSept 21 BOJ meetingIntroduced Yield Curve Control and stated inflation overshoot objective. Dec. 20 BOJ meeting , reiterated same policy.
Prepared by the New York City Comptroller's Office Bureau of Asset Management

0
0.2
0.4
0.6
0.8
1
1.2
1.4
UST 10YR Yield - Change in bps 84.9 Germany 10Yr Yield - Change in bps 33
JPY 10YR Yield - Change in bps 13.5 UK 10YR Yield - Change in bps 49.3
Feb-17Dec-16Sep-16Jun-16Mar-16
6
Global Yields
Source: Bloomberg
Prepared by the New York City Comptroller's Office Bureau of Asset Management

0
0.2
0.4
0.6
0.8
1
1.2
1.4
US Breakeven 10 Year- Change in bps: 36.1 Germany Breakeven 10 Year- Change in bps: 29.9
Japan Breakeven 10 Year- Change in bps: 26.7 UK Breakeven 10 Year- Change in bps: 33.3
Feb-17Dec-16Sep-16Jun-16Mar-16
7
Global Inflation Breakeven
Source: BloombergPrepared by the New York City Comptroller's Office Bureau of Asset Management

8
REGIME SHIFT
3) US Dollar strength – dollar rallied 5.5 %, contributing factors included:
- Impact of Border Adjustment Taxes.
- Higher US interest rates, both absolute and relative to G7 countries.
- Potential for one-time off shore income tax repatriation.
- Potential for retaliatory trade sanctions.
Prepared by the New York City Comptroller's Office Bureau of Asset Management

Mar-16 Apr-16 May-16 Jun-16 Jul-16 Aug-16 Sep-16 Oct-16 Nov-16 Dec-16 Jan-17 Feb-17116
118
120
122
124
126
128
130
9
US Trade Weighted Broad Dollar Index- 1 Year
Source: BloombergPrepared by the New York City Comptroller's Office Bureau of Asset Management

10
US Trade Weighted Broad Dollar Index- 2000-2017
Source: BloombergPrepared by the New York City Comptroller's Office Bureau of Asset Management

11
REGIME SHIFTCurrent Global Macro Issues:
Domestic:- Probability, timing and specifics of US Tax and Spending Plans.
- Impact on economy and markets of trade and immigration reform.
- Federal Reserve – pace and magnitude of interest rate increases, change
in composition of Fed leadership and board, potential regulatory
changes to Federal Reserve.
”….the process of scaling back accommodation likely will not be as slow
as it was in 2015 and 2016.” Janet Yellen, March 3, 2017.
International: - European political risk – elections in Netherlands (March 15), France
(first round April 23, final May 7), Germany (anticipated in fall ’17)
- ECB and BOJ – potential for slowing or ending of Quantitative Easing
policies.Prepared by the New York City Comptroller's Office Bureau of Asset Management

Gross of fees in public asset classes
(SSB N p.22; T, F p.23; P p.25 ; B p.27)
NYC Pension System Portfolio Std Dev - 1 yr
4th Quarter FYTD One Year Three Year
Five Year
BERS 7.4% 1.1% 5.8% 9.4% 5.2% 9.4%TRS 6.8% 0.5% 4.3% 8.9% 5.3% 8.9%POLICE 6.4% 1.2% 5.1% 9.1% 5.6% 9.2%FIRE 6.3% 0.8% 4.7% 8.7% 5.5% 9.0%NYCERS 6.2% 1.1% 5.0% 9.6% 5.5% 9.0%Median Fund - TUCS 1.1% 4.7% 7.9% 5.3% 9.0%Public Mkt Equiv (65/35 index) 0.6% 4.1% 6.7% 4.5% 8.6%
12
Total NYC Pension Fund (Gross) Performance: 12/31/16
Source: State Street
Prepared by the New York City Comptroller's Office Bureau of Asset Management
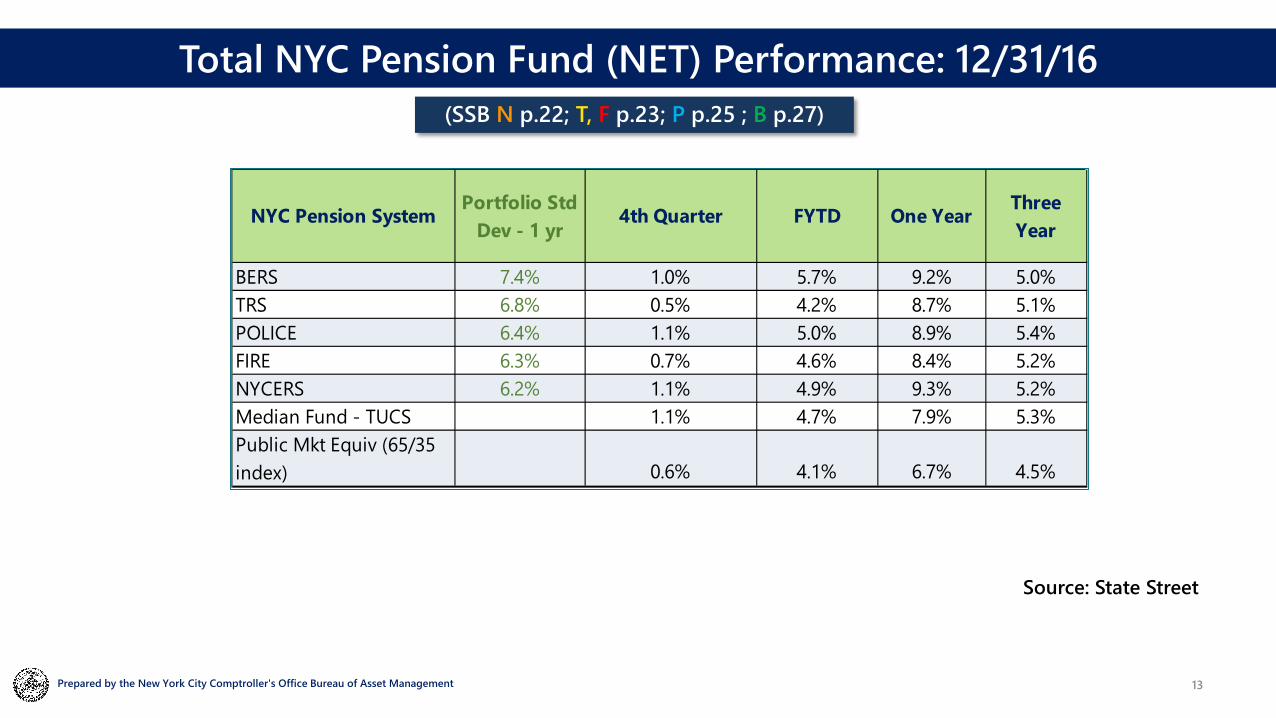
(SSB N p.22; T, F p.23; P p.25 ; B p.27)
NYC Pension System Portfolio Std Dev - 1 yr
4th Quarter FYTD One Year Three Year
BERS 7.4% 1.0% 5.7% 9.2% 5.0%TRS 6.8% 0.5% 4.2% 8.7% 5.1%POLICE 6.4% 1.1% 5.0% 8.9% 5.4%FIRE 6.3% 0.7% 4.6% 8.4% 5.2%NYCERS 6.2% 1.1% 4.9% 9.3% 5.2%Median Fund - TUCS 1.1% 4.7% 7.9% 5.3%Public Mkt Equiv (65/35 index) 0.6% 4.1% 6.7% 4.5%
13
Total NYC Pension Fund (NET) Performance: 12/31/16
Source: State Street
Prepared by the New York City Comptroller's Office Bureau of Asset Management

14
Asset Allocation Fourth Quarter 2016 – Equity and Private Markets
Source: State Street
Relative Mix to Adjusted Old Policy Weights (SSB F, T, N, B p.8; P, p.10)
Prepared by the New York City Comptroller's Office Bureau of Asset Management

15
Asset Allocation Fourth Quarter 2016 - Fixed IncomeRelative Mix to Adjusted Old Policy Weights (SSB F, T, N, B p.8; P, p.10)
Source: State Street
Prepared by the New York City Comptroller's Office Bureau of Asset Management

16
Asset Allocation Fourth Quarter 2016 – Equity and Private Markets
Source: State Street
Relative Mix to Adjusted New Policy Weights (SSB F, T, N, B p.8; P, p.10)
Prepared by the New York City Comptroller's Office Bureau of Asset Management

17
Asset Allocation Fourth Quarter 2016 - Fixed IncomeRelative Mix to Adjusted New Policy Weights (SSB F, T, N, B p.8; P, p.10)
Source: State Street
Prepared by the New York City Comptroller's Office Bureau of Asset Management

18
4th Quarter Net Return – Total Portfolio
-200
-150
-100
-50
0
50
100
150
200
4Q Portfolio 4Q Benchmark 4Q Excess
bps
TRS
NYCERS
Police
Fire
BERS
December 31, 2016 (SSB N, F, p.22; T, p.23; P p.24 B p.26)
Source: State StreetPrepared by the New York City Comptroller's Office Bureau of Asset Management
19
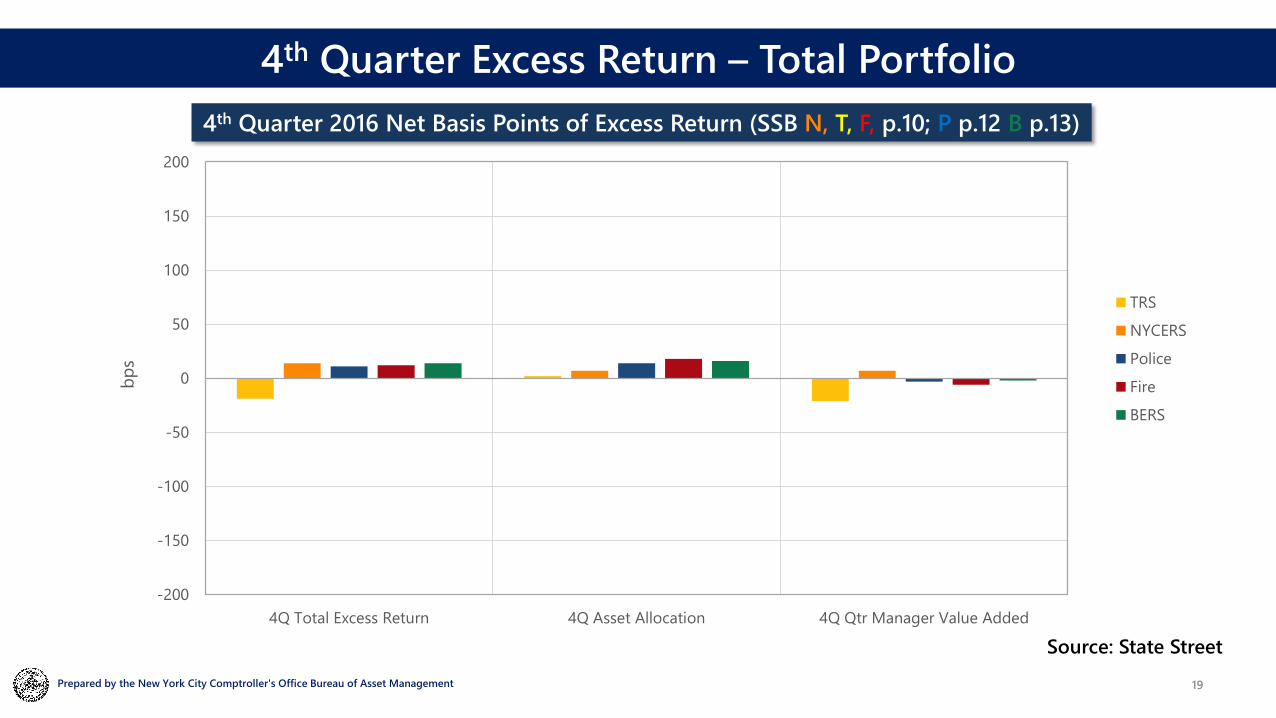
4th Quarter Excess Return – Total Portfolio
-200
-150
-100
-50
0
50
100
150
200
4Q Total Excess Return 4Q Asset Allocation 4Q Qtr Manager Value Added
bps
TRS
NYCERS
Police
Fire
BERS
Source: State Street
4th Quarter 2016 Net Basis Points of Excess Return (SSB N, T, F, p.10; P p.12 B p.13)
Prepared by the New York City Comptroller's Office Bureau of Asset Management

20
4th Quarter Excess Return – Equity & Fixed Income
-200
-150
-100
-50
0
50
100
150
200
4Q Asset Allocation 4Q Total Excess Equity 4Q Total Excess Fixed Income
bps
TRS
NYCERS
Police
Fire
BERS
Source: State StreetPrepared by the New York City Comptroller's Office Bureau of Asset Management

21
Manager Value Added- Total Portfolio
-200
-150
-100
-50
0
50
100
150
200
4Th QTR 3 Year Trailing
TRS
NYCERS
Police
Fire
BERS
bps
Net Basis Points of Excess Return (SSB N, T, F, p.10; P p.12 B p.13)
Source: State Street
Prepared by the New York City Comptroller's Office Bureau of Asset Management

22
Value Added – Total U.S. Equities
-600
-400
-200
0
200
400
600
4Th Qtr 3 Year Trailing
TRS: 30.84%NYCERS: 33.09%Police: 36.84%Fire: 31.92%BERS: 36.41%
Source: State Street
Weights as of12/31/2016
bps
Net Basis Points of Excess Return (SSB N, F, p.22; T, p.23; P p.24 B p.26)
Prepared by the New York City Comptroller's Office Bureau of Asset Management

23
Value Added – U.S. Equities – Mid Cap
-600
-400
-200
0
200
400
600
4Th Qtr 3 Year Trailing
TRS: 0.23%NYCERS: 1.55%Police: 2.04%Fire: 1.94%BERS: 2.45%
Source: State Street
Weights as of12/31/2016
bps
Net Basis Points of Excess Return (SSB N, F, p.22; T, p.23; P p.25 B p.26)
Prepared by the New York City Comptroller's Office Bureau of Asset Management
24
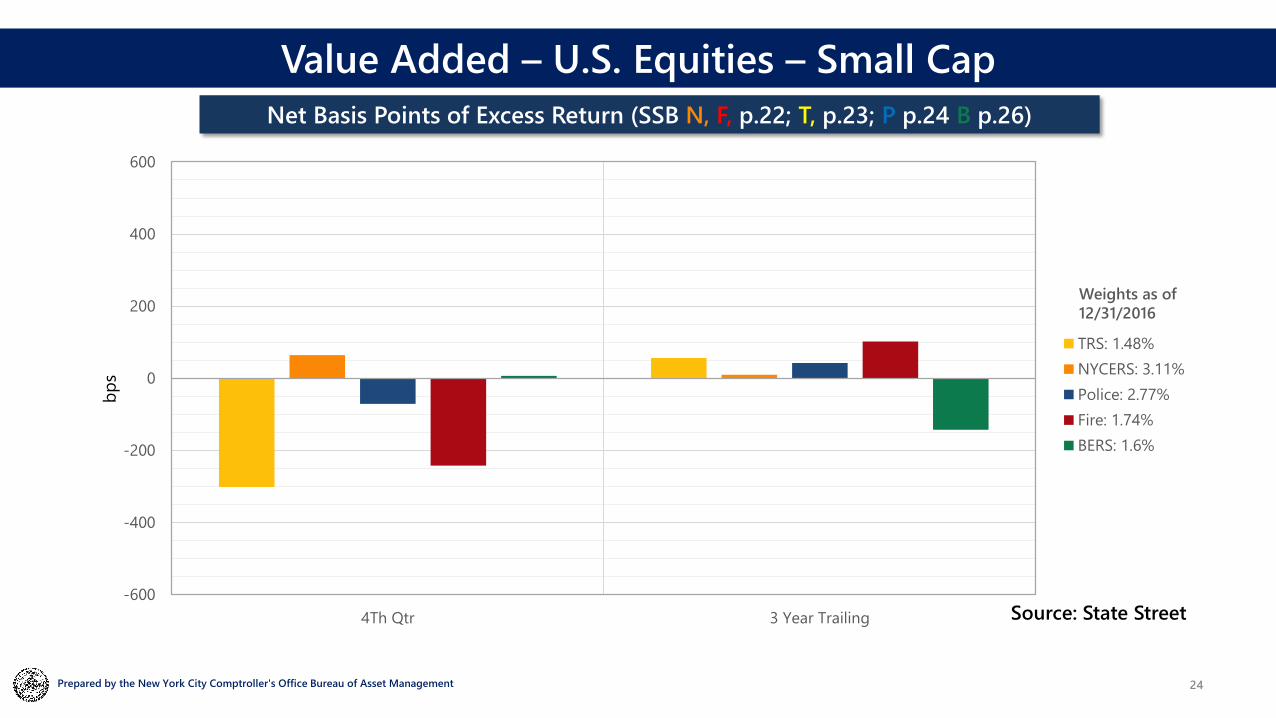
Value Added – U.S. Equities – Small Cap
-600
-400
-200
0
200
400
600
4Th Qtr 3 Year Trailing
TRS: 1.48%NYCERS: 3.11%Police: 2.77%Fire: 1.74%BERS: 1.6%
Source: State Street
Weights as of12/31/2016
bps
Net Basis Points of Excess Return (SSB N, F, p.22; T, p.23; P p.24 B p.26)
Prepared by the New York City Comptroller's Office Bureau of Asset Management

25
Value Added – Developed Growth
-600
-400
-200
0
200
400
600
4Th Qtr 3 Year Trailing
TRS: 3.7%NYCERS: 3.32%Police: 3.04%Fire: 3.83%BERS: 6.83%
Source: State Street
Weights as of12/31/2016
bps
Net Basis Points of Excess Return (SSB N, F, p.24; T, p.25; P p.26; B p.28)
Prepared by the New York City Comptroller's Office Bureau of Asset Management

26
Value Added – Developed Value
-600
-400
-200
0
200
400
600
4Th Qtr 3 Year Trailing
TRS: 3.29%NYCERS: 3.52%Police: 2.94%Fire: 3.57%BERS: 7.38%
Source: State Street
Weights as of12/31/2016
bps
Net Basis Points of Excess Return (SSB N, F, p.24; T, p.25; P p.26; B p.28)
Prepared by the New York City Comptroller's Office Bureau of Asset Management

27
Value Added – Structured Fixed Income
-600
-400
-200
0
200
400
600
4Th Qtr 3 Year Trailing
TRS: 17.02%NYCERS: 15.41%Police: 14.93%Fire: 15.75%BERS: 13.89%
Source: State Street
Weights as of12/31/2016
bps
Net Basis Points of Excess Return (SSB T, N p.28; F, p.29; P, B p.30)
Prepared by the New York City Comptroller's Office Bureau of Asset Management

28
Value Added – Economically Targeted Investments
-600
-400
-200
0
200
400
600
4Th Qtr 3 Year Trailing
TRS: 0.91%NYCERS: 1.3%Police: 1.01%Fire: 0.74%BERS: 0.6%
Source: State Street
Weights as of12/31/2016
bps
Basis Points of Excess Return (SSB T, N p.29; F p30; B p.31 P p.32)
Prepared by the New York City Comptroller's Office Bureau of Asset Management

Value Added- Hedge FundsBasis Points of Excess Return
-600
-400
-200
0
200
400
600
4TH Qtr 3 Year Trailing
TRS - N/A
NYCERS: 1.05%
Police: 4.74%
Fire: 4.71%
BERS - N/A
Source: Aksia
Weights as of12/31/2016
29
bps
Value Added - Hedge FundsBasis Points of Excess Return (SSB F p.51; N p.52; P p.56)
Prepared by the New York City Comptroller's Office Bureau of Asset Management

PRIVATE MARKET DATA

31
Value Added – Private Equity
-600
-400
-200
0
200
400
600
Excess Return Since Inception; PME Benchmark: Russell 3000 as of 9/30/16
TRS - 07/08/99
NYCERS - 03/29/99
Police - 03/29/99
Fire - 03/29/99
BERS - 07/20/06
Inception Date
300bps Target
Sources: StepStone Groupand Hamilton Lane
Basis Points of Cumulative IRR above Public Market Equivalent
bps
The PME Spread is the difference between the IRR and the PME Benchmark.Prepared by the New York City Comptroller's Office Bureau of Asset Management

32
Value Added – Private Real Estate - Core
-800
-600
-400
-200
0
200
400
600
800
Excess Return Since Inception; Core = 40% Equities- Russell 3000 /60% BarcAgg as of 9/30/16
TRS - 12/6/2002
NYCERS - 12/6/2002
Police - 12/6/2002
Fire - 12/6/2002
BERS - 12/13/2010
Inception Date
Source: State Street
Basis Points of Cumulative IRR above Public Market Equivalentbp
s
The PME Spread is the difference between the IRR and the PME Benchmark.
Prepared by the New York City Comptroller's Office Bureau of Asset Management

33
Value Added – Private Real Estate – Non-Core
-800
-600
-400
-200
0
200
400
600
800
Excess Return Since Inception; Non-core = 60% Equities- Russell 3000/40% BarcAgg as of 9/30/16
TRS - 12/6/2002
NYCERS - 12/6/2002
Police - 12/6/2002
Fire - 12/6/2002
BERS - 12/13/2010
Inception Date
Source: State Street
Basis Points of Cumulative IRR above Public Market Equivalentbp
s
The PME Spread is the difference between the IRR and the PME Benchmark.
Prepared by the New York City Comptroller's Office Bureau of Asset Management

34
Value Added – Opportunistic Fixed Income (OFI)
-600
-400
-200
0
200
400
600
Excess Return Since Inception; PME Benchmark: 50% JP Morgan Global High Yield 50% CS Leveraged Loans as of 12/31/16
TRS - 10/24/2007
NYCERS - 10/24/2007
Police - 10/24/2007
Fire - 10/24/2007
BERS - N/A
Inception Date
300bps Target
Source: State Street
Basis Points of Cumulative IRR above Public Market Equivalent
bps
The PME Spread is the difference between the IRR and the PME Benchmark.
Prepared by the New York City Comptroller's Office Bureau of Asset Management

35
Value Added - Infrastructure
-600
-400
-200
0
200
400
600
Excess Return Since Inception; PME Benchmark: 50% R3000 & 50% Barclays Agg. as of 9/30/16
TRS - 11/19/2013
NYCERS - 11/19/2013
Police - 11/19/2013
Fire - 11/19/2013
BERS - 11/19/2013
Inception Date
Source: StepStone Group
Basis Points of Cumulative IRR above Public Market Equivalentbp
s
The PME Spread is the difference between the IRR and the PME Benchmark.
Prepared by the New York City Comptroller's Office Bureau of Asset Management

RISK UPDATE

1. Risk Group Staffing
2. BAM Ribbon & Basket Clause monitoring process
3. Risk Analytic RFP
Risk Update
37Prepared by the New York City Comptroller's Office Bureau of Asset Management

Risk Group Staffing

• In 2015 the Risk Group consisted of Sherma Cooper, Daniel Haas and Miles Draycott.
• In 2016 we added three individuals to the group:
– Nikolay Radev joined the team in February as a Senior Investment Analyst after completing his Master’s degree in Financial Engineering at the Stevens Institute of Technology.
– Chris Lusk joined the team in April as an Application Developer. Prior to joining BAM, Chris worked at Merrill Lynch.
– Alex Dotov joined the team in December as a Senior Investment Officer. Alex was previously a Managing Director in the Office of the CIO of NY Life Investment Management.
Risk Group Staffing
39Prepared by the New York City Comptroller's Office Bureau of Asset Management
BAM Ribbon & Basket Clause Monitoring Process

• The structure of many NYC pension fund investments is complex
• State Street’s financial reports are produced monthly
• The Risk Management Team (Chris Lusk) has developed an application, available via an Excel ribbon, that produces daily P&L and asset allocation reports for all five systems. These reports are derived from:
oState Street holdings and activity data for the six legal entities that hold investments
oMarket prices for public market securities
oSecurities data obtained via the Bloomberg API
41
Asset Allocation and Performance Analysis
Prepared by the New York City Comptroller's Office Bureau of Asset Management

The bubble chart below is produced by the BAM ribbon – as are numerous additional reports useful to BAM’s risk and investment staff.
. The following pages show examples of
42
BAM Ribbon
Prepared by the New York City Comptroller's Office Bureau of Asset Management

43
BAM Ribbon
Prepared by the New York City Comptroller's Office Bureau of Asset Management

44
Equity Breakdown
Prepared by the New York City Comptroller's Office Bureau of Asset Management

45
Fixed Income Breakdown
Prepared by the New York City Comptroller's Office Bureau of Asset Management

• The asset allocation report available through the BAM ribbon is the means by which BAM monitors compliance with the “Basket Clause”.
• The process for monitoring Basket Clause compliance is:
– BAM Risk Group runs the asset allocation report on a daily basis. It is then reviewed by the Financial Reporting function.
– In the event that a System’s basket holdings exceed 23%, 24% or 25%, BAM is required to take specific actions.
46
Basket Clause Monitoring
Prepared by the New York City Comptroller's Office Bureau of Asset Management

The ribbon also produces an asset allocation report that is relied upon by the rebalancing team - chaired by Mike Haddad
47
Basket Clause Monitoring
Prepared by the New York City Comptroller's Office Bureau of Asset Management

Risk Analytic RFP

• BAM’s risk analytics RFP is seeking software able to both estimate the risk of a portfolio and analyze investment/manager returns (an “attribution” platform).
• An important objective is to procure software useful to both the risk team and the asset teams. The software needs to be capable of both top down “factor” analysis of the total plan and granular analysis of an alternative investment.
• BAM loaded one NYC pension system’s holdings into Bloomberg in order to prepare for the upcoming Risk Analytics RFP trials.
Risk Analytics RFP
49Prepared by the New York City Comptroller's Office Bureau of Asset Management

Risk Analytics Procurement Timeline:
1. Due diligence/drafting RFP August 2015 – July 20162. RFP issued August 20163. Responses from 8 vendors August 20164. Scoring of responses December 20165. Trials conducted of 3 applications January – March 2017 6. Recommendation at April CIM April 20177. Execution of contract/Implementation May – September 2017
50
Risk System Timeline
Prepared by the New York City Comptroller's Office Bureau of Asset Management


