
October 2017 CCP:HF/JU 17/CRS 1
E
COMMITTEE ON COMMODITY PROBLEMS
JOINT MEETING OF THE THIRTY-NINETH SESSION OF THE
INTERGOVERNMENTAL GROUP ON HARD FIBRES AND THE
FORTY-FIRST SESSION OF THE INTERGOVERNMENTAL GROUP
ON JUTE, KENAF AND ALLIED FIBRES
Tanga, Tanzania, 15 – 17 November 2017
CURRENT MARKET SITUATION AND MEDIUM TERM OUTLOOK
FOR JUTE AND KENAF; SISAL AND HENEQUEN; ABACA AND COIR
I. INTRODUCTION
1. This CRS1 document is composed by three main sections. Section II, “World production, trade
and prices”, provides an analysis of recent developments in the JACKS2 market. Section III, “Medium
term outlook to 2026”, prospects the JACKS markets in the medium term, and section III concludes.
2. The data used in the assessment of the current market situation, and for generating projections
to 2026, were compiled from responses to the Secretariat’s annual questionnaires on JACKS.
Delegates are invited to supplement information and provide insights on the trends pertaining to their
countries. Tables used in the Secretariat’s analysis are tabled in document CCP:HF/JU 17/CRS 2 for
perusal and correction by delegates.
II. WORLD PRODUCTION, TRADE AND PRICES
3. Global production of JACKS fibres increased by 17.9 percent to 4.67 million tonnes in 2016,
compared to output levels in 2015. Jute and kenaf accounted for the largest share of production,
followed by coir, sisal and similar fibres, such as henequen and fique, and abaca (Figure 1).
1 Conference room series. 2 Jute, abaca, coir, kenaf and sisal.

2 CCP:HF/JU 17/CRS 1
Figure 1 – World JACKS Production (thousand tonnes)
Source: FAO IGG/HFJU Secretariat.
A. JUTE AND KENAF PRODUCTION
4. Jute and kenaf production increased by 24.6 percent in 2016/17, reaching 3.31 million tonnes
compared to 2.66 million tonnes in the previous season. The highest increase in output was registered
in India at 41.5 percent, followed by Bangladesh with a 12.5 percent increase in production. This was
mainly due to the good weather conditions in these two major producing countries. Moreover, the
increased outputs in India can also be seen as a result of the significant support that the Government
has been giving to the sector and associated processing industry which has been supplemented by
investments from the private sector, including the Indian Jute Mills Association. (Figure 2).
Figure 2 – Jute and Kenaf Production (thousand tonnes)
Source: FAO IGG/HFJU Secretariat.
0500
100015002000250030003500400045005000
2010 2011 2012 2013 2014 2015 2016
Jute/Kenaf 3376 3410 3182 3097 2779 2657 3312
Coir (brown fibre) 798 798 833 816 903 946 1002
Sisal, Henequen & Fique 280 298 259 254 283 284 273
Abaca 70 86 78 67 77 78 87
0
500
1000
1500
2000
2500
3000
3500
2010/11 2011/12 2012/13 2013/14 2014/15 2015/16 2016/17
Bangladesh India Rest of the World

CCP:HF/JU 17/CRS 1 3
B. JUTE PRICES
5. Since 2013, prices increased steadily until the first quarter of 2015, reaching USD 760 per
tonne in March 2015, after which prices declined, reaching a minimum of USD 660 per tonne in the
second quarter of 2015. During the 2015-2016 season, prices increased, reaching a maximum of USD
880 per tonne in March and May 2016. In the last quarter of 2016 prices declined sharply, reaching
USD 660 per tonne in October, remaining more or less constant. In June 2017 the price of jute was
marked at USD 670 per tonne, more or less reflecting the average price during the period 2012-2017
(Figure 3).
Figure 3 – Jute Export Prices (BTD f.o.b. Bangladesh Port)
Source: FAO IGG/HFJU Secretariat.
C. MARKET POSITION OF COMPETING SYNTHETICS
6. Generally, prices of polypropylene (the main synthetic petroleum-based fibre competing with
natural fibres in various applications) follow crude oil prices, although the extent of upward or
downward variation depends on competitive conditions in individual markets. For example, in markets
where polypropylene (PP) fabrics are in close competition with jute fabrics, upward movements in
crude oil prices tend to be absorbed with very little impact on the price of PP fibre applications.
7. Crude oil prices have continued to decrease since 2012. Between October 2014 and April
2016 prices of crude oil rapidly dropped to less than one-third compared to the 2011 levels (Figure 4).
Since then, prices have continued to increase steadily, moving from an average of USD 43.55 in 2016
to USD 51.64 in 2017. Under these circumstances, it would appear that the underlying trends in
competition between natural and synthetic fibres have resumed in favour of the former. The price
levels where competition takes place more closely – in the first stage of processing – reflect the true
economic costs of crude oil-based products.
200
300
400
500
600
700
800
900
1000
1100
2010 2011 2012 2013 2014 2015 2016 2017
USD / tonne

4 CCP:HF/JU 17/CRS 1
Figure 4 - Crude Oil Prices (Brent Blend, in USD/barrel)
Source: FAO IGG/HFJU Secretariat.
D. JUTE TRADE
8. World exports of jute goods declined by about 7.1 percent in 2016/17 compared to levels
attained in 2015/2016, while total exports of jute fibre increased by 8.3 percent compared to the
previous year (Figure 5). In fact, total exports of jute fibre presented a 5.9 percent growth p.a. over the
last two years. This is mainly due to exports from Bangladesh which increased, on average, by
14 percent p.a. in the last two seasons.
Figure 5 – Trend of Exports of Jute Goods and Fibre (thousands tonnes)
Source: FAO IGG/HFJU Secretariat.
9. Bangladesh dominates world exports of jute, accounting for approximately 87 percent of
world exports of raw jute and nearly 82 percent of jute goods in 2016/17 (Figure 6). India is also a
significant exporter of jute goods despite its vast domestic demand. In fact, during the last two and
half years, India’s jute goods exports declined by nearly 22 percent p.a., accounting for about 8
percent of global shipments – almost half when compared to 2013/14. Exports of jute goods by other
countries increased by 10.7 percent in 2016/17 compared to levels in 2015/16. Egypt, China, Pakistan
0
20
40
60
80
100
120
140
2006 2007 2008 2009 2010 2011 2012 2013 2014 2015 2016 2017
US
D/
barr
el
200
300
400
500
600
700
800
900
1000
1100
1200
1300
2010/11 2011/12 2012/13 2013/14 2014/15 2015/16 2016/17
Jute Fibre
Jute Goods

CCP:HF/JU 17/CRS 1 5
and the Russian Federation registered a sharp increase in 2016/17, even if their export volumes were
not very significant.
Figure 6 – Exports of Jute Goods (thousand tonnes)
Source: FAO IGG/HFJU Secretariat.
10. Imports of jute fibre in 2016 increased by 10.8 percent from 2015, totaling 289 790 tonnes
(Figure 7). Global import data are reported on a calendar year basis, rather than on a crop year basis,
leading to differences with export levels owing to leads and lags. Asia accounted for 85 percent of jute
fibre imports, totaling 245 640 tonnes, with India now being the major importer, followed by Pakistan,
Nepal and China.
Figure 7 – Imports of Jute Fibre (thousand tonnes)
Source: FAO IGG/HFJU Secretariat.
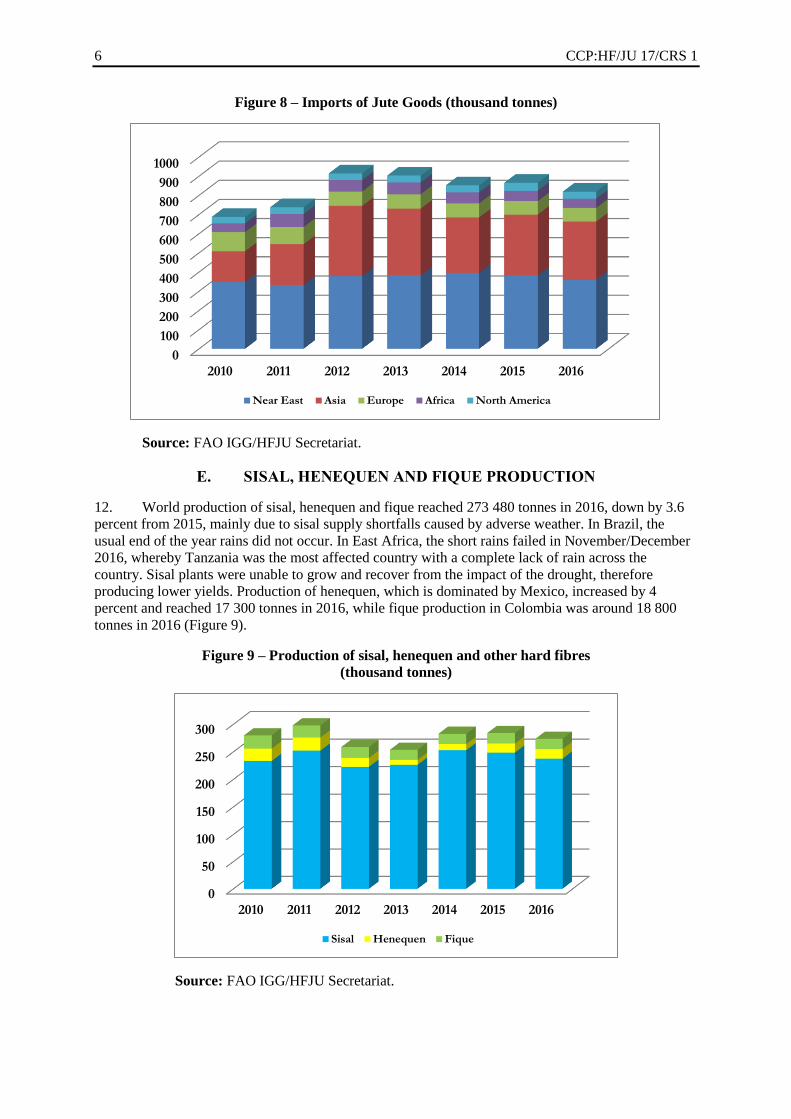
11. World imports of jute goods in 2016 accounted for 884 200 tonnes, reflecting a 17 percent
increase in comparison to 2010, and yet a decrease of 4.3 percent when compared to 2015 (Figure 8).
The Near East remained the largest importing region, with 41 percent of the world imports of jute
goods. Imports into Asia, the second largest importing region, maintained similar levels of 2015,
amounting to 34 percent. Other smaller markets for jute goods include the European Union (EU),
Africa and North America.
0
200
400
600
800
1000
1200
2010/11 2011/12 2012/13 2013/14 2014/15 2015/16 2016/17
Bangladesh India Other
0
100
200
300
400
500
600
2010 2011 2012 2013 2014 2015 2016
China (Mainland) India Nepal Pakistan Other
6 CCP:HF/JU 17/CRS 1
Figure 8 – Imports of Jute Goods (thousand tonnes)
Source: FAO IGG/HFJU Secretariat.
E. SISAL, HENEQUEN AND FIQUE PRODUCTION
12. World production of sisal, henequen and fique reached 273 480 tonnes in 2016, down by 3.6
percent from 2015, mainly due to sisal supply shortfalls caused by adverse weather. In Brazil, the
usual end of the year rains did not occur. In East Africa, the short rains failed in November/December
2016, whereby Tanzania was the most affected country with a complete lack of rain across the
country. Sisal plants were unable to grow and recover from the impact of the drought, therefore
producing lower yields. Production of henequen, which is dominated by Mexico, increased by 4
percent and reached 17 300 tonnes in 2016, while fique production in Colombia was around 18 800
tonnes in 2016 (Figure 9).
Figure 9 – Production of sisal, henequen and other hard fibres
(thousand tonnes)
Source: FAO IGG/HFJU Secretariat.
0
100
200
300
400
500
600
700
800
900
1000
2010 2011 2012 2013 2014 2015 2016
Near East Asia Europe Africa North America
0
50
100
150
200
250
300
2010 2011 2012 2013 2014 2015 2016
Sisal Henequen Fique

CCP:HF/JU 17/CRS 1 7
13. World production of sisal continues to be dominated by Brazil in 2016, accounting for 36
percent of the global total; followed by China (27 percent); Tanzania (15 percent); Kenya (10 percent);
Madagascar (3 percent); and other countries (9 percent). Sisal production in Brazil reached 84 650
tonnes in 2016, 8 percent lower than 2015. Similarly, output in Tanzania fell from 40 000 tonnes in
2015 to 36 750 tonnes in 2016. During the last three years, China has seen its production of sisal
stabilizing at 63 000 tonnes (Figure 10).
Figure 10 – Production of Sisal Fibre (thousand tonnes)
Source: FAO IGG/HFJU Secretariat.
F. SISAL PRICES
14. Price levels for the three main grades of sisal3 produced in East Africa and Brazil increased in
2015 and 2016 as supplies have not reached pre-Brazilian shortfall levels caused by the 2013/2014
severe drought in the sisal growing region of Bahia (Figure11). When expressed in US dollars, the
increase in the price of Brazilian sisal was moderated by the devaluation of the real. In any case, this
situation also put pressure on all African producers and on pricing of the East African sisal fibre. In
January 2016, East Africa prices reached a record high of USD 2 350 per tonne for 3L and USD 2 195
per tonne for UG. During 2015, Brazil had excellent weather conditions, receiving good rains;
therefore sisal production recovered, although well below the levels of the previous decade. Brazilian
sisal quality also increased significantly. The improved quantity and quality of Brazilian sisal resulted
in a dynamic price competition, reducing price levels and increasing the price differentials between
Bahia Type 3 DB and East Africa 3L and UG. This impacted negatively on African sisal during 2016.
In fact, during the second half of 2016, prices sharply declined – by about 11 and 13 percent for 3L
and UG, respectively, when compared to the first semester of 2016.
15. Towards the end of 2016, Africa and Brazil were affected by El Niño. In Brazil, the normal
end of the year rains did not occur. In East Africa, as previously mentioned, the short rains failed in
November/December 2016, and Tanzania registered a complete lack of rain across the country. In
addition, further pressure for fibre demand was registered as the agricultural twine season in North
America begins, and contracts for 2017/2018 are still being negotiated. Therefore, the price of Bahia
Type 3 DB increased by 8 percent in the first 6 months of 2017, reaching USD 1 600 per tonne. In
3 The three main grades of sisal are 3L and UG in East Africa and Bahia type 3 DB in Brazil.
0
50
100
150
200
250
300
2010 2011 2012 2013 2014 2015 2016
tho
usa
nd
to
nn
es
Brazil China Tanzania Kenya Madagascar Others

8 CCP:HF/JU 17/CRS 1
addition, in the first 6 months of 2017, the price of the African sisal fibre remained constant and
marked at USD 2 050 per tonne for 3L and USD 1 800 per tonne for UG.
Figure 11 - Sisal Price: East Africa (3L and UG) and Brazil (Bahia Type 3 DB)
(USD/tonne)
Source: FAO IGG/HFJU Secretariat.
G. SISAL TRADE
16. Total exports of sisal fibre reached 83.3 thousand tonnes in 2016, a 7.3 percent decrease from
2015, and total exports of sisal manufactures decrease by 8.7 percent reaching 60.7 thousand tonnes
(Figure12). While the major sisal producers in Africa, Brazil and Asia registered a double-digit
decrease in their exports of sisal manufactures, North America and Europe saw a significant increase
in their exports. Shipments of sisal manufactures from North America and Europe increased by 3.3
and 12.4 percent respectively in 2016 and now hold a share of 21 percent of this market.
Figure 12 – World Exports of Sisal Fibre and Manufactures (thousand tonnes)
Source: FAO IGG/HFJU Secretariat.
500
700
900
1100
1300
1500
1700
1900
2100
2300
2500
3L
Bahia Type 3 DB
UG
50
55
60
65
70
75
80
85
90
95
100
2010 2011 2012 2013 2014 2015 2016
Manufactures
Sisal Fibres

CCP:HF/JU 17/CRS 1 9
17. Tanzania, the third major exporter of sisal fibre, which holds a 20 percent share of total
exports, registered a 29.8 percent decrease in 2016. By contrast, both Brazil and Kenya saw a slight
increase in exports of sisal fibre, an increase of up to 0.2 and 1.0 percent respectively. Together, these
two countries contributed 70 percent of the world exports of sisal fibre (Figure 13).
Figure 13 – Exports of Sisal Fibre (thousand tonnes)
Source: FAO IGG/HFJU Secretariat.
18. World imports of sisal manufactures steadily declined to 58 030 tonnes in 2016, with the
United States of America (USA) remaining the largest importer, absorbing 39 percent of the total
imports, followed by the EU, with 23 percent. With the exception of the Near East, all areas of the
world registered a decline in their imports of sisal manufactures. This trend is led by North America,
with a decrease of 21.6 percent in 2016. The Near East registered an increase in imports of sisal
manufactures of about 15.3 percent, mainly led by the Saudi Arabia. However, the Near East market
represents only 5.3 percent of the total world imports of sisal manufactures (Figure 14).
Figure 14 – Imports of Sisal Manufactures (thousand tonnes)
Source: FAO IGG/HFJU Secretariat.
0
10
20
30
40
50
60
70
80
90
100
2010 2011 2012 2013 2014 2015 2016
Brazil Kenya Tanzania Madagascar Other
0
10
20
30
40
50
60
70
80
2010 2011 2012 2013 2014 2015 2016
World North America Europe Asia Africa Near East Latin America Other

10 CCP:HF/JU 17/CRS 1
H. ABACA PRODUCTION
19. Production of abaca fibre was about 86 770 tonnes in 2016, an 11 percent increase when
compared to the previous year. This was mainly driven by the full recovery of the Philippines abaca
industry and the significant 36.9 percent increase in the production of abaca in Ecuador, from 8 560
tonnes in 2015 to 11 710 tonnes in 2016 (Figure 15).
Figure 15 – Abaca Production (thousand tonnes)
Source: FAO IGG/HFJU Secretariat.
I. ABACA TRADE
20. Abaca fibre remains largely for domestic consumption in the Philippines, while Ecuador
exports the raw fibre produced. Exports of abaca fibre and manufactures declined significantly
between 2011 and 2013 reflecting the global weakening in demand but recovered since 2014. The
increase was particularly registered in the exports of abaca fibre, which presents an average of 24
percent p.a. increase for the last three years. Exports of abaca fibre reached about 28.6 thousand tonnes
in 2016, while exports of abaca manufactures totalled 33.8 thousand tonnes in 2016, with abaca pulp
accounting for 64 percent of total manufactures (Figure 16).
Figure 16 – World Exports of Abaca Fibre and Manufactures (thousand tonnes)
Source: FAO IGG/HFJU Secretariat.
0
20
40
60
80
100
2010 2011 2012 2013 2014 2015 2016
Ecuador Philippines Other
0
5
10
15
20
25
30
2010 2011 2012 2013 2014 2015 2016
Abaca Fibre Abaca Pulp Abaca Cordage, Twine, Ropes

CCP:HF/JU 17/CRS 1 11
J. ABACA PRICES
21. Abaca prices declined slightly in the first half of 2014, before increasing steadily again until
April 2017. Prices have remained stable since then for all types of abaca. The spread of prices between
abaca type JK and type G have narrowed, registering a 4.5 percent difference in 2017 compared to an
11.2 percent difference in 2014 (Figure 17).
Figure 17 – Philippines Abaca Prices (USD/bale)
Source: FAO IGG/HFJU Secretariat.
K. COIR PRODUCTION
22. Global production of brown coir fibre increased by 6 percent to reach 1 million tonnes in 2016
(Figure18). India accounted for more than 60 percent of the total. India also registered the highest
annual growth, which was about 16 percent p.a. during the last two years. India also produced an
estimated 85 thousand tonnes of white fibre and 70 thousand tonnes of curled fibre. By contrast, coir
production in Sri Lanka, Vietnam and Thailand decreased in 2017.
Figure 18 – Coir Fibre (Brown) Production (thousand tonnes)
Source: FAO IGG/HFJU Secretariat.
100
130
160
190
220
250
280
310
340
2010 2011 2012 2013 2014 2015 2016 2017
S2
JK
G
0
200
400
600
800
1000
2010 2011 2012 2013 2014 2015 2016India (brown fibre ) Sri Lanka VietNam Thailand

12 CCP:HF/JU 17/CRS 1
L. COIR PRICES
23. Coir prices continue presenting mixed trends. Since 2014, twine prices show high price
volatility, increasing 59 percent in 2015, when compared to the previous year, and staying more or less
at the same level in 2016, i.e. at USD 1 115 per tonne. Yarn prices rose too, but more steadily,
increasing by 7 percent in 2016. Mattress, bristle and twisted fibre prices remained relatively stable
since 2013 (Figure 19).
Figure 19. Sri Lanka Export Prices of Coir Fibre and Manufactures
(USD/tonne)
Source: FAO IGG/HFJU Secretariat.
M. Coir Trade
24. Exports of coir fibre continued showing a pronounced upward trend in the last years, with an
average increase of 9 percent p.a. in 2015 and in 2016, reaching nearly 1.1 million tonnes. This
corresponds to an 80 percent increase with respect to the total fibre exports in 2010 (Figure 20). India
leads the contribution to this growth.
Figure 20 – Exports of Coir Fibre (thousand tonnes)
Source: FAO IGG/HFJU Secretariat.
200
350
500
650
800
950
1100
2010 2011 2012 2013 2014 2015 2016
(Mattress, Bristle and Twisted Fibre) Yarn Twine
0
200
400
600
800
1000
1200
2010 2011 2012 2013 2014 2015 2016India Sri Lanka VietNam Others

CCP:HF/JU 17/CRS 1 13
III. MEDIUM TERM OUTLOOK TO 2026
A. METHODOLOGY
25. A multi-country partial equilibrium model of raw and fibre good markets has been constructed
and used as a basis for projections. The model represents economic fundamentals where supply is
projected on the basis of area and yield for each crop, driven by prices, costs and improving
technology/management. An exception is the case of coir, which is modelled as a by-product of
coconut production. The fibre equivalent demand for various fibre goods is driven by incomes,
population and prices of competing fibres, and, in particular, cotton and other synthetic fibres.
Production and final demand for fibre goods affect domestic and international raw fibre markets.
Trade in both raw and fibre goods is driven by country prices and tariffs. While the model serves as a
basis for projection, expert assessment and judgement must be applied in a consensus building process
that incorporates diverse views of factors that are impacting the sector. The draft model of projections
described below have been adjusted by the judgement of FAO experts and, where available, by
industry and government experts. The economic and technological environment surrounding the
preparation of this outlook follows closely that described in the OECD-FAO Agricultural Outlook
2017-26, as well as common methodologies and assumptions used in the projection process.
B. BACKGROUND
26. The medium term outlook for JACKS prospects to 2026 is driven by complex forces. On the
supply side, the per hectare returns of most competitive crops has fallen significantly in recent years.
Inputs costs sensitive to crude oil prices, such as fertilizer or transportation, have also fallen. On
balance, these support the resurgence of the supply of natural fibres. However, on the demand side,
lower oil prices have also caused competitive prices for non-natural or synthetic fibres to fall.
Potentially, these forces lead to higher supplies of fibres, but at lower prices.
27. Measured at international reference prices, the world production value of jute, sisal, coir and
abaca accounted for USD 2.3 billion, 0.3 billion, 0.4 billion and 0.023 billion in 2016 – a total of over
USD 3 billion which accrues to many smallholder farmers, especially in India, Bangladesh, Sri Lanka,
China, Brazil, Tanzania and Kenya4. Value-added products derived from these raw fibres also provide
an important source of income, and revenues from exports contribute favourably to the trade accounts
of these countries.
28. In the decade prior to the reference period, 2014-16, global raw fibre production fared better
than was earlier projected by FAO studies. Reasons for this include stronger growth in supplying
countries, price competitiveness relative to synthetic fibres as well as a promisingly higher demand in
niche markets for natural fibres. Projections forward from the period 2014-16 – the reference base for
the projections – are hampered by considerable variability that has resulted from changes in markets
due to variations of demand and supply conditions where fibre markets appear to have been in some
disequilibrium. Medium term projections are difficult to make from such a variable base, and also
exhibit less variability since normal weather is assumed for each year of the projection.
C. JUTE OUTLOOK
Jute Production
29. During the decade prior to 2016, global jute production increased at a compound average rate
of 0.1 percent, to a level of 2 916 thousand tonnes (Figure 21). Bangladesh surpassed India as the top
global producer, growing at a rate of 2.4 percent annually. Jute production in India declined by 1.3
4 Reference prices used are: for jute – Bangladesh export price; for sisal – Brazil No. 3; for coir – Sri Lanka
bristle fibre; for abaca – Philippines Grade G.

14 CCP:HF/JU 17/CRS 1
percent annually over the period, mainly due to significantly lower production in 2014 and 2015,
before recovering in 2016. Bangladesh is now projected to retain its position as the top producer over
the next decade, while some recovery is expected in India. Global jute production is projected to
advance at a rate of 1.5 percent annually to a level of 3 410 thousand tonnes by 2026. Growth in jute
production is projected to be broadly based, with growth in Africa at 3.3 percent, Asia at 1.8 percent,
and a recovery in Latin America and the Caribbean at 1.1 percent annually. Recovering production is
largely due to relatively higher returns for jute compared to other competing crops, which had taken
precedence in the run up of global prices in the previous decade.
Jute Trade
30. World exports of jute declined significantly to 253 thousand tonnes in 2014-16, from 435
thousand tonnes in 2004-06, largely reflecting declining exports from Bangladesh, which is by far (94
percent share) the world’s top exporter of raw jute fibre (Figure 21). The decline in raw jute exports
from Bangladesh is entirely due to a rapidly increasing processing sector, which grew during the last
decade at a compound rate of 6 percent annually. In contrast, India’s exports grew in the last decade as
its processing sector contracted in the face of growing competition from Bangladesh. On the import
side, the fall in supply was largely absorbed by Pakistan and China, whose imports fell by more than
half during the decade, while imports into developed countries rose marginally.
Global trade in jute fibre is projected to rebound over the next decade, but not to attain historical
levels. Global exports may reach 323 thousand tonnes by 2026, or about 9 percent of global
production, which is down considerably from its proportion of 10 years ago. Bangladesh, which
contributes 94 of all exports, will increase exports as its jute production will outpace growth in its
processing sector. Additional fibre exports are expected to be absorbed by India and Pakistan.
Figure 21 – Jute Production and Trade to 2026 (thousand tonnes)
Source: FAO IGG/HFJU Secretariat.
D. SISAL OUTLOOK
Sisal Production
31. World sisal production is projected to grow annually by 0.9 percent to 273 thousand tonnes by
2026, after having declined by 0.6 percent annually during the last decade, primarily due to a
significant fall in production in Brazil (Figure 22). Growth in production is anticipated to continue in
0
500
1000
1500
2000
2500
3000
3500
4000
2000 2005 2010 2015 2020 2025
Production Exports Fibre

CCP:HF/JU 17/CRS 1 15
key countries of Africa, namely Tanzania, Kenya and Madagascar, which may grow by 2.5 percent,
1.1 percent and 3.6 percent respectively. Collectively, the production share of African countries is
anticipated to rise to 35 percent by 2026, an increase of 5 percent. Growth is also anticipated to
continue in China, the world’s second largest sisal producer, although at a reduced pace from the
previous decade. A key uncertainty is the prospect for Brazil, and while it is expected to maintain its
dominance as the largest producer, its market share in total production may fall to levels as low as 32
percent, down from 44 percent in 2010.
Sisal Trade
32. Global trade in sisal is anticipated to remain stagnant over the medium term, with exports at
about 91 thousand tonnes in 2026. The share of exports by African countries will rise considerably to
61 percent by 2026, while that of Brazil continues to fall to about 32 percent. The share of sisal
imports by both China and the EU is projected to fall, as rising import demand in countries such as
Morocco, Saudi Arabia and Algeria take a higher share of trade.
Figure 21 – Sisal Production and Trade to 2026 (thousand tonnes)
Source: FAO IGG/HFJU Secretariat.
E. ABACA OUTLOOK
Abaca production and trade
33. Global production of abaca continued its progressive decline during the last decade, to an
average of 81 thousand tonnes over the 2014-16 period (Figure 22). Growth by the major producers –
the Philippines and Ecuador – has recently taken hold, and the question is whether this growth will be
sustained by growing demand over the medium term. Global production is anticipated to grow slowly
to 84 thousand tonnes by 2026, with Ecuador capturing an increasing market share of production.
With rising production, abaca fibre trade will rebound somewhat from the low average of recent years,
and exports may reach 29 thousand tonnes by 2026, up from 25 thousand tonnes in the 2014-16 base
period. Ecuador, which exports all its raw fiber mainly to the EU, will see its export share rise toward
50 percent, as that of the Philippines falls to 37 percent.
F. COIR OUTLOOK
Coir Production
34. Global coir production remains the fastest growing fibre of the JACKS, having increased at a
compound annual rate of over 5 percent p.a. in the last decade, led by similar growth in India, the
largest producer with a 67 percent global share. Strong growth was also registered by virtually all
0
50
100
150
200
250
300
350
2000 2005 2010 2015 2020 2025
Production Exports Fibre
16 CCP:HF/JU 17/CRS 1
Asian producing countries, with very strong growth in some such as Vietnam and Sri Lanka (6 percent
p.a.), Indonesia (28 percent p.a.) and Thailand (5 percent p.a.). Global coir production is projected to
slow considerably, averaging 2 percent p.a. over the next decade and reaching 1 350 thousand tonnes
(Figure 22). The basis for expected slower growth is the considerably higher base volume which the
industry has attained in major markets, declining market prices under higher supplies and the slow to
declining growth of the coconut sector which provides fibre feedstock. However, considerable supply
capacity still exists, and growth could be higher than projected.
Figure 22 – Abaca Production and Trade to 2026
Source: FAO IGG/HFJU Secretariat.
Coir Trade
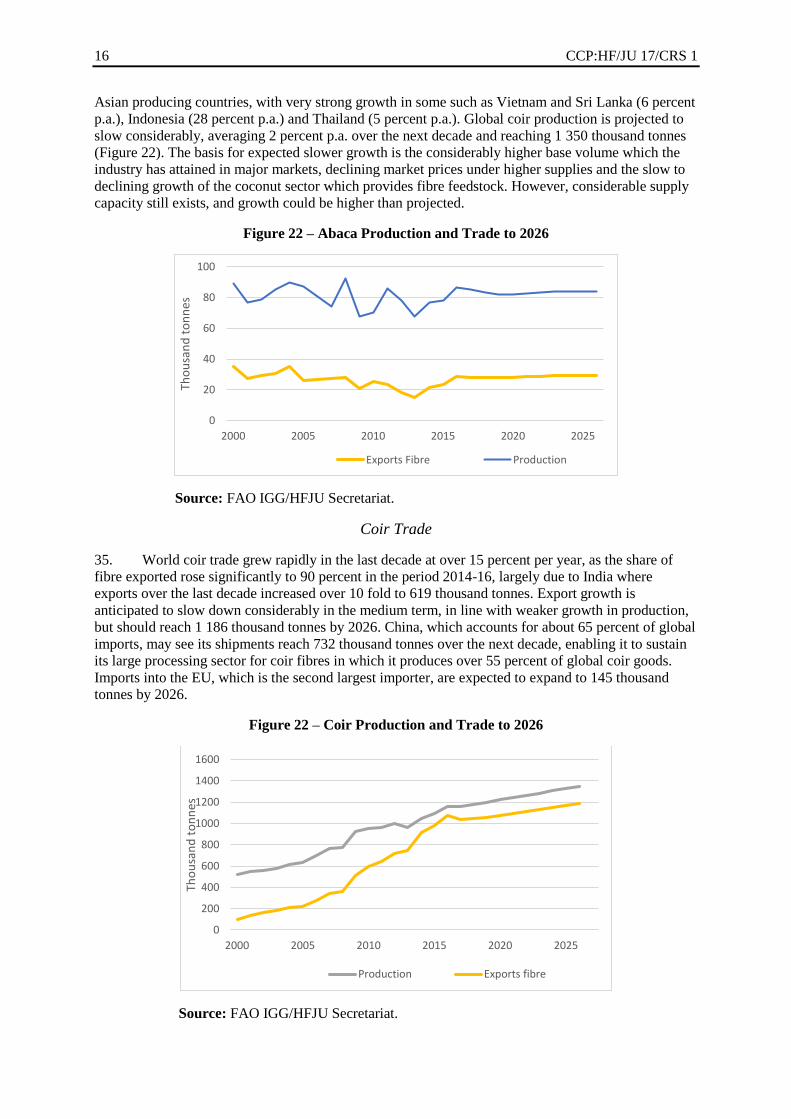
35. World coir trade grew rapidly in the last decade at over 15 percent per year, as the share of
fibre exported rose significantly to 90 percent in the period 2014-16, largely due to India where
exports over the last decade increased over 10 fold to 619 thousand tonnes. Export growth is
anticipated to slow down considerably in the medium term, in line with weaker growth in production,
but should reach 1 186 thousand tonnes by 2026. China, which accounts for about 65 percent of global
imports, may see its shipments reach 732 thousand tonnes over the next decade, enabling it to sustain
its large processing sector for coir fibres in which it produces over 55 percent of global coir goods.
Imports into the EU, which is the second largest importer, are expected to expand to 145 thousand
tonnes by 2026.
Figure 22 – Coir Production and Trade to 2026
Source: FAO IGG/HFJU Secretariat.
0
20
40
60
80
100
2000 2005 2010 2015 2020 2025
Tho
usa
nd
to
nn
es
Exports Fibre Production
0
200
400
600
800
1000
1200
1400
1600
2000 2005 2010 2015 2020 2025
Tho
usa
nd
to
nn
es
Production Exports fibre

CCP:HF/JU 17/CRS 1 17
IV. CONCLUDING REMARKS
36. The medium term prospects for the JACKS sector are conditioned by the macroeconomic and
broader agricultural environment surrounding them. Prospects for economic growth in most
developing and developed countries appear moderately strong, compared to historical rates, with an
important exception of China, where growth is slowing. Energy prices and those for associated by-
products are relatively low, but are expected to rise moderately. Most global agricultural crop prices
are anticipated to remain lower in real terms compared to past peaks, but to rise marginally in nominal
terms over the decade. The main implication for this setting is for low energy related input costs and
synthetic fibre prices, and some incentives to increase production where fibre crops compete for land
resources with other crops. While economic growth will encourage higher demand for all fibres,
competition from synthetic fibres, given their lower prices, may be stronger in the next decade than in
the past one. A key question is the extent to which this competition matters, in the context of the
changing demand for natural fibres. While transport costs for raw fibre have been reduced with lower
energy costs, labour costs have continued to escalate in key countries such as India, China and Brazil.
Such changes encourage the diversification of trade patterns for raw and processed products toward
lower cost countries, and for sisal in particular, these include a number of key African suppliers such
as Tanzania, Kenya and Madagascar.
37. Global jute and hard fibre production has grown at about 0.8 percent annually in the last
decade, and is projected to increase slightly in the next decade, at 0.9 percent p.a. This growth is
largely due to increases in coir production, particularly in China. These trends mask the actual
variability of annual production, which will remain an important feature of the sector in the years to
come. The supply of fibres is increasingly concentrated in a few developing countries, particularly
those in South and Southeast Asia. For jute, India and Bangladesh will remain the dominant suppliers
with a 96 percent production share that should persist over the next decade. For sisal, the production
share is somewhat more disperse, but nevertheless the top 5 suppliers (Brazil, China, Tanzania, Kenya
and Haiti) will continue to provide over 90 percent of production, but Brazil’s share is projected to fall
in comparison to that of China, Tanzania and Kenya. For abaca, the Philippines is anticipated to retain
its dominant share, while Ecuador’s share is expected to rise from 14 percent in 2016 to 23 percent by
2026. For coir, the major 5 producers (India, Vietnam, Sri Lanka, Thailand and Indonesia) will
continue to supply about 96 percent of production, with India’s share continuing to dominate at over
60 percent. Given the concentrated structure of raw fibre supply, exchange rate movements may play
an important role in profitability, particularly in key suppling countries such as India (jute and coir),
Bangladesh (jute), Brazil (sisal) and the Philippines (abaca). Exchange rates and domestic inflation
will also play an important role in fibre goods production and trade as they affect competitiveness
among suppliers, as well as import demand by processors.


