
Collaboration: Challenges and Opportunities for Developing
Analysis Scripts
Mat Soukup, Ph.D.Team Lead Biometrics 7FDA/CDER
46th Annual MeetingWashington, DC - 2010
Disclaimer
• The views and opinions expressed in the following PowerPoint slides are those of the individual presenter and should not be attributed to the Food and Drug Administration.
2

46th Annual MeetingWashington, DC - 2010
Outline
I. Defining Today’s Statistical
Environment
II. Capitalizing on The Wiki Way
III. Working Towards a Solution
46th Annual MeetingWashington, DC - 2010
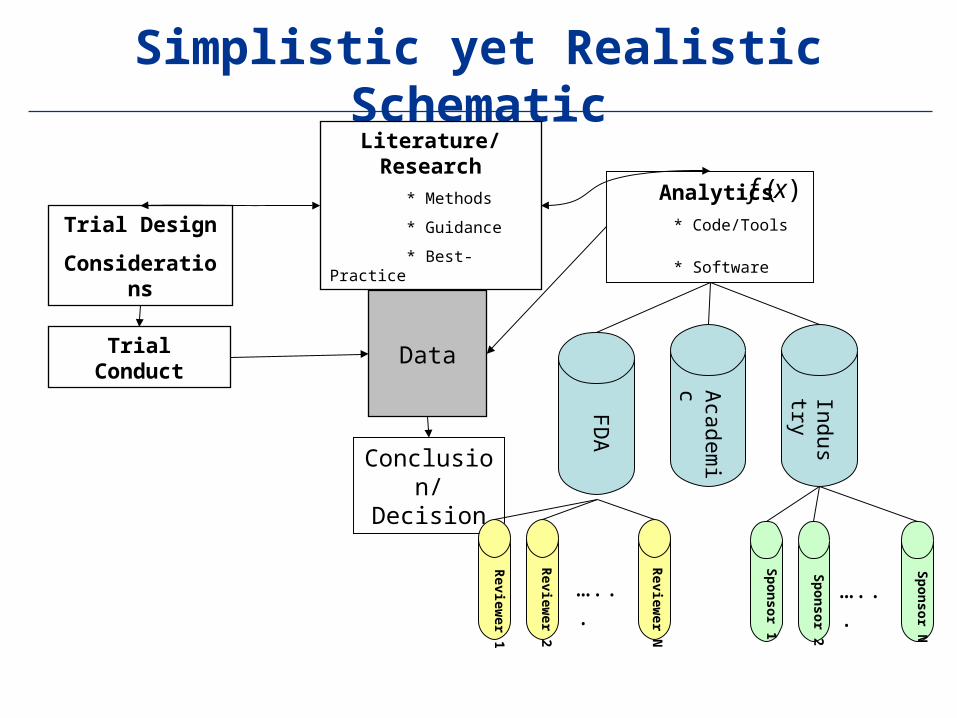
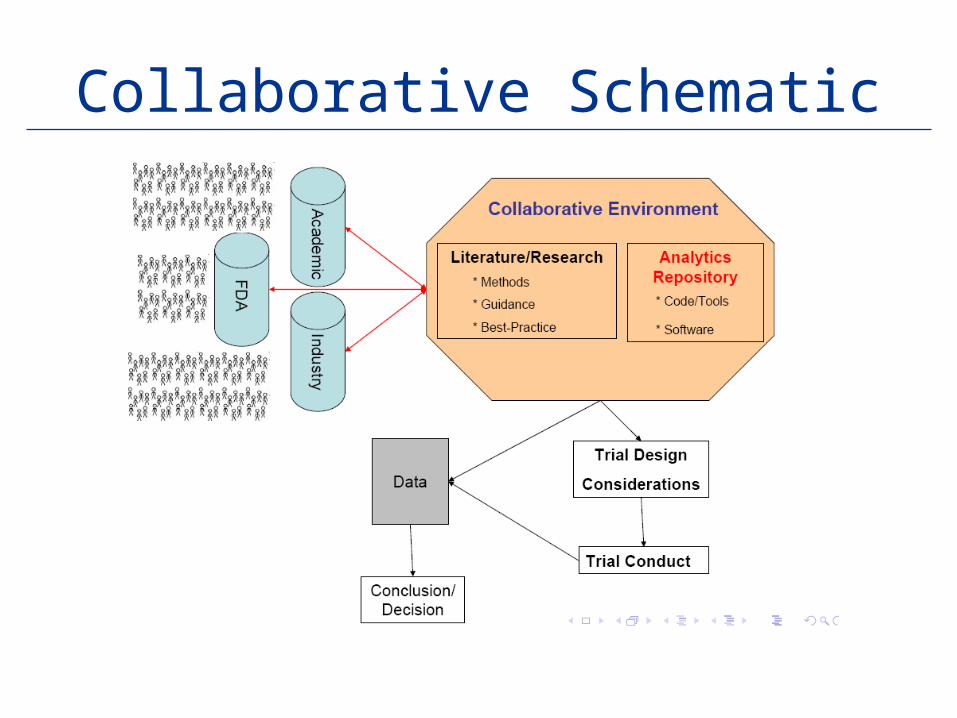
Simplistic yet Realistic Schematic
4
Data
Analytics
* Code/Tools
* Software
Conclusion/Decision
Trial Design
Considerations
Literature/Research
* Methods
* Guidance
* Best-Practice
)(xf
FD
A
Academ
ic
Industry
Trial Conduct
Review
er 1
Review
er 2
Review
er N
Sp
on
sor 1
Sp
on
sor 2
Sp
on
sor N
…... …...
46th Annual MeetingWashington, DC - 2010
The Problem
5
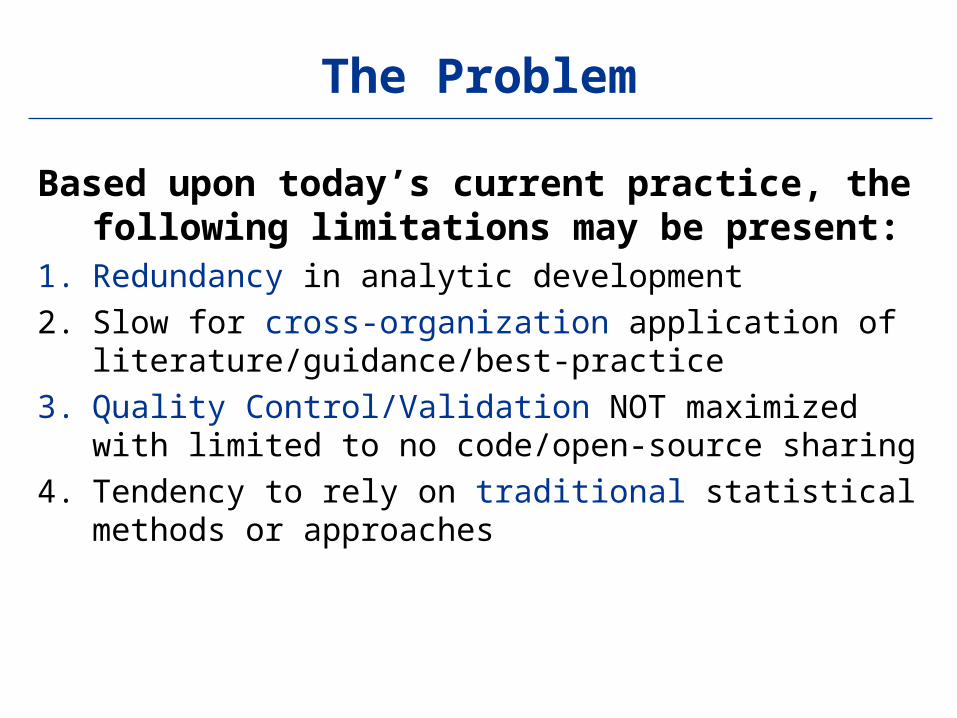
Based upon today’s current practice, the following limitations may be present:
1. Redundancy in analytic development
2. Slow for cross-organization application of literature/guidance/best-practice
3. Quality Control/Validation NOT maximized with limited to no code/open-source sharing
4. Tendency to rely on traditional statistical methods or approaches

46th Annual MeetingWashington, DC - 2010
Illustrative Example: Efficacy by Site
6
A Graphic….

46th Annual MeetingWashington, DC - 2010
Illustrative Example: Efficacy by Site
7
"efficacy.by.site" <-function(yy, site, trt, type="b", legend=FALSE, ...){ nms <- names(list(...)) ss <- summarize(yy, llist(site, trt), mean) n <- summarize(yy, llist(site, trt), length)
sdat <- data.frame(ss, n[,3]) names(sdat) <- c("Site", "Trt", "Mean", "N")
if(type=="b"){ nsn <- length(unique(sdat$Site)) ut <- unique(sdat$Trt) rnx <- tabulate(as.factor(sdat$Site)) sdat$plotx <- rep(1:nsn, rnx[rnx>0]) # Creation of the figure. if("ylab" %in% nms) plot(c(.5, nsn+.5), c(min(sdat$Mean)-.05, max(sdat$Mean)+.05), type="n", axes=FALSE, ...) else plot(c(.5, nsn+.5), c(min(sdat$Mean)-.05, max(sdat$Mean)+.05), type="n", ylab=paste(deparse(substitute(yy))), axes=FALSE) axis(1, at=1:nsn, labels=as.character(unique(sdat$Site)), cex.axis=.75, las=3) axis(2) box() if(length(ut)==2) sdat$plotx <- sdat$plotx + rep(c(-.05,.05), length(sdat[,1])/2) if(length(ut)==3) sdat$plotx <- sdat$plotx + rep(c(-.1,0,.1), length(sdat[,1])/3) if(length(ut)==4) sdat$plotx <- sdat$plotx + rep(c(-.15,-.05,.05,.15), length(sdat[,1])/4) for(k in 1:length(ut)){ subdat <- subset(sdat, sdat$Trt==ut[k]) points(subdat$plotx, subdat$Mean, pch=trellis.par.get("superpose.symbol")$pch[k], col=trellis.par.get("superpose.symbol")$col[k]) for(j in 1:length(subdat$N)){ text(subdat$plotx[j]+.3, subdat$Mean[j], labels=subdat$N[j], col=trellis.par.get("superpose.symbol")$col[k], cex=.7) } } for(i in 1:nsn){ subdat <- subset(sdat, sdat$Site==unique(sdat$Site)[i]) lines(c(i,i), c(min(subdat$Mean), max(subdat$Mean)), lty=2, col='gray60') }}if(type=="nonly"){ nsn <- length(unique(sdat$Site)) ut <- unique(sdat$Trt) rnx <- tabulate(as.factor(sdat$Site)) sdat$plotx <- rep(1:nsn, rnx[rnx>0]) # Creation of the figure. if("ylab" %in% nms) plot(c(.5, nsn+.5), c(min(sdat$Mean)-.05, max(sdat$Mean)+.05), type="n", axes=FALSE, ...) else plot(c(.5, nsn+.5), c(min(sdat$Mean)-.05, max(sdat$Mean)+.05), type="n", ylab=paste(deparse(substitute(yy))), axes=FALSE) axis(1, at=1:nsn, labels=as.character(unique(sdat$Site)), cex.axis=.75, las=3) axis(2) box() for(k in 1:length(ut)){ subdat <- subset(sdat, sdat$Trt==ut[k]) for(j in 1:length(subdat$N)){ text(subdat$plotx[j], subdat$Mean[j], labels=subdat$N[j], col=trellis.par.get("superpose.symbol")$col[k], cex=.7) } } for(i in 1:nsn){ subdat <- subset(sdat, sdat$Site==unique(sdat$Site)[i]) lines(c(i,i), c(min(subdat$Mean), max(subdat$Mean)), lty=2, col='gray60') }}if(legend){ legend(.5, max(sdat$Mean+.05), legend=as.character(sort(unique(trt))), pch=trellis.par.get("superpose.symbol")$pch[1:length(ut)], col=trellis.par.get("superpose.symbol")$col[1:length(ut)], cex=.75, xjust=0) } }
R Code

46th Annual MeetingWashington, DC - 2010
Illustrative Example: Efficacy by Site
8
• Is the approach publicly available or does the public know about it?– Potentially, it’s been presented at several professional meetings.
• How to reproduce this visual representation?– Write your own code; ask the author.
• What if there are ways to improve the representations?– Publish/present at public meetings
• What if you have written sleek code, can you share it?– Not really; potentially with the author
• What if the code is written in a language my closed system does not run?– Rewrite it!

46th Annual MeetingWashington, DC - 2010
What We Know
9
1. Current environment can be improved upon
2. There is a large pool of talented and experienced researchers/biostatisticians/programmers that can be utilized
3. Collaboration among FDA, academia, and industry has the potential to alleviate/solve some of the current problems.
But HOW do we solve it?
46th Annual MeetingWashington, DC - 2010
Outline
I. Defining Today’s Environment
II. Capitalizing on The Wiki Way
III. Working Towards a Solution

46th Annual MeetingWashington, DC - 2010
The Wiki Way
11
• Most popular and HIGHLY successful Wiki: Wikipedia• Definition: A wiki is a website that uses wiki software, allowing
the easy creation and editing of any number of interlinked Web pages, using a simplified markup language [source: Wikipedia].
• Creation/Editing is done via the web browser - no fancy software is required.
• Community of users add/edit content → pages/website is not static but ALIVE!
• Invokes user participation to create or collaborate.• Subject to GNU-GPL regulations making them free software
programs.

46th Annual MeetingWashington, DC - 2010
Wikipedia Screenshot
12
Edit HistoryDiscussion
Navigation
Search
46th Annual MeetingWashington, DC - 2010
Wiki Strengths and Weaknesses
13
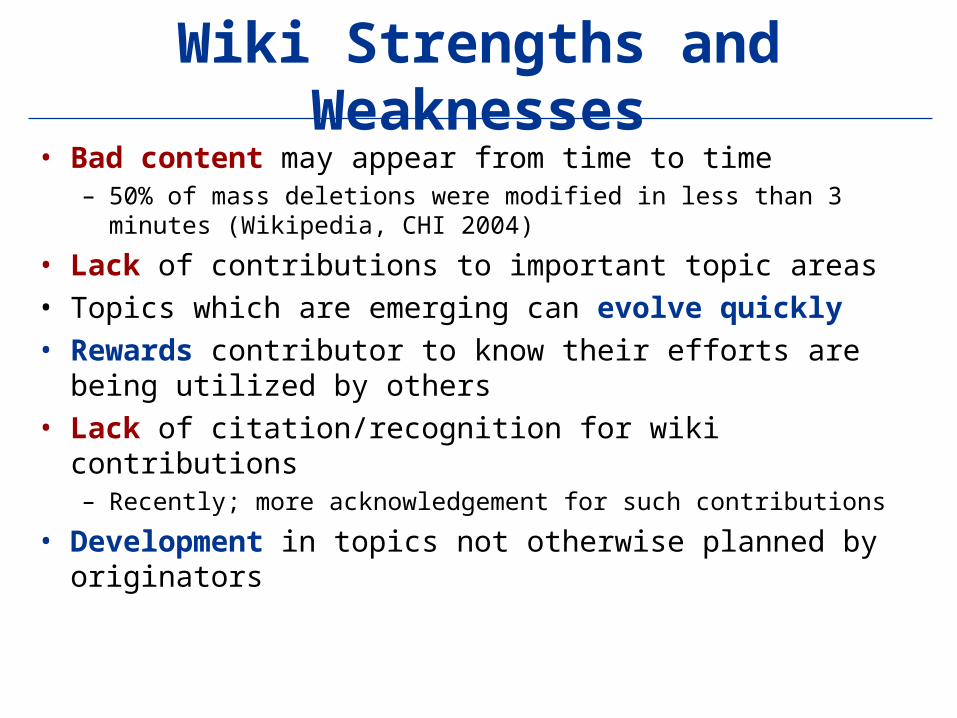
• Bad content may appear from time to time– 50% of mass deletions were modified in less than 3 minutes
(Wikipedia, CHI 2004)
• Lack of contributions to important topic areas• Topics which are emerging can evolve quickly• Rewards contributor to know their efforts are being utilized
by others• Lack of citation/recognition for wiki contributions
– Recently; more acknowledgement for such contributions
• Development in topics not otherwise planned by originators

46th Annual MeetingWashington, DC - 2010
What We Learned
14
1. Wikis provide open access to information which is provided by a community of users
2. The technology is straight-forward and can be easy to use
3. The technology is dynamic and offers advantages to static websites
4. A wiki can be highly successful as a medium for others to collaborate
But HOW do we apply it to our problem?

46th Annual MeetingWashington, DC - 2010
Outline
I. Defining Today’s Environment
II. Capitalizing on The Wiki Way
III. Working Towards a Solution
46th Annual MeetingWashington, DC - 2010
Collaborative Schematic
46th Annual MeetingWashington, DC - 2010
Relying on a Community
17
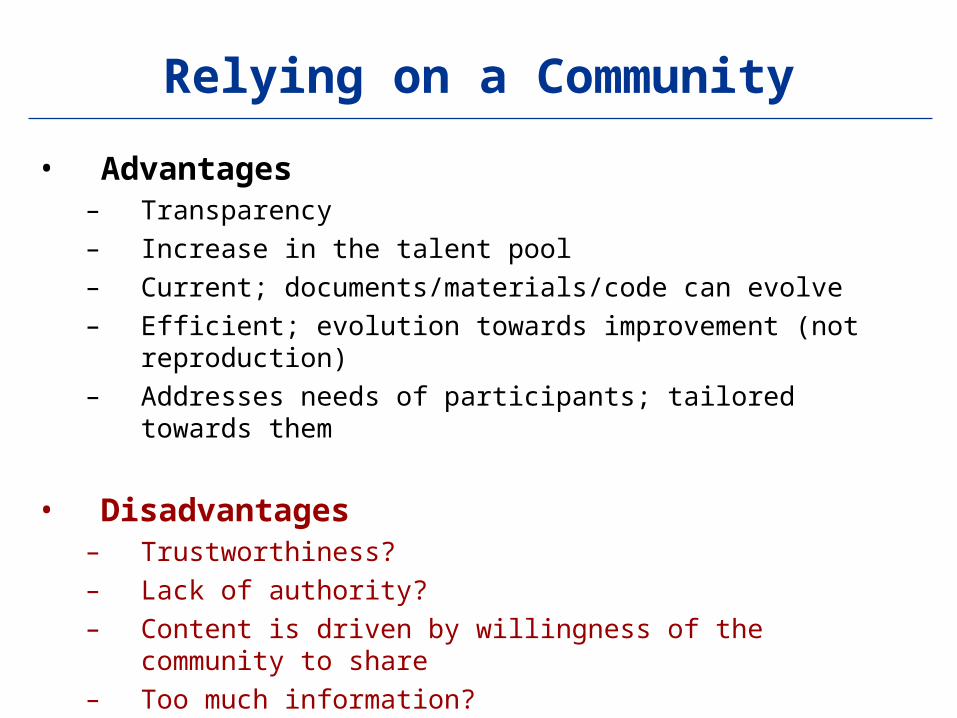
• Advantages– Transparency– Increase in the talent pool– Current; documents/materials/code can evolve– Efficient; evolution towards improvement (not reproduction)– Addresses needs of participants; tailored towards them
• Disadvantages– Trustworthiness?– Lack of authority?– Content is driven by willingness of the community to share– Too much information?

46th Annual MeetingWashington, DC - 2010
Keys to Success
18
• Identify KEY stakeholders• Develop an environment that meets the needs of ALL
potential contributors/consumers– Site organization/structure– Ease of use
• Publicity of the environment• Provide incentives to contribute• Provide metrics on environment usage• Ensure quality of contributions (rating system)• Environment monitoring

46th Annual MeetingWashington, DC - 2010
Challenges
19
Identifying the KEY stakeholders
Identifying resourcesHosting the environment (PhUSE)
Developing environment requirements (Workgroup Goal)
Provide content (Workgroup Goal)
Monitoring the environment (Workgroup Task)
Embracing a culture change– Move from internal sharing towards one where non-proprietary
information is shared publicly– Acceptance of open/public information– Adoption of a collaborative culture from ALL parties


