
1 | US DOE Geothermal Office eere.energy.gov
Public Service of Colorado Ponnequin Wind Farm
Geothermal Technologies Office 2015 Peer Review
Geothermal Power Generation and
CO2 Capture Co-Production
David J. Heldebrant, Mark D.
Bearden, Casie Davidson, Jake
Horner, Charles M. Freeman
Pacific Northwest National
Laboratory
Project Officer: Tim Reinhardt, Holly Thomas
Total Project Funding: $200,000
May 12, 2015
This presentation does not contain any proprietary
confidential, or otherwise restricted information.
Coal-Fired Power Plant

2 | US DOE Geothermal Office eere.energy.gov
Relevance/Impact of Research
• The program aims to aid the Low Temperature and Systems Analysis programs by
demonstrating the techno-economic viability of a hybrid coal-geothermal plant.
• This program identifies viability of marginalizing geothermal capital into larger
infrastructure, where geothermal can provide heat duty to power energy-intensive
units of operation at smaller capital costs.
– Hybridization may enable reaching GTO’s target 6c/kW by combining
geothermal infrastructure to capital expenditures of existing plants.
– Hybrid plants are large enough that only a handful of plants make significant
progress towards GTO’s target of 3 GWe installed capacity.
• This program is novel in that it investigates integration of direct-use, low
temperature geothermal resources to coal plants with and without carbon capture
and sequestration (CCS), aiding both DOE missions.
– Aids GTO by identifying areas for large scale deployment at candidate plants
and providing higher power generation than stand alone ORCs.
– Aids CCS by efficiently powering CO2 capture infrastructure, enhancing coal
plant efficiency.
3 | US DOE Geothermal Office eere.energy.gov
Relevance/Impact of Research
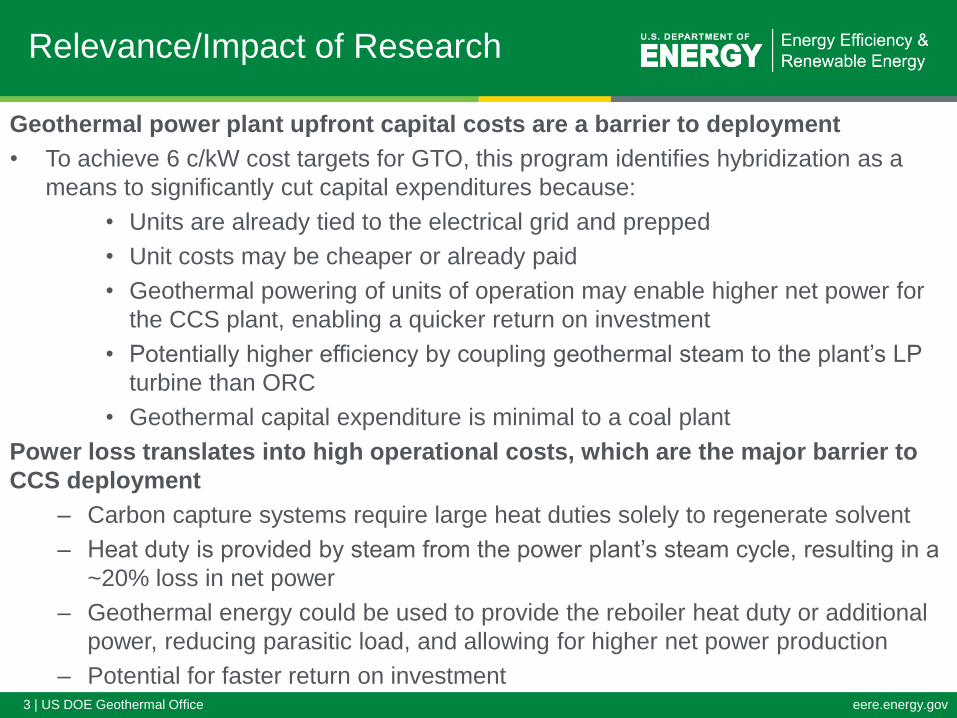
Geothermal power plant upfront capital costs are a barrier to deployment
• To achieve 6 c/kW cost targets for GTO, this program identifies hybridization as a
means to significantly cut capital expenditures because:
• Units are already tied to the electrical grid and prepped
• Unit costs may be cheaper or already paid
• Geothermal powering of units of operation may enable higher net power for
the CCS plant, enabling a quicker return on investment
• Potentially higher efficiency by coupling geothermal steam to the plant’s LP
turbine than ORC
• Geothermal capital expenditure is minimal to a coal plant
Power loss translates into high operational costs, which are the major barrier to
CCS deployment
– Carbon capture systems require large heat duties solely to regenerate solvent
– Heat duty is provided by steam from the power plant’s steam cycle, resulting in a
~20% loss in net power
– Geothermal energy could be used to provide the reboiler heat duty or additional
power, reducing parasitic load, and allowing for higher net power production
– Potential for faster return on investment

4 | US DOE Geothermal Office eere.energy.gov
Accomplishments, Results and Progress
• Accomplishments/Progress to date.
– (FY14 TEA) Hybridization COE of coal-fired power plants 5.93 cents/kWh (from
6.02) without CCS, and 10.72 cents/kWh (from 11.01) for coal plants with CCS
– Potential for installed capacity of 19 MWe per plant with 10 candidate sites
bringing potential for 190 MWe total capacity.
– Manuscript in preparation.
• Project work was halted until funding arrived. 25k was received in October, and 40k
in February, 75k in March. The program is now running as scheduled and is on track
to meet target milestones and deliverables.
Original Planned Milestone/
Technical Accomplishment
Actual Milestone/Technical
Accomplishment
Date
Completed
Completion of initial techno-economic
analysis
Confirmed hybridization can meet cost
and deployment metrics
10/10/2014
Complete detailed geothermal
resource report
Started, 2/15/2015 Scheduled
6/30/2015
Revised process simulation with site
conditions
Scheduled 6/30/2015 Scheduled
6/30/2015
Completion of site-specific techno-
economic analysis
N/A Scheduled
9/29/2015
5 | US DOE Geothermal Office eere.energy.gov
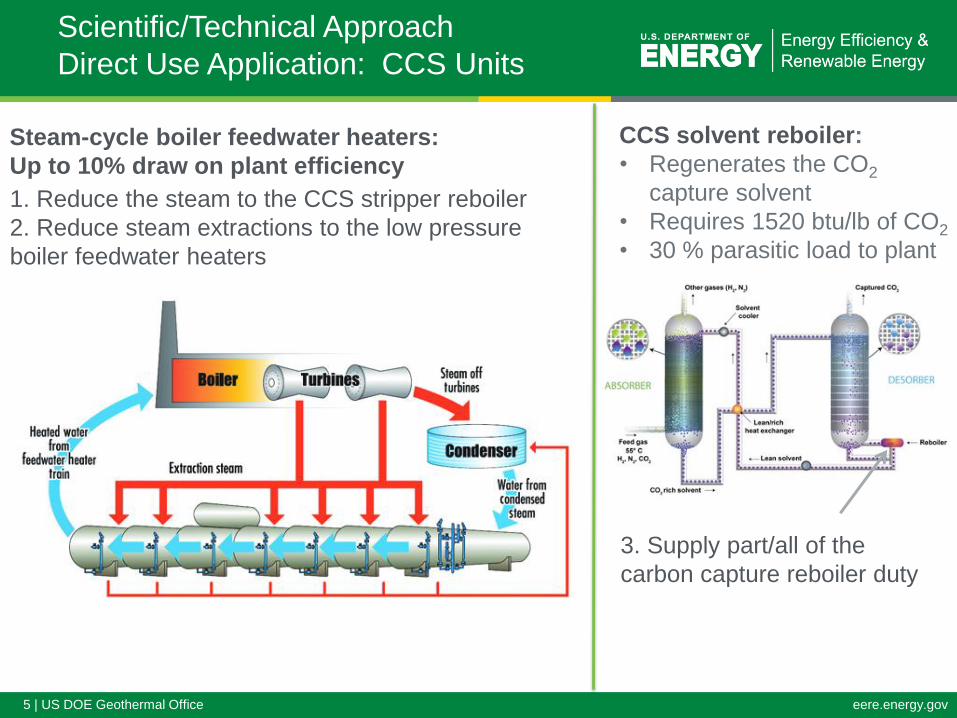
Scientific/Technical Approach
Direct Use Application: CCS Units
1. Reduce the steam to the CCS stripper reboiler
2. Reduce steam extractions to the low pressure
boiler feedwater heaters
3. Supply part/all of the
carbon capture reboiler duty
CCS solvent reboiler:
• Regenerates the CO2
capture solvent
• Requires 1520 btu/lb of CO2
• 30 % parasitic load to plant
Steam-cycle boiler feedwater heaters:
Up to 10% draw on plant efficiency

6 | US DOE Geothermal Office eere.energy.gov
Scientific/Technical Approach
Preliminary Site Selection (FY14)
PlantCapacity
(MW)
Location
(City, ST)
Vintage
(First, Last)
Approx Temp
@ 3.5 km (oC)
Apache 627 Cochise, AZ 1963, 2002 150
Boardman 601 Boardman, OR 1980, 1980 125-150
Cherokee 730 Denver, CO 1957, 1988 125-175
Dolet Hills 720 Mansfield, LA 1986, 1986 150
Gardner 637 Moapa, NV 1965, 1983 150
Gibbons Creek 470 Grimes, TX 1983, 1983 150-175
Hayden 465 Hayden, CO 1965, 1976 125
North Valmy 521 Valmy, NV 1981, 1985 150
Pawnee 552 Brush, CO 1981, 1981 150
Pirkey 721 Hallsville, TX 1985, 1985 150
*Data on coal power stations c. 2011, from Platts; geothermal resource maps, Google Earth / World Energy Explorer
• 602 Coal-fired power plants have 125-150 ˚C
resource <3.5 km (364 GWe capacity)
• 10 candidate sites with most promise
• 190 MWe potential geothermal capacity
• 4 Final sites chosen with HIGH, MODERATE,
MARGINAL resource viability for study
!!
Apache!Power!Station!!Arizona!Electric!Power!!
Cooperative!!
Geothermal!Resource!Quality:!MODERATE!!
!!
!
North!Valmy!Station!Sierra!Pacific!Resources!
!Geothermal!Resource!Quality:!HIGH!!
!!
!!Boardman!Coal!Plant!Portland!General!Electric!
!Geothermal!Resource!
Quality:!MARGINAL!!!
!!!!
Hayden!Station!Xcel!Energy!!
Geothermal!Resource!Quality:!MARGINAL!
!
!Apache!Power!Station!!Arizona!Electric!Power!!
Cooperative!!
Geothermal!Resource!Quality:!MODERATE!!
!!
!
North!Valmy!Station!Sierra!Pacific!Resources!
!Geothermal!Resource!Quality:!HIGH!!
!!
!
!Boardman!Coal!Plant!Portland!General!Electric!
!Geothermal!Resource!
Quality:!MARGINAL!
!!
!!!!
Hayden!Station!Xcel!Energy!!Geothermal!Resource!Quality:!MARGINAL!
7 | US DOE Geothermal Office eere.energy.gov
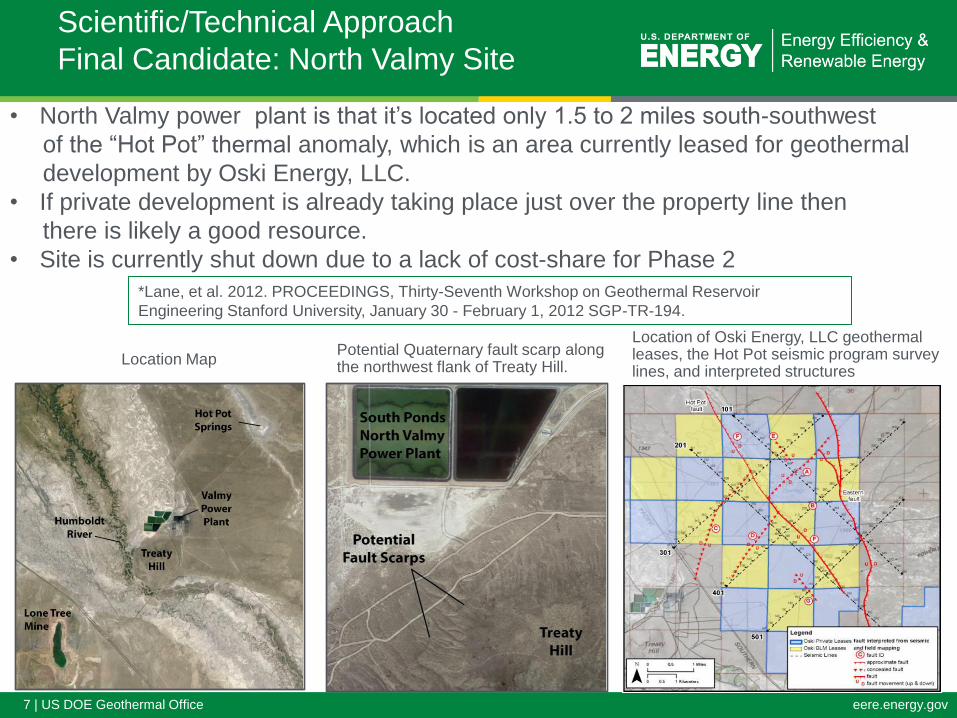
Scientific/Technical Approach
Final Candidate: North Valmy Site
• North Valmy power plant is that it’s located only 1.5 to 2 miles south-southwest
of the “Hot Pot” thermal anomaly, which is an area currently leased for geothermal
development by Oski Energy, LLC.
• If private development is already taking place just over the property line then
there is likely a good resource.
• Site is currently shut down due to a lack of cost-share for Phase 2
Location of Oski Energy, LLC geothermal leases, the Hot Pot seismic program survey lines, and interpreted structures
Potential Quaternary fault scarp along the northwest flank of Treaty Hill.
Location Map
*Lane, et al. 2012. PROCEEDINGS, Thirty-Seventh Workshop on Geothermal Reservoir
Engineering Stanford University, January 30 - February 1, 2012 SGP-TR-194.
8 | US DOE Geothermal Office eere.energy.gov
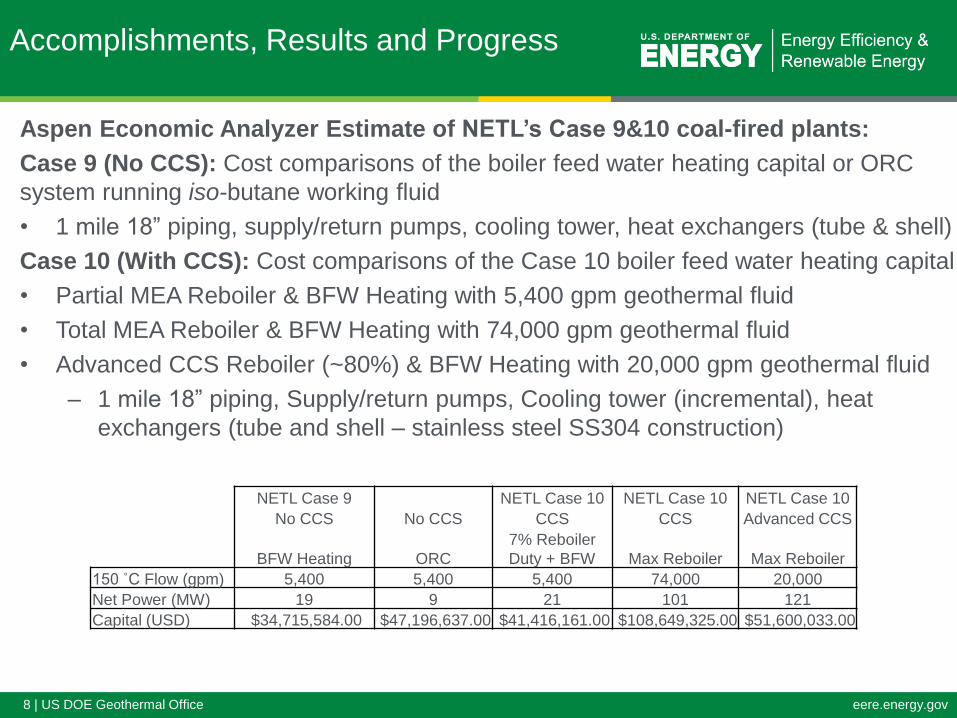
Accomplishments, Results and Progress
Aspen Economic Analyzer Estimate of NETL’s Case 9&10 coal-fired plants:
Case 9 (No CCS): Cost comparisons of the boiler feed water heating capital or ORC
system running iso-butane working fluid
• 1 mile 18” piping, supply/return pumps, cooling tower, heat exchangers (tube & shell)
Case 10 (With CCS): Cost comparisons of the Case 10 boiler feed water heating capital
• Partial MEA Reboiler & BFW Heating with 5,400 gpm geothermal fluid
• Total MEA Reboiler & BFW Heating with 74,000 gpm geothermal fluid
• Advanced CCS Reboiler (~80%) & BFW Heating with 20,000 gpm geothermal fluid
– 1 mile 18” piping, Supply/return pumps, Cooling tower (incremental), heat
exchangers (tube and shell – stainless steel SS304 construction)
NETL Case 9 NETL Case 10 NETL Case 10 NETL Case 10
No CCS No CCS CCS CCS Advanced CCS
BFW Heating ORC
7% Reboiler
Duty + BFW Max Reboiler Max Reboiler
150 ˚C Flow (gpm) 5,400 5,400 5,400 74,000 20,000
Net Power (MW) 19 9 21 101 121
Capital (USD) $34,715,584.00 $47,196,637.00 $41,416,161.00 $108,649,325.00 $51,600,033.00

9 | US DOE Geothermal Office eere.energy.gov
Accomplishments, Results and Progress
• SiteSite-specific cost parameters and resulting cost estimates for production and injection well requirements
• Drilling depths to reach a sufficient fluid temperature of 150°C with conservative gradient of 70°C/km to (90°C/km
• Drilling depths of approximately 5,000 feet (Case 1) and 6,600 feet (Case 2).
• Butler et al.10 reported that at the similar Beowawe site, produces from the same heavily fractured reservoir of interest for this project,
• 3,600 gpm (1.8 million lb/h), a per-well average of 1,200 gpm (600,000 lb/h)
• Assuming that this average rate could be replicated, process water needs • 5,400 gpm (2.7 million lb/h) could be met using 4 or 5 production wells
• Shevenell’s,11 review of efforts to estimate well drilling costs for geothermal projects in
Nevada can be used to assume 5 required production wells, would require 3 injection wells.
• Site-specific, conservative approach is consistent with the 2:1 ratio at Beowawe.
• Cost estimates for projection and injection wells done based on work by Shevenell,11 Klein et al,12 Bradys13 and Augustine et al.14

10 | US DOE Geothermal Office eere.energy.gov
• Site-specific cost parameters and resulting cost estimates for production and injection
well requirements at North Valmy
• Average per-well costs for production wells is between $1.2M and $1.6M each,
cost variance resulting from increased depth to reach 150 ˚C water in Case 2
(70 °C/km) relative to Case 1 (90 °C/km)
• Injection wells appear to cost about 5% more than production wells at Beowawe
5% adder was included in injection well cost estimates
Total well costs
• Based on averages and statistical
relationships
• Function of depth alone, assuming
avg well diameters
• Depth to recover 150 ˚C water:
Case 1 = 5,000 ft
Case 2= 6,600 ft
• Assumes typical drilling conditions
and standard well completions
Accomplishments, Results and Progress
Case 1 Case 2
Avg Temp Gradient, oC/km 90 70
Desired Temp, oC 150 150
Projected Drill Depth, ft 4,922 6,562
Per-Well Flow Rate, lb/h 600,000 600,000
Required Flow Rate, lb/h 2,500,000 2,500,000
Required Wells, Production 5 5
Required Wells, Injection 3 3
Production Well Costs, each 1,274,394$ 1,618,930$
Production Well Costs, total 6,371,969$ 8,094,651$
Injection Well Costs, each 1,338,114$ 1,699,877$
Injection Well Costs, total 4,014,341$ 5,099,630$
TOTAL WELL COSTS 10,386,310$ 13,194,281$

11 | US DOE Geothermal Office eere.energy.gov
Accomplishments, Results and Progress
LCOE Estimates and Summary of Costs
6.02 5.93 6.06 11.01 10.06 9.71 8.87 10.72 LCOE
(cents/kwh)
*LCOE values for modeled cases is based fuel, capital variable, fixed and TSM costs

12 | US DOE Geothermal Office eere.energy.gov
Accomplishments, Results and Progress
LCOE Estimates for Each Model Case
• 150°C geothermal water for boiler feed water preheating offers a higher net electric
power, at a comparable LCOE, compared to a stand-alone Case 9 sub-critical power
plant option.
• Stand-alone ORC is estimated to produce less overall net power (9 MWe) than for
boiler feed water preheating (19 MWe)
• For CCS, infeasible water requirements are needed to offset entire MEA (CO2
capture solvent) regeneration energy, though varying levels can be provided
depending on resource viability.
• (5,400 gpm) water can offset ~7% of a MEA reboiler duty, resulting in ~1% of
recovered net electric power lost to the overall CCS parasitic load, but at a similar
(high) LCOE to CCS alone.
• Advanced solvents (e.g. CO2BOLs) more feasible, with ~0.75cents per kWe-hr
projected LCOE savings and ~2 points of net electric power increase versus
CO2BOLs alone.
• Model case result could significantly change with higher (or lower) geothermal water
temperatures.

13 | US DOE Geothermal Office eere.energy.gov
Future Directions
• Schedule on site visit to North Valmy (Nevada) for on site analysis and discussions
with site operators encouraging development/deployment with both organizations
• Perform a site-specific lithography and resource analysis of a candidate site
– Specific resource temp and flows
– Regional lithography for detailed cost analysis of well drilling/stimulation
• Work with plant for optimal hybridization strategies of geothermal integration
• Cooling inlet air or the booster air compressor by integration with the heat
exchange network to reduce the main air compressor horsepower
• Reduction of cooling water temp for increased vacuum in the condenser
• Using geothermal steam in the coal-plant’s low-pressure steam turbine
Milestone or Go/No-Go Status & Expected Completion
Date
Complete detailed geothermal resource report Started, 6/30/2015
Revised process simulation with site conditions In progress, 6/30/2015
Completion of final techno-economic analysis N/A, 9/30/2015
*This program is translatable to other large–scale systems such as natural gas plants
and biorefineries. Potential for carbon sequestration with CO2 as working fluid.
14 | US DOE Geothermal Office eere.energy.gov
Results from FY14 ASPEN Plus modeling and Cost Analyzer:
• Direct-use hybridization generates more power to a coal-fired powerplant
than stand alone heat pumps
– 19 MWe for 150 ˚C water at 5,400 gpm (2.7 million lb/h) VS 9 MWe
ORC at the same flow rate
• Hybridization is projected to reduce the COE of coal-fired power plants 5.93
cents/kWh (from 6.02) without CCS, and 10.72 cents/kWh (from 11.01) for
coal plants with CCS
Mandatory Summary Slide

15 | US DOE Geothermal Office eere.energy.gov
Additional Information
Assumptions: 1) From Aspen Plus Simulation, 2) Calculated from Table Values, 3) From Aspen Economic Analyzer, 4) Average well cost estimates, 5)
Same as Case 9 or Case 10, 6) Assumes 23% of TPC, 7) MEA from Case 10, CO2BOLs from PNNL report, 8) Same as Case 9 or Case 10 normalized to
new net power.
NoCarbonCapture
(Case9reference:SubcriticalPC)
FuelCosts
TOTAL(STEAMTURBINE)POWER,kWe
PortionofTotalPowerfromORC,kWe
AUXILIARYLOADSUMMARY,kWe
CoalFeed,BoilerandAuxiliaries
CO2CapturePlantAuxiliaries
CO2Compression
CondensatePumps
CirculatingWaterPumps
GroundWaterPumps
CoolingTowerFans
TransformerLoss
GeothermalWellInjectionPumps
TOTALAUXILIARIES,kWe
NETPOWER,kWe
NetPlantEfficiency(HHV)
NetPlantHeatRate(Btu/kWh)
As-ReceivedCoalFeed(kg/h)
ThermalInput,kWt
TotalCO2ProductionRate(kg/h)
PercentCO2Captured
NoCarbonCapture
(Case9reference:SubcriticalPC)
WithCarbonCapture
(Case10reference:SubcriticalPCwithMEAcapturesolvent)
Case9Only
(recreated)
Case9with
geothermal
forBFW
heating
574,331 597,822
21,360 21,360
516 514
4,963 5,844
540 636
2,770 3,262
1,804 1,878
3,039
31,953 36,532
542,379 561,289
36.3% 37.5%
9,408 9,091
198,391 198,391
1,495,379 1,495,379
471,116 471,116
0% 0%
NoCarbonCapture
(Case9reference:SubcriticalPC)
WithCarbonCapture
(Case10reference:SubcriticalPCwithMEAcapturesolvent)
Case9with
geothermal
forBFW,but
throughORC[i-
Butane]first
588,505
15,767
21,360
512
5,896
641
3,291
1,848
3,039
36,587
551,918
36.9%
9,245
198,391
1,495,379
471,116
0%
WithCarbonCapture
(Case10reference:SubcriticalPCwithMEAcapturesolvent)
Case10Only
(recreated)
Case10with
geothermal
forBFW,but
for7%of
reboilerfirst
Case10with
geothermal
forBFW,but
for100%of
reboilerfirst
Case10with
lowviscosity
CO2BOLs
solventvs.
MEA(no
geothermal)
Case10w/
CO2BOLs,
BFWvia
geothermal
butfor90%of
reboilerfirst
668,950 695,453 830,588 760,890 807,486
30,470 30,470 30,470 30,470 30,470
19,231 19,268 19,584 27,660 19,584
48,790 48,790 48,790 48,790 48,790
405 432 723 405 707
10,199 10,984 14,221 10,199 13,486
930 1,001 1,296 930 1,229
7,791 8,383 10,854 7,791 10,293
2,337 2,429 2,901 2,337 2,821
3,039 50,879 7,954
120,152 124,796 179,718 128,581 135,333
548,799 570,657 650,870 632,309 672,153
26.1% 27.1% 31.0% 30.1% 32.0%
13,074 12,573 11,023 11,347 10,674
278,956 278,956 278,956 278,956 278,956
2,102,643 2,102,643 2,102,643 2,102,643 2,102,643
695,954 695,954 695,954 695,954 695,954
90% 90% 90% 90% 90%
WithCarbonCapture
(Case10reference:SubcriticalPCwithMEAcapturesolvent)
Assumptions
(listbelow)
1
5
1
9
1
5
1
1
1
1
2
2
2
2
5
5
5
5
GeothermalWaterFlow(lb/hr)
TotalGeothermalDuty(MMBtu/hr)
AnnualFuelCost($MM/year)
UtilizationFactor
FuelCost(¢/kWe-hr)
0 2,695,600
0 517
$62.2 $62.2
85% 85%
1.54 1.49
2,695,600
517
$62.2
85%
1.51
0 2,695,600 37,000,000 0 10,000,000
0 517 2,577 0 1,605
$87.4 $87.4 $87.4 $87.4 $62.2
85% 85% 85% 85% 85%
2.14 2.06 1.80 1.86 1.24
1
1
2
5
2


