CNW INVESTMENT CLUB:
Market Awareness
Nick Fosco
Feb 27, 2016
1
2

3
4

Nick’s Bio:
• Opened first broker account 1979, after joining an investment club. Have
been actively self-managing my accounts since.
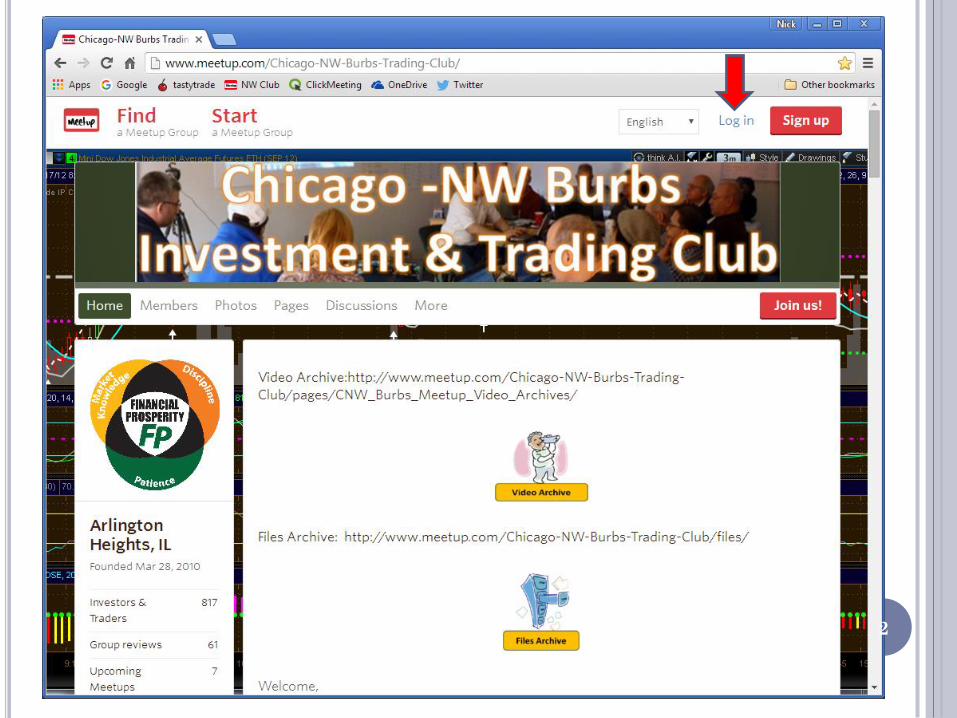
Founded CNW-Burbs Trading club March 2010
• Goal: Learn through knowledge sharing.
• Motto: The more I teach the more I learn.
• Created CNW Investment & Trading Course Sept. 2012
• Course taught live nine times.
• Now offered via ‘On Demand’ recordings.
• Corporate World
• 23 yrs (Project Design Management)
• 10 yrs (Business Product Management)
• Degrees: MSEE & MBA
• email: [email protected]
• LinkedIn: https://www.linkedin.com/in/nickfosco 5

6
https://www.tastytrade.com/tt/learn/market-awareness
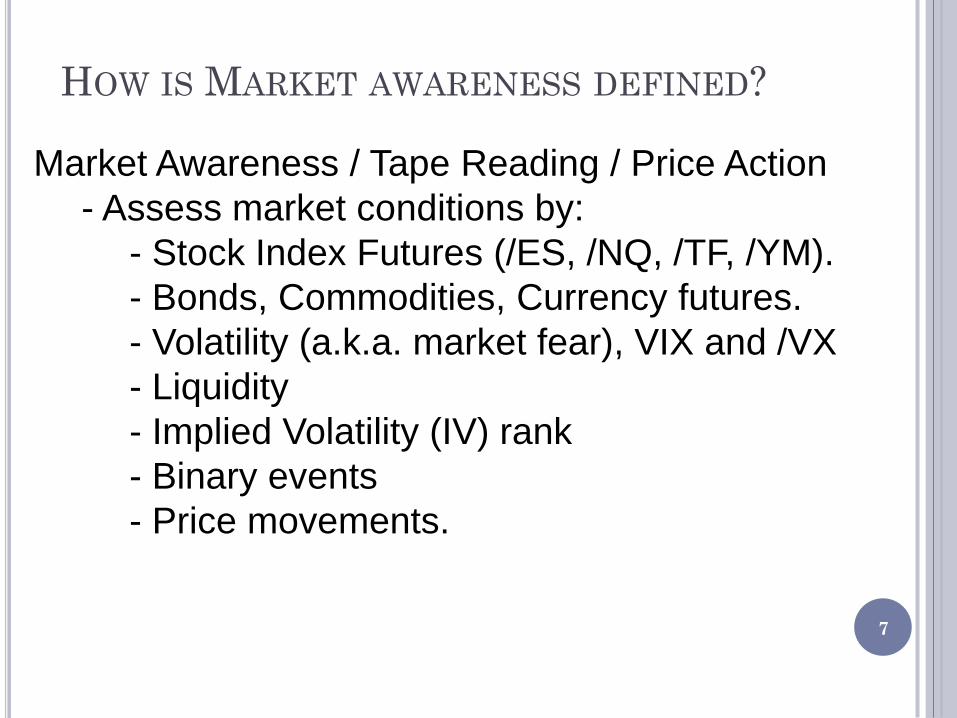
HOW IS MARKET AWARENESS DEFINED?
Market Awareness / Tape Reading / Price Action
- Assess market conditions by:
- Stock Index Futures (/ES, /NQ, /TF, /YM).
- Bonds, Commodities, Currency futures.
- Volatility (a.k.a. market fear), VIX and /VX
- Liquidity
- Implied Volatility (IV) rank
- Binary events
- Price movements.
7
ARE THERE ANY TOOLS AND RULES?
Tastytrade says:
- Markets are random and tools are useless.
- Market opinion is at best 50/50 guess.
- Price extreme is an ‘intuitive’ guess.
- Requires multiple years of market study.
Nick says:
- Use Technical Analysis to help point the way.
- Implied Volatility, Trend, Momentum,
Support/Resistance, Cycles/Waves, Fractals.
8

Remembering the Technical Analysis Tools
1) Trends
2) Momentum
3) Support & Resistance
4) Cycles or Waves
5) Fractals
‘Too Many SeRious CoW Farmers’
WHY USE TECHNICAL ANALYSIS?
• What do all technical indicators have in common? • Are derived from historical price data.
• Are by definition ‘lagging’ indications of market data.
• Why use TA if it is a ‘Lagging’ market indication? • Markets are not rational.
• Provides insight into ‘current’ investor’s view.
• Help identify short & long term market direction.
• T A helps identify Price Patterns for different timeframes.
• Lagging is only true for the time frame under analysis.
• TA is ‘leading’ indication for higher timeframes.
10
11
About Technical Indicators
A well-trained eye will be able to see the wave structure as well as
chart formations without the use of technical indicators. However,
there are many times when indicators can serve as a crutch for the
eye and aid in picking out patterns or adding overall structure to the
price data. Looking at the patterns that the waves form is an
OBJECTIVE technique with which hard and fast rule-sets can be
applied. Bar Chart formations are SUBECTIVE, in that it is easier for
the human eye to see what it wants to see or erringly note a bull flag
when the market is still in the middle of a trading range.
There is no such thing as a right or wrong technical indicator or
parameter setting for an oscillator or moving average. Understand
that there is little statistical edge in any of these tools as their main
purpose is to highlight patterns. As a rule of thumb, it is better to use
fewer rather than more indicators. Source: Linda B. Raschke; Professional Trading Techniques; Copyright 2012 LBRGroup, Inc. (See Session 3 materials)
IMPLIED VOLATILITY
http://www.investopedia.com/terms/i/iv.asp
IV is the estimated volatility of a security's price. In general,
implied volatility increases when the market is bearish. This is
due to the common belief that bearish markets are more risky than
bullish markets.
People buy Put options in SPX to protect their positions
because they believe market will go down. Thus people ‘FEAR’
that the market will drop. VIX also known as FEAR index.
Complacency VIX < 15
Fear VIX > 15

VIX INDEX
Weighted average of all S&P 500 option prices.
Represents S&P 500 index annualized percentage move.
Example: VIX = 15; S&P move of +/- 15% over 1 year.
Expected probably of 68%. (1 Standard Deviation)
A 1 SD Daily 1% predicted S&P move is:
VIX @ 19 correlates to SPX daily movement of 1 %.
×

VIX & SPX
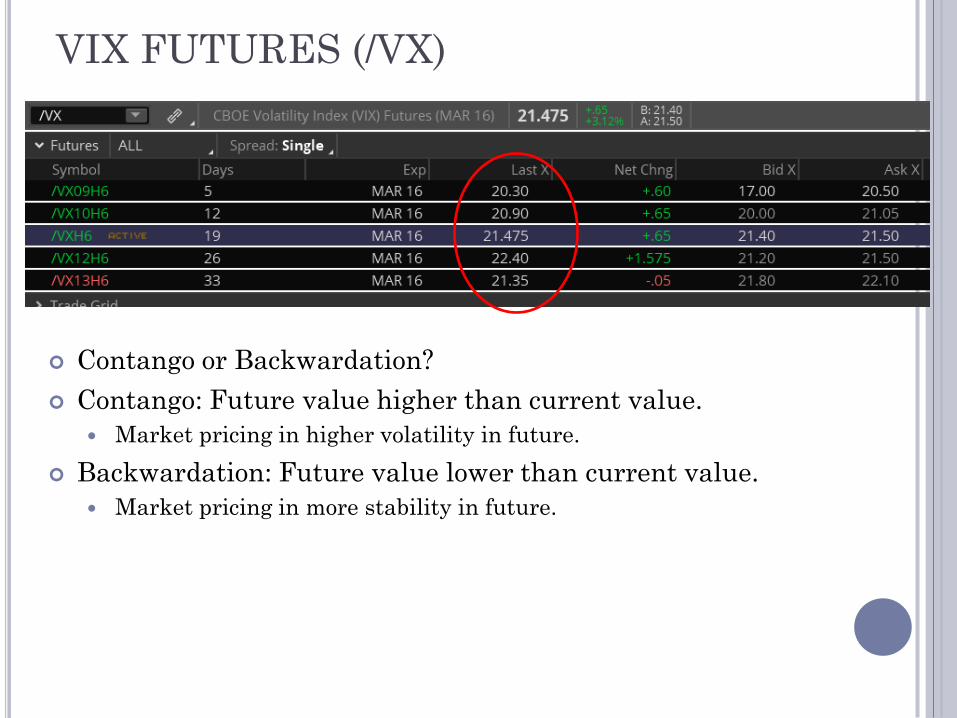
VIX FUTURES (/VX)
Contango or Backwardation?
Contango: Future value higher than current value.
Market pricing in higher volatility in future.
Backwardation: Future value lower than current value.
Market pricing in more stability in future.

Downward Trends
Lower Swing Highs
Lower Swing Lows
Trends: Direction and Support/Resistance
Upward Trends
Higher Swing Highs
Higher Swing Lows
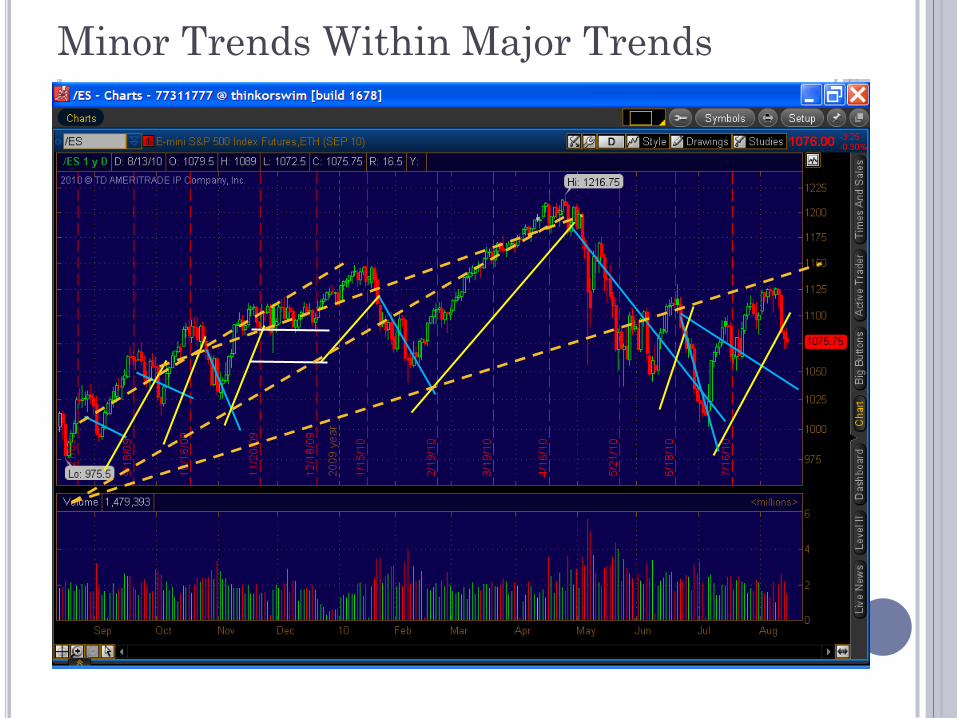
Minor Trends Within Major Trends
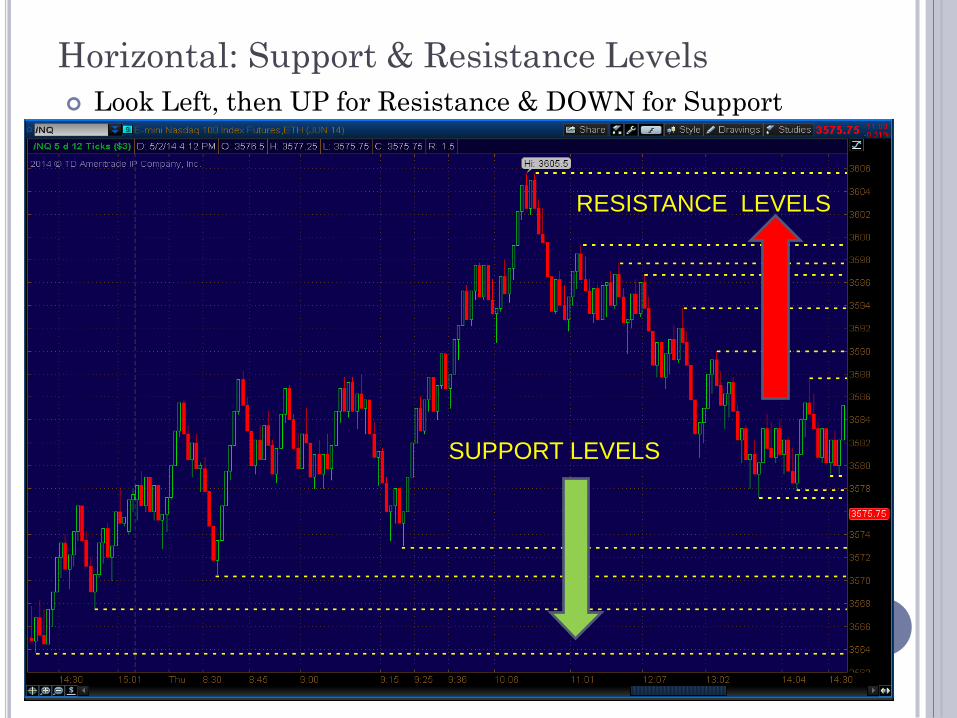
Horizontal: Support & Resistance Levels
Look Left, then UP for Resistance & DOWN for Support
SUPPORT LEVELS
RESISTANCE LEVELS
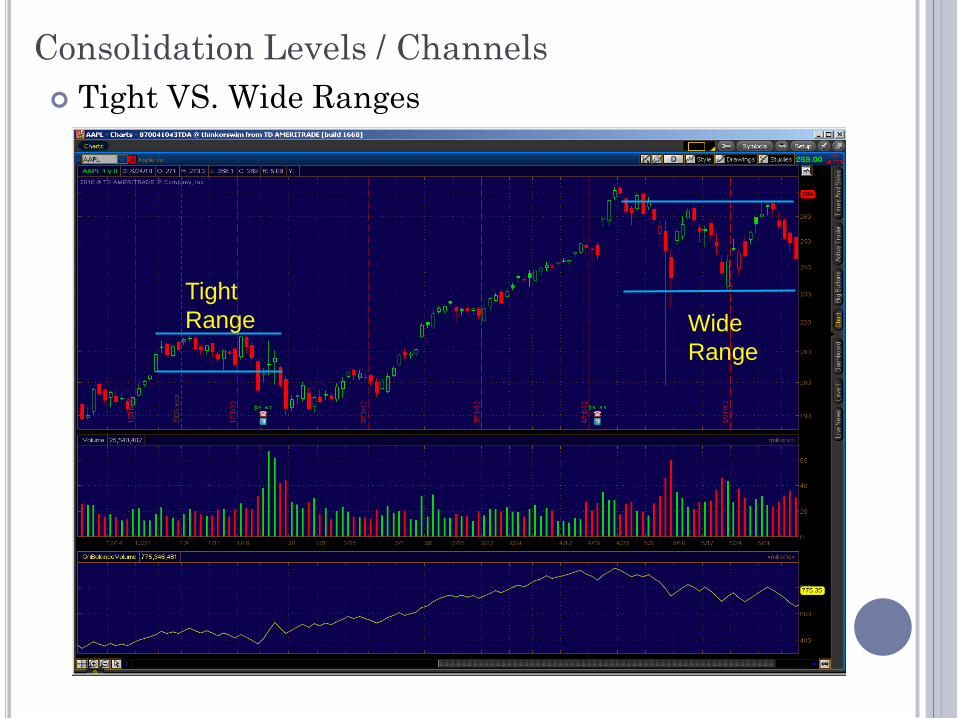
Consolidation Levels / Channels
Tight VS. Wide Ranges
Tight
Range Wide
Range

Moving Averages: (Trend and S/R)
Slope of MA provides trend direction.
Used as price support/resistance.
Very widely used by many traders and thus self-fulfilling
Popular MAs; 8, 10, 20, 50, 200
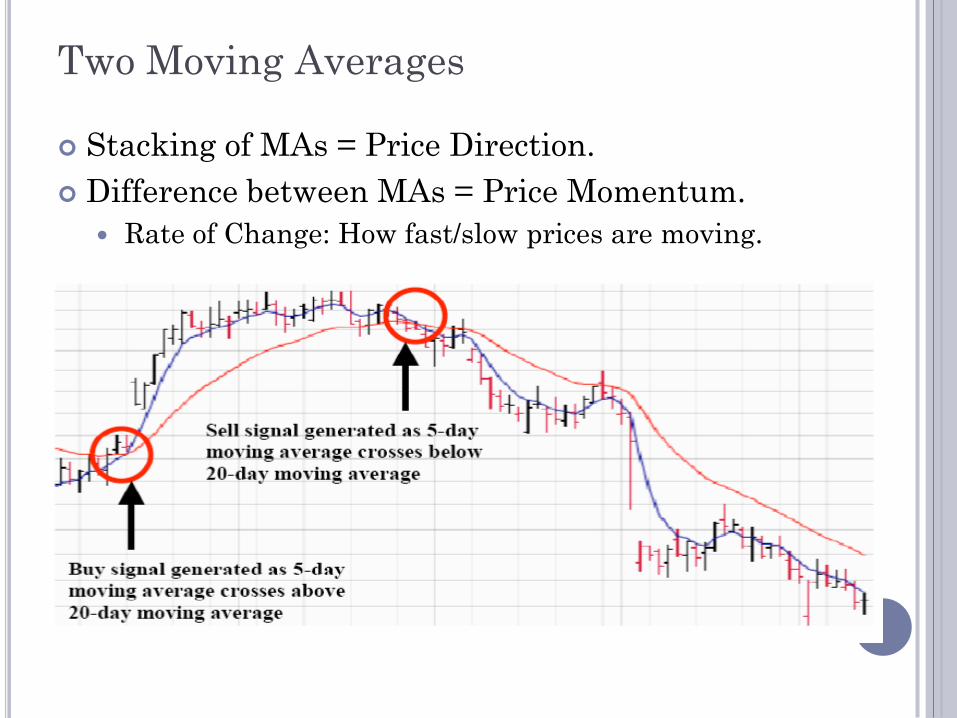
Two Moving Averages
Stacking of MAs = Price Direction.
Difference between MAs = Price Momentum.
Rate of Change: How fast/slow prices are moving.
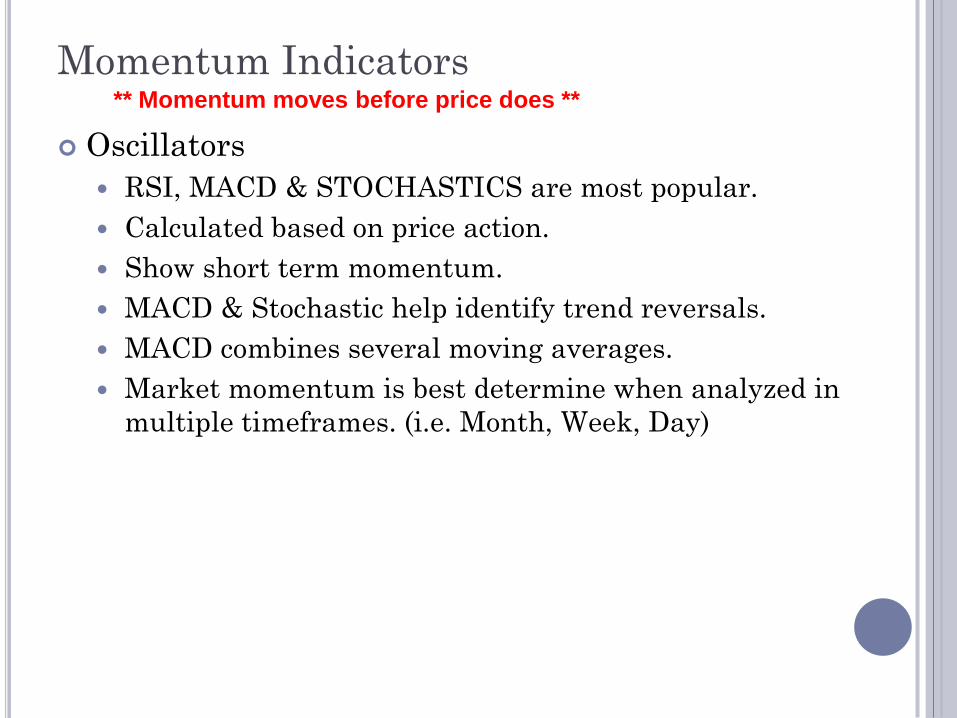
Momentum Indicators
Oscillators
RSI, MACD & STOCHASTICS are most popular.
Calculated based on price action.
Show short term momentum.
MACD & Stochastic help identify trend reversals.
MACD combines several moving averages.
Market momentum is best determine when analyzed in
multiple timeframes. (i.e. Month, Week, Day)
** Momentum moves before price does **

MACD
Description
The MACD is a momentum indicator used to show
the relationship between two moving averages.
MACD fast line is the difference between two
exponential moving averages.
Default EMAs are 12 and 26 periods.
23
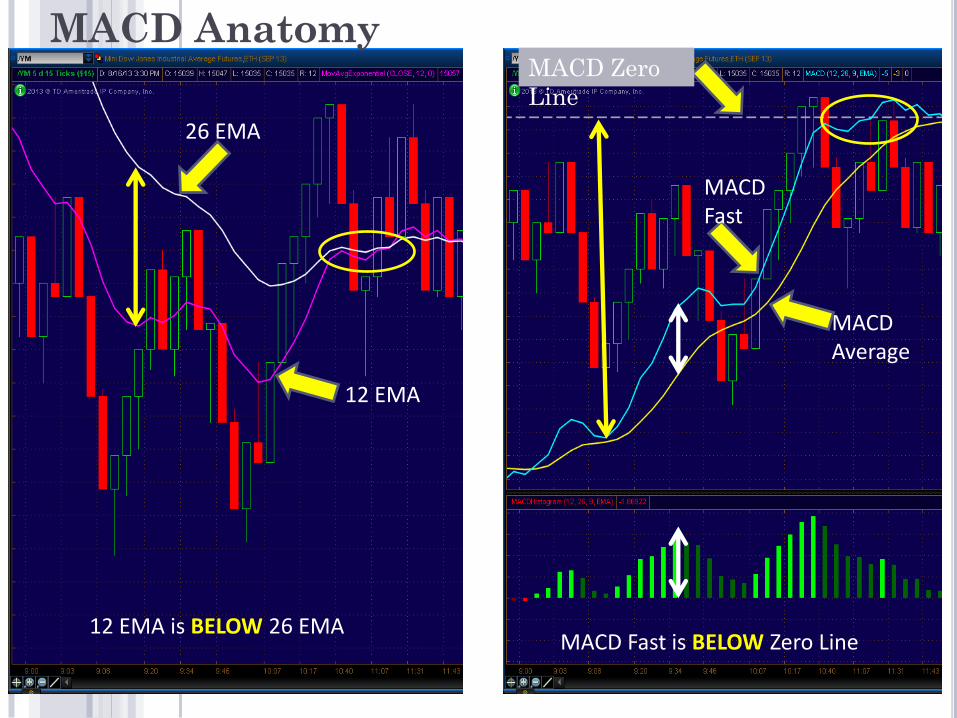
12 EMA
26 EMA
MACD Fast
MACD Average
12 EMA is BELOW 26 EMA MACD Fast is BELOW Zero Line
MACD Zero
Line
MACD Anatomy

OBSERVED PRICE PATTERN VS. ELLIOT WAVE
• The Basic price pattern consists of:
• Three main moves and three pull backs.
• A retest of the third move’s high/low.
• Trend Reversal: A pull-back that fails to make a new high/low.
38.2%
50%
61.8%
0%
100%
161.8%
261.8%
2ndary
Target
Tertiary
Target
Initial
Impulse
Move
38.2% - Expected
50% - Most Likely
61.8% - Reversal ?
Retest
Lower
Low
Pull-back
(Lower High)
Trend
Reversal
Elliot Wave
1
2
3
4
5
a
b
c
Retrace 1
Retrace 2
Retrace 3

MACD & Wave Structure
Start at MACD cross
1
2
3 test
Start at MACD cross
1
2
3 test
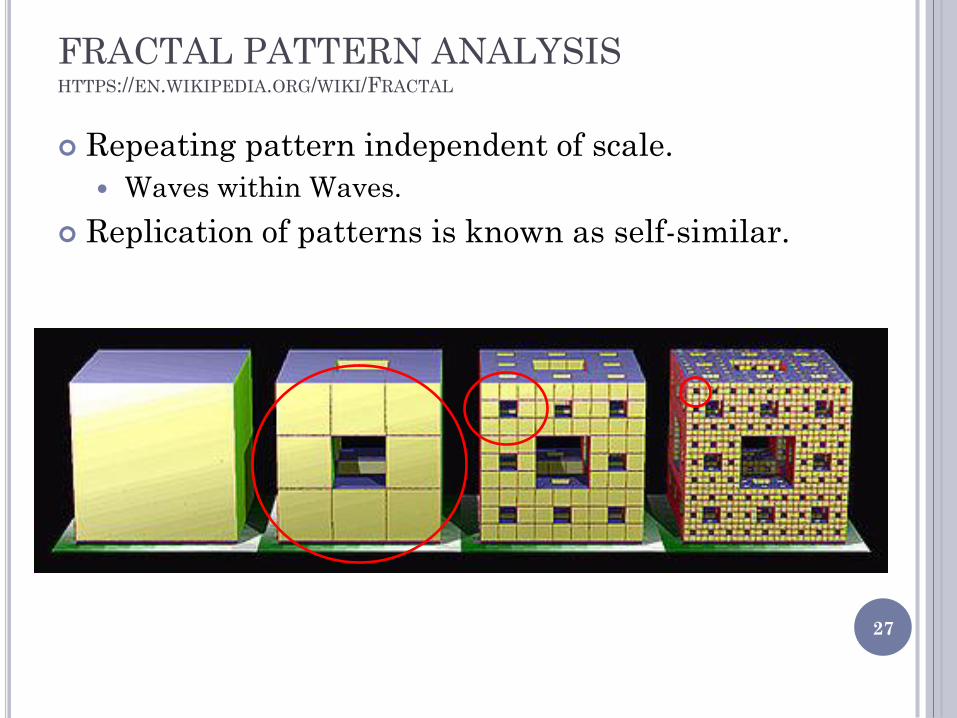
FRACTAL PATTERN ANALYSIS HTTPS://EN.WIKIPEDIA.ORG/WIKI/FRACTAL
Repeating pattern independent of scale.
Waves within Waves.
Replication of patterns is known as self-similar.
27
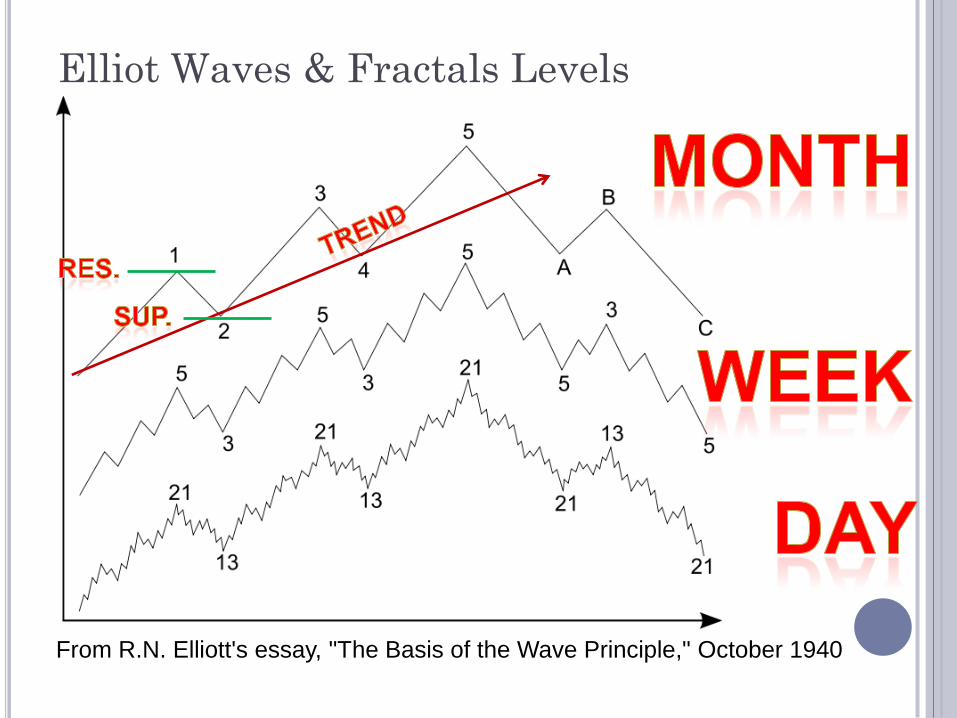
Elliot Waves & Fractals Levels
From R.N. Elliott's essay, "The Basis of the Wave Principle," October 1940
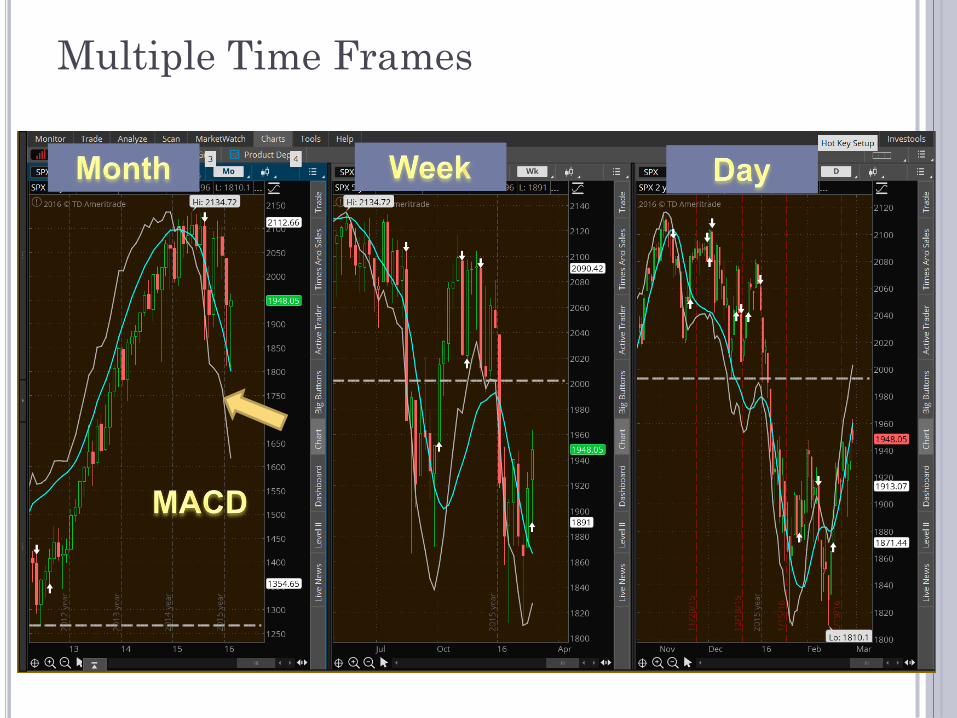
Multiple Time Frames
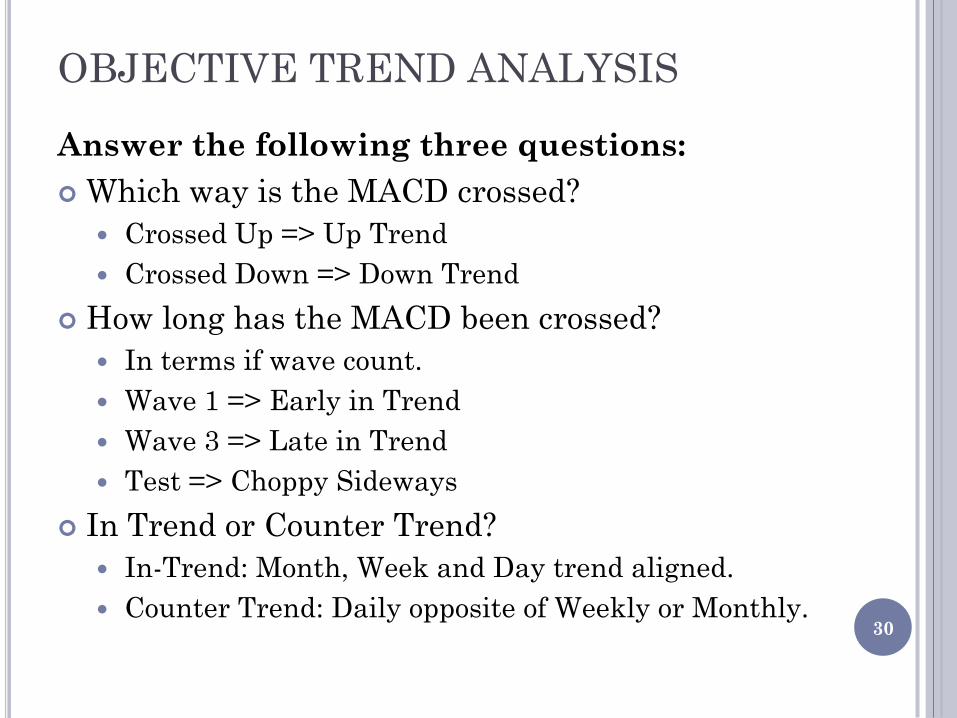
OBJECTIVE TREND ANALYSIS
Answer the following three questions:
Which way is the MACD crossed?
Crossed Up => Up Trend
Crossed Down => Down Trend
How long has the MACD been crossed?
In terms if wave count.
Wave 1 => Early in Trend
Wave 3 => Late in Trend
Test => Choppy Sideways
In Trend or Counter Trend?
In-Trend: Month, Week and Day trend aligned.
Counter Trend: Daily opposite of Weekly or Monthly.
30

Example: SPY
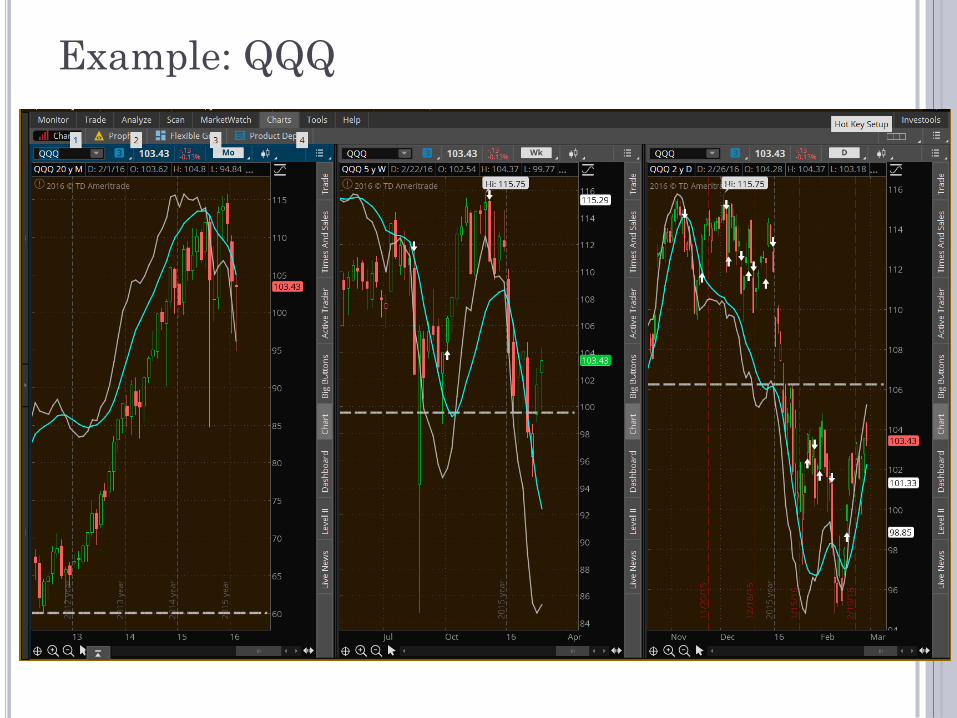
Example: QQQ

Example: DIA

Example: IWM

35
36


