
1
alw
ays c
lose
Tebodin
Tebodin Ukraine CFI
Moskovsky Avenue 16b, floor 4
04073 Kiev
Ukraine
Author: Andriy Balanyuk
- Telephone: +38044812121
- E-mail: [email protected]
August 28, 2015
Order number: 71994
Document number: DR-001
Revision: C
Climate Technologies in Ukraine. Market Penetration Study.
Client: European Bank for Reconstruction and Development
Project: FINTECC Ukraine. Market Penetration Study
2
Tebodin Ukraine CFI
Climate Technologies in Ukraine. Market Penetration Study
Order number: 71994
Document number: DR-001
Revision: C
August 28, 2015
Page 2 / 109
C 28-08-2015
Market Penetration Study Report
Consultants:
O. Cherinko
M. Donkelaar
M. Pribylova
A. Balanyuk
F. Akhmetshyn
P. Rosen
A. Bilan
A. Nikitin, Director B 22-06-2015
A 27-04-2015
Rev. Date Description Author Checked by
© Copyright Tebodin, 2015
All rights reserved. No part of this publication may be reproduced or transmitted in any form or by any means without
permission of the publisher.
3
Tebodin Ukraine CFI
Climate Technologies in Ukraine. Market Penetration Study
Order number: 71994
Document number: DR-001
Revision: C
August 28, 2015
Page 3 / 109
Table of contents
List of abbreviations 5 Executive Summary 6 1 Introduction and purpose statement 14 2 Methodological note for climate technologies market penetration assessment in Ukraine 16 2.1 Kick-off activities 16 2.2 Available methodological market penetration evaluation techniques and market information 17 2.3 Defining Market Sectors and Sub-Sectors 17 2.4 Climate technologies definition 18 2.5 Best Available Techniques (BAT) in Europe 18 2.6 Current standards in Ukraine 19 2.7 Market penetration analysis in Europe and in Ukraine for the selected climate technologies 20 3 Technology area prioritization 24 3.1 Cogeneration 24 3.1.1 Gas Turbines 26 3.1.2 Gas-fired reciprocating installations 26 3.1.3 Back Pressure Steam Turbines 28 3.1.4 Organic Rankine Cycle 28 3.1.5 Steam Turbine Design Characteristics 29 3.1.6 Steam turbines applications 30 3.2 Heat Recovery 34 3.3 Energy Management 37 3.4 Water Management Systems 39 3.5 Air Cooling Systems 39 4 Current standards in EU 40 4.1 EU Best Available Techniques Reference Documents 40 4.2 EU BATs in Agro industrial sector 41 4.2.1 Cogeneration 41 4.2.2 Heat recovery 42 4.2.3 Energy Management systems, automation and practices 43 4.2.4 Water management systems 44 4.2.5 Air cooling systems (air cooled condensers) 47 4.2.6 Other technologies 47 4.3 EU BATs in Industry 48 4.3.1 Cogeneration 48 4.3.2 Heat recovery 49 4.3.3 Energy Management systems, automation and practices 53 4.3.4 Water management systems: 54 4.3.5 Air cooling systems (air cooled condensers) 56 4.3.6 Other technologies 56 4.4 Examples of BAT Cases in EU (Czech Republic as a reference country) 66 4.4.1 Cogeneration 66 4.4.1.1 Gas-fired (reciprocated) engines 66 4.4.1.2 Steam turbines 68 4.4.1.3 Organic Rankine Cycle (ORC) 71 4.4.2 Heat recovery systems 75 4.4.3 Energy Management Systems, automation and practices 77 4.4.4 Water Management Systems 81 4.4.5 Air cooling systems (air cooled condensers) 85 5 Current standards in Ukraine 86

4
Tebodin Ukraine CFI
Climate Technologies in Ukraine. Market Penetration Study
Order number: 71994
Document number: DR-001
Revision: C
August 28, 2015
Page 4 / 109
5.1 Cogeneration 88 5.2 Heat recovery systems 93 5.3 Energy Management Systems, automation and practicies 94 5.4 Water management systems 95 5.5 Air cooling systems (air cooled condencers) 95 5.6 Identified barriers to climate technology transfer in Ukraine 95 6 Ukraine’s market potential and penetration 99 6.1 Cogeneration market potential and penetration 99 6.2 Heat recovery systems 101 6.3 Energy Management Systems, automation and practicies 101 6.4 Water management systems 105 6.5 Air cooling systems (air cooled condencers) 106 6.6 Summary of penetration and investment potential 108
Attachments
Attachment 1. Climate Technologies EU BATs, penetration and players - Agroindustry
Attachment 2. Descriptions BATs Agroindustry EU
Attachment 3. Climate Technologies EU BATs, penetration and players - Industry
Attachment 4. Descriptions BATs Industry EU

5
Tebodin Ukraine CFI
Climate Technologies in Ukraine. Market Penetration Study
Order number: 71994
Document number: DR-001
Revision: C
August 28, 2015
Page 5 / 109
List of abbreviations
AMS Automated Metering Systems (Automated System for Commercial Accounting of Power Consumption
(ASCAPC)/Automated System of Electric Power Technical Record-Keeping (ASEPTRK)/Automated
Measuring and Information System for Electric Power Fiscal Accounting (AMIS EPFA))
BAT Best Available Technologies
BAU Biomass Association of Ukraine
BREF Best Available Technology Reference Document
CHP Combined Heat and Power
CT Climate Technology
CZK Czech crown (as of 27.08.2015 1 EUR = 27.1 CZK)
EBRD European Bank for Reconstruction and Development
EPWM Electric Power Wholesale Market (Ukraine)
FAO Food and Agriculture Organization of the United Nations
FDI Foreign Direct Investment
FINTECC Finance and Technology Transfer Centre for Climate Change (Programme by EBRD)
GDP Gross Domestic Product
GHG Greenhouse gas
GUE Guidelines for Use of Electricity
HDI Human Development Index
IEA International Energy Agency
IFC International Finance Corporation
LDCPE Local Data Collecting and Processing Equipment
Mt Metric ton
NERC National Energy and Utilities Regulatory Commission (Ukraine)
NG Natural Gas
NREAP National Renewable Energy Action Plan (Ukraine)
ORC Organic Rankine Cycle
PHP Power and Heat Plant
PBP Payback period
WB World Bank
WHRB Waste Heat Recovery Boiler

6
Tebodin Ukraine CFI
Climate Technologies in Ukraine. Market Penetration Study
Order number: 71994
Document number: DR-001
Revision: C
August 28, 2015
Page 6 / 109
Executive Summary
The market penetration analysis is done with aim to gather market evidence of the market penetration of selected basket of
climate technologies in Ukraine through utilizing data from available studies, Consultant’s expertise and market intelligence
from market players such as technology suppliers.
Climate Technologies assessed
Climate technologies (CT) – subject to Market Penetration Study are defined as innovative, low penetrated in Ukrainian
market energy and resource efficiency technologies and practices contributing to reduction of CO2 emissions with big
potential of replication in selected sectors of industry and agroindustry.
The technologies that were prioritized for assessment based on the EBRD/Donor investment priorities and envisaged
EBRD pipeline are presented per the following groups (for details see Chapter 3 of this Report):
1. Co-generation:
Gas engine CHP < 2 MW (piston)
Gas engine CHP > 2 MW < 6 MW (piston)
Organic Rankine Cycle (ORC)
Steam turbine CHP > 2 MW < 6 MW:
Pass-out steam turbine CHP
Back pressure steam turbine CHP
2. Heat recovery:
Low- and Med-temperature (<650ºC)
High-temperature (>650ºC)
3. Management systems, automation and practices
Energy management systems
Advanced automation in drying
4. Water management systems:
Waste water treatment
Reduction of water consumption
5. Air cooling systems (air cooled condensers)
6. Other energy savings technologies and techniques
Market (sub) sectors
Based on the priorities of the EBRD the assignment was focused on the following economic sectors:
Agri-business (including agro and food processing);
Manufacturing and processing industry.
Considering EBRD priorities and anticipated pipeline of projects and importance of subsectors in Ukraine based on brief
market insight (including contribution in terms of resource consumption and CO2 emissions), the following sub-sectors were
defined for the purposes of the Market Penetration Study (given in alphabetical order):
Agroindustry:
Beverages;
Bakeries;
Fat production & oil extraction;
Fruit and vegetable processing
Milk processing;
Sugar mills.

7
Tebodin Ukraine CFI
Climate Technologies in Ukraine. Market Penetration Study
Order number: 71994
Document number: DR-001
Revision: C
August 28, 2015
Page 7 / 109
Industry:
Building materials (cement and dry mixtures, glass, bricks, etc.);
Chemicals (organic and inorganic chemical industry, production of fertilizers, by-product coke industry,
organic synthesis, etc.);
Oil refineries;
Pharmaceuticals;
Plastics and polymers;
Pulp & Paper;
Steel and metals, ferrous and nonferrous metal processing;
Wood working and processing.
In terms of end-users only large and mid-size businesses were considered as target group.
Methodology applied
For selected technology areas the Consultant provided details of a typical technical specification employed in EU and
especially in the benchmark country (Czech Republic, Chapter 4) and Ukraine (Chapter 5) with sector specifics highlights.
For the selected technologies the Best Available Techniques (BAT) Reference Documents (BREFs) of relevant
technologies were studied. In addition, the Consultant prepared a brief BAT technical specification for each of the selected
technologies including functionalities, energy efficiency performance and CO2 reductions benchmarks as well as typical
capital investment outlay required for implementation of the technology together with indicative simple payback.
In this study the main method of market penetration assessment in EU was secondary market research which was to use
data from open sources.
As for Ukraine, in open sources there is a large amount of information about cogeneration, while for the majority of other
technologies assessed the information is scarce. Thus, in parallel to secondary market research, various interviews with
technology providers and suppliers, industry experts and end-users were conducted by the Consultant. The information
was obtained in the form of completed questionnaires, as well as answers on unstructured, open-ended questions.
In order to assess the level of the technology penetration on the EU market, the following levels of application are
determined for each of the proposed technology:
1- ‘introduction of new technology’;
2- ‘increased acceptance of new technology’;
3- ‘growing importance and application of technology’;
4- ‘fully mature technology’
Such classification was done for the purposes of further comparison of penetration level in EU and Ukraine markets.
Considering the potential application of the selected technologies in Ukrainian market, majority of the presented
technologies are classified in the level 3 or 4 on the EU market. Only several highly perspective technologies with
significant energy efficiency and CO2 reduction potential are in the level 1 and 2.
Market penetration in Ukraine was calculated per group of technology and sectors as the ratio of applied cases to the
potential applications based on assumptions of number of sector average end-users that could potentially apply the
technology. Wherever possible the Consultant commented types of the companies identified tend to be faster in
implementation of BAT technologies and type of financing utilized for these technologies.
Based on the inputs of the tasks described above the Consultant further quantified the implementation potential of selected
climate technologies across selected agroindustry and industry sectors in Ukraine (Chapter 6) and presented results by
each sector as well as an aggregated total.
8
Tebodin Ukraine CFI
Climate Technologies in Ukraine. Market Penetration Study
Order number: 71994
Document number: DR-001
Revision: C
August 28, 2015
Page 8 / 109
CT market penetration and potential in Ukraine
Co-generation
As of 01 March 2015 in Ukraine it was installed 238 CHP units with the total capacity about 1 GWe, which is about 1.8% of
the total country’s installed capacity.
Of the total amount of CHP installations gas fired (reciprocal) equipment takes the lion’s share of the market (~190). Of the
total number of installed gas fired (reciprocating) units, half capacities are using natural gas, others – biogas, landfill gas
and coal bed methane.
Among the pre-defined (sub) sectors the most important for the installation of biogas-based CHP are the sugar industry,
breweries and distilleries. Despite the high share of enterprises with installed equipment for the biogas production
cogeneration is used only on a few of them.
The market penetration per sector was determined as share of installed capacity from potential capacity, with taking into
account the typical / average installed capacity for typical representative of the sector and the number of enterprises. The
cost per 1 kWe produced by gas fired CHP is, in average, about € 1,000.
Existed until recently in Ukraine ‘green’ tariff for the electricity sale to the network, made investments in CHP installations
attractive and allowed to reach a payback period of 1-2 years.
Together with natural gas fired CHP units, the investment potential into cogeneration based on reciprocating equipment in
defined sectors is estimated at € 4.1 billion.
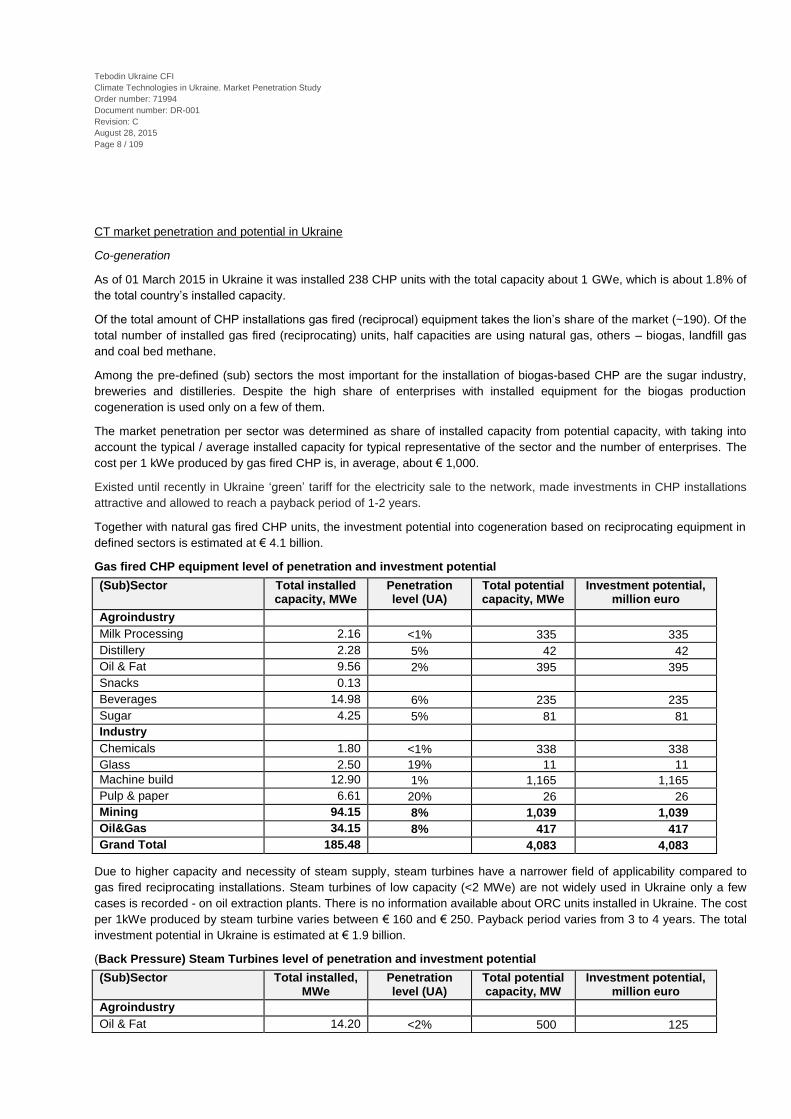
Gas fired CHP equipment level of penetration and investment potential
(Sub)Sector Total installed capacity, MWe
Penetration level (UA)
Total potential capacity, MWe
Investment potential, million euro
Agroindustry
Milk Processing 2.16 <1% 335 335
Distillery 2.28 5% 42 42
Oil & Fat 9.56 2% 395 395
Snacks 0.13
Beverages 14.98 6% 235 235
Sugar 4.25 5% 81 81
Industry
Chemicals 1.80 <1% 338 338
Glass 2.50 19% 11 11
Machine build 12.90 1% 1,165 1,165
Pulp & paper 6.61 20% 26 26
Mining 94.15 8% 1,039 1,039
Oil&Gas 34.15 8% 417 417
Grand Total 185.48 4,083 4,083
Due to higher capacity and necessity of steam supply, steam turbines have a narrower field of applicability compared to
gas fired reciprocating installations. Steam turbines of low capacity (<2 MWe) are not widely used in Ukraine only a few
cases is recorded - on oil extraction plants. There is no information available about ORC units installed in Ukraine. The cost
per 1kWe produced by steam turbine varies between € 160 and € 250. Payback period varies from 3 to 4 years. The total
investment potential in Ukraine is estimated at € 1.9 billion.
(Back Pressure) Steam Turbines level of penetration and investment potential
(Sub)Sector Total installed, MWe
Penetration level (UA)
Total potential capacity, MW
Investment potential, million euro
Agroindustry
Oil & Fat 14.20 <2% 500 125

9
Tebodin Ukraine CFI
Climate Technologies in Ukraine. Market Penetration Study
Order number: 71994
Document number: DR-001
Revision: C
August 28, 2015
Page 9 / 109
(Sub)Sector Total installed, MWe
Penetration level (UA)
Total potential capacity, MW
Investment potential, million euro
Industry
Chemicals 6.00 <1% 3,396 543
Metallurgy 56.00 6% 877 140
Plastics & polymers 12.00 1% 1,470 235
Pulp & paper 6.00 <2% 324 52
Mining 12.00 <1% 4,752 760
Grand Total 106.20 11,319 1,856
For Heat Recovery mostly tailor-made equipment is used rather than standard one.
In general, it cannot be said that the individual projects on waste heat recovery are always comparable, so the total amount
of heat recovery installation in Ukraine is difficult to estimate. The differences are mainly in the layout configuration of
source, consumption and method of implementation. So market penetration estimation is based mainly on subjective
opinion of market players.
Due to differences in heat recuperation techniques (“flue gas / water”, “flue gas / steam”, “flue gas / air”), the unification
issue is a problem which is difficult to resolve.
Specific investments and payback period is estimated by market players as:
Technology Investments, € / kW PBP, years
flue gas / water 250 - 340 0.3- 0.6
flue gas / steam 350 - 540 0.9- 1.9
flue gas / air 300 - 420 0.8- 1.8
disposal systems with source temperature 60 -: - 70 ° C 850 – 1,230 1.3 - 3.6
The main (sub)-sectors of new technologies applications in Ukraine so far were:
Metallurgy (metallurgical furnaces)
Cement industry (clinker kilns)
By estimation of market players, the market for heat recovery from steam and hot water in all sectors, where they are
involved into the process flow, is developed at 83 - 91%.
With the reference to EU experience, sector of construction materials production (~3,500 enterprises) has big potential for
implementation of modern heat recovery techniques, being currently mastered at 0-1%.
Special attention is to be paid to bakery sector (>2,000 enterprises), where in recent years a number of heat utilization
related modernizations have been realized, still the penetration level in the sector is estimated by market experts at 1.0-
1.5%.
Consultant suggests to still considering this group of technologies as eligible for the program, however, specific indicators
related to technology is difficult to benchmark, since they depend on each specific case.
Energy Management Systems
According to market player data, Automated Metering Systems (AMS) cover approximately 75% of industrial enterprises.
However, merely 30% of enterprises use the installed AMSs to analyse energy consumption and take energy saving
measures. For the purpose of investment potential evaluation large (LE), middle-size (ME) and small enterprises (SE) were
analysed separately with taking into account different numbers of points for control.
EMS investment potential in Ukraine
10
Tebodin Ukraine CFI
Climate Technologies in Ukraine. Market Penetration Study
Order number: 71994
Document number: DR-001
Revision: C
August 28, 2015
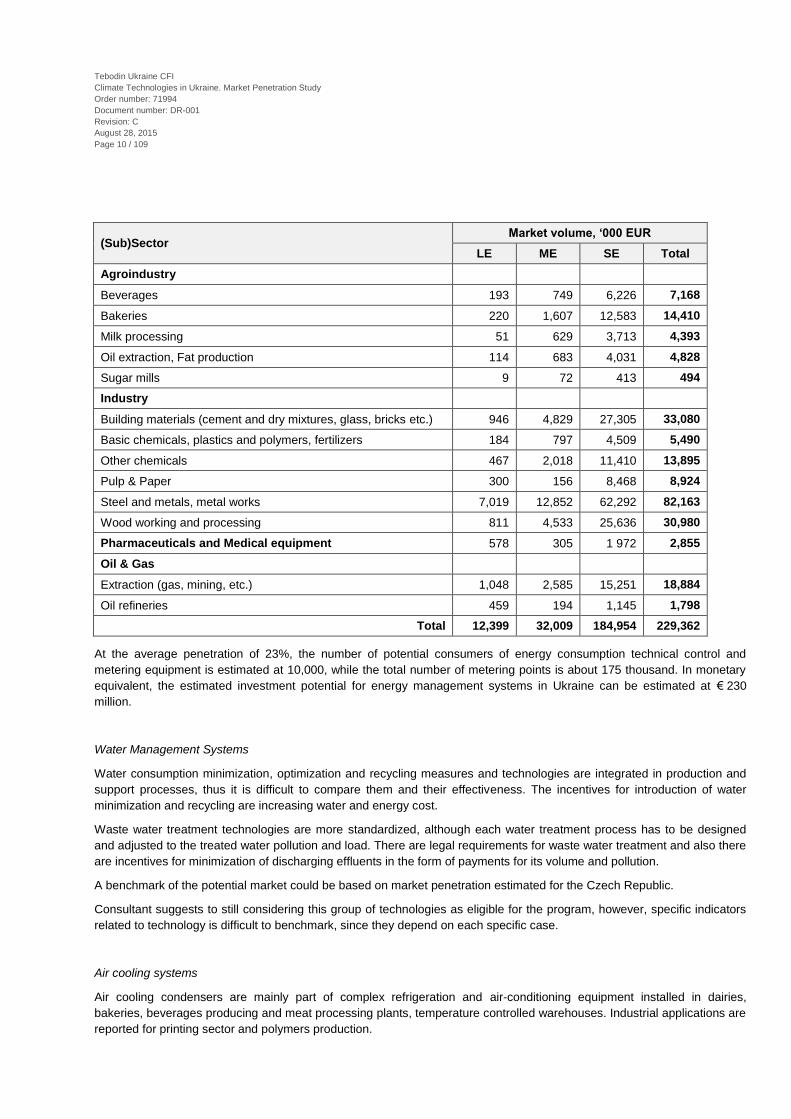
Page 10 / 109
(Sub)Sector Market volume, ‘000 EUR
LE ME SE Total
Agroindustry
Beverages 193 749 6,226 7,168
Bakeries 220 1,607 12,583 14,410
Milk processing 51 629 3,713 4,393
Oil extraction, Fat production 114 683 4,031 4,828
Sugar mills 9 72 413 494
Industry
Building materials (cement and dry mixtures, glass, bricks etc.) 946 4,829 27,305 33,080
Basic chemicals, plastics and polymers, fertilizers 184 797 4,509 5,490
Other chemicals 467 2,018 11,410 13,895
Pulp & Paper 300 156 8,468 8,924
Steel and metals, metal works 7,019 12,852 62,292 82,163
Wood working and processing 811 4,533 25,636 30,980
Pharmaceuticals and Medical equipment 578 305 1 972 2,855
Oil & Gas
Extraction (gas, mining, etc.) 1,048 2,585 15,251 18,884
Oil refineries 459 194 1,145 1,798
Total 12,399 32,009 184,954 229,362
At the average penetration of 23%, the number of potential consumers of energy consumption technical control and
metering equipment is estimated at 10,000, while the total number of metering points is about 175 thousand. In monetary
equivalent, the estimated investment potential for energy management systems in Ukraine can be estimated at € 230
million.
Water Management Systems
Water consumption minimization, optimization and recycling measures and technologies are integrated in production and
support processes, thus it is difficult to compare them and their effectiveness. The incentives for introduction of water
minimization and recycling are increasing water and energy cost.
Waste water treatment technologies are more standardized, although each water treatment process has to be designed
and adjusted to the treated water pollution and load. There are legal requirements for waste water treatment and also there
are incentives for minimization of discharging effluents in the form of payments for its volume and pollution.
A benchmark of the potential market could be based on market penetration estimated for the Czech Republic.
Consultant suggests to still considering this group of technologies as eligible for the program, however, specific indicators
related to technology is difficult to benchmark, since they depend on each specific case.
Air cooling systems
Air cooling condensers are mainly part of complex refrigeration and air-conditioning equipment installed in dairies,
bakeries, beverages producing and meat processing plants, temperature controlled warehouses. Industrial applications are
reported for printing sector and polymers production.

11
Tebodin Ukraine CFI
Climate Technologies in Ukraine. Market Penetration Study
Order number: 71994
Document number: DR-001
Revision: C
August 28, 2015
Page 11 / 109
Air cooling condensers could be effectively applied under the total capacity of the heat transfer up to 2-3 MW. Under the
larger total heat transfer capacity the cooling water tower should be applied – in case of large enterprises greenfield
construction.
Application of air cooling condensers itself does not lead to energy savings. Energy saving is possible, e.g., under the use
variable speed fans in coolers.
Market information in open sources is scarce, so the market penetration can be assessed based on estimates of market
players.
Most Ukrainian suppliers and assemblers use equipment manufactured by Alfa Laval, Gunter, and SPR.
The total capacity of air cooling condensers installed in Ukraine is estimated at 92 MW.
Air cooling systems potential in Ukraine
(Sub)Sector Total installed capacity, MW
Penetration level (UA)
Total potential capacity, MW
Investment potential, million euro
Agroindustry
Bakery 0.27 <1% 204 10.41
Beverages (water, beer*) 11.03 55% 9 0.46
Distillery 3.13 12% 24 1.45
Vinery 1.82 67% 1 0.05
Cold storage 7.59 3% 232 14.41
Confectionery 3.77 <3% 137 8.23
Oil & Fat 1.87 1% 176 10.54
Meat processing 41.77 11% 267 16.02
Fish processing 0.87 <7% 12 0.83
Fruit & Vegetables processing 0.43 1% 53 2.71
Milk processing 7.41 8% 85 5.08
Industry
Metal processing 0.97 1% 101 5.13
Pharma 2.22 44% 3 0.19
Plastics & polymers 8.73 32% 18 1.10
Printing 0.30 <1% 96 6.64
Grand Total 92.16 1,418 83.22
The total investment potential is estimated at € 83 million.
Summary of penetration and investment potential
Different Climate Technologies have different levels of penetration in the Ukrainian market. Also there is a significant
difference in the level of penetration of the selected CT between the different market sectors.
The high penetration level of heat recovery technologies in some sectors (83-91%) doesn’t reflect the necessity of
modernization (e.g. sugar production, metallurgy, pulp & paper, oil & gas). Taking into account that waste heat utilization is
integrated in production, modernization will create the demand on new heat recovery technologies implementation.
EU benchmark and key indicators for CT implementation in Ukraine
Climate Technology
PBP EU,
years
PBP UA,
years
Penetra-tion EU**
Penetra-tion UA
Technology related CO2 reduction,
t/MWh
CO2 reduction potential, mio t/year
Invest-ment
potential, bn euro
1. Co-generation:
Gas engine CHP < 2 MW 6 - 10 1 - 2* 3 1-20%(3) 0.97 8.77 1.15

12
Tebodin Ukraine CFI
Climate Technologies in Ukraine. Market Penetration Study
Order number: 71994
Document number: DR-001
Revision: C
August 28, 2015
Page 12 / 109
Climate Technology
PBP EU,
years
PBP UA,
years
Penetra-tion EU**
Penetra-tion UA
Technology related CO2 reduction,
t/MWh
CO2 reduction potential, mio t/year
Invest-ment
potential, bn euro
Gas engine CHP > 2 MW < 6 MW
6 - 10 1 - 2* 3 7% (3) 0.99 22.92 2.94
Organic Rankine Cycle (ORC)
7 - 10 2 - 4 2 n/a 1.17 n/a n/a
Steam turbine CHP > 2 MW < 6 MW
7 - 10 3 - 4 3 1 - 6%
(3) 1.17 104.41 1.86
2. Heat recovery 0.5 - 10 < 4 2 - 3 <1%
(except boilers)
effect is present
n/a n/a
3. Management systems, automation and practices
1 - 4 n/a 2 - 3 22.5%
(1) effect is present
n/a 0.23
4. Water management systems: 1 - 6 n/a 2 - 3 - 4 low (1) not relevant - n/a
5. Air cooling systems (air cooled condensers)
3 1 - 67%
(2-3) not relevant - 0.08
Total 136.10 6.25
* - For electricity sellers, depending on feed in tariff
** - Penetration legend: 1-‘introduction of new technology’; 2-‘increased acceptance of new technology’; 3-‘growing importance and application of technology’; 4-‘fully mature technology’
The total assessed investment potential for the eligible technologies is estimated at € 6.25 billion. At that, the CO2
countable reduction is estimated at 136 million tons per year, which means invested € 44 will reduce CO2 emission by
1 Mt/y.
Barriers to CT transfer in Ukraine
Based on Eco questionnaire the Consultant may summarize own and interviewed market players’ vision as of main barriers
and motivators for climate technologies penetration (for details see Section 5.6):
Barriers and motivations The most common answer The next most frequently mentioned
The third leading cause
Obstacles stopping compa-nies or organizations from investing in or working with energy efficiency and renewable energy
Economic and financial (e.g. difficulty obtaining loans, high cost of technology, uncertain financial environ-ment)
Policy/legal/regulatory (e.g. unstable and uncertain policies, problems in getting clearances, import taxations and certification require-ments)
Capacity (e.g. lack of skilled personnel to manage more complex technologies, inadequate training to identify and implement technologies, lack of service providers)
Economic and financial obstacles to investment or involvement with energy efficiency and renewable energy technology
Uncertain financial and economic environment (e.g. electricity tariffs, inflation rate, currency exchange rate)
Difficult to obtain loans with terms acceptable for the type of investment
High capital cost of the technologies
The top market obstacle to investment or involvement
Unstable economic situation Economy of scale difficult / impossible to be achieved
Lack of market transparency (e.g. What products,

13
Tebodin Ukraine CFI
Climate Technologies in Ukraine. Market Penetration Study
Order number: 71994
Document number: DR-001
Revision: C
August 28, 2015
Page 13 / 109
Barriers and motivations The most common answer The next most frequently mentioned
The third leading cause
with energy efficiency and renewable energy technology
services are available and at what price).
The top policy/legal/regulatory obstacle to investment or involvement with energy efficiency and renewable energy technology
Corruption Unstable and uncertain policies
Insufficient enforcement of regulations
The top capacity obstacle to investment or involvement with energy efficiency and renewable energy technology
Lack of internal capacity to identify opportunities
Lack of service and maintenance specialists
Lack of skilled personnel for preparing projects
The top information and awareness obstacle to invest-ment or involvement with energy efficiency and renewable energy technology
Poor or lack of information about costs and benefits of technologies
Insufficient demonstration of technology in the country
Lack of agencies, organiza-tions or sources to provide information
The top motivator to invest in energy efficiency and/or renewable energy in Ukraine right now
Reduction of operational costs (energy costs, carbon tax)
Energy security Existing legal and regulatory requirements (green tariff)
What would most motivate your company to invest in energy efficiency and/or renewable energy technologies
Operational savings potential
Affordability of technology Legal and regulatory requirements
14
Tebodin Ukraine CFI
Climate Technologies in Ukraine. Market Penetration Study
Order number: 71994
Document number: DR-001
Revision: C
August 28, 2015
Page 14 / 109
1 Introduction and purpose statement
This market Penetration Study Report (the ‘Report’) is elaborated by CFI ‘Tebodin Ukraine’ (Member of Bilfinger Group) in
partnership with ENVIROS, s.r.o. (Member of ENVIROS Group) (together to be referred to as the ‘Consultant’) based on
the Contract C30736/GISF-2015 -01-01/03 for FINTECC TC Program – Market Penetration of climate Technologies in
Ukraine dated 19 February 2015.
In the Bank's region, the number of investments into climate technologies and techniques remains low to date as a result of
underdeveloped supply chains, low awareness levels about the related needs and benefits, lack of technical expertise for
appraisal and risk assessment; lack of implementation capacity, regulatory uncertainties on energy and carbon pricing,
high perceived risk and upfront cost associated with the implementation of such technologies. Companies, if not
incentivised to make investments, delay making strategic decisions and investments and opt for sub-optimal solutions,
thereby locking into continuous inefficiencies. This experience has been particularly pronounced in the region over recent
years. In Ukraine situation is aggravated by current political and economic instability.
The EBRD Finance and Technology Transfer Centre for Climate Change (FINTECC) is a programme that helps companies
in eligible countries to implement innovative climate technologies and create a body of knowledge that can open up market
opportunities for e.g. creating new business models.
The beneficiaries of FINTECC are clients of the EBRD investing into climate technologies with low market penetration in
their respective countries and sectors. The programme offers technical assistance (climate technology audits), as well as
incentive grants for companies to introduce eligible technologies. The grants are available to the companies as a
complement to EBRD financing. In addition to the direct investment support, the Programme anticipates a comprehensive
Policy Dialogue and Knowledge Management aiming at:
Development of methodologies for improving availability and consistency of information on status of climate
technology market as well as guidelines for improving climate resilience of enterprises;
Visibility and knowledge sharing activities to disseminate best practice, and to provide capacity building to policy
makers, local experts and private enterprises;
Policy and regulatory support work, to assist the governments in the host countries to improve existing legislative
frameworks and create enabling environments for the adoption of climate technologies. The FINTECC
Programme in the host countries is funded by the Global Environment Facility (GEF) and the EBRD Shareholder
Special Fund (SSF).
The FINTECC activities are coordinated with other Regional Development Banks as well as with the Climate Technology
Centre and Network and are being delivered in partnership with the International Energy Agency (IEA) and Food and
Agriculture Organization of the United Nations (FAO). FINTECC Ukraine will benefit from the outputs of the activities jointly
developed by FAO and IEA.
A recent study (World Bank, 2014) of 500 companies in the industrial and commercial sectors in Ukraine has revealed that
financial barriers (such as high upfront costs, lack of capital, and long pay back), institutional barriers, knowledge gap, and
technical barriers are the strongest barriers to deployment of energy efficiency technologies. In addition, recently organized
EBRD event for dairy sector in Ukraine highlighted in particular the need:
to address regulatory constraints and complexities associated with permitting procedures;
to address absorption capacities of local businesses;
to offer broad and flexible technical assistance, not one-fit-all as the gaps for individual companies varies.
Experience also shows that underdeveloped supply chains with limited competition result in higher capital and upfront
costs, and longer paybacks thus affecting decision making and perceived risk of investments by companies. As per the
EBRD Transition report 2014, lack of competition will also limit productivity growth and keep firms active in the climate
technology supply chains stuck in low-productivity equilibrium.

15
Tebodin Ukraine CFI
Climate Technologies in Ukraine. Market Penetration Study
Order number: 71994
Document number: DR-001
Revision: C
August 28, 2015
Page 15 / 109
Given the success of the FINTECC pilot in the eligible countries and the clear technology gap in Ukraine, the Bank is
working on FINTECC Programme roll-out to other geographies, starting with the introduction of FINTECC to Ukraine in
2015. It is envisaged that the extension of FINTECC to Ukraine is going to be funded by the Global Environment Facility
and the Neighbourhood Investment Facility (who provided their initial approvals), and will be operational by mid-2015.
To facilitate the preparation of the full implementation proposal for the Global Environment Facility and the Neighbourhood
Investment Facility the Bank has undertaken a series of activities to inform the final design of the Programme in Ukraine,
ensuring that the proposal reflects needs of the businesses in Ukraine and mitigates the risk of low uptake once the
Programme is launched including Market Penetration Study for climate technologies.
The overall aim of this Market Penetration Study is to provide information to the Bank on the market penetration of selected
technologies in the context of Ukraine in order to inform the design and implementation of FINTECC in Ukraine to cover the
following main Tasks:
Task 1: Methodological note for market penetration assessment
Task 2: Technology area prioritization
Task 3: Current standards in the country and BAT
Task 4: Market potential, penetration and benchmarking
It should be mentioned that the Consultant acted in the framework of tight timeframe and broad stated assignment that was
rather challenging. The Consultant thanks the Bank team and consultants of other related activities for the preparation of
FINTECC Programme for the constructive cooperation during the project.

16
Tebodin Ukraine CFI
Climate Technologies in Ukraine. Market Penetration Study
Order number: 71994
Document number: DR-001
Revision: C
August 28, 2015
Page 16 / 109
2 Methodological note for climate technologies market penetration assessment in Ukraine
A summarised methodological note for climate technology market penetration (a general approach for how the market
penetration was assessed and quantified) is given below.
To assess the market penetration of the climate technologies in Ukraine a series of activities were undertaken by the
Consultant in the course of the assignment that forms methodological approach to the Market Penetration Study:
1. Kick-off activities
2. Desk top study of available methodological market penetration evaluation techniques and market information
(including statistics and analytical reports)
3. Defining focus market sectors and sub-sectors
4. Defining the basket of climate technologies
5. Describing Best Available Techniques (BAT) in EU (with reference to BREFs and commenting application cases
in the selected EU countries) under selected basket of climate technologies
6. Describing current standard in Ukraine under selected basket of climate technologies with comparison to EU
practice and technologies prioritization per sectors
7. Performing of market penetration analysis in benchmarking countries and in Ukraine for the selected climate
technologies, including interviews with technology providers and suppliers, industry experts and end-users and
analysis of barriers and motivators for the selected climate technologies penetration.
Methodological approach is commented in more detail in Sub-Sections below.
2.1 Kick-off activities
The following kick-off activities were performed by the Consultant at the initial stage of the assignment:
• Participation in Round table ‘FINTECC in Ukraine’ organized by the EBRD on 10/02/2015 to have an insight into
Programme aims and developments, introduction to EBRD team under Programme and networking with the local
market players-participants of the event.
• Meeting with EBRD FINTECC and Eco Ltd teams on 11/02/2015 to specify EBRD/Donor priorities for shaping
product under FINTECC Programme under two main envisaged components being 1) financial incentives for end-
users of climate technologies and 2) technical assistance to equipment/ technologies manufacturers and suppliers
(local and international) and to secure input for EBRD Proposal to sponsor of FINTECC (GEF) being prepared by
Eco Ltd.
• Initiating of obtaining the following input from EBRD:
Provision of deliverables requirements and sharing of available studies related to the assignment.
Review of the initial list of pre-selected industrial and agro industrial sectors and climate technologies basket.
Inputs from the consultant responsible for elaboration of the EBRD FINTECC proposal to programme sponsor
(GEF) (Eco Ltd.).
• Coordination activities between the Consultant and consultant focused on value chain analysis for climate
technologies (Larive) with facilitation from the EBRD site in order to:
Unify climate technologies that are covered by both studies;
Ensure that the specification of the technologies for each of the assignments is close;
Discussion of possibility that both assignments use the same reference country(ies) for the purpose of
benchmarking;

17
Tebodin Ukraine CFI
Climate Technologies in Ukraine. Market Penetration Study
Order number: 71994
Document number: DR-001
Revision: C
August 28, 2015
Page 17 / 109
Ensure that contacting third parties (market players and experts) is done in a coordinated manner.
• Market insights for Ukraine and EU (after the example of Czech Republic) to identify market data availability
including BATs to define market sectors.
2.2 Available methodological market penetration evaluation techniques and market information
The Consultant performed search, collection and analysis of available methodological market penetration evaluation
techniques presented in the following relevant studies and guidelines (given below in chronological order):
UKEEP: Survey of the Ukrainian Market for Sustainable Energy Technologies, March 2014.
ENSI: Built Environment Sustainable Energy Market Review; Sustainable Energy Toolset 2, June 2012
UNEP RISO Centre. TNA Guidebook Series: Overcoming Barriers to the Transfer and Diffusion of Climate
Technologies, January 2012.
MWH: Identification of Energy Efficiency Opportunities at Retail Outlets in Ukraine and EE Penetration Rate
in Other Neighbouring Countries, August 2011
NREL: Market Penetration of New Energy Technologies, February 1993.
The Consultant also used open source market information (including statistics and analytical reports) reference to which is
given under specific Report Chapters.
2.3 Defining Market Sectors and Sub-Sectors
Based on the priorities of the EBRD the assignment was focused on the following economic sectors:
Agri-business (including agro and food processing);
Manufacturing and processing industry.
Considering EBRD priorities and anticipated pipeline of projects and importance of subsectors in Ukraine based on brief
market insight (including contribution in terms of resource consumption and CO2 emissions), the following sub-sectors
were defined for the purposes of the Market Penetration Study (given in alphabetical order):
Agroindustry:
Beverages;
Bakeries;
Fat production & oil extraction;
Fruit and vegetable processing
Milk processing;
Sugar mills.
Industry:
Building materials (cement and dry mixtures, glass, bricks, etc.);
Chemicals (organic and inorganic chemical industry, production of fertilizers, by-product coke industry,
organic synthesis, etc.);
Oil refineries;
Pharmaceuticals;
Plastics and polymers;
Pulp & Paper;
Steel and metals, ferrous and nonferrous metal processing;
Wood working and processing.
18
Tebodin Ukraine CFI
Climate Technologies in Ukraine. Market Penetration Study
Order number: 71994
Document number: DR-001
Revision: C
August 28, 2015
Page 18 / 109
In terms of end-users only large businesses were considered as target group.
2.4 Climate technologies definition
Climate technologies – subject to Market Penetration Study are defined as innovative, low penetrated in Ukrainian market
energy and resource efficiency technologies and practices contributing to reduction of CO2 emissions with big potential of
replication in selected sectors of industry and agroindustry.
According to the mentioned criteria the following basket of climate technologies was defined for the purposes of Market
Penetration Study:
1. Co-generation:
Gas engine CHP < 2 MW (reciprocal)
Gas engine CHP > 2 MW < 6 MW (reciprocal)
Steam turbine CHP > 2 MW < 6 MW:
Pass-out steam turbine CHP
Back pressure steam turbine CHP
Organic Rankine Cycle (ORC)
2. Heat recovery:
Low- and Med-temperature (<650ºC)
High-temperature (>650ºC)
3. Management systems, automation and practices
Energy management systems
Advanced automation in drying
4. Water management systems:
Waste water treatment
Reduction of water consumption
5. Air cooling systems (air cooled condensers)
2.5 Best Available Techniques (BAT) in Europe
Selected climate technologies were first subject of technical specification according to EU BATs. The output data are
summarising the typical technical specifications including functionality, energy efficiency and CO2 reduction indicators,
typical capital investment outlay required for implementation and payback period (PBP).
For the technical specifications and reference indicators the Consultant applied the following main documents and
standards as listed below but not limited to:
1. EU Best Available Techniques Reference Documents (given below in alphabetical order):
BREF Common Waste Water and Waste Gas Treatment/ Management Systems in the Chemical Sector
Final Draft (2014)
BREF Non-Ferrous Metals Industries. Final Draft (2014)
BREF Polymers (2007)
BREF Ceramic Manufacturing Industry (2007)

19
Tebodin Ukraine CFI
Climate Technologies in Ukraine. Market Penetration Study
Order number: 71994
Document number: DR-001
Revision: C
August 28, 2015
Page 19 / 109
BREF Energy Efficiency (2009)
BREF Ferrous Metals Processing Industry (2001)
BREF Food, Drink and Milk Industries (2006)
BREF Glass (2013)
BREF Industrial Cooling Systems (2001)
BREF Intensive Rearing of Pigs and Poultry (2003)
BREF Iron and Steel Production (2012)
BREF Large Combustion Plants (2006)
BREF Large volume inorganic chemicals – Ammonia, Acids, Fertilizers (2007)
BREF Large Volume Inorganic Chemicals – Solids and other industry (2007)
BREF Large Volume Organic Chemicals Draft 1 (2014)
BREF Organic fine chemicals (2006)
BREF Production of Cement, Lime and Magnesium Oxide (2013)
BREF Production of Specialty Inorganic Chemicals (2007)
BREF Production of Wood–based Panels (final draft, 2014)
BREF Pulp and paper (2013)
BREF Refining of Mineral oil and gas (2015)
2. Definition of High Efficiency cogeneration (EU Directive 2012/27/EU and 2004/8/EC, http://eur-
lex.europa.eu/legal-content/EN/TXT/?uri=CELEX:32012L0027
3. ISO 50001 Standard for Energy Management.
Based on data availability and representativeness benchmark the following EU countries advanced in the deployment of
assessed technology and at the same time comparable to Ukraine were chosen: Czech Republic and The Netherlands.
Where applicable and feasible the Consultant provided samples of process components where selected technologies are
applicable based on the criteria of availability of BAT data.
2.6 Current standards in Ukraine
Next step was evaluation of application selected climate technologies employed in Ukraine versus the technical
specification of BAT in EU. Selected climate technologies specified according to EU BATs were subject of identification as
for their applicability in Ukraine and current standards in Ukraine.
As such, there are no specific standards as for climate technologies in Ukraine. However, there are requirements for e.g.
cogeneration plants, whose owners would like to sell electricity and heat in the network (Law of Ukraine ‘On combined heat
and power generation (cogeneration) and waste energy potential’, #2509-15, revision dd. 02.03.2014), as well as the
procedure for the establishment of such facilities (Procedure of CHP qualification, enacted by Order of CMU #627 dated
12.06.2013).
Consultant used information received from market players – equipment suppliers:
Sinapse (GE Jenbacher equipment, including CHP), www.sinapse.ua ;
Zeppelin (Caterpillar), www.power-ua.com ;
GES (MWM CHP equipment), www.ges-ukraine.com ;
Siemens (back pressure steam turbines, ORC), www.siemens.com ;
Küttner (heat exchangers), www.kuettner.com ;
Teploenergoresurs (design, manufacturing, supply, construction, installation, commissioning, maintenance of
power equipment, incl. process exhaust gases heat recycling equipment), http://ter.vn.ua;
Alfa Laval (heat exchangers, air cooled condensers, various applications for food and pharma industry),
www.alfalaval.com.ua ;
Landis-Gyr (metering solutions), www.landisgyr.eu ;
ЕМН Metering GmbH & Co KG (automated electricity, heat, gas metering systems), http://emh.com.ua ;

20
Tebodin Ukraine CFI
Climate Technologies in Ukraine. Market Penetration Study
Order number: 71994
Document number: DR-001
Revision: C
August 28, 2015
Page 20 / 109
Elster-Metronika (technical solutions in the field of smart grids and energy management),
http://www.elstersolutions.com ;
SRI Energy (energy consulting, testing, and improvements), www.sri-energy.com
ES Engineering (complex services on design, supply, installation of thermal engineering systems), www.ese.ua)
as well as information from market regulators, as indicated below but not limited to:
List of cogeneration installations which meet the qualification requirements (as of 05.01.2015, State Energy
Efficiency Service of Ukraine, http://saee.gov.ua/sites/default/files/documents/perelikKU_05012015.doc)
Register of power producers from alternative sources (as of 01.03.2015, NERC,
http://www3.nerc.gov.ua/?id=5701)
‘Green’ tariffs for electricity generated by the power plants that use alternative energy sources (Resolutions by
NERC)
The output data are summarising the typical technical specifications including functionality, energy efficiency and CO2
reduction indicators, typical capital investment outlay required for implementation and payback period (PBP). Technologies
are given with comparison to EU practice and with prioritization per applicable sub-sectors.
2.7 Market penetration analysis in Europe and in Ukraine for the selected climate technologies
Market penetration analysis in Europe and in Ukraine for the selected climate technologies and analysis of barriers and
motivators for the selected climate technologies penetration were aimed at gathering market evidences of the level of
market penetration in Ukraine of the selected basket of technologies, utilizing data from available studies, Consultant’s
expertise and market intelligence from market players including technology suppliers and potential end-users.
A wide selection of techniques is essential for analysts challenged with forecasting the market penetration of new
technologies1. These technologies are in various stages of development and have varying amounts of data available about
them. For example, some technologies are so new or are evolving so rapidly that much data about them are lacking. In
these cases, techniques demanding less data and resources should be used. Other technologies have a longer track
record so more quality data are available. To obtain the most statistically significant prediction, the most sophisticated
method that fits the data available should be used.
Some prediction methods are more effective than others at different developmental stages of new technologies. Generally,
as the new technology matures, the amount of data about that technology increases, allowing use of more sophisticated
data-demanding methods that require more resources for analysis.
1 Market Penetration of New Energy Technologies, by Daniel J. Packey, National Renewable Energy Laboratory, Colorado, USA, 1993
21
Tebodin Ukraine CFI
Climate Technologies in Ukraine. Market Penetration Study
Order number: 71994
Document number: DR-001
Revision: C
August 28, 2015
Page 21 / 109
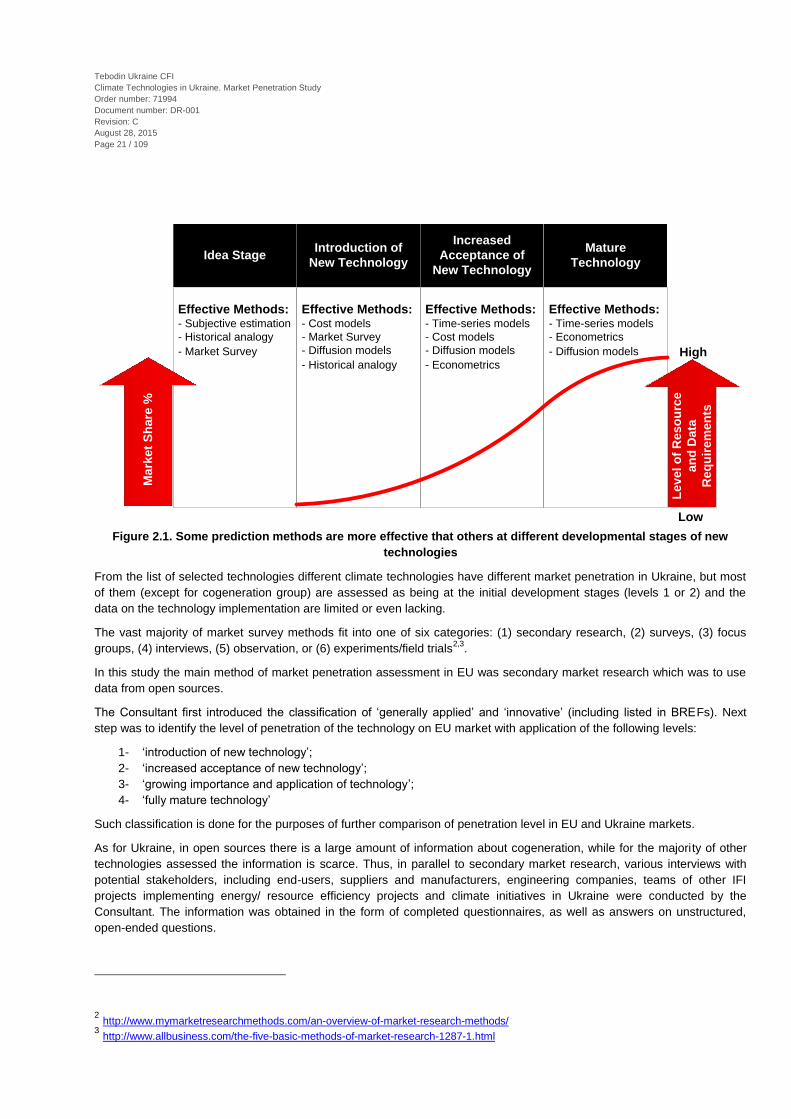
Figure 2.1. Some prediction methods are more effective that others at different developmental stages of new
technologies
From the list of selected technologies different climate technologies have different market penetration in Ukraine, but most
of them (except for cogeneration group) are assessed as being at the initial development stages (levels 1 or 2) and the
data on the technology implementation are limited or even lacking.
The vast majority of market survey methods fit into one of six categories: (1) secondary research, (2) surveys, (3) focus
groups, (4) interviews, (5) observation, or (6) experiments/field trials2,3
.
In this study the main method of market penetration assessment in EU was secondary market research which was to use
data from open sources.
The Consultant first introduced the classification of ‘generally applied’ and ‘innovative’ (including listed in BREFs). Next
step was to identify the level of penetration of the technology on EU market with application of the following levels:
1- ‘introduction of new technology’;
2- ‘increased acceptance of new technology’;
3- ‘growing importance and application of technology’;
4- ‘fully mature technology’
Such classification is done for the purposes of further comparison of penetration level in EU and Ukraine markets.
As for Ukraine, in open sources there is a large amount of information about cogeneration, while for the majority of other
technologies assessed the information is scarce. Thus, in parallel to secondary market research, various interviews with
potential stakeholders, including end-users, suppliers and manufacturers, engineering companies, teams of other IFI
projects implementing energy/ resource efficiency projects and climate initiatives in Ukraine were conducted by the
Consultant. The information was obtained in the form of completed questionnaires, as well as answers on unstructured,
open-ended questions.
2 http://www.mymarketresearchmethods.com/an-overview-of-market-research-methods/
3 http://www.allbusiness.com/the-five-basic-methods-of-market-research-1287-1.html
Effective Methods:- Subjective estimation
- Historical analogy
- Market Survey
Idea StageIntroduction of
New Technology
Increased
Acceptance of
New Technology
Mature
Technology
Effective Methods:- Cost models
- Market Survey
- Diffusion models
- Historical analogy
Effective Methods:- Time-series models
- Cost models
- Diffusion models
- Econometrics
Effective Methods:- Time-series models
- Econometrics
- Diffusion models
Ma
rke
t S
ha
re %
Le
ve
l o
f R
es
ou
rce
an
d D
ata
Re
qu
ire
me
nts
Low
High

22
Tebodin Ukraine CFI
Climate Technologies in Ukraine. Market Penetration Study
Order number: 71994
Document number: DR-001
Revision: C
August 28, 2015
Page 22 / 109
Market survey was used to obtain information about market size for different technologies and, where possible, the level of
innovations implemented.
Consultant compared the subjective estimations by different experts to get averaged benchmarks for different technologies
as for their availability, application level and potential. Market penetration then was calculated per group of technology and
sectors as the ratio of applied cases to the potential applications based on assumptions of number of sector average end-
users that could potentially apply the technology. Wherever possible the Consultant commented types of the companies
identified tend to be faster in implementation of BAT technologies and type of financing utilized for these technologies.
Implementation potential then was summarised as aggregated total (total investment potential) and presented in a table
format.
On each technology separate paragraph is devoted summarising the identified quantifiable implementation potential and
the barriers faced in Ukraine versus the situation and barriers faced in the selected BAT country, including conclusions on
how the financial and technical traits of technologies may form potential and barriers for investment and penetration of
technology in Ukraine.
Methodological approach to the market penetration ratio and potential estimations per specific group of technologies is
commented as cases below.
Cogeneration
The total number of CHP units installed in Ukraine was analysed based on open sources and interviews with market
players (e.g. Zeppelin (Caterpillar), Sinapse (Jenbacher), Siemens, etc.). For the selected sectors the average installed
capacity was determined. The market capacity per sector was calculated by multiplying the total number of companies per
sector by using the latest statistical data available. The penetration level is calculated as a ratio of installed capacity per
sector to the market potential.
Heat recovery
In general, it cannot be said that the individual projects on waste heat recovery are always comparable, so the unification of
heat recovery installations is not possible. The differences are mainly in the layout configuration of source, consumption
and method of implementation.
Waste heat can be used on all devices that generate a waste heat transfer medium at a higher temperature, while the
waste heat can be used not only in the device itself, but also for other equipment or purposes (heating, domestic hot water,
etc.). This measure can thus reduce the consumption of any fuel or electricity.
Theoretically waste heat from the appropriate technological equipment in any kind of industrial operation or ventilation of
larger halls can be used. Waste heat can be supplied not only to a lower temperature (by heat exchanger) but also at a
higher temperature (heat pumps, thermal transformers). At temperatures of waste heat higher than about 150°C it is
possible to re-supply not only heat but also electricity (e.g. through ORC).
Use of waste heat must allow specific design of the facility, which produces waste heat - e.g. clear drying air inlet and clear
exhaust air outlet. The problem with some machines is that they do not have a clear inlet for drying air (because many
openings suck air into the machine) and exhaust air is not extracted from one specific point.
It remains difficult to compare a simple heat recovery from the exhaust of ventilation air into the intake air in one single heat
exchanger with the production of electricity from waste combustion.
So market penetration estimation is based mainly on subjective opinion of market players (e.g. Teploenergoresurs (design,
manufacturing, supply, construction, installation, commissioning, maintenance of power equipment, incl. process exhaust
gases heat recycling equipment, http://ter.vn.ua).
Energy Management Systems
In EU today, more than ever, effective energy management is a crucial issue for the success of any business. For many,
the answer is an Energy Management System (EMS) – a framework for the systematic management of energy. As well as

23
Tebodin Ukraine CFI
Climate Technologies in Ukraine. Market Penetration Study
Order number: 71994
Document number: DR-001
Revision: C
August 28, 2015
Page 23 / 109
enhancing energy efficiency, an EMS can cut costs and reduce Greenhouse Gas (GHG) emissions providing you with a
competitive advantage. The ISO 50001:2011 represents the latest best practice in energy management system upon
existing national standards and initiatives.
In Ukraine, the key precondition for successful introduction of energy management system is energy consumption control
and metering. Although ISO50001 standard does not require to launch automated energy consumption control and
metering (technical metering, ASCMPC), this system, if available at the enterprise, multiplies effects of energy saving and
where corrective measures are taken it provides the enterprise the opportunity to save more energy resources. The
Guidelines for Use of Electricity GUE encourage consumers to use systems for analysis of energy consumption with
automated systems of commercial metering.
According to market player data, ASCMPC systems cover approximately 75% of industrial enterprises. However, merely
30% of enterprises use the installed ASCMPCs to analyse energy consumption and take energy saving measures.
Therefore, market penetration rate of the energy consumption technical control and metering systems may be evaluated as
follows:
MPR = n·k = 0.225
where n = 0.75 - factor of the enterprises covered by ASCMPCs,
k = 0.3 - factor of the enterprises, where ASCMPCs are utilized for energy consumption analysis and elaborating of
corrective actions.
Water management systems
Water minimisation, optimisation and recycling measures and technologies are integrated in production and support
processes, thus it is difficult to compare them and their effectiveness. The incentives for introduction of water minimisation
and recycling are increasing water and energy cost.
Waste water treatment technologies are more standardised, although each water treatment process has to be designed
and adjusted to the treated water pollution and load. There are legal requirements for waste water treatment and also there
are incentives for minimisation of discharging effluents in the form of payments for its volume and pollution.
A benchmark of the potential market could be based on market penetration estimated for the Czech Republic.
Based on the above considerations, the Consultant suggests to still considering this group of technologies as eligible for
the programme, however, specific indicators related to technology is difficult to benchmark, since they depend on each
specific case.
Air cooling systems
Air cooling condensers are mainly part of complex refrigeration and air-conditioning equipment installed in dairies,
bakeries, beverages producing and meat processing plants, temperature controlled warehouses. Industrial applications are
reported for printing sector and polymers production.
Application of air cooling condensers itself does not lead to energy savings. Energy saving is possible, e.g., under the use
variable speed fans in coolers.
Market information in open sources is scarce, so the market penetration can be assessed based on estimates of market
players (e.g. company ‘ES Engineering’, complex services on design, supply, installation of thermal engineering systems,
www.ese.ua).
The potential capacity is derived based on the typical / average cooling capacity for typical representative of the sector
taking into account the number of enterprises. The market penetration per sector is determined as share of installed
capacity from potential.

24
Tebodin Ukraine CFI
Climate Technologies in Ukraine. Market Penetration Study
Order number: 71994
Document number: DR-001
Revision: C
August 28, 2015
Page 24 / 109
3 Technology area prioritization
3.1 Cogeneration
Combined Heat and Power (CHP) or Cogeneration is the simultaneous production of useful heat and electricity in the same
installation. Conventional electricity generation is via large power stations releasing low-grade heat into the atmosphere as
a wasted by-product. By retrieving some of this rejected heat via heat exchangers and being situated near where it can be
used, CHP plants can greatly increase their overall efficiency and provide heat to commercial, industrial or public sectors at
the same time as producing electricity.
Figure 3.1. Efficiencies of conventional power generation, cogeneration and trigeneration
Trigeneration (electricity, heat and cold generation) has the highest system efficiency and is about 300 % more efficient
than typical central power plant.
There are five principal types of CHP system:
1. Gas turbine systems, where fuel is combusted in the gas turbine and the exhaust gases are normally used in a waste
heat boiler to produce usable heat, though the exhaust gases may be used directly in some process applications.
2. Reciprocating engine systems, producing two grades of waste heat: high grade heat from the engine exhaust and low
grade heat from the engine cooling circuits. Two principal types of engine exist: compression ignition and spark
ignition, dependent on their firing method.
3. Back pressure steam turbine systems, where steam at high pressure is generated in a boiler and is wholly or partly
used in a turbine being exhausted from the turbine at the required pressure for the site. A proportion of the steam used
by the turbine may also be extracted at an intermediate pressure from the turbine (a pass-out/back pressure steam
turbine).
4. Pass-out condensing steam turbine systems, where a proportion of the steam used by the turbine is extracted at an
intermediate pressure from the turbine with the remainder being fully condensed before it is exhausted at the exit
(pass-out/condensing steam turbine).
5. Combined cycle systems, where the plant comprises one or more engines (usually gas turbines but in some cases
reciprocating engines) whose exhaust gases are utilised in a steam generator, the steam of which is used wholly or in
part in one or more steam turbines.
Benefits:
Economic/Management
Depending on the site and the correct choice of plant, savings made on electricity should more than offset the increase in
fossil fuel (usually gas) requirements. This is especially true in the market where electricity prices/unit is considerably more
than gas prices/unit. In some cases further savings from reduced maximum demand charges can also be made. For
CO
GE
NE
RA
TIO
N U
NIT
BO
ILE
RP
OW
ER
GE
NE
RA
TO
R
60
%
10
0%
Th
erm
al e
ne
rgy c
on
tain
ed
in th
e fu
el
sa
vin
g
40
%
ELECTRICITY
HEAT
ELECTRICITY
HEAT
LOSSES DURING
COGENERATION
LOSSES DURING CONVENTIONAL
POWER GENERATION

25
Tebodin Ukraine CFI
Climate Technologies in Ukraine. Market Penetration Study
Order number: 71994
Document number: DR-001
Revision: C
August 28, 2015
Page 25 / 109
suitable small/medium scale CHP sites, energy bills can be reduced by as much as 40 % with typical paybacks of down to
3 or 4 years.
Having an independent supply of electricity avoids relying on the fluctuating price of supplied electricity, and also increases
security of power supply, as the CHP unit can continue to supply power should the grid fail, and vice versa.
The Environment
In conventional generation, 30-50% of the energy consumed is converted to electricity, the remainder being rejected to the
environment as heat, mainly through cooling towers or condensers. About 8% of this electricity (i.e. a further 3% of energy
input) is lost during transmission and distribution to the end-user. The fuel efficiency of industrial CHP plant can be around
80% or more and, as the plant is situated on-site, the losses from transmission and distribution are minimal. For a given
combination of industrial electricity and heat demands using CHP, 10-40% less fuel is required than with conventional
systems. The increased fuel efficiency of CHP gives it a potentially useful role in helping to combat global warming, through
curbing the emission of carbon dioxide (CO2), the principal man-made greenhouse gas. This table shows how this effect
depends on the fuel being displaced by CHP.
Table 3.1. Typical characteristics of CHP systems
Gas Turbine Spark
Ignition
Engine
Compression
Ignition
Engine
Back
Pressure
Steam
Turbine
Pass Out
Steam
Turbine
Combined
Cycle
Fuel Type Natural Gas,
Biogas, Gas
Oil
Natural gas,
Biogas
Natural gas,
Biogas, Gas
oil, Heavy oils
All types All types Natural Gas,
Biogas, Gas
Oil
Capacity
Range
>1 MWe 30 kWe to 2
MWe
100 kWe to 20
MWe
>500 kWe >1MWe >3 MWe
Heat: Power
Ratio
1.5:1 to 2.5:1
(5:1 with
supplementary
firing)
1:1 to 3:1 0.5:1 to 1.5:1
(3:1 with boost
firing)
3:1 to 10:1 3:1 to 8:1 1:1 (3:1 with
supplementary
firing)
Heat Output
Quality
High Grade
Steam
LPHW, Steam
(rare)
LPHW, Steam Medium
Grade Steam
Steam at 2
pressures
Medium
Grade Steam
Electrical
generating
Efficiency %
25-40 25-33 35-42 7-20 10-20 35-50
Overall
Efficiency %
65-80 (75-82
with suppl.
firing)
70-78 65-75 (75-82
with boost
firing)
75-84 75-84 73-80 (80-85
with suppl.
firing)

26
Tebodin Ukraine CFI
Climate Technologies in Ukraine. Market Penetration Study
Order number: 71994
Document number: DR-001
Revision: C
August 28, 2015
Page 26 / 109
3.1.1 Gas Turbines
Gas turbines are able to provide the widest range of electric power - from ten to several tens of megawatts (with the usage
of so-called micro turbines the range can be extended to 1 MWe).
Figure 3.2. Gas turbine principle of operation
In such installations the flow of gas formed in the combustion of fuel creates a torque on turbine blades and rotates the
rotor, which in turn is connected to a generator. Electrical efficiency of systems of this type can be up to 39%. Use of the
gas turbines in combination with steam turbines can increase the electrical efficiency up to 59% (but the overall efficiency
not exceeding of 90%). Gas turbines can be used in many sectors of the economy, but the main sectors are still the oil and
gas production, metallurgy and energy generation with permanently high power consumption.
Inability to scale the system, the complexity of maintenance and the requirement for highly qualified personnel are major
disadvantages of the system. For the purpose of current study the gas turbines market was not investigated deeply.
Figure 3.3. Efficiencies of gas engines and gas turbines
3.1.2 Gas-fired reciprocating installations
The most popular units for CHP purposes are gas-fired (reciprocating or piston) installations. They gained popularity mainly
due to the relative ease of maintenance and management, lower cost and a higher rate of total efficiency (the sum of
electrical and thermal efficiency).
NATURAL GAS
100%
NATURAL GAS
100%
GAS ENGINE GAS TURBINE
ELECTRICITY
42%
ELECTRICITY
26%
HEAT
48%
HEAT
64%
LOSSES
10%
LOSSES
10%

27
Tebodin Ukraine CFI
Climate Technologies in Ukraine. Market Penetration Study
Order number: 71994
Document number: DR-001
Revision: C
August 28, 2015
Page 27 / 109
Figure 3.4. Main components of CHP installation
The main components of a typical system are:
the engine or prime mover which drives the generator.
the generator which produces electricity.
the heat recovery system that recovers the waste heat from both the engine water cooling jacket and exhaust
gases.
the exhaust system to take away the products of combustion.
the control panel to monitor the operation.
Fuel flexibility: Modern equipment is able to work on a variety of gases: natural, landfill and waste water biogas, and
associated petroleum gas, coal mine methane, coke, blast furnace, ferroalloy gases, pyrolysis (synthesis) gas as well as
propane, butane and so on. If necessary, engines can be adjusted to operate on a mixture of different of gases
simultaneously.
Reliability and life: Gas engines in CHP installations are characterized by long periods of work between scheduled
maintenance: the life of spark plugs is up to 15,000 working hours, cylinder heads up to 30,000 – 40,000 hours.
Size range: Gas-fired CHP installations are supplied as skid-mounted and container mounted pre-assembled units (≤ 3
MWe) as well as stand-alone units, which require additional engineering for wrap around piping and covering structures.
Emissions: Emissions data of International producers are consistent with those described in EPA CFR 40 Part 89 Subpart
D & E and ISO8178-1 for measuring HC, CO, PM, NOx.
Electrical Efficiency: Gas-fired CHP units are equipped with electrical generators. The electrical generating efficiency of
CHP units is within the range 39-47%.
Thermal output: Heat recovery system allows recovering the heat of exhaust gases as well as the waste heat from the
engine water cooling reaching 52% of overall system efficiency.
CHP System Efficiency: The combined efficiency of modern CHP units reaches 92%.

28
Tebodin Ukraine CFI
Climate Technologies in Ukraine. Market Penetration Study
Order number: 71994
Document number: DR-001
Revision: C
August 28, 2015
Page 28 / 109
3.1.3 Back Pressure Steam Turbines
Back pressure steam turbine systems, where steam at high pressure is generated in a boiler and is wholly or partly used in
a turbine being exhausted from the turbine at the required pressure for the site. A proportion of the steam used by the
turbine may also be extracted at an intermediate pressure from the turbine (a pass-out/back pressure steam turbine).
Figure 3.5 Boiler/Steam Turbine scheme and cogeneration system components
Back pressure steam turbine Extraction (pass out) steam turbine
This is the most widely used back-pressure type
turbine. Its aim is to expand the available steam
through the turbine stages.
It provides a constant pressure steam through a
controlled extraction at various loading conditions of the
turbine based on seasonal variations.
Figure 3.6 Type of back pressure steam turbines
3.1.4 Organic Rankine Cycle
The Rankine cycle is a thermodynamic cycle used to generate electricity in many power stations. Superheated steam is
generated in a boiler, and then expanded in a steam turbine. The turbine drives a generator, to convert the work into
electricity. The remaining steam is then condensed and recycled as feed water to the boiler.
Steam
Process or Condensor
Heat out
Power out
Turbine
Pump
FuelBoiler
Power out
Turbine
High Pressure
Steam
Low Pressure Steam
to ProcessCondensor
Power out
Turbine
High Pressure
Steam
Medium / Low
Pressure Steam
to Process

29
Tebodin Ukraine CFI
Climate Technologies in Ukraine. Market Penetration Study
Order number: 71994
Document number: DR-001
Revision: C
August 28, 2015
Page 29 / 109
Organic substances can be substituted for steam when temperatures are limited to less than 400 degree Celsius. This is
called an Organic Rankine Cycle (ORC).
ORC can make use of low temperature waste heat to generate electricity. At these low temperatures a steam cycle would
be inefficient, due to enormous volumes of low pressure steam, causing very voluminous and costly plants. ORCs can be
applied for low temperature waste heat recovery (industry), efficiency improvement in onsite power generation, and
recovery of geothermal and solar heat.
Several organic compounds have been used in ORCs (e.g. refrigerants, iso-pentane or ammonia) to match the
temperature of the available waste heat. Waste heat temperatures can be as low as 60°C. The efficiency of an ORC is
estimated to be between 10 and 20%, depending on temperature levels. On many sites no suitable use is available for low
temperature waste heat, hence upgrading by the use of a heat pump (or transformer) or an ORC are good energy recovery
candidates. Figure below shows a typical ORC where waste heat (1) evaporates the refrigerant which passes through the
turbine producing power (2). The refrigerant is then condensed (3) and pumped back to the waste heat source (4). The
system utilizes a closed-loop Rankine cycle using an advanced refrigerant.
Figure 3.7. Organic Rankine Cycle Unit Scheme
3.1.5 Steam Turbine Design Characteristics
Custom design: Steam turbines can be designed to match CHP design pressure and temperature requirements. The steam
turbine can be designed to maximize electric efficiency while providing the desired thermal output.
Thermal output: Steam turbines are capable of operating over a very broad range of steam pressures. Utility steam
turbines operate with inlet steam pressures up to 241 bar and exhaust vacuum conditions as low as one inch of Hg
(absolute). Steam turbines can be custom designed to deliver the thermal requirements of the CHP applications through
the use of back-pressure or extraction steam at appropriate pressures and temperatures.
Fuel flexibility: Steam turbines offer a wide range of fuel flexibility using a variety of fuel sources in the associated boiler or
other heat source, including coal, oil, natural gas, wood, and waste products.
Reliability and life: Steam turbine life is extremely long. There are steam turbines that have been in service for over 50
years. Overhaul intervals are measured in years. When properly operated and maintained (including proper control of
boiler water chemistry), steam turbines are extremely reliable. They require controlled thermal transients as the massive
casing heats up slowly and differential expansion of the parts must be minimized.
Size range: Steam turbines are available in sizes from under 100 kW to over 250 MW. In the multi-megawatt size range,
industrial and utility steam turbine designations merge, with the same turbine (high pressure section) able to serve both
industrial and small utility applications.
Turbine Power out
Pump
Waste Heat
150° - 420°
Generator
1
2
3
4
Condensor
Evaporator

30
Tebodin Ukraine CFI
Climate Technologies in Ukraine. Market Penetration Study
Order number: 71994
Document number: DR-001
Revision: C
August 28, 2015
Page 30 / 109
Emissions: Emissions are dependent upon the fuel used by the boiler or other steam source, the boiler furnace combustion
section design and operation, and any built-in and add-on boiler exhaust clean-up systems.
Electrical Efficiency: The electrical generating efficiency of steam turbine power plants varies from a high of 36% HHV (4)
for large, electric utility plants designed for the highest practical annual capacity factor, to under 10% HHV for small, simple
plants which make electricity as a by-product of delivering steam to industrial processes or district heating systems for
colleges, industrial parks and building complexes. Steam turbine thermodynamic efficiency (isentropic efficiency) refers to
the ratio of power actually generated from the turbine to what would be generated by a perfect turbine with no internal
losses using steam at the same inlet conditions and discharging to the same downstream pressure. Turbine
thermodynamic efficiency is not to be confused with electrical generating efficiency, which is the ratio of net power
generated to total fuel input to the cycle. Steam turbine thermodynamic efficiency is a measure of how efficiently the turbine
extracts power from the steam itself and is useful in identifying the conditions of the steam as it exhausts from the turbine
and in comparing the performance of various steam turbines. Multistage (moderate to high pressure ratio) steam turbines
have thermodynamic efficiencies that vary from 65% for very small (under 1,000 kW) units to over 90% for large industrial
and utility sized units. Small, single stage steam turbines can have efficiencies as low as 50%.
CHP System Efficiency: Steam turbine CHP systems are generally characterized by very low power to heat ratios, typically
in the 0.05 to 0.2 range. This is because electricity is a by-product of heat generation, with the system optimized for steam
production. Hence, while steam turbine CHP system electrical efficiency may seem very low, it is because the primary
objective is to produce large amounts of steam. The effective electrical efficiency of steam turbine systems, however, is
generally very high, because almost all the energy difference between the high pressure boiler output and the lower
pressure turbine output is converted to electricity. This means that total CHP system efficiencies are generally very high
and approach the boiler efficiency level. Steam boiler efficiencies range from 70 to 85 % HHV depending on boiler type and
age, fuel, duty cycle, application, and steam conditions.
3.1.6 Steam turbines applications
Steam turbine-based CHP systems are primarily used in industrial processes where solid or waste fuels are readily
available for boiler use. In CHP applications4, steam may be extracted or exhausted from the steam turbine and used
directly. Steam turbine systems are very commonly found in paper mills as there is usually a variety of waste fuels from
hog fuel to black liquor. Chemical plants are the next most common industrial user of steam turbines followed by primary
metals.
There is a niche for use of steam turbo generators in every segment of the oil and gas industry such as drilling and
production, LNG, pipelines and storage to industrial power generation, refining and petrochemicals.
4 http://www.epa.gov/chp/documents/catalog_chptech_4.pdf
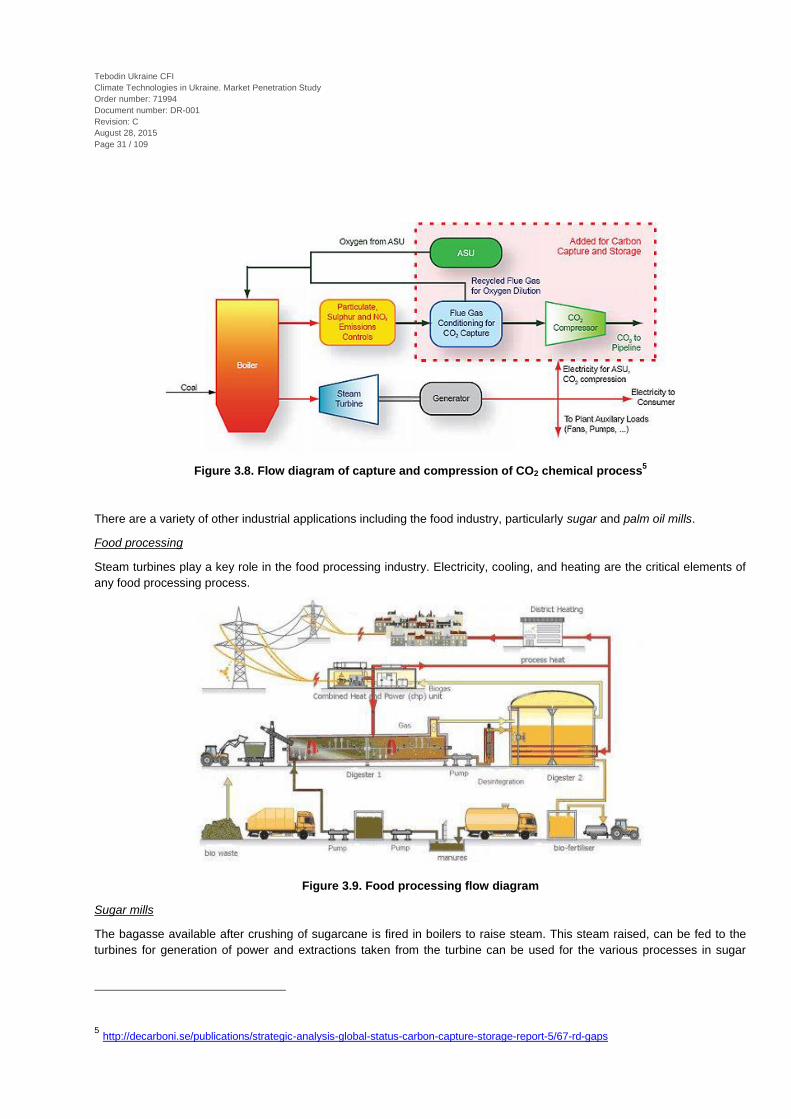
31
Tebodin Ukraine CFI
Climate Technologies in Ukraine. Market Penetration Study
Order number: 71994
Document number: DR-001
Revision: C
August 28, 2015
Page 31 / 109
Figure 3.8. Flow diagram of capture and compression of CO2 chemical process5
There are a variety of other industrial applications including the food industry, particularly sugar and palm oil mills.
Food processing
Steam turbines play a key role in the food processing industry. Electricity, cooling, and heating are the critical elements of
any food processing process.
Figure 3.9. Food processing flow diagram
Sugar mills
The bagasse available after crushing of sugarcane is fired in boilers to raise steam. This steam raised, can be fed to the
turbines for generation of power and extractions taken from the turbine can be used for the various processes in sugar
5 http://decarboni.se/publications/strategic-analysis-global-status-carbon-capture-storage-report-5/67-rd-gaps
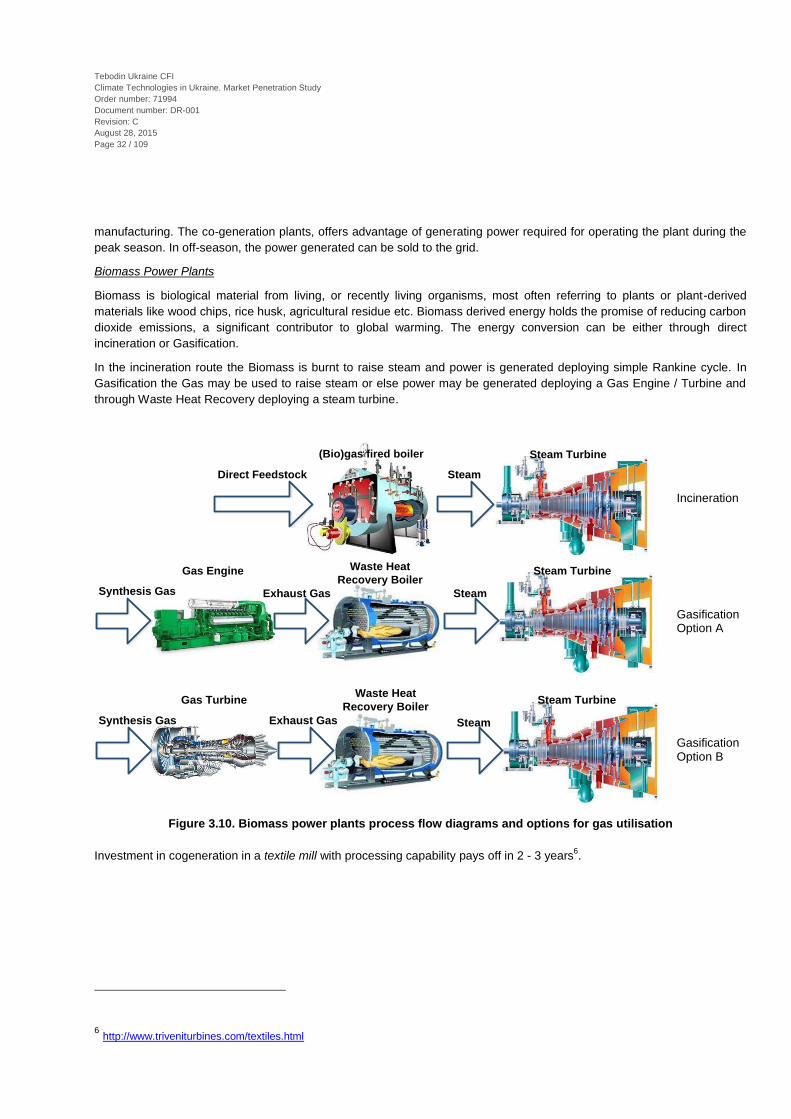
32
Tebodin Ukraine CFI
Climate Technologies in Ukraine. Market Penetration Study
Order number: 71994
Document number: DR-001
Revision: C
August 28, 2015
Page 32 / 109
manufacturing. The co-generation plants, offers advantage of generating power required for operating the plant during the
peak season. In off-season, the power generated can be sold to the grid.
Biomass Power Plants
Biomass is biological material from living, or recently living organisms, most often referring to plants or plant-derived
materials like wood chips, rice husk, agricultural residue etc. Biomass derived energy holds the promise of reducing carbon
dioxide emissions, a significant contributor to global warming. The energy conversion can be either through direct
incineration or Gasification.
In the incineration route the Biomass is burnt to raise steam and power is generated deploying simple Rankine cycle. In
Gasification the Gas may be used to raise steam or else power may be generated deploying a Gas Engine / Turbine and
through Waste Heat Recovery deploying a steam turbine.
Incineration
Gasification Option A
Gasification Option B
Figure 3.10. Biomass power plants process flow diagrams and options for gas utilisation
Investment in cogeneration in a textile mill with processing capability pays off in 2 - 3 years6.
6 http://www.triveniturbines.com/textiles.html
Direct Feedstock Steam
(Bio)gas fired boiler Steam Turbine
Steam
Steam TurbineGas Engine
Synthesis Gas Exhaust Gas
Waste Heat
Recovery Boiler
Steam
Steam TurbineWaste Heat
Recovery BoilerGas Turbine
Synthesis Gas Exhaust Gas

33
Tebodin Ukraine CFI
Climate Technologies in Ukraine. Market Penetration Study
Order number: 71994
Document number: DR-001
Revision: C
August 28, 2015
Page 33 / 109
Figure 3.11. Textiles manufacturing process flow diagram
Pressing
Steeping
Shredding
Pressing
Aging
Xanthation
Ripening
Filtering
Spinning
Washing
Drying
Dyeing
Dissolving
Degassing
Cutting
Desizing
Bleaching
Stentering
Process requiring
Thermal energy

34
Tebodin Ukraine CFI
Climate Technologies in Ukraine. Market Penetration Study
Order number: 71994
Document number: DR-001
Revision: C
August 28, 2015
Page 34 / 109
3.2 Heat Recovery
4 Industrial waste heat refers to energy that is generated in industrial processes without being put to practical use.
Sources of waste heat include hot combustion gases discharged to the atmosphere, heated products exiting industrial
processes, and heat transfer from hot equipment surfaces. The exact quantity of industrial waste heat is poorly
quantified, but various studies have estimated that in developed countries as much as 20 to 50% of industrial energy
consumption is ultimately discharged as waste heat. While some waste heat losses from industrial processes are
inevitable, facilities can reduce these losses by improving equipment efficiency or installing waste heat recovery
technologies. Waste heat recovery entails capturing and reusing the waste heat in industrial processes for heating or
for generating mechanical or electrical work. Example uses for waste heat include generating electricity, preheating
combustion air, preheating furnace loads, absorption cooling, and space heating.
Figure 3.12. Heat exchanger and example of heat recovery scheme
Captured and reused waste heat is an emissionfree substitute for costly purchased fuels or electricity.
Three essential components are required for waste heat recovery: 1) an accessible source of waste heat, 2) a recovery
technology, and 3) a use for the recovered energy.
Source of Waste Heat
(e.g., combustion exhausts, process
exhausts, hot gases from drying ovens,
cooling tower water)
Recovery Technology (e.g., regenerator,
recuperator, economizer, waste heat boiler,
thermoelectric generator)
End Use for Recovered Heat
(e.g., preheating (boiler feedwater, raw
materials, combustion air), electricity supply,
domestic hot water)
35
Tebodin Ukraine CFI
Climate Technologies in Ukraine. Market Penetration Study
Order number: 71994
Document number: DR-001
Revision: C
August 28, 2015
Page 35 / 109
Each waste heat stream is investigated in terms of its waste heat quantity (the approximate energy contained in the waste
heat stream), quality (typical exhaust temperatures), current recovery technologies and practices, and barriers to heat
recovery. Energy content of waste heat streams is a function of mass flow rate, composition, and temperature, and was
evaluated based on process energy consumption, typical temperatures, and mass balances.
Investigation of current waste heat recovery practices shows that waste heat is generally recovered from clean, high
temperature waste heat sources in large capacity systems. Key opportunities are available in optimizing existing systems,
developing technologies for chemically corrosive systems, recovering heat from nonfluid heat sources, and recovering low
temperature waste heat. Observed trends are described below.
Waste heat recovery systems are frequently implemented, but constrained by factors such as temperature limits and
costs of recovery equipment.
There are a number of cases where heat recovery equipment is installed, but the quantity of heat recovered does not
match the full recovery potential. Key barriers include heat exchanger material limits and costs for extending recovery
to lower temperature and higher temperature regimes.
Most unrecovered waste heat is at low temperatures.
Roughly 60% of unrecovered waste heat is low quality (i.e., at temperatures below 232°C). While low temperature
waste heat has less thermal and economic value than high temperature heat, it is ubiquitous and available in large
quantities. Comparison of total work potential from different waste heat sources showed that the magnitude of low
temperature waste heat is sufficiently large that it should not be neglected in pursuing opportunities for waste heat
recovery. New technologies are developing that may provide significant opportunities for low temperature heat
recovery.
There are certain industrial subsectors where heat recovery is less common, due to factors such as heat source’s
chemical composition and the economiesofscale required for recovery.
High temperature, high-quality heat is wasted in some subsectors due to corrosive/fouling chemicals contained in the
waste heat stream, or due to economiesofscale that limit recovery (e.g., small metal casting and glass operations).
Losses from non-traditional waste heat sources are difficult to recover, but significant.
Usually exhaust gas waste heat losses are recovered; however, it was numerous studies shows that alternate sources
of waste heat are also significant. These include heat lost from hot product streams (e.g., hot cast steel) and hot
equipment surfaces (e.g., aluminium sidewalls). These heat losses alone are about one third the amount of offgas
losses from all the processes.
Numerous technologies are already well developed for waste heat recovery (e.g., recuperators, regenerators, etc.).
However, the challenge is that technologies are not always economical for a given application (e.g., applications with dirty
exhaust streams).
Barriers
Despite the significant environmental and energy savings benefits of waste heat recovery, its implementation depends
primarily on the economics and perceived technical risks. Industrial manufacturing facilities will invest in waste heat
recovery only when it results in savings that yield a “reasonable” payback period (<< 3 years) and the perceived risks are
negligible.
Numerous barriers impact the economy and effectiveness of heat recovery equipment and impede their wider installation.
Many of these barriers, described below, are interrelated, but can generally be categorized as related to cost, temperature
restrictions, chemical composition, application specifics, and inaccessibility/transportability of heat sources.
1) Costs
a. Long Payback Periods costs of heat recovery equipment, auxiliary systems, and design services lead to long
payback periods in certain applications. Additionally, several industry subsectors with high quality waste heat

36
Tebodin Ukraine CFI
Climate Technologies in Ukraine. Market Penetration Study
Order number: 71994
Document number: DR-001
Revision: C
August 28, 2015
Page 36 / 109
sources (e.g., metal casting) are renowned for small profit margins and intense internal competition for limited
capital resources.
b. Material Constraints and Costs certain applications require advanced and more costly materials. These materials
are required for high temperature streams, streams with high chemical activity, and exhaust streams cooled below
condensation temperatures. Overall material costs per energy unit recovered increase as larger surface areas are
required for more efficient, lower temperature heat recovery systems.
c. EconomiesofScale equipment costs favour largescale heat recovery systems and create challenges for small-
scale operations.
d. Operation and Maintenance Costs corrosion, scaling, and fouling of heat exchange materials lead to higher
maintenance costs and lost productivity.
2) Temperature Restrictions
a. Lack of a Viable EndUse many industrial facilities do not have an onsite use for low temperature heat.
Meanwhile, technologies that create enduse options (e.g., low temperature power generation) are currently less
developed and more costly.
b. Material Constraints and Costs
i. High temperature materials that retain mechanical and chemical properties at high temperatures are costly.
Therefore, waste heat is often quickly diluted with outside air to reduce temperatures. This reduces the quality
of energy available for recovery.
ii. Low temperature liquid and solid components can condense as hot streams cool in recovery equipment.
This leads to corrosive and fouling conditions. The additional cost of materials that can withstand corrosive
environments often prevents low temperature recovery.
iii. Thermal cycling the heat flow in some industrial processes can vary dramatically and create mechanical and
chemical stress in equipment.
c. Heat Transfer Rates small temperature differences between the heat source and heat sink lead to reduced heat
transfer rates and require larger surface areas.
3) Chemical Composition
a. Temperature Restrictions waste heat stream chemical compatibility with recovery equipment materials will be
limited both at high and low temperatures.
b. Heat Transfer Rates deposition of substances on the recovery equipment surface will reduce heat transfer rates
and efficiency.
c. Material Constraints and Costs streams with high chemical activity require more advanced recovery equipment
materials to withstand corrosive environments.
d. Operation and Maintenance Costs streams with high chemical activity that damage equipment surfaces will lead
to increased maintenance costs.
e. Environmental Concerns waste heat recovery from exhaust streams may complicate or alter the performance of
environmental control and abatement equipment.
f. Product/Process Control chemically active exhaust streams may require additional efforts to prevent cross
contamination between streams.
4) Application specific Constraints
a. Process specific Constrains equipment designs are process specific and must be adapted to the needs of a
given process. For example, feed preheat systems vary significantly between glass furnaces, blast furnaces, and
cement kilns.
b. Product/ Process Control heat recovery can complicate and compromise process/quality control systems.
5) Inaccessibility/Transportability
a. Limited Space many facilities have limited physical space in which to access waste heat streams (e.g., limited
floor or overhead space)
b. Transportability many gaseous waste heat streams are discharged at nearatmospheric pressure (limiting the
ability to transport them to and through equipment without additional energy input).
c. Inaccessibility it is difficult to access and recover heat from unconventional sources such as hot solid product
streams (e.g., ingots) and hot equipment surfaces (e.g., sidewalls of primary aluminium cells).

37
Tebodin Ukraine CFI
Climate Technologies in Ukraine. Market Penetration Study
Order number: 71994
Document number: DR-001
Revision: C
August 28, 2015
Page 37 / 109
Table 3.2 Temperature classification of waste heat sources and related recovery opportunity7
Temp Range
Example Sources Temp (°C) Advantages Disadvantages/
Barriers
Typical Recovery Methods/
Technologies
High [> 650°C]
Nickel refining furnace 1,370-1,650 High quality energy, available for a diverse range of end uses with varying temperature requirements High efficiency power generation High heat transfer rate per unit area
High temperature creates increased thermal stresses on heat exchange materials Increased chemical activity/corrosion
Combustion air preheat Steam generation for process heating or for mechanical/ electrical work Furnace load preheating Transfer to med low temperature processes
Steel electric arc furnace 1,370-1,650
Basic oxygen furnace 1,200
Aluminium reverberatory furnace 1,100-1,200
Copper refining furnace 760-820
Steel heating furnace 930-1,040
Copper reverberatory furnace 900-1,090
Hydrogen plants 650-980
Fume incinerators 650-1,430
Glass melting furnace 1,300-1,540
Coke oven 650-1,000
Iron cupola 820-980
Medium [230 - 650°C]
Steam boiler exhaust 230-480 More compatible with heat exchanger materials Practical for power generation
Combustion air preheat
Steam/ power generation
Organic Rankine cycle for power generation
Furnace load preheating, feed water preheating
Transfer to low temperature processes
Gas turbine exhaust 370-540
Reciprocating engine exhaust 320-590
Heat treating furnace 430-650
Drying & baking ovens 230-590
Cement kiln 450-620
Low [<230°C]
Exhaust gases exiting recovery devices in gas fired boilers, ethylene furnaces, etc.
70-230 Large quantities of low temperature heat contained in numerous product streams.
Few end uses for low temperature heat Low efficiency power generation For combustion exhausts, low temperature heat recovery is impractical due to acidic condensation and heat exchanger corrosion
Space heating Domestic water heating Upgrading via a heat pump to increase temp for end use Organic Rankine cycle
Process steam condensate Cooling water from:
50-90
furnace doors 30-50
annealing furnaces 70-230
air compressors 30-50
internal combustion engines 70-120
air conditioning and refrigeration condensers
30-40
Drying, baking, and curing ovens 90-230
Hot processed liquids/solids 30-230
3.3 Energy Management
ISO:50001
Today more than ever, effective energy management is a crucial issue for the success of any business. For many, the
answer is an Energy Management System (EMS) – a framework for the systematic management of energy. As well as
7 Waste Heat Recovery: Technology and Opportunities in U.S. Industry, Prepared by BCS, Incorporated March 2008

38
Tebodin Ukraine CFI
Climate Technologies in Ukraine. Market Penetration Study
Order number: 71994
Document number: DR-001
Revision: C
August 28, 2015
Page 38 / 109
enhancing energy efficiency, an EMS can cut costs and reduce Greenhouse Gas (GHG) emissions providing you with a
competitive advantage. The ISO 50001:2011 represents the latest best practice in energy management system upon
existing national standards and initiatives.
The standard specifies the requirements for an EMS to develop and implement a policy, identify significant areas of energy
consumption and target energy reductions.
Energy management system is a system of tools used to monitor, control and optimize energy consumption. ISO
50001:2011 provides a framework of requirements for organizations to:
Develop a policy for more efficient use of energy
Fix targets and objectives to meet the policy
Use data to better understand and make decisions about energy use
Measure the results
Review how well the policy works, and
Continually improve energy management.
Energy management is defined as the techniques, processes and activity which drive more efficient energy use. Energy
management allows for a reduction in costs, carbon emissions and risk, ensuring the efficient use of energy consumption.
This method for reducing energy consumption through the application of cost-free and low-cost measures was first widely
adopted in West Europe, in the United Kingdom in particular. The goal is to improve energy efficiency, reduce greenhouse
gas emissions and drive down energy costs.
Figure 3.13. Energy management system model
Energy Policy
Planning
Implementation
and Operation
Cheking and
Corrective Action
Corrective and
Preventive Action
Monitor and
MeasureInternal Audit
Management
Review
Continuous
Improvement

39
Tebodin Ukraine CFI
Climate Technologies in Ukraine. Market Penetration Study
Order number: 71994
Document number: DR-001
Revision: C
August 28, 2015
Page 39 / 109
3.4 Water Management Systems
Optimisation of water use by industries can lower water withdrawals from
local water sources thus increasing water availability, lowering wastewater
discharges and their pollutant load, reducing energy consumption and also
processing cost.
Water Management technologies include:
measures for water use minimisation and optimisation
recycling of water streams and effluent for industrial applications
waste water treatment technology including sludge treatment
Water minimisation, optimisation and recycling measures and technologies
are integrated in production and support processes, thus it is difficult to
compare them and their effectiveness. The incentives for introduction of
water minimisation and recycling are increasing water and energy cost.
Waste water treatment technologies are more standardised, although each water treatment process has to be designed
and adjusted to the treated water pollution and load. There are legal requirements for waste water treatment and also there
are incentives for minimisation of discharging effluents in the form of payments for its volume and pollution.
3.5 Air Cooling Systems
Air cooling condensers are mainly part of complex refrigeration and air-conditioning equipment installed in dairies,
bakeries, beverages producing and meat processing plants, temperature controlled warehouses. Industrial applications are
reported for printing sector and polymers production.
Air cooling condensers could be effectively applied under the total capacity of the heat transfer up to 2-3 MW. Under the
larger total heat transfer capacity the cooling water tower should be applied.
Application of air cooling condensers itself does not lead to energy savings. Energy saving is possible, e.g., under the use
variable speed fans in coolers.

40
Tebodin Ukraine CFI
Climate Technologies in Ukraine. Market Penetration Study
Order number: 71994
Document number: DR-001
Revision: C
August 28, 2015
Page 40 / 109
4 Current standards in EU
4.1 EU Best Available Techniques Reference Documents
For the technical specifications and reference indicators the Consultant applied the following main documents and
standards as listed below but not limited to:
1. EU Best Available Techniques Reference Documents (given below in alphabetical order):
BREF Common Waste Water and Waste Gas Treatment/ Management Systems in the Chemical Sector
Final Draft (2014)
BREF Non-Ferrous Metals Industries. Final Draft (2014)
BREF Polymers (2007)
BREF Ceramic Manufacturing Industry (2007)
BREF Energy Efficiency (2009)
BREF Ferrous Metals Processing Industry (2001)
BREF Food, Drink and Milk Industries (2006)
BREF Glass (2013)
BREF Industrial Cooling Systems (2001)
BREF Intensive Rearing of Pigs and Poultry (2003)
BREF Iron and Steel Production (2012)
BREF Large Combustion Plants (2006)
BREF Large volume inorganic chemicals – Ammonia, Acids, Fertilizers (2007)
BREF Large Volume Inorganic Chemicals – Solids and other industry (2007)
BREF Large Volume Organic Chemicals Draft 1 (2014)
BREF Organic fine chemicals (2006)
BREF Production of Cement, Lime and Magnesium Oxide (2013)
BREF Production of Specialty Inorganic Chemicals (2007)
BREF Production of Wood–based Panels (final draft, 2014)
BREF Pulp and paper (2013)
BREF Refining of Mineral oil and gas (2015)
2. Definition of High Efficiency cogeneration (EU Directive 2012/27/EU and 2004/8/EC, http://eur-
lex.europa.eu/legal-content/EN/TXT/?uri=CELEX:32012L0027
3. ISO 50001 Standard for Energy Management.

41
Tebodin Ukraine CFI
Climate Technologies in Ukraine. Market Penetration Study
Order number: 71994
Document number: DR-001
Revision: C
August 28, 2015
Page 41 / 109
4.2 EU BATs in Agro industrial sector
Chapter below contains the short description of BAT in Agro industrial sector in EU, GHG savings indicators, applicability
and penetration categorizations. The detail description is given in Attachments 1 and 2.
4.2.1 Cogeneration
Table 4.1 EU BREFs in co-generation in agro industry
Climate Technology
Brief technical specification and considered range
BAT documents reference
EU BAT, incl. EE and GHG savings indica-
tors, investment costs and PBP
(EU - CZ and NL practice)
BAT Penetration categorisation
8
Gas (including biogas) engine CHP
CHP < 2 MW Energy Efficiency (Feb. 2009)
Definition of High Efficiency Cogeneration
9
BAT available
PBP from 6 to 10 years10
3
MW6 < CHP > 2 MW BAT available
PBP from 6 to 10 years
3
Back pressure steam turbine
Pass-out steam turbine
- Steam boiler + back pressure
- Steam turbine CHP > 2 MW < 6 MW
- Organic Rankine Cycle (ORC)
Large Combustion Plants (July 2006)
Food, Drink and Milk Industries (FDM) (Aug. 2006). Chapter 4.2.13.1.1.
BAT available
PBP from 6 to 10 years
3
Organic Rankine Cycle (ORC)
- CHP
- Electrical power generation Usually longer PBP,
about 10 installed in CZ (1
st in 2005), but still
need to be supported
2
8 1-Introduction of new technology’; ‘2-Increased acceptance of new technology’; ‘3-Growing importance and application of technology’;
‘4-Fully mature technology’ 9 High efficiency cogeneration is defined in EU Directive 2012/27/EU as that which saves at least 10% of primary energy compared to the
alternative methods of generating heat and power separately (based on determined energy efficiency reference values) 10
Pay back depends on no. of factors, price of gas, price of electricity, availability of any additional subsidy.

42
Tebodin Ukraine CFI
Climate Technologies in Ukraine. Market Penetration Study
Order number: 71994
Document number: DR-001
Revision: C
August 28, 2015
Page 42 / 109
4.2.2 Heat recovery
Table 4.2 EU BREFs in heat recovery in agro industry
Climate Technology
Brief technical specification and considered range
BAT documents reference
EU BAT, incl. EE and GHG savings indica-
tors, investment costs and PBP
(EU - CZ and NL practice)
BAT Penetration categorisation
Medium-tempe-rature recovery systems from e.g. furnaces (incl. applications in aggressive environments)
230-650oC BAT available
Low-cost measure, often 1- 2 years. payback
3
(for the low cost measures)
Low-temperature recovery systems from condensate and hot water examples bellow:
< 230oC Energy
Efficiency (Feb. 2009)
BAT available
Low-cost measure, PBP 1- 2 years.
3
(for the low cost measures)
Heat recovery from cooling systems
Heat recovered from cooling equipment and compressors; use of heat-exchangers and storage tanks for warm water.
50 – 60ºC achievable
FDM Section 4.2.13.5
Significant energy consumption reduction
IC: € 160,000
PBP: 6.3 years (depends on actual situation, attractive on larger farms).
3
Well known system, applicable in food
production installations; economically feasible in installations with deep
freeze storage
Heat recovery in vegetable oil extraction
Hydrogenation reaction of vegetable oil produces heat of 41.67 - 152.78 kWh/t of feedstock; heat is used to heat the product to desired reaction temperature and generate steam.
FDM Section 4.7.4.4
The steam generation - 25 – 125 kWh/t of unrefined oil.
5 - 10 % consumption of primary energy is reduced
2
(technically applicable in edible oil refineries)
Not widely applied yet
Heat recovery in dairies
Regenerative heat-exchange in pasteurisation and UHT treatment (e.g. nine plate exchangers)
FDM Section 4.7.5.6
Energy savings up to 90 %
IC: € 370,000 PBP: 3.6 years.
3
Widely applied in dairies
Utilisation of heat from warm whey for preheating cheese milk using plate heat-exchangers and buffer tanks for water circulation
FDM Section 4.7.5.14.7
Energy savings
IC: € 1.6 million for the whole whey processing; incl. RO unit + heat treatment recovery.
PBP 3.8 years.
3
Applicable with relatively low pay back

43
Tebodin Ukraine CFI
Climate Technologies in Ukraine. Market Penetration Study
Order number: 71994
Document number: DR-001
Revision: C
August 28, 2015
Page 43 / 109
Climate Technology
Brief technical specification and considered range
BAT documents reference
EU BAT, incl. EE and GHG savings indica-
tors, investment costs and PBP
(EU - CZ and NL practice)
BAT Penetration categorisation
Heat recovery from pasteurisation in ice-cream production
FDM Section 4.7.5.15.1
Reduced energy consumption by 14%, and water consumption by 1,000 l/t of ice-cream
2
Payback relatively long
Heat recovery in breweries
Re-use of hot water from wort cooling - heat-exchanger used for cooling the wort from 100 ºC to about 10 ºC.
FDM Section 4.7.9.6.4
Reduced energy and water consumption, and odour emissions
3
Applicable in new breweries
Heat recovery from wort boiling - recovering the heat from the vapour for either boiling the wort or to preheat the wort before boiling.
FDM Section 4.7.9.6.5
Reduced energy and water consumption, and odour emissions
2
Applicable in new breweries, high capital
costs
in new EU breweries, or in existing ones with
high energy consumption., heat
recovery is considered after other energy
reductions, e.g. to a level of 41.66 – 55.55
kWh/hl
4.2.3 Energy Management systems, automation and practices
Table 4.3 EU BREFs in EMS in agro industry
Climate Technology
Brief technical specification and considered range
BAT documents reference
EU BAT, incl. EE and GHG savings indica-
tors, investment costs and PBP
(EU - CZ and NL practice)
BAT Penetration categorisation
Energy
management
systems
Energy management systems
(automation system for
technical metering – sub-
metering systems)
Energy
Efficiency
(Feb-2009)
ISO 50001
standard
BAT available
PB difficult to determine.
First step in EMS is often
good housekeeping,
leading to some savings
(few %) directly, but EMS
often identifies other
energy saving
possibilities
3
(widely used in industry)
But little ISO 50001
certified firms
Advanced Two-stage drying – using spray FDM Section Energy consumption for 2
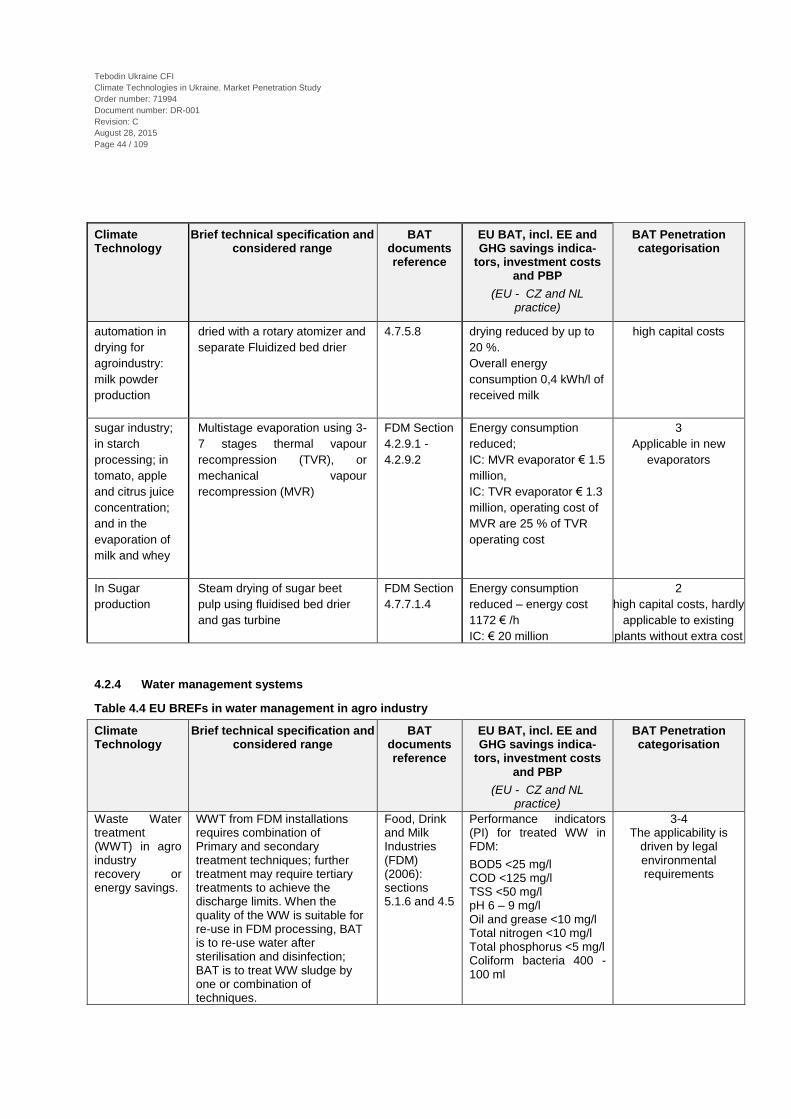
44
Tebodin Ukraine CFI
Climate Technologies in Ukraine. Market Penetration Study
Order number: 71994
Document number: DR-001
Revision: C
August 28, 2015
Page 44 / 109
Climate Technology
Brief technical specification and considered range
BAT documents reference
EU BAT, incl. EE and GHG savings indica-
tors, investment costs and PBP
(EU - CZ and NL practice)
BAT Penetration categorisation
automation in
drying for
agroindustry:
milk powder
production
dried with a rotary atomizer and
separate Fluidized bed drier
4.7.5.8
drying reduced by up to
20 %.
Overall energy
consumption 0,4 kWh/l of
received milk
high capital costs
sugar industry;
in starch
processing; in
tomato, apple
and citrus juice
concentration;
and in the
evaporation of
milk and whey
Multistage evaporation using 3-
7 stages thermal vapour
recompression (TVR), or
mechanical vapour
recompression (MVR)
FDM Section
4.2.9.1 -
4.2.9.2
Energy consumption
reduced;
IC: MVR evaporator € 1.5
million,
IC: TVR evaporator € 1.3
million, operating cost of
MVR are 25 % of TVR
operating cost
3
Applicable in new
evaporators
In Sugar
production
Steam drying of sugar beet
pulp using fluidised bed drier
and gas turbine
FDM Section
4.7.7.1.4
Energy consumption
reduced – energy cost
1172 € /h
IC: € 20 million
2
high capital costs, hardly
applicable to existing
plants without extra cost
4.2.4 Water management systems
Table 4.4 EU BREFs in water management in agro industry
Climate Technology
Brief technical specification and considered range
BAT documents reference
EU BAT, incl. EE and GHG savings indica-
tors, investment costs and PBP
(EU - CZ and NL practice)
BAT Penetration categorisation
Waste Water treatment (WWT) in agro industry recovery or energy savings.
WWT from FDM installations requires combination of Primary and secondary treatment techniques; further treatment may require tertiary treatments to achieve the discharge limits. When the quality of the WW is suitable for re-use in FDM processing, BAT is to re-use water after sterilisation and disinfection; BAT is to treat WW sludge by one or combination of techniques.
Food, Drink and Milk Industries (FDM) (2006): sections 5.1.6 and 4.5
Performance indicators (PI) for treated WW in FDM:
BOD5 <25 mg/l COD <125 mg/l TSS <50 mg/l pH 6 – 9 mg/l Oil and grease <10 mg/l Total nitrogen <10 mg/l Total phosphorus <5 mg/l Coliform bacteria 400 - 100 ml
3-4 The applicability is
driven by legal environmental requirements

45
Tebodin Ukraine CFI
Climate Technologies in Ukraine. Market Penetration Study
Order number: 71994
Document number: DR-001
Revision: C
August 28, 2015
Page 45 / 109
Climate Technology
Brief technical specification and considered range
BAT documents reference
EU BAT, incl. EE and GHG savings indica-
tors, investment costs and PBP
(EU - CZ and NL practice)
BAT Penetration categorisation
Screening for removal of coarse solids using static, vibrating and rotary screens.
- Operation of vibrating screens 900 - 1800 rpm Rotary screens head loss 5 - 10 mbar.
FDM Section 4.5.2.1.
SS, FOG and BOD/COD levels reduced - pollution load reduction up to 40 %
Recovery of products, e.g. pulp in the fruit and vegetable sector.
4 Basic WWT technique
Anaerobic processes producing CH4 as a by-product to treat polluted WW with a COD 1500 - 70000 mg/l
E.g. Expanded granular sludge bed reactors with loading up to 30 kg COD/m3 per day
FDM Section 4.5.3.2
e.g. FDM Section 4.5.3.2.8
COD removal 75 – 90 %; produced CH4 is burned in a CHP plant to generate electricity and heat.
Final COD level 500 – 1000 mg/ml Sludge generated per kg of COD removed 0.04 – 0.08 SS/kg
3 High cost, but utilisation
of CH4 improve the efficiency
UV radiation by UV light at 254 nm used for disinfection
FDM Section 4.5.4.8.2
Waste water re-use, even as drinking water
2 – 3 High cost
Re-use of process water in potato starch manufacturing - condensed vapours treated by activated sludge process, sand filter and UV disinfection
WW volume: 200 m³/h; COD 1500 ± 300 mg/l
FDM Section 4.5.7.6.3
Reduction in fresh water consumption and in WW volume; PI: COD <25 mg/l BOD5 <10 mg/l
2 high capital cost
compared to alternative technology (land
spreading)
Water recovery in a vegetable processing by: 1) WW aerobic treatment supplemented by sand filtration; 2) steam stripping; 3) anaerobic pre-treatment.
FDM Section 4.5.7.3.3
Reduced water consumption below 3,5 m3/t product; cost of the recovered process water 1.03 €/m3
2 – 3 High cost
Segregation of water streams to optimise re-use and treatment
FDM Section 4.1.7.8
Reduced water and energy consumption; reduced water contamination
4 Cost saving measure, sometime required by
water permits
Reduction of water consumption in FDM
Using proper water nozzles and their optimal setting in fish processing
FDM Section 4.1.8.8
Water consumption can be reduced by up to 90 %
4
Commonly used
In fruit and vegetables sector apply dry separation of rejected raw material from the sorting step and solid residues
FDM Section 4.1.7.6
Water consumption can be reduced by up to 20 %
3 -4
Widely used depending on the type of processed
fruit/ vegetable
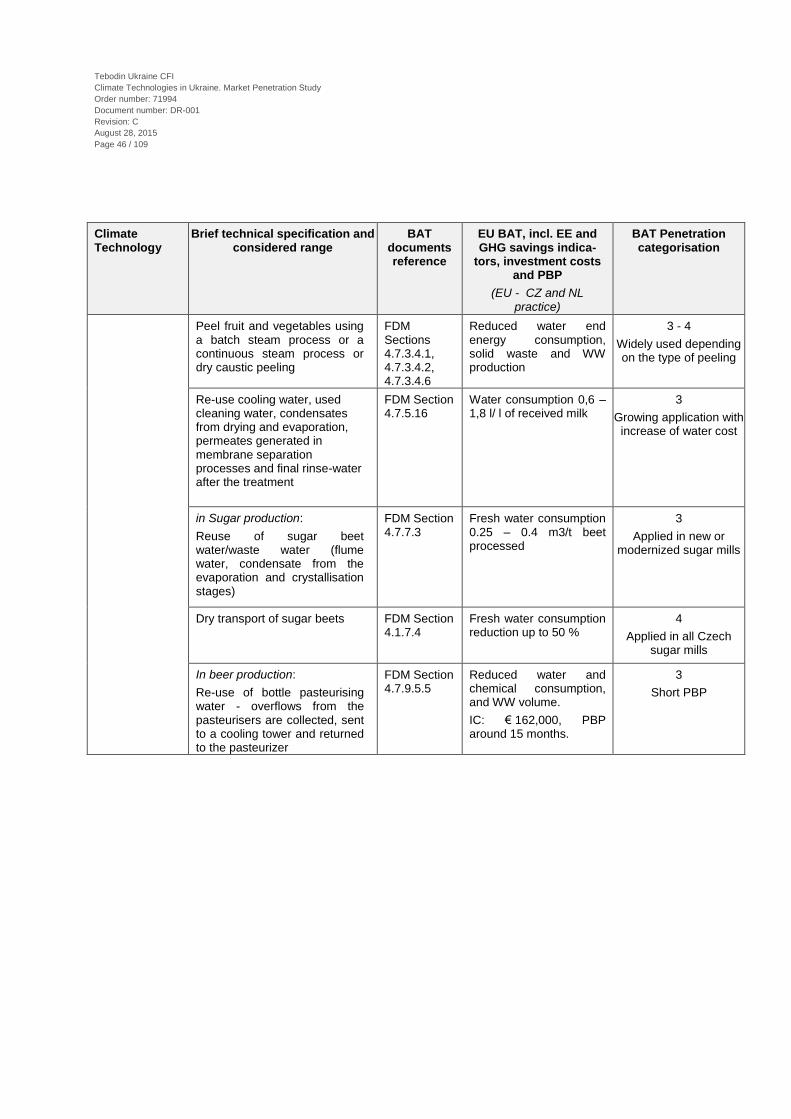
46
Tebodin Ukraine CFI
Climate Technologies in Ukraine. Market Penetration Study
Order number: 71994
Document number: DR-001
Revision: C
August 28, 2015
Page 46 / 109
Climate Technology
Brief technical specification and considered range
BAT documents reference
EU BAT, incl. EE and GHG savings indica-
tors, investment costs and PBP
(EU - CZ and NL practice)
BAT Penetration categorisation
Peel fruit and vegetables using a batch steam process or a continuous steam process or dry caustic peeling
FDM Sections 4.7.3.4.1, 4.7.3.4.2, 4.7.3.4.6
Reduced water end energy consumption, solid waste and WW production
3 - 4
Widely used depending on the type of peeling
Re-use cooling water, used cleaning water, condensates from drying and evaporation, permeates generated in membrane separation processes and final rinse-water after the treatment
FDM Section 4.7.5.16
Water consumption 0,6 – 1,8 l/ l of received milk
3
Growing application with increase of water cost
in Sugar production:
Reuse of sugar beet water/waste water (flume water, condensate from the evaporation and crystallisation stages)
FDM Section 4.7.7.3
Fresh water consumption 0.25 – 0.4 m3/t beet processed
3
Applied in new or modernized sugar mills
Dry transport of sugar beets FDM Section 4.1.7.4
Fresh water consumption reduction up to 50 %
4
Applied in all Czech sugar mills
In beer production:
Re-use of bottle pasteurising water - overflows from the pasteurisers are collected, sent to a cooling tower and returned to the pasteurizer
FDM Section 4.7.9.5.5
Reduced water and chemical consumption, and WW volume.
IC: € 162,000, PBP around 15 months.
3
Short PBP

47
Tebodin Ukraine CFI
Climate Technologies in Ukraine. Market Penetration Study
Order number: 71994
Document number: DR-001
Revision: C
August 28, 2015
Page 47 / 109
4.2.5 Air cooling systems (air cooled condensers)
Table 4.5 EU BREFs in air cooling in agro industry
Climate Technology
Brief technical specification and considered range
BAT documents reference
EU BAT, incl. EE and GHG savings indica-
tors, investment costs and PBP
(EU - CZ and NL practice)
BAT Penetration categorisation
Air cooling systems (air cooled condensers)
Air cooling systems in FDM
sectors:
Avoid the use of ozone
depleting substances in cooling
system by substituted by other
refrigerants (e.g. ammonia,
glycol or, chilled water)
FDM section
4.1.9.3
BAT available,
Need to look sector
specific
No new cooling system
with ozone depleting
substances
3
Required by legislation
(Generally applied 11
)
4.2.6 Other technologies
Consultant suggests considering the following technologies as eligible for the programme, however, additional research is
required as of Ukraine market potential and penetration.
Table 4.6 Other EU BREFs relevant to CO2 and GHG emission reduction in agro industry
Climate Technology
Brief technical specification and considered range
BAT documents reference
EU BAT, incl. EE and GHG savings indica-
tors, investment costs and PBP
(EU - CZ and NL practice)
BAT Penetration categorisation
CO2 recovery in breweries, wineries, distilleries
CO2 recovery and purification
from the fermentation process
or as a by-product of another
process
FDM Section
4.2.4.1
In the brewing sector, the
reduction in CO2
emissions +/- 2 kg/hl (20
kg/m3) of beer produced.
2
External CO2 supply,
can be cheaper than the
production cost in the
installation
Biogas production
Anaerobic treatment of manure
in a biogas reactor; minimum
farm size - 50 livestock units
(LU)
Intensive
rearing of
pigs and
poultry
BREF
(2003),
section 4.9.6
Reduced organic dry
matter to 30 – 40 %,
biogas production (25 m3
per m3 of slurry) with
CH4 concentration 65 %.
From pig slurry CH4
production 200 l/kg of dry
matter (6.5 kWh).
IC: biogas plant with a
capacity of 100 LU is
3
Application in Europe
supported by subsidies
11
Could be innovative as well if we talk about tri-generation
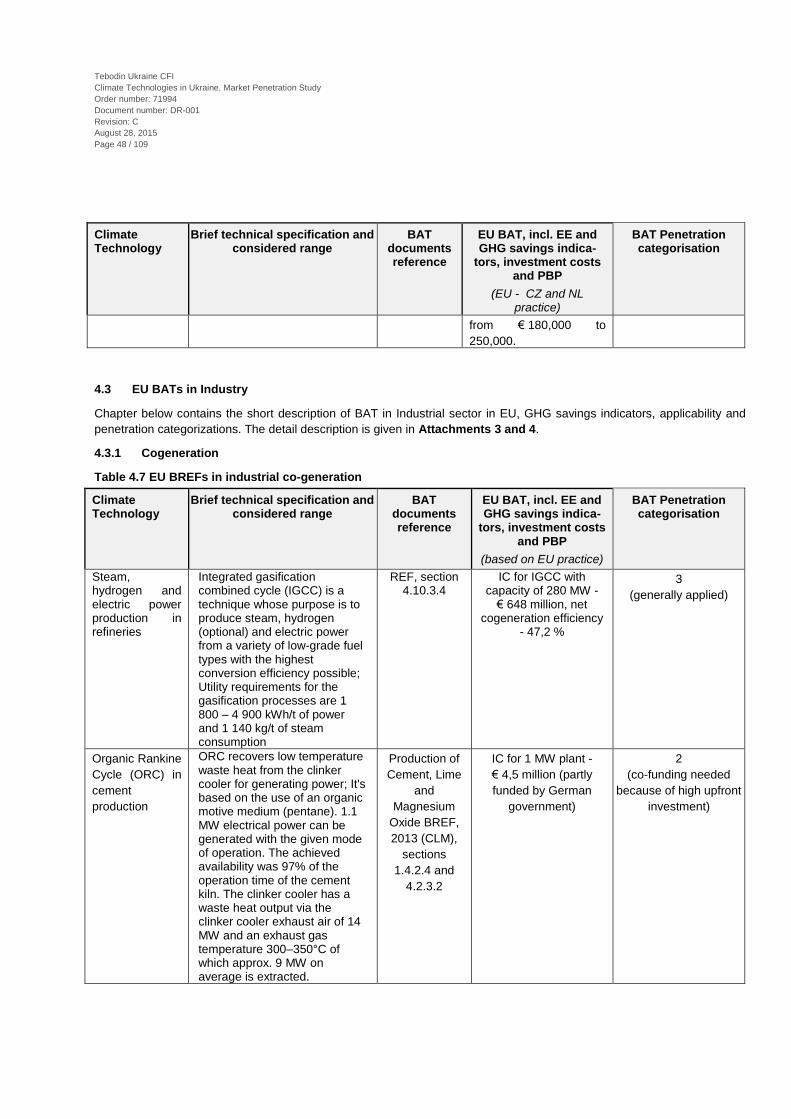
48
Tebodin Ukraine CFI
Climate Technologies in Ukraine. Market Penetration Study
Order number: 71994
Document number: DR-001
Revision: C
August 28, 2015
Page 48 / 109
Climate Technology
Brief technical specification and considered range
BAT documents reference
EU BAT, incl. EE and GHG savings indica-
tors, investment costs and PBP
(EU - CZ and NL practice)
BAT Penetration categorisation
from € 180,000 to
250,000.
4.3 EU BATs in Industry
Chapter below contains the short description of BAT in Industrial sector in EU, GHG savings indicators, applicability and
penetration categorizations. The detail description is given in Attachments 3 and 4.
4.3.1 Cogeneration
Table 4.7 EU BREFs in industrial co-generation
Climate Technology
Brief technical specification and considered range
BAT documents reference
EU BAT, incl. EE and GHG savings indica-
tors, investment costs and PBP
(based on EU practice)
BAT Penetration categorisation
Steam, hydrogen and electric power production in refineries
Integrated gasification combined cycle (IGCC) is a technique whose purpose is to produce steam, hydrogen (optional) and electric power from a variety of low-grade fuel types with the highest conversion efficiency possible; Utility requirements for the gasification processes are 1 800 – 4 900 kWh/t of power and 1 140 kg/t of steam consumption
REF, section 4.10.3.4
IC for IGCC with capacity of 280 MW -
€ 648 million, net cogeneration efficiency
- 47,2 %
3
(generally applied)
Organic Rankine
Cycle (ORC) in
cement
production
ORC recovers low temperature waste heat from the clinker cooler for generating power; It's based on the use of an organic motive medium (pentane). 1.1 MW electrical power can be generated with the given mode of operation. The achieved availability was 97% of the operation time of the cement kiln. The clinker cooler has a waste heat output via the clinker cooler exhaust air of 14 MW and an exhaust gas temperature 300–350°C of which approx. 9 MW on average is extracted.
Production of
Cement, Lime
and
Magnesium
Oxide BREF,
2013 (CLM),
sections
1.4.2.4 and
4.2.3.2
IC for 1 MW plant -
€ 4,5 million (partly
funded by German
government)
2
(co-funding needed
because of high upfront
investment)

49
Tebodin Ukraine CFI
Climate Technologies in Ukraine. Market Penetration Study
Order number: 71994
Document number: DR-001
Revision: C
August 28, 2015
Page 49 / 109
4.3.2 Heat recovery
Table 4.8 EU BREFs in industrial heat recovery
Climate Technology
Brief technical specification and considered range
BAT documents reference
EU BAT, incl. EE and GHG savings indica-
tors, investment costs and PBP
(based on EU practice)
BAT Penetration categorisation
Combined heat
and dryer
systems for
particleboard
and OSB
UTWS Combined heat and dryer systems with a heat exchanger and thermal treatment of discharged dryer waste gases. The technology for existing plants include a dust abatement system for the combustion plant, heat exchangers for flue-gas and dryer gas heat transfer
Production of
Wood–based
Panels BREF,
final draft, 2014,
(WBP), section
4.2.2.3
Reduces the
consumption of water
and energy and
eliminates the handling
of sludge from wet
abatement systems.
1 - 2
(innovative, installed at
four installations only)
Heat recovery in pulp and paper
Heat recovery from radial vacuum blowers used in vacuum systems - exhaust air from blowers reaches 130 – 160°C.
Pulp and paper BREF (2013),
section 2.9.6.1.1
Recuperation of up to 75% of the power absorbed by the blowers;
Example: steam savings 26 kWh/t, PBP 1.5 years
3 – 4
(generally applied, common in most newer
plants)
Use of thermo-compressors to increase the pressure of the exhaust vapours from separators; requirements for steam pressure 5 - 12 bar
Section 2.9.6.1.2
Steam savings 25 kWh/t
PBP 0.8 years
4
(generally applied installation common in all new paper mills and
most of the latest rebuilds)
heat recovery in cement production
Dry process kiln with multistage cyclone preheaters and with precalcination where exhaust gases and recovered waste heat from the cooler is used to preheat and precalcine the raw material feed before entering the kiln; raw material input moisture max 8.5%
CLM, sections 4.2.3.1,
1.4.2.1.1, 1.4.2.3
Energy consumption 2 900 – 3 300 MJ/tonne
clinker (production capacity - 3000 t/d); reduction of energy
compared to wet kilns about 36 %; Process changes from wet to dry may cost up to
€ 100 million
2 – 3 (saves significant
amounts of energy, but upfront investments
high, applicable to new plants and major
upgrades, subject to raw materials moisture
content)
Heat recovery in lime production
Heat exchangers for long rotary kilns (LRK) to recover surplus heat from flue gases or to permit the use of a wider range of fuels; surplus heat from LRK is used to dry limestone for other processes such as limestone milling
CLM, sections 2.4.2 and 4.3.3
reduction of energy consumption to 6 - 9,2
GJ/t of product
2 – 3 (saves significant
amounts of energy, but upfront investments
high, applicable to long rotary kilns)
Heat recovery in magnesium oxide production
Heat recovery from exhaust gases by preliminary heating of the magnesite. Heat losses from the kiln can be used for drying fuels, raw materials and some packaging materials.
CLM, sections 3.4.2 and 4.4.2
energy consumption 6 -12 GJ/t of product
2 – 3 (saves significant
amounts of energy, but upfront investments
high, applicable to all types of kilns)

50
Tebodin Ukraine CFI
Climate Technologies in Ukraine. Market Penetration Study
Order number: 71994
Document number: DR-001
Revision: C
August 28, 2015
Page 50 / 109
Climate Technology
Brief technical specification and considered range
BAT documents reference
EU BAT, incl. EE and GHG savings indica-
tors, investment costs and PBP
(based on EU practice)
BAT Penetration categorisation
Heat recovery in ceramics production
Recovery of excess heat from the cooling zones of tunnel kilns, usually supplemented with hot air from gas burners; excess heat from an afterburner used, either in the kiln or in the dryer; and some processes employ heat exchangers to recover heat from kiln flue-gases in order to preheat the combustion air.
CER, section 4.1.2 and 5.1.2
combined heat recycling system with
natural gas energy requirement for drying and firing 840 - 1050
kJ/kg fired ware (bricks)
2 - 3 (only applicable if the
excess heat is needed elsewhere, applicable in
all ceramic sectors to heat dryers, but only if
the excess heat is needed at the same
time in another process)
Heat recovery in refineries
Waste heat boiler and expander applied to the flue-gas from the fluidized bed Catalytic Cracking (FCC) regenerator; Heat recovery from the regenerator flue-gas is conducted in a waste heat boiler, to increase efficiency an expander in the flue-gas stream can be installed. Heat recovery from the reactor vapour is conducted in the main fractionator by heat integration with the unsaturated gas plant.
REF, section 4.5.2
The waste heat boiler recovers the heat from
the flue-gas and the expander recovers part of the pressure for use in the compression of the air needed in the
regenerator. An example of the
application of an expander saved 15
MWe from the flue-gas generated by a FCC with a capacity of 5
Mt/yr.
2 – 3 (Retrofitting of this
equipment can be very difficult because of
space limitations in the refinery. For small or low-pressure units, expanders are not
justified economically)
Heat integration of crude distillation units with the high vacuum unit and the thermal cracker - through a) Increase crude distillation column pumparounds from 2 to 4. b) Reboil side strippers with heat transfer oil rather than by steam stripping. c) Heat transfer in the crude preheating is improved using specific antifouling treatments in the crude heat exchanger train.
REF, section 4.19.2
Reduced energy consumption
2 -3 (commonly applicable, integration in retrofitting
applications will normally depend on the plot space available and the possibility to execute
these modifications in the available shutdown
time)
Heat recovery from sintering and sinter cooling (iron production)
The sensible heat from the main exhaust gas from the sintering machines, and the sensible heat of the cooling air from the sinter cooler
Iron and Steel
Production,
2012 (IS),
Section 3.3.5.1
Reported energy recovery amounts to
18% of the total energy input for the waste heat boiler and 2.2% of total
energy input for recirculation to the
ignition hoods
3
(Heat recovery from
sinter cooling is applied
frequently in the EU)
Heat recovery from sintering and sinter cooling (iron production)
Recycling of waste gas from the end sinter strand combined with heat exchange
IS, Section
3.3.5.2.2
With an investment of € 14 million, solid fuel
consumption is reduced by 5 – 7 kg solid fuel/t sinter (12.5 % of the
2
(Applied in Germany in
one large steel mill)

51
Tebodin Ukraine CFI
Climate Technologies in Ukraine. Market Penetration Study
Order number: 71994
Document number: DR-001
Revision: C
August 28, 2015
Page 51 / 109
Climate Technology
Brief technical specification and considered range
BAT documents reference
EU BAT, incl. EE and GHG savings indica-
tors, investment costs and PBP
(based on EU practice)
BAT Penetration categorisation
fuel demand) with a corresponding savings
in operational cost.
Heat recovery at pelletisation plants (iron production)
Recovery of sensible heat from the induration strand
IS, Section 4.3.8 The estimated investment for the ‘hot air recirculation duct’
was € 5 million. Savings in energy costs
total EUR 2.8 million /year.
3
(Recovery of sensible
heat is a process-
integrated part of
pelletisation plants)
Heat recovery at coke production
Coke dry quenching IS, Section
5.3.14
The investment for production of 2 million
tonnes of coke is approximately € 100
million. PBP 3-8 years.
3
(applied in about 100
plants worldwide, mainly
in Asia)
Heat recovery at hot dipping
Heat Recovery from Galvanising Kettle Heating
Ferrous Metals Processing
Industry (2001), Section C.4.6.8
Energy reductions in the range 15 – 45 kWh/t
black steel
3
(applied widely,
mentioned as such in
BREF of 2001)
Waste gases heat recovery in Glass production
Waste heat boilers for generation of steam, which is used for heating, etc.; incoming gas temperature 600 - 300 'C, recoverable heat approx. 200'C; applicable heat exchangers: pipe bundle or tube register
Glass BREF, 2013, (GLS), section 4.8.4
and 5.2.1
heat recovery 0,31 - 0,1 GJ/t melted glass;
IC: € 0,5 - 1,67 million depending on the glass
sectors and furnace capacity; cost/t of glass 0,79 - 2,36 EUR/t glass
2 – 3 (widely known
technology, but PB of investment not attractive in all cases, applicable to fuel/air and oxy-fuel
fired furnaces)
Waste gases residual heat recovery in Glass production
Batch and cullet preheating by: a) direct preheaters, b) indirect preheaters (a cross-counter flow, plate hear exchanger), c) Praxair EGB filter (Edmeston electrified granulate bed filter system); preheating temperatures should be in the range 270 °C - 550 °C
GLS section 4.8.5 and 5.2.1
Energy savings 10 - 20 %; increase of furnace capacity up to 15 %; IC
for furnace with capacity 350 - 500 t/day are € 2,5 - 3,4
million
2 – 3 (primarily limited to
container glass sector)
Heat recovery from drying in wood based panels production
Recovery of heat from air emissions by evaporative condensation, heat exchangers, preheating supply air to the dryer and recirculation of hot waste. Latent heat is recovered from the dryer waste gas, using evaporative condensation and heat exchangers. Direct heat is recovered by heat exchangers.
WBP, section 4.6.1.1
Increase of energy efficiency.
Recirculation of waste gases can be
performed as retrofits and PBP is expected to
be short.
4 (generally applied)
Heat recovery from steam
Heat recovery of from steam used in the cooking stage of
WBP, section 4.6.1.5
Lower the overall energy consumption for
2 (technique is applied,

52
Tebodin Ukraine CFI
Climate Technologies in Ukraine. Market Penetration Study
Order number: 71994
Document number: DR-001
Revision: C
August 28, 2015
Page 52 / 109
Climate Technology
Brief technical specification and considered range
BAT documents reference
EU BAT, incl. EE and GHG savings indica-
tors, investment costs and PBP
(based on EU practice)
BAT Penetration categorisation
during refining in wood based panels production
refining by: heat exchangers, falling film evaporators, and plate evaporators that in turn preheat water for steam generation and heat water for chip washing and pre-cooking stages. Steam recovery by vacuum evaporation, where water is separated from the fibres, producing distilled hot water. The condensate can be used as fuel and water for steam generation
refining and water consumption;
Economic efficiency is to be assessed for
each situation
but no reference plants in BREF)
Energy recovery from the hot process gases (AlF3 production)
The use of hot process gases for drying and preheating reduces energy consumption. The gradients of temperature between the hot process gases and the raw materials are high enough to recover the energy from the hot process gases and to use it for drying fluorspar and preheating the reactants.
BREF Large
volume inorganic
chemicals
(LVIC-S),
Section 7.1.4.1.2
Improved energy
efficiency of the
process, decreased
manufacturing cost of
AlF3 production.
2
(applied in Norway, no
other example known]
Heat recovery at ferroalloys production
Recovery of heat from semi-closed furnaces
BREF Non-Ferrous Metals Industries. Final
Draft (2014), Section 8.3.8.1
If the waste heat is utilised as electrical
power, the recovery is up to 15 – 35 % of the
electrical energy consumption
2
(known applications
limited to Norway and
Sweden)
Recovery of exothermic heat
The reaction of ammonia and ethylene oxide is exothermic - opportunity to recover heat, particularly as the distillations is performed under vacuum in order to avoid co-product quality deterioration.
Large volume
organic
chemical BREF,
(LVOC), Section
5.4.5.1.2
Heat recovery 2
(Generally applicable,
but return on
investments may be too
high)
Heat recovery in
H2SO4
production
A thermal efficiency of 85 – 90 % achieved by using waste heat released from the acid cooling for drying processes or for the production of low pressure steam with a special heat recovery system. A modern double contact plant (sulphur burning) can export about 6 GJ/ tonne H2SO4
Large volume
inorganic
chemicals –
Ammonia, Acids,
Fertilizers, 2007,
(LVIC-AAF),
Section 4.4.15
The amount of
recoverable energy and
export options depend
mainly on SO2 source
and process. If no
energy consumer is
available, recovered
energy can be partially
converted into electrical
power.
2
(little information about
reference plants)
Heat recovery
from kiln (HF)
The kiln shell exit gas temperature goes up to about 400 °C, depending on the HF
LVIC-AAF,
Section 6.4.2
The recovered energy
for the whole
2
(little information about

53
Tebodin Ukraine CFI
Climate Technologies in Ukraine. Market Penetration Study
Order number: 71994
Document number: DR-001
Revision: C
August 28, 2015
Page 53 / 109
Climate Technology
Brief technical specification and considered range
BAT documents reference
EU BAT, incl. EE and GHG savings indica-
tors, investment costs and PBP
(based on EU practice)
BAT Penetration categorisation
production rate. Several heat recovery systems remove the excess heat to reduce the gas temperature to 200 / 250 °C. The recovered heat is used to preheat reactant feeds, the combustion air, or other fluids in the production unit.
installation is estimated
to be around 20 % of
the total energy used.
reference plants,
applicable for new
installations)
Recovery of
residual heat
(AN/CAN)
Residual low temperature heat is used to chill water, using a LiBr/H2O absorption cooler; the chilled water was used to cool down air for product cooling.
LVIC-AAF,
Section 9.4.2
IC: € 900,000.
Reduction of energy
consumption.
3
(widely used in industry)
4.3.3 Energy Management systems, automation and practices
Table 4.3 EU BREFs in EMS in industry
Climate Technology
Brief technical specification and considered range
BAT documents reference
EU BAT, incl. EE and GHG savings indica-
tors, investment costs and PBP
(based on EU practice)
BAT Penetration categorisation
Energy management systems (EMS)
Energy management
systems (automation
system for technical
metering – sub-metering
systems)
ENE (2009)
2.1 Energy
efficiency
management
systems (ENEMS)
2.2.2 A systems
approach to
energy
management
2.8.1 Process
control systems
2.10.3 Metering
and advanced
metering systems
ISO 50001 standard since 2011
BREF ENE mentions
energy management
and several national
standards, but
ISO 50001 is globally
accepted standard
since 2011.
PB difficult to
determine. First step in
EMS is often good
housekeeping, leading
to some savings (few
%) directly, but EMS
often identifies other
energy saving
possibilities
3
(widely used in industry) But little ISO 50001
certified firms
Energy management systems (EMS) in Iron and Steel Production
Energy management
systems (automation
system for technical
metering – sub-metering
systems)
Iron and Steel
Production, 2012
(IS)
Section 9.1.2 Energy management.
3
(widely used in industry) But little ISO 50001
certified firms

54
Tebodin Ukraine CFI
Climate Technologies in Ukraine. Market Penetration Study
Order number: 71994
Document number: DR-001
Revision: C
August 28, 2015
Page 54 / 109
Energy management systems (EMS) in Pulp and Paper production
Energy management
systems (automation
system for technical
metering – sub-metering
systems)
PP BREF, section
2.9.5 - Energy
efficiency
analysis, energy
management and
energy audits
3.3.27 Measures
for increased
energy efficiency
8.2.4 Energy consumption and efficiency
3
(widely used in industry) But little ISO 50001
certified firms
4.3.4 Water management systems:
Climate Technology
Brief technical specification and considered range
BAT documents reference
EU BAT, incl. EE and GHG savings indica-
tors, investment costs and PBP
(based on EU practice)
BAT Penetration categorisation
Reduction of water consumption in pulp and paper sector
Pulp and paper BREF (2013)
Dry debarking with debarking drum (Cost are relevant for capacity of about 1300 ADt/d kraft pulp)
PP section 2.9.2.2
WW amount decreases often by 5 – 10 m3/ADt IC: new dry debarking system - € 15 million. Conversion of existing wet to dry debarking system - € 4 – 6 million.
3 - 4 Applied in most EU
plants
Energy efficient vacuum systems for dewatering
Section 2.9.6.2.1 Water savings of around 95%; electrical power savings of approx. 20 – 45%
3 Widely used
Pinch
Technology
Pinch Technology is a methodology for optimising the consumption of consumables in processes and on sites by introducing process integration techniques. It has been used as an energy saving tool to improve thermal efficiency in the chemical and process industries, also for water and WW minimisation.
BREF Common
WW and Waste
Gas Treatment/
Management
Systems in the
Chemical Sector
(2003), CWW
Section 7.2
The application of
Pinch Technology has
succeeded in WW
savings of up to 60 %.
Performance examples
for WW flow reduction:
• Chemicals and fibres
25 %
• Chemicals 40 %
• Oil Refining 20–30 %
• Coal Chemicals 50 %
• Polymers 60 %.
3
Widely applied across
all chemical sectors as
well as in other
industries
Process water
optimisation in
ceramic industry
re-use of process waste water in the same process step, in particular repeated re-use of the cleaning water after suitable treatment
CER, section
4.4.5.1 and 5.1.2
process waste water recycling ratios in different ceramic
industry sectors: Wall and floor tiles up to 80 %; Sanitary ware
and household
3 – 4 Widely used
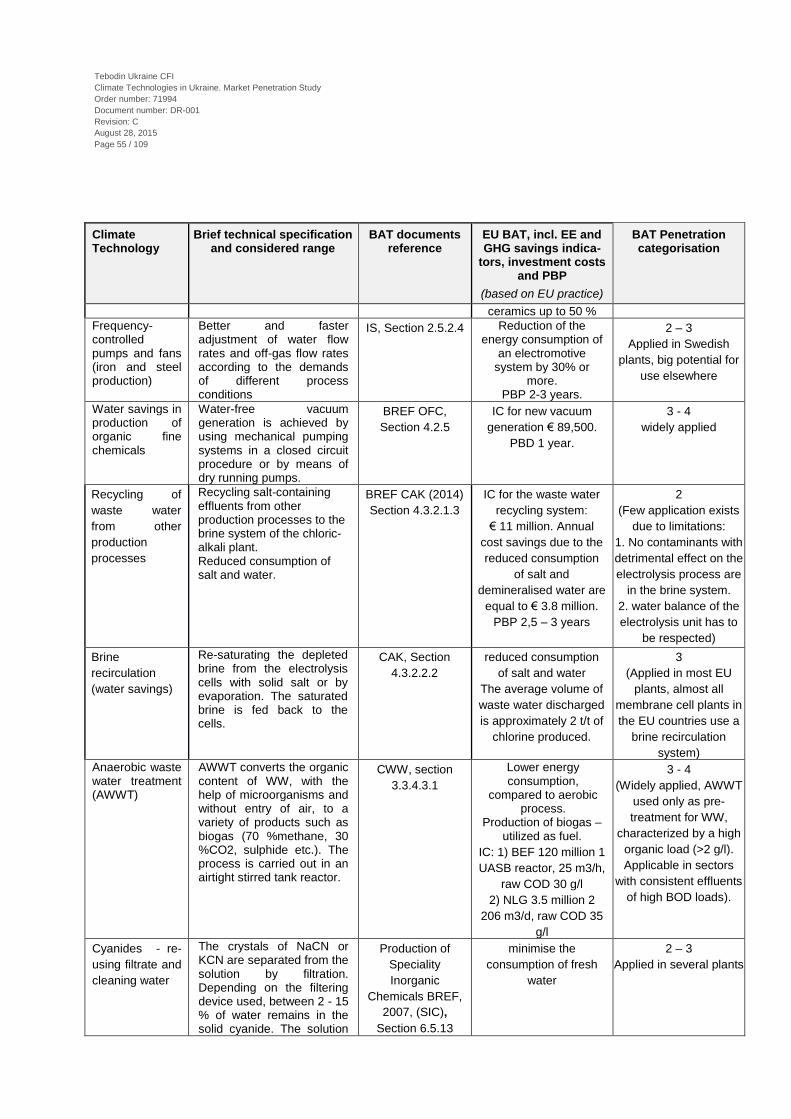
55
Tebodin Ukraine CFI
Climate Technologies in Ukraine. Market Penetration Study
Order number: 71994
Document number: DR-001
Revision: C
August 28, 2015
Page 55 / 109
Climate Technology
Brief technical specification and considered range
BAT documents reference
EU BAT, incl. EE and GHG savings indica-
tors, investment costs and PBP
(based on EU practice)
BAT Penetration categorisation
ceramics up to 50 %
Frequency-controlled pumps and fans (iron and steel production)
Better and faster adjustment of water flow rates and off-gas flow rates according to the demands of different process conditions
IS, Section 2.5.2.4 Reduction of the energy consumption of
an electromotive system by 30% or
more. PBP 2-3 years.
2 – 3
Applied in Swedish
plants, big potential for
use elsewhere
Water savings in production of organic fine chemicals
Water-free vacuum generation is achieved by using mechanical pumping systems in a closed circuit procedure or by means of dry running pumps.
BREF OFC,
Section 4.2.5
IC for new vacuum
generation € 89,500.
PBD 1 year.
3 - 4
widely applied
Recycling of
waste water
from other
production
processes
Recycling salt-containing effluents from other production processes to the brine system of the chloric-alkali plant. Reduced consumption of salt and water.
BREF CAK (2014)
Section 4.3.2.1.3
IC for the waste water
recycling system:
€ 11 million. Annual
cost savings due to the
reduced consumption
of salt and
demineralised water are
equal to € 3.8 million.
PBP 2,5 – 3 years
2
(Few application exists
due to limitations:
1. No contaminants with
detrimental effect on the
electrolysis process are
in the brine system.
2. water balance of the
electrolysis unit has to
be respected)
Brine
recirculation
(water savings)
Re-saturating the depleted brine from the electrolysis cells with solid salt or by evaporation. The saturated brine is fed back to the cells.
CAK, Section
4.3.2.2.2
reduced consumption
of salt and water
The average volume of
waste water discharged
is approximately 2 t/t of
chlorine produced.
3
(Applied in most EU
plants, almost all
membrane cell plants in
the EU countries use a
brine recirculation
system)
Anaerobic waste water treatment (AWWT)
AWWT converts the organic content of WW, with the help of microorganisms and without entry of air, to a variety of products such as biogas (70 %methane, 30 %CO2, sulphide etc.). The process is carried out in an airtight stirred tank reactor.
CWW, section
3.3.4.3.1
Lower energy consumption,
compared to aerobic process.
Production of biogas – utilized as fuel.
IC: 1) BEF 120 million 1
UASB reactor, 25 m3/h,
raw COD 30 g/l
2) NLG 3.5 million 2
206 m3/d, raw COD 35
g/l
3 - 4
(Widely applied, AWWT
used only as pre-
treatment for WW,
characterized by a high
organic load (>2 g/l).
Applicable in sectors
with consistent effluents
of high BOD loads).
Cyanides - re-
using filtrate and
cleaning water
The crystals of NaCN or KCN are separated from the solution by filtration. Depending on the filtering device used, between 2 - 15 % of water remains in the solid cyanide. The solution
Production of
Speciality
Inorganic
Chemicals BREF,
2007, (SIC),
Section 6.5.13
minimise the
consumption of fresh
water
2 – 3
Applied in several plants

56
Tebodin Ukraine CFI
Climate Technologies in Ukraine. Market Penetration Study
Order number: 71994
Document number: DR-001
Revision: C
August 28, 2015
Page 56 / 109
Climate Technology
Brief technical specification and considered range
BAT documents reference
EU BAT, incl. EE and GHG savings indica-
tors, investment costs and PBP
(based on EU practice)
BAT Penetration categorisation
is then returned to the crystalliser. The rinsing water containing cyanide is recycled back into the process.
4.3.5 Air cooling systems (air cooled condensers)
Climate Technology
Brief technical specification and considered range
BAT documents reference
EU BAT, incl. EE and GHG savings indica-
tors, investment costs and PBP
(based on EU practice)
BAT Penetration categorisation
Kiln cooler in lime production
Efficient cooler with homogeneous air distribution and product discharge to minimise the quantity of required cooling air
CLM, sections 2.4.2 and 4.3.3
energy efficiency improvement
N/A
4.3.6 Other technologies
Consultant suggests considering the following technologies as eligible for the programme, however, additional research is
required as of Ukraine market potential and penetration.
Climate Technology
Brief technical specification and considered range
BAT documents reference
EU BAT, incl. EE and GHG savings indica-
tors, investment costs and PBP
(EU - CR and NL practice)
BAT Penetration categorisation
Energy recovery (iron production)
Gas recovery system for top hopper release
IS, Section 6.3.5 A return on the investment from the
saving in the CO and H2 release is about
151,000 € /y.
2
A few applications
know
Energy recovery (iron production)
Energy recovery from top gas pressure
IS, Section 6.3.13 Energy savings are estimated at up to 0.4 GJ/t of hot metal for a
15 MW turbine. The savings amount to 2% of the gross blast
furnace energy demand
3
Applied worldwide at
modern blast furnaces
with a high top gas
pressure and volume
Energy recovery (steel production)
Energy recovery from the BOF gas
IS, Section 7.3.7 About 80% of the BOF gas will be recovered resulting in an annual
energy savings of 2600 TJ/yr. = approximately 12 € /GJ investment.
3
widely applied at
oxygen steel plants
around the world, long
PBP

57
Tebodin Ukraine CFI
Climate Technologies in Ukraine. Market Penetration Study
Order number: 71994
Document number: DR-001
Revision: C
August 28, 2015
Page 57 / 109
Climate Technology
Brief technical specification and considered range
BAT documents reference
EU BAT, incl. EE and GHG savings indica-
tors, investment costs and PBP
(EU - CR and NL practice)
BAT Penetration categorisation
PBP 5 years
improve the energy efficiency of the combustion process in wood based panels production
Dewatering of bark and sludge - dewatering equipment includes filters and screens, screw presses, belt presses, drum presses and centrifuges that remove excess water from wet bark, biomass-based sludge from air abatement systems and for waste water treatment
WBP, section
4.6.1.3
improve the energy
efficiency of the
combustion process
3
(widely applied for
sludge derived from
the internal wet
abatement systems of
dryers and presses,
and from some
treatment steps in
waste water treatment
plants)
Optimum furnace design in glass sector
Regenerative end-fired furnaces with overall thermal efficiency of around 50 %, combustion air preheat temperature up to 1400 °C
GLS section 4.8.1 and 5.2.1
Energy consumption: up to 3500 kJ/kg container glass (tank capacity 600
t); up to 6000 kJ/kg tableware (tank capacity
250 t)
3 - 4 Applied for new plants;
for existing plants in case of a complete
furnace rebuild
Energy savings in refineries
Progressive distillation unit with integrated crude distillation unit (CDU) or High Vacuum Unit (HVU) saves up to 30 % on total energy consumption for these units
REF, section 4.19.1
The energy savings for a 9 700 000 tonnes/yr.
refinery is in the range of 50 000 t of heavy fuel
compared to conventional techniques; IC: € 41,000 – 55 000
per t/yr.
3 (widely applied,
applicable to all or part of CDU/ HVU units
when being constructed and also
in revamps for debottlenecking)
Replacement of old kiln with new energy efficient kiln in ceramic production
Replacing old kiln with fast firing kilns e.g. roller hearth kilns (RHK), improved thermal insulation of kilns, use high velocity burners
Ceramic Manufacturing Industry, 2007 (CER), section 4.1.1 and 5.1.2
reduced energy consumption; energy consumption for firing wall and floor tiles in
RHK at 1150 'C - max 4800 KJ/t, firing sanitary ware in RHK at 1260 'C -
max 5000 KJ/t
3 (widely applied,
applicable to new plants and
replacement of old kilns)
Energy savings and process efficiency in refineries
Good desalting practices which aim to wash the crude oil or heavy residues with water at temperature 115 - 150 'C and at high pressure to dissolve, separate, and remove the salts. Good practices include: 1. Multistage desalters and the combined use of AC and DC fields providing high desalting efficiencies and energy savings; 2. Recycling, in multistage desalters, part of the brine effluent water of 2nd stage
Refining of Mineral oil and gas, 2015 (REF), sections
2.9, 4.9.1
Two-stage processes achieve min 95 % of the
salts/solids removed; energy savings, less
corrosion and catalyst deactivation
2 Applied in several
plants

58
Tebodin Ukraine CFI
Climate Technologies in Ukraine. Market Penetration Study
Order number: 71994
Document number: DR-001
Revision: C
August 28, 2015
Page 58 / 109
Climate Technology
Brief technical specification and considered range
BAT documents reference
EU BAT, incl. EE and GHG savings indica-
tors, investment costs and PBP
(EU - CR and NL practice)
BAT Penetration categorisation
desalters to the 1st stage, minimising the wash water quantity; 3. Use of a low-shear mixing device to mix desalter wash water and crude; 4. Avoiding turbulence in desalter vessels by using lower water pressure.
Energy savings
in polymer
production
Gear pumps Use of a gear pump instead of or in combination with an extruder
POL Section
12.1.13
Energy savings 2 Applied in several plants
High pressure
polyethylene
process
Gas phase processes – no limitation as long as fluidised conditions and homogeneous temperature conditions are maintained in the reactor system. The recycling energy is reduced by improving heat removal by the addition of a condensable solvent and/or co-monomer in the reactor system.
POL, Section
12.2.4
Increase of energy
efficiency, Increase of
the polymer
concentration
3 Applied in several
countries
Optimisation of
the stripping in
suspension
processes (PP,
HDPE)
Recycling of monomer to the process and thus reduction of CO2 emissions. By subsequent condensation, the stripped monomer is recovered and after purification recycled back into the process.
POL, Section
12.2.3.2
Reduction of CO2
emissions; monomer
content in the product
is reduced by >75 % / t
of product, about 10 kg
of monomers can be
recycled back into the
process.
3 - 4 Widely applied
Dicyclopentadie
ne (DCPD)
polyester
production
process
The production of DCPD resins generates gaseous emissions which can be treated by regenerative thermal oxidation with energy recovery; DCPD base resin consumes 20 – 35 wt.-% DCPD raw material, creating 6 – 10 % reaction water and other by-products, which are treated.
POL, Section
6.2.5.2
energy recovery 2 Applied in a few plants
Microwave Assisted Organic Synthesis
Microwave Assisted Organic Synthesis (MAOS) uses microwave energy to heat and drive chemical reactions. Microwave irradiation efficiently heats
Organic fine
chemicals BREF,
2006, (OFC),
Section 6.3
Higher energy
efficiency. Applicable to
a number of reaction
types. Very high IC
(many times higher
1 Based on data from 2004 is classified as
emerging technique in the BREF, limitation to large scale utilisation

59
Tebodin Ukraine CFI
Climate Technologies in Ukraine. Market Penetration Study
Order number: 71994
Document number: DR-001
Revision: C
August 28, 2015
Page 59 / 109
Climate Technology
Brief technical specification and considered range
BAT documents reference
EU BAT, incl. EE and GHG savings indica-
tors, investment costs and PBP
(EU - CR and NL practice)
BAT Penetration categorisation
the materials by a ‘microwave dielectric heating’ effect. This phenomenon is dependent on the ability of a specific material (solvent or reagent) to absorb microwave energy and convert it to heat.
than for conventional
heating equipment.
Stripping and thermal oxidation of methanol
Methanol and other low molecular compounds can be stripped off with steam and can then be treated together with process exhaust gases by thermal oxidation.
OFC, Section
4.3.5.9
Energy savings
Stripping and
thermal oxidation per
year € 1,760,000
2 Applied in several plants
Thermal oxidation of VOCs and co-incineration of liquid waste
Thermal oxidation is a proven method for destroying VOCs and especially hazardous air pollutants, operating at the highest efficiencies and suitable for almost all VOC sources, incl. process vents, storage tanks, material transfer operations, and treatment, storage and disposal facilities.
OFC, Section
4.3.5.7
The incinerator is
designed to burn about
300 kg spent solvents/
h (combustion factor =
40 MJ/kg). This saves
400 m3 of natural gas
per hour. Saves in total
3300000 m3 natural
gas/year.
Savings are above
440,000 € /year.
4 Widely applied in all EU
production of
soda ash
Decreasing water content in the crude sodium bicarbonate by its centrifugation before the calcination, in order to minimise the energy requirements for its decomposition.
BREF LVIC-S,
Section 2.4.5
Energy savings
resulting in reduced
steam requirements in
the sodium bicarbonate
calcination section,
reduced usage of fuel
in the associated
boiler/power plant;
energy consumption
reduced by 10 %.
3 Applied in several EU
countries
Energy recovery - SILIKONE CARBIDE (SiC)
Gas collection process under the PE foil. It is led to the energy recovery plant where the gas is combusted and energy recovered. Energy consumption amounts to 5.2 – 6.2 MWh/t SiC.
LVIC-S, Section
7.9.4.3
Energy recovery 15 %
of the total energy
consumption.
The energy savings - 1
MWh/t SiC produced
compared to Freiland
furnace
2 Applied in several plants
Tail-gas combustion devices
Thermal combustors achieving combustion efficiencies similar to product dryers and boilers
LVIC-S, Section
4.4.3
IC: for a boiler for
superheated high
pressure steam (100
2 Applied in several plants

60
Tebodin Ukraine CFI
Climate Technologies in Ukraine. Market Penetration Study
Order number: 71994
Document number: DR-001
Revision: C
August 28, 2015
Page 60 / 109
Climate Technology
Brief technical specification and considered range
BAT documents reference
EU BAT, incl. EE and GHG savings indica-
tors, investment costs and PBP
(EU - CR and NL practice)
BAT Penetration categorisation
or CHP. The energy recovery generated by tail-gas can be utilized in the carbon black plant. The potential energy recovery varies between 17 and 30 GJ/t carbon black produced.
bar, 530 °C) varies
between 115,000 -
70,000 € /Mt steam/h.
Total IC: € 11.5 million
for unit of 100 t/h
Energy Efficiency
Use of a regenerative burner
BREF Non-
Ferrous Metals
Industries, 2014,
(NFM), Section
2.12.2.2
PBP 1 year (in
aluminium sector)
3 Applied in several EU countries, short PBP
Energy Efficiency
Preheating and pre-reduction of ores to reduce the energy consumption
NFM, Section
8.3.2.7
The electrical energy
consumption is reduced
by 70 – 90 kWh per 100
ºC increase in the
preheating temperature
of the smelting furnace
3 Widely applied
Energy recovery at ferroalloys production
Energy recovery from a closed electric arc furnace
NFM, Section
8.3.8.2
The cost is estimated to
be about 0.025 € / kWh
2 Applied in several plants
Membrane cell technique
Energy consumption for the mercury, diaphragm and membrane cell techniques is based on the energy necessary to produce 1 t of dry and compressed chlorine with its co-products: dry hydrogen and 50 wt.-% caustic soda or potash. Membrane cell technique has the lowest total energy consumption.
BREF CAK
Section 3.3.4.6
Membrane cell
technique’s
consumption of
electrical energy is the
lowest and the amount
of steam needed for
concentration of the
caustic solution is
moderate.
2 Applied in a few plants
Lower olefin –
optimization of
heat transfer
Locating burners at positions within the cracker furnace that maximise heat transfer. Maximise the number of burners that are located on the furnace floor.
Large volume
organic chemical
BREF, (LVOC),
Section 4.4.4.2
Floor-mounted burners
tend to give better rates
of radiant heat transfer.
This increase the
efficiency of energy
use.
2 Applied mostly for new
plants
Toluene Diisocynate (TDI) and (MDI) - Gas phase phosgenation
The gas phase phosgenation technology results in significant savings on solvents and energy consumption.
LVOC, Section
6.4.5.3
Energy savings by 40–
60 % solvent usage
reduced by 80 %.
3 Widely applied
Aromatics – distillation process
The separation of a three-component mixture into its fractions in distillation
LVOC, Section
8.4.4.1.5
DWC cut capital and
energy costs by
approximately 30 %
2 – 3 Applied in several plants

61
Tebodin Ukraine CFI
Climate Technologies in Ukraine. Market Penetration Study
Order number: 71994
Document number: DR-001
Revision: C
August 28, 2015
Page 61 / 109
Climate Technology
Brief technical specification and considered range
BAT documents reference
EU BAT, incl. EE and GHG savings indica-
tors, investment costs and PBP
(EU - CR and NL practice)
BAT Penetration categorisation
dividing wall column (DWC) is more cost effective compared to conventional systems.
compared to a
traditional two-column
system. IC: 20 % less;
Energy cost 35 %
lower; 40 % less space
Advanced conventional processes (ammonia)
Advanced conventional process plants are usually characterised by: • high duty primary reformer using high pressures of up to 40 bar • equipped with low NOx burners • stoichiometric air in secondary reforming • low energy CO2 removal system.
LVIC-AAF,
Section 2.4.1
Reduced reformer
firing, lower NOx
emissions and energy
savings.
2 Applied mostly for new
plants
Pre-reforming (ammonia)
A pre-reformer installed prior to the primary reformer, in combination with a suitable steam saving measures, reduces energy consumption and NOx emissions. Pre-reforming takes place through an adiabatically operated catalyst bed, before the primary reformer. The cooled gas needs to be reheated before it is passed to the primary reformer.
LVIC-AAF,
Section 2.4.5
Up to 5 – 10 % reduced
energy consumption;
Conversion of steam
savings to fuel gas
savings.
3 Widely applied
Ammonia reforming revamp
Revamp of existing steam reforming ammonia plant with capacity 1100 t/day aims to improve efficiency of the primary reformer furnace/gas turbine combination by preheating of the mixed feed and install an efficient gas turbine adapted to suit the oxygen requirements of the furnace.
LVIC-AAF,
Section 2.4.4
Increase energy
efficiency and capacity
energy consumption
after revamp: 30.6 GJ/t.
IC: € 5,700,000
PBP: less than 1 year.
3 – 4 Applied in most of plants, short PBP
Ammonia – reforming plant improvements
Gas turbine for driving the process air compressor and using the hot exhaust gases, which still contain sufficient oxygen, as preheated combustion air in the primary reformer. The preheating of the combustion air saves fuel for the firing of the reformer
LVIC-AAF,
Section 2.4.8
Overall efficiency for
the driving and preheat
operations – min. 90 %.
3 Applied in many plants

62
Tebodin Ukraine CFI
Climate Technologies in Ukraine. Market Penetration Study
Order number: 71994
Document number: DR-001
Revision: C
August 28, 2015
Page 62 / 109
Climate Technology
Brief technical specification and considered range
BAT documents reference
EU BAT, incl. EE and GHG savings indica-
tors, investment costs and PBP
(EU - CR and NL practice)
BAT Penetration categorisation
but the higher flame temperatures might increase NOx formation.
ammonia - CO2 removal systems
Addition of special catalyst to improve the energy consumption of “hot potassium carbonate CO2” removal systems.
LVIC-AAF,
Section 2.4.11
Energy savings of 30 –
60 MJ/kmol CO2 (about
0.8 – 1.9 GJ/t NH3).
3 Widely applied
Stripping and recycling of process condensates in ammonia production
The condensation of the steam surplus in the gas downstream of the shift conversion forms process condensate. The condensate contains NH3 and CH3OH as contaminants, which can be removed by stripping with process steam and then recycled to the primary reformer. The stripped condensate can be recycled to the boiler feed-water after further cleaning by an ion exchange.
LVIC-AAF,
Section 2.4.16
Energy consumption for
stripping.
IC: € 2.9 – 3.3 million
for retrofit in existing
plants with a capacity of
1500 t/day.
2 Applied in a few plants;
high IC cost
Low pressure catalyst for ammonia synthesis
A new ammonia synthesis catalyst containing ruthenium and an alkali promoter on a graphite support has a much higher activity per volume compared to the conventional iron-based catalyst. This allows energy savings in the ammonia synthesis reactor, since lower operation pressures can be used and a higher conversion rate per pass can be obtained. The catalyst volume can also be reduced.
LVIC-AAF,
Section 2.4.17
An energy reduction of
up to 1.2 GJ/tonne NH3
can be achieved, but it
might be offset by the
necessity to spend
energy for ammonia
refrigeration.
2 Applied mostly for new
plants
Hydrogen recovery from ammonia synthesis
A continuous purge gas stream has to be withdrawn to remove inerts from the ammonia synthesis loop. In more recent designs, the hydrogen is recovered from this purge gas and recycled to the synthesis loop.
LVIC-AAF,
Section 2.4.21
Energy savings. 2 Applied in a few cases
Urea and urea ammonium nitrate (UAN)
The removal of most of the residual carbamate and NH3 from the reaction
LVIC-AAF,
Section 8.4.2
Enables almost
complete raw material
recovery;
4 Generally applied

63
Tebodin Ukraine CFI
Climate Technologies in Ukraine. Market Penetration Study
Order number: 71994
Document number: DR-001
Revision: C
August 28, 2015
Page 63 / 109
Climate Technology
Brief technical specification and considered range
BAT documents reference
EU BAT, incl. EE and GHG savings indica-
tors, investment costs and PBP
(EU - CR and NL practice)
BAT Penetration categorisation
production solution by stripping with CO2 at high pressure. In comparison with conventional processes, this saves a lot of energy for decomposition at low pressures and recompression for recycling to the process.
High energy savings in
comparison with
conventional
processes.
NH3 stripping process (urea production)
The removal of most of the residual carbamate from the reaction solution by self-stripping with NH3 at high pressure. In comparison with conventional processes, this saves a lot of energy for decomposition at low pressures and recompression for recycling to the process.
LVIC-AAF,
Section 8.4.3
Enables almost
complete raw material
recovery
Big energy savings in
comparison with
conventional
processes. Improved
performance in
comparison to
conventional total
recycling processes.
3 Applied in many plants
Isobaric double recycling process (IDR) in urea production
The heat of condensation is recovered as 7 bar steam which is used downstream in the process. Urea solution leaving the IDR loop contains unconverted ammonia, carbon dioxide and carbamate. These residuals are decomposed and vaporised in 3 successive distillers and heated with medium pressure steam and low pressure recovered steam. Then vapours are condensed to carbamate solution and recycled into the synthesis loop. The urea solution leaving the LP decomposition is fed to two vacuum evaporators in series, producing the urea melt for prilling and granulation.
LVIC-AAF,
Section 8.4.4
energy savings and
improved performance
in comparison to
conventional total
recycling processes
2 Applied in a few plants
Redirecting fines to the concentrated urea solution
Dust is often separated after the granulator and also redirected to the installation, where it is taken along with the fluidisation air to the scrubber and ends up in a
LVIC-AAF,
Section 8.4.6
Energy savings 32000 t
of steam/year.
IC: € 143,000,
implemented in 1999.
4 Generally applied

64
Tebodin Ukraine CFI
Climate Technologies in Ukraine. Market Penetration Study
Order number: 71994
Document number: DR-001
Revision: C
August 28, 2015
Page 64 / 109
Climate Technology
Brief technical specification and considered range
BAT documents reference
EU BAT, incl. EE and GHG savings indica-
tors, investment costs and PBP
(EU - CR and NL practice)
BAT Penetration categorisation
dilute solution. This solution is concentrated due to evaporation.
Heat integration in stripping plants in urea production
Heat integration between the synthesis section and downstream sections reduces the energy requirement.
LVIC-AAF,
Section 8.4.8
Reduced energy
consumption.
In a modern total
recycling process,
conversion of ammonia
to a solid urea requires
3.3 GJ/t of urea.
2 Applied in a few plants
in EU
Auto thermal granulation in CAN production
Off-gas from fluid bed coolers is used for drying the product in the drying drum. That makes significant energy savings and enables the plant to run auto thermally for nearly all CAN grades.
LVIC-AAF,
Section 9.4.5
significant energy
savings
2 Applied in a few plants
in EU
Bio trickling Bio trickling abate low concentrations of pollutants that are easily soluble in water and readily biodegradable Bio trickling works under similar conditions to bio scrubbing but, in contrast to bio scrubbing, the microbes are fixed on supporting elements
Final draft –
revised BREF
CWW (2014)
Section 3.5.1.2.3
Low energy
consumption and thus
limited CO2 emissions.
IC: per 1 000 m3/h are
€ 10,000–30,000
3 Widely applied in sewerage water pumping stations
PCl3 - use hot condensate water to melt elemental phosphorus and to keep it in liquid form
The energy required to melt phosphorus can be provided by hot condensate water coming from other parts of the process
SIC, Section
6.2.4.1
Reduction of energy
and water consumption
Very low costs.
2 Applied in several plants
Energy recovery in distillation
Heat recovery options. a) Heat exchange between distillation feed and product: heat may be exchanged from product flow to feed flow to save energy in the distillation. b) Vapour recompression can reduce the energy needed up to 90%. c) Energy recovery from condenser.
LVOC, Section
15.4.3.2.3
Savings in heat
exchange depend on
concentrations;
potential savings up to
25 % (0.25 GJ/t for 45
% by weight feed and
50 % by weight
product).
Vapour recompression
saves steam.
2 Applied mostly for new
plants
Improving calorific value of biofuels
Drying of biofuel and sludge utilising excess heat using flue-gases from the
PP Section
2.9.6.1.4
60 % dry content of the
wet biofuel;
2 – 3 depends on the
regulations on the use of
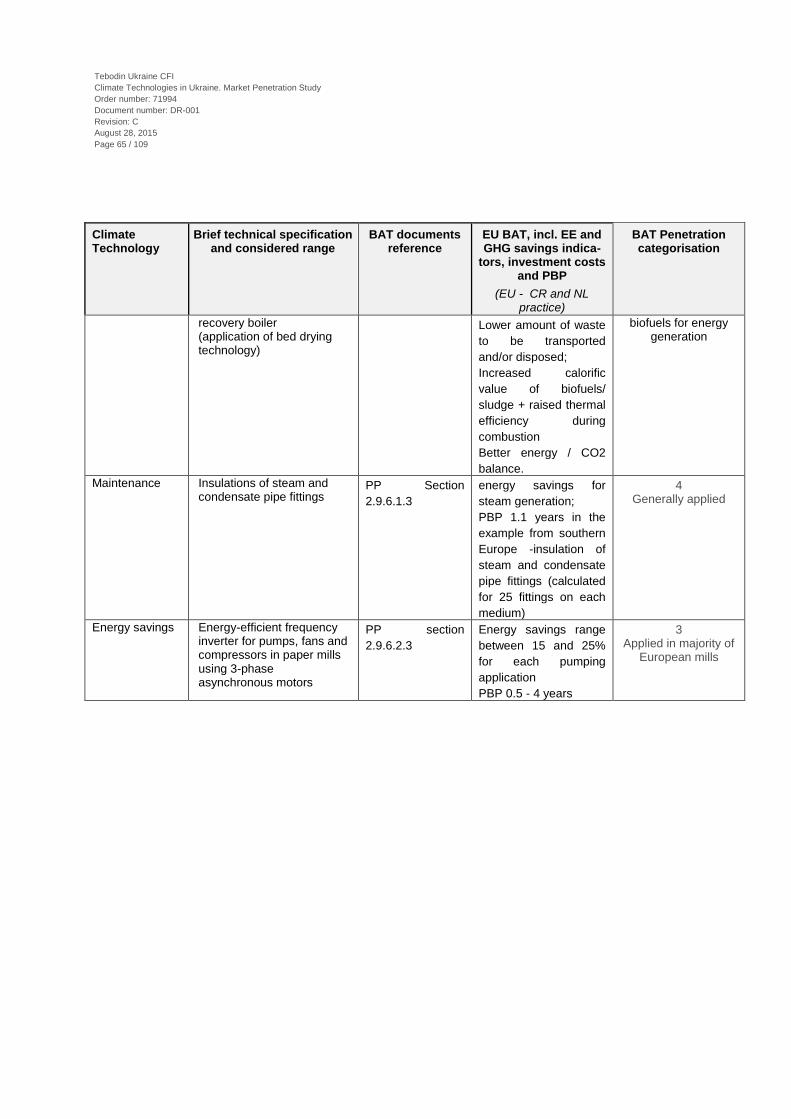
65
Tebodin Ukraine CFI
Climate Technologies in Ukraine. Market Penetration Study
Order number: 71994
Document number: DR-001
Revision: C
August 28, 2015
Page 65 / 109
Climate Technology
Brief technical specification and considered range
BAT documents reference
EU BAT, incl. EE and GHG savings indica-
tors, investment costs and PBP
(EU - CR and NL practice)
BAT Penetration categorisation
recovery boiler (application of bed drying technology)
Lower amount of waste
to be transported
and/or disposed;
Increased calorific
value of biofuels/
sludge + raised thermal
efficiency during
combustion
Better energy / CO2
balance.
biofuels for energy generation
Maintenance Insulations of steam and condensate pipe fittings
PP Section
2.9.6.1.3
energy savings for
steam generation;
PBP 1.1 years in the
example from southern
Europe -insulation of
steam and condensate
pipe fittings (calculated
for 25 fittings on each
medium)
4 Generally applied
Energy savings Energy-efficient frequency inverter for pumps, fans and compressors in paper mills using 3-phase asynchronous motors
PP section
2.9.6.2.3
Energy savings range
between 15 and 25%
for each pumping
application
PBP 0.5 - 4 years
3 Applied in majority of
European mills
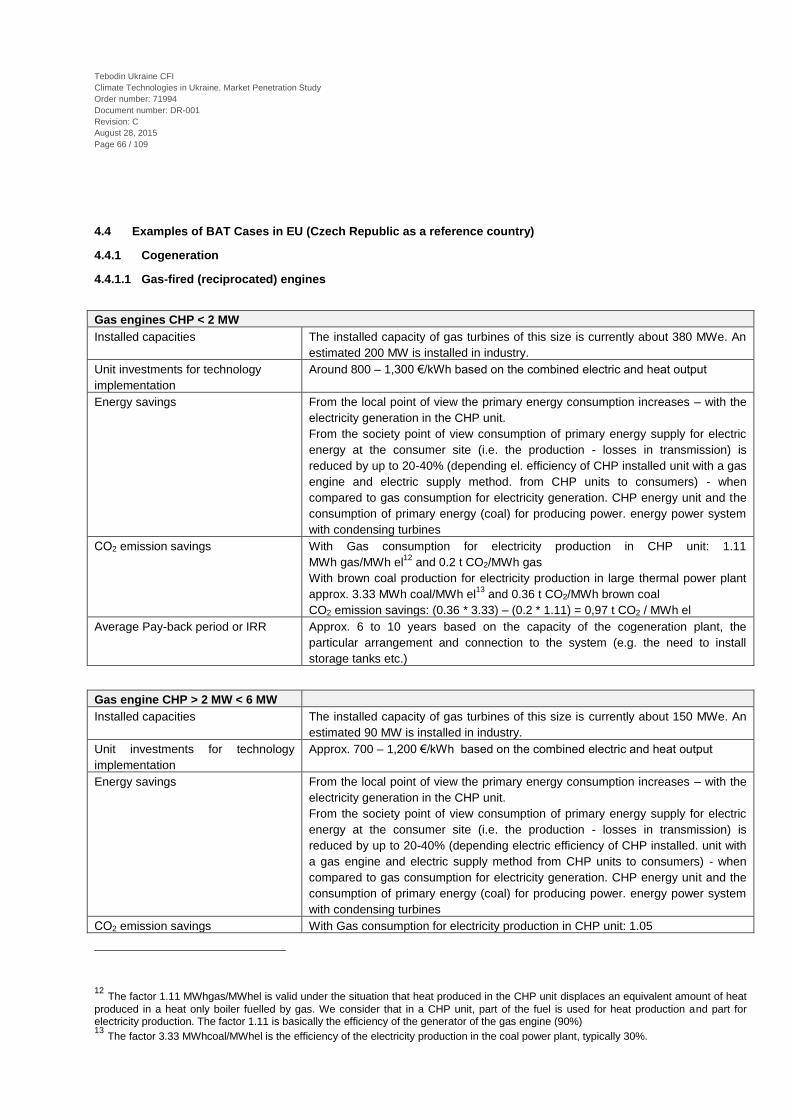
66
Tebodin Ukraine CFI
Climate Technologies in Ukraine. Market Penetration Study
Order number: 71994
Document number: DR-001
Revision: C
August 28, 2015
Page 66 / 109
4.4 Examples of BAT Cases in EU (Czech Republic as a reference country)
4.4.1 Cogeneration
4.4.1.1 Gas-fired (reciprocated) engines
Gas engines CHP < 2 MW
Installed capacities The installed capacity of gas turbines of this size is currently about 380 MWe. An
estimated 200 MW is installed in industry.
Unit investments for technology
implementation
Around 800 – 1,300 €/kWh based on the combined electric and heat output
Energy savings From the local point of view the primary energy consumption increases – with the
electricity generation in the CHP unit.
From the society point of view consumption of primary energy supply for electric
energy at the consumer site (i.e. the production - losses in transmission) is
reduced by up to 20-40% (depending el. efficiency of CHP installed unit with a gas
engine and electric supply method. from CHP units to consumers) - when
compared to gas consumption for electricity generation. CHP energy unit and the
consumption of primary energy (coal) for producing power. energy power system
with condensing turbines
СО2 emission savings With Gas consumption for electricity production in CHP unit: 1.11
MWh gas/MWh el12
and 0.2 t CO2/MWh gas
With brown coal production for electricity production in large thermal power plant
approx. 3.33 MWh coal/MWh el13
and 0.36 t CO2/MWh brown coal
CO2 emission savings: (0.36 * 3.33) – (0.2 * 1.11) = 0,97 t CO2 / MWh el
Average Pay-back period or IRR Approx. 6 to 10 years based on the capacity of the cogeneration plant, the
particular arrangement and connection to the system (e.g. the need to install
storage tanks etc.)
Gas engine CHP > 2 MW < 6 MW
Installed capacities The installed capacity of gas turbines of this size is currently about 150 MWe. An
estimated 90 MW is installed in industry.
Unit investments for technology
implementation
Approx. 700 – 1,200 €/kWh based on the combined electric and heat output
Energy savings From the local point of view the primary energy consumption increases – with the
electricity generation in the CHP unit.
From the society point of view consumption of primary energy supply for electric
energy at the consumer site (i.e. the production - losses in transmission) is
reduced by up to 20-40% (depending electric efficiency of CHP installed. unit with
a gas engine and electric supply method from CHP units to consumers) - when
compared to gas consumption for electricity generation. CHP energy unit and the
consumption of primary energy (coal) for producing power. energy power system
with condensing turbines
СО2 emission savings With Gas consumption for electricity production in CHP unit: 1.05
12
The factor 1.11 MWhgas/MWhel is valid under the situation that heat produced in the CHP unit displaces an equivalent amount of heat
produced in a heat only boiler fuelled by gas. We consider that in a CHP unit, part of the fuel is used for heat production and part for electricity production. The factor 1.11 is basically the efficiency of the generator of the gas engine (90%) 13
The factor 3.33 MWhcoal/MWhel is the efficiency of the electricity production in the coal power plant, typically 30%.
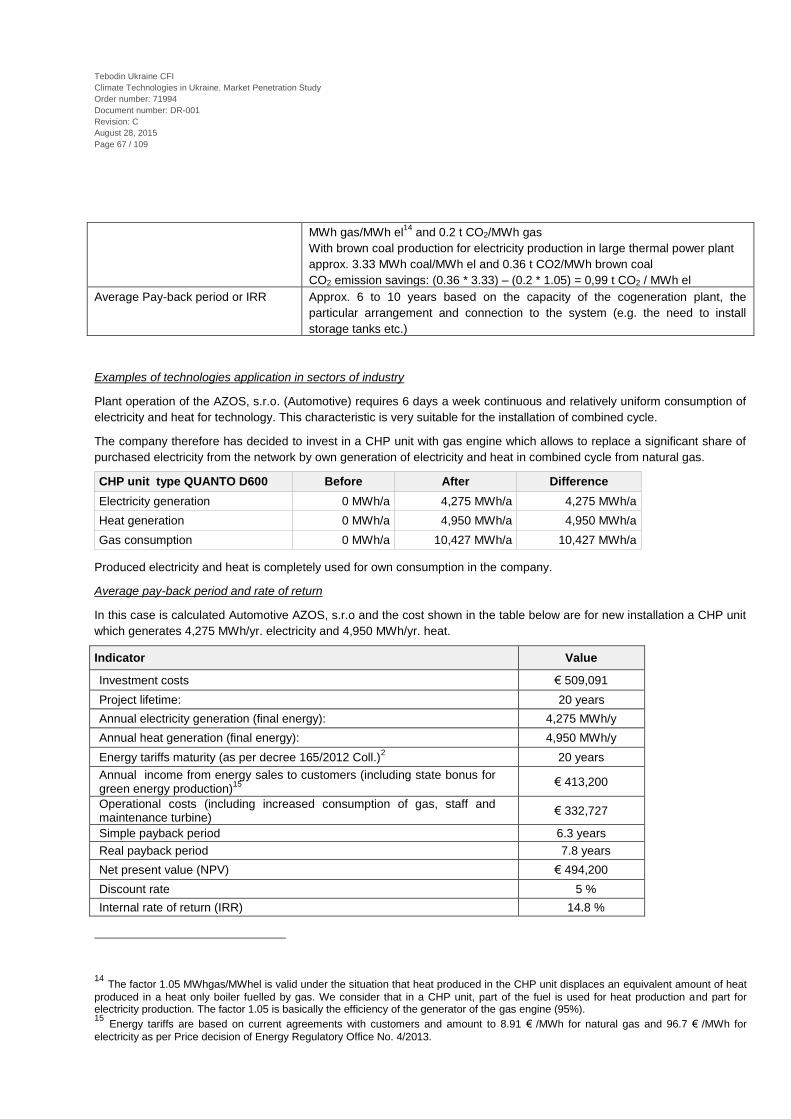
67
Tebodin Ukraine CFI
Climate Technologies in Ukraine. Market Penetration Study
Order number: 71994
Document number: DR-001
Revision: C
August 28, 2015
Page 67 / 109
MWh gas/MWh el14
and 0.2 t CO2/MWh gas
With brown coal production for electricity production in large thermal power plant
approx. 3.33 MWh coal/MWh el and 0.36 t CO2/MWh brown coal
CO2 emission savings: (0.36 * 3.33) – (0.2 * 1.05) = 0,99 t CO2 / MWh el
Average Pay-back period or IRR Approx. 6 to 10 years based on the capacity of the cogeneration plant, the
particular arrangement and connection to the system (e.g. the need to install
storage tanks etc.)
Examples of technologies application in sectors of industry
Plant operation of the AZOS, s.r.o. (Automotive) requires 6 days a week continuous and relatively uniform consumption of
electricity and heat for technology. This characteristic is very suitable for the installation of combined cycle.
The company therefore has decided to invest in a CHP unit with gas engine which allows to replace a significant share of
purchased electricity from the network by own generation of electricity and heat in combined cycle from natural gas.
CHP unit type QUANTO D600 Before After Difference
Electricity generation 0 MWh/a 4,275 MWh/a 4,275 MWh/a
Heat generation 0 MWh/a 4,950 MWh/a 4,950 MWh/a
Gas consumption 0 MWh/a 10,427 MWh/a 10,427 MWh/a
Produced electricity and heat is completely used for own consumption in the company.
Average pay-back period and rate of return
In this case is calculated Automotive AZOS, s.r.o and the cost shown in the table below are for new installation a CHP unit
which generates 4,275 MWh/yr. electricity and 4,950 MWh/yr. heat.
Indicator Value
Investment costs € 509,091
Project lifetime: 20 years
Annual electricity generation (final energy): 4,275 MWh/y
Annual heat generation (final energy): 4,950 MWh/y
Energy tariffs maturity (as per decree 165/2012 Coll.)2
20 years
Annual income from energy sales to customers (including state bonus for green energy production)
15
€ 413,200
Operational costs (including increased consumption of gas, staff and maintenance turbine)
€ 332,727
Simple payback period 6.3 years
Real payback period 7.8 years
Net present value (NPV) € 494,200
Discount rate 5 %
Internal rate of return (IRR) 14.8 %
14
The factor 1.05 MWhgas/MWhel is valid under the situation that heat produced in the CHP unit displaces an equivalent amount of heat
produced in a heat only boiler fuelled by gas. We consider that in a CHP unit, part of the fuel is used for heat production and part for electricity production. The factor 1.05 is basically the efficiency of the generator of the gas engine (95%). 15
Energy tariffs are based on current agreements with customers and amount to 8.91 € /MWh for natural gas and 96.7 € /MWh for
electricity as per Price decision of Energy Regulatory Office No. 4/2013.
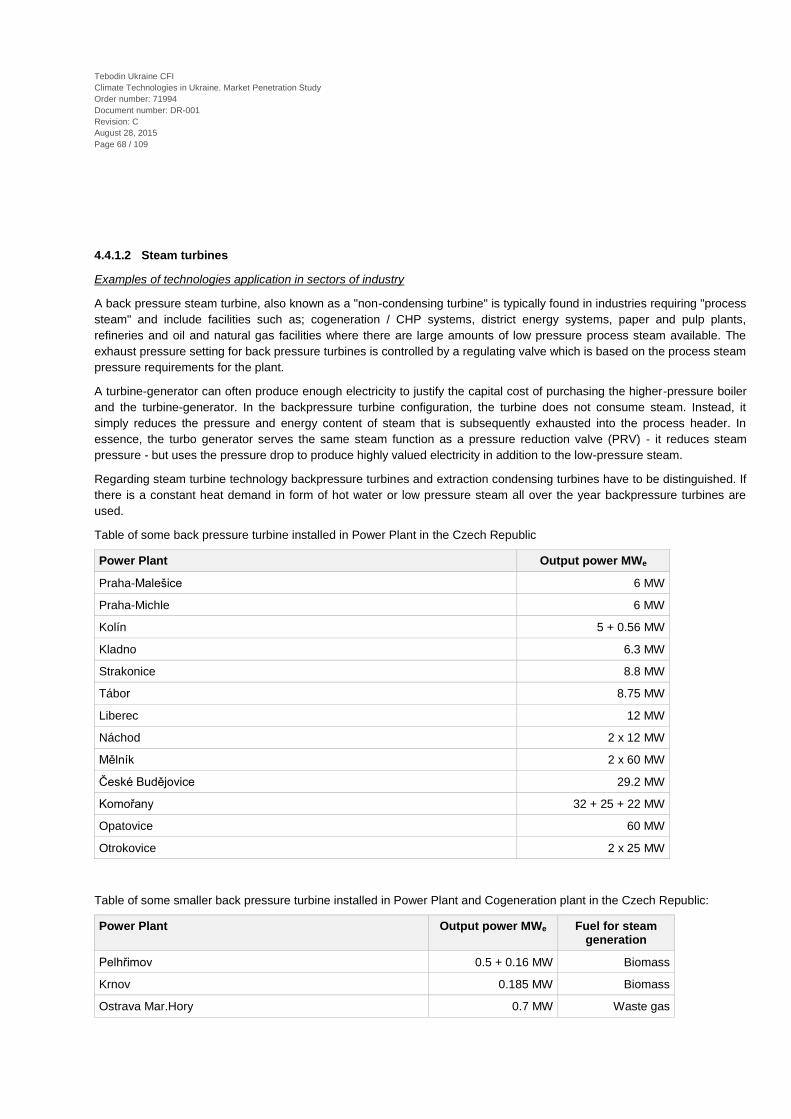
68
Tebodin Ukraine CFI
Climate Technologies in Ukraine. Market Penetration Study
Order number: 71994
Document number: DR-001
Revision: C
August 28, 2015
Page 68 / 109
4.4.1.2 Steam turbines
Examples of technologies application in sectors of industry
A back pressure steam turbine, also known as a "non-condensing turbine" is typically found in industries requiring "process
steam" and include facilities such as; cogeneration / CHP systems, district energy systems, paper and pulp plants,
refineries and oil and natural gas facilities where there are large amounts of low pressure process steam available. The
exhaust pressure setting for back pressure turbines is controlled by a regulating valve which is based on the process steam
pressure requirements for the plant.
A turbine-generator can often produce enough electricity to justify the capital cost of purchasing the higher-pressure boiler
and the turbine-generator. In the backpressure turbine configuration, the turbine does not consume steam. Instead, it
simply reduces the pressure and energy content of steam that is subsequently exhausted into the process header. In
essence, the turbo generator serves the same steam function as a pressure reduction valve (PRV) - it reduces steam
pressure - but uses the pressure drop to produce highly valued electricity in addition to the low-pressure steam.
Regarding steam turbine technology backpressure turbines and extraction condensing turbines have to be distinguished. If
there is a constant heat demand in form of hot water or low pressure steam all over the year backpressure turbines are
used.
Table of some back pressure turbine installed in Power Plant in the Czech Republic
Power Plant Output power MWe
Praha-Malešice 6 MW
Praha-Michle 6 MW
Kolín 5 + 0.56 MW
Kladno 6.3 MW
Strakonice 8.8 MW
Tábor 8.75 MW
Liberec 12 MW
Náchod 2 x 12 MW
Mělník 2 x 60 MW
České Budějovice 29.2 MW
Komořany 32 + 25 + 22 MW
Opatovice 60 MW
Otrokovice 2 x 25 MW
Table of some smaller back pressure turbine installed in Power Plant and Cogeneration plant in the Czech Republic:
Power Plant Output power MWe Fuel for steam generation
Pelhřimov 0.5 + 0.16 MW Biomass
Krnov 0.185 MW Biomass
Ostrava Mar.Hory 0.7 MW Waste gas

69
Tebodin Ukraine CFI
Climate Technologies in Ukraine. Market Penetration Study
Order number: 71994
Document number: DR-001
Revision: C
August 28, 2015
Page 69 / 109
Table of some Turning Reduction installed in Industry:
Industry Output power kWe
Brewery Černá hora 35 kW
Incinerator factory Ekotermex 80 kW
Sugar factory Vrbátky 700 kW
Reducing station Gascontrol 50 kW
Packaging engineering DEVRO 412 kW
Sugar factory Dobrovice 1,480 kW
Sugar factory Litovel 2,500 kW
Unit investments for technology implementation
Output power Unit costs
Back pressure turbine 100 kWe 900 €/kWe
Back pressure turbine 1 MWe – 2 MWe 300 - 400 €/kWe
Back pressure turbine 2 MWe – 6.5 MWe 250 €/kWe
Unit costs are standard prices for the Czech Republic and year 2015.
Energy savings
In order to reduce electricity purchases the company DEVRO, s.r.o. (Packaging) decided to invest in an integrated overall
energy concept which allows to replace a significant share of purchased electricity from fossil fuels by own generation
electricity instead of wasting steam to reduction in reduction valve.
Turning reduction equipment is installed in steam piping with the aim to gain electrical energy within the process of steam
pressure reduction. Pressure reduction is determined by operational needs of the following steam distribution system.
Steam for unit consumption itself is usually reduced from HP part outlet from the parameters of at least 1 MPa, 200oC to
0.25 MPa. This provides a usable isoentropic gradient which can additionally be used in electrical energy production. It is
possible to generate more than 400 kW of power output. Turning reduction generates 1,400 MWh in the period of 3,400
operating hours.

70
Tebodin Ukraine CFI
Climate Technologies in Ukraine. Market Penetration Study
Order number: 71994
Document number: DR-001
Revision: C
August 28, 2015
Page 70 / 109
Turbine type TR 320 Before After Difference
Electricity generation 0 MWh/a 1,400 MWh/a 1,400 MWh/y
Electricity generation of the turning reduction achieves 1,400 MWh/a and is used for own consumption in the company.
CO2 emission savings
CO2 emission savings are calculated using factor 1.17 tCO2/MWh for electricity as per Annex 6 of Decree Nr. 480/2012.
Packaging engineering DEVRO, s.r.o.
Electric energy generation 1,400 MWh/y
CO2 emissions reduction16
1,638 t CO2/y
Reduction of CO2 100 %
Average Pay-back period, Internal Rate of Return
In this case is calculated Packaging engineering DEVRO, s.r.o and the cost shown in the table below are for new
installation a back pressure turbine (turning reduction) which generates 1,400 MWh/a instead of wasting steam to reduction
in reduction valve.
Indicator Value
Investment costs (only boiler and turbine) € 361,786
Project lifetime: 20 years
Annual electricity generation (final energy): 1,400 MWh/y
Energy tariffs maturity (as per decree 165/2012 Coll.)17
20 years
Annual income from energy sales to customers (including state bonus for green energy production)
18
€ 99,561
Operational costs (including increased consumption of gas, staff and maintenance turbine)
€ 50,658
Simple payback period 7.4 years
Real payback period 9.5 years
Net present value (NPV) € 247,653
Discount rate 5 %
16
100% CO2 emission reduction as project generating 920 MWh/y of renewable electric energy 17
The tariffs are determined by the Energy Regulatory Office annually as per decree 165/2012 Coll. There is no regular indexation. 18
Energy tariffs are based on current agreements with customers and amount to 6.67 € /MWh for heat and 58.15 € /MWh for electricity
as per Price decision of Energy Regulatory Office No. 4/2013.
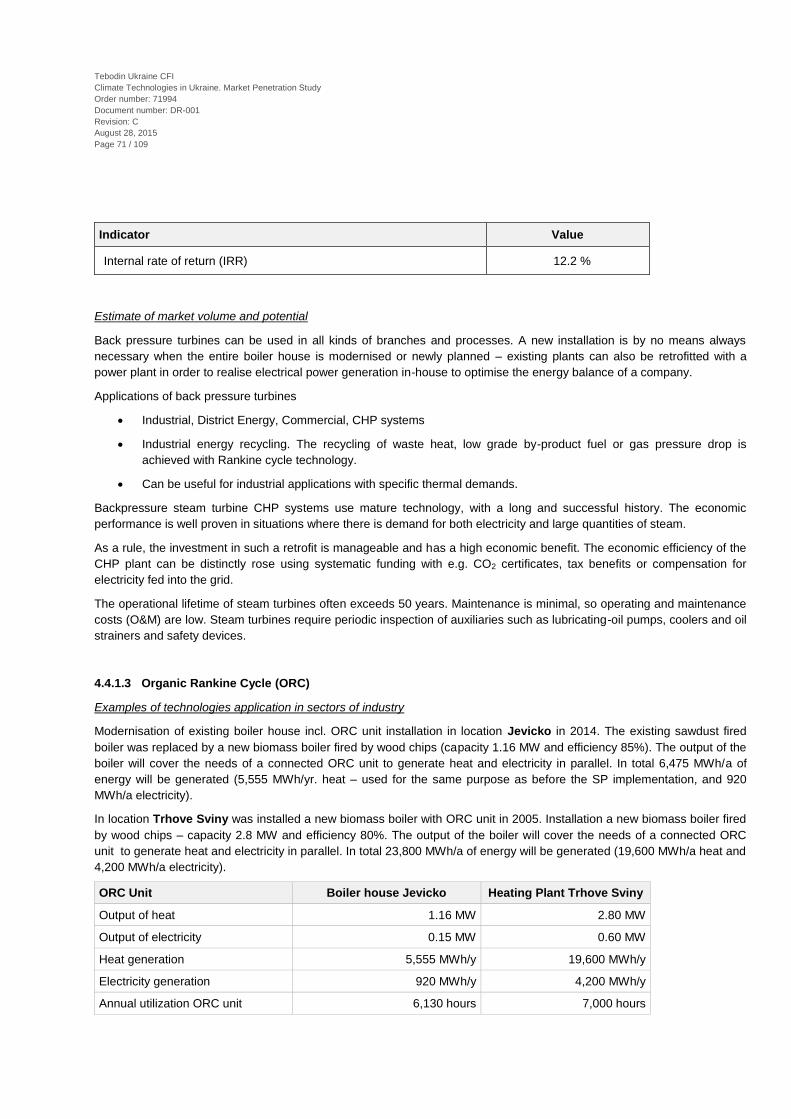
71
Tebodin Ukraine CFI
Climate Technologies in Ukraine. Market Penetration Study
Order number: 71994
Document number: DR-001
Revision: C
August 28, 2015
Page 71 / 109
Indicator Value
Internal rate of return (IRR) 12.2 %
Estimate of market volume and potential
Back pressure turbines can be used in all kinds of branches and processes. A new installation is by no means always
necessary when the entire boiler house is modernised or newly planned – existing plants can also be retrofitted with a
power plant in order to realise electrical power generation in-house to optimise the energy balance of a company.
Applications of back pressure turbines
Industrial, District Energy, Commercial, CHP systems
Industrial energy recycling. The recycling of waste heat, low grade by-product fuel or gas pressure drop is
achieved with Rankine cycle technology.
Can be useful for industrial applications with specific thermal demands.
Backpressure steam turbine CHP systems use mature technology, with a long and successful history. The economic
performance is well proven in situations where there is demand for both electricity and large quantities of steam.
As a rule, the investment in such a retrofit is manageable and has a high economic benefit. The economic efficiency of the
CHP plant can be distinctly rose using systematic funding with e.g. CO2 certificates, tax benefits or compensation for
electricity fed into the grid.
The operational lifetime of steam turbines often exceeds 50 years. Maintenance is minimal, so operating and maintenance
costs (O&M) are low. Steam turbines require periodic inspection of auxiliaries such as lubricating-oil pumps, coolers and oil
strainers and safety devices.
4.4.1.3 Organic Rankine Cycle (ORC)
Examples of technologies application in sectors of industry
Modernisation of existing boiler house incl. ORC unit installation in location Jevicko in 2014. The existing sawdust fired
boiler was replaced by a new biomass boiler fired by wood chips (capacity 1.16 MW and efficiency 85%). The output of the
boiler will cover the needs of a connected ORC unit to generate heat and electricity in parallel. In total 6,475 MWh/a of
energy will be generated (5,555 MWh/yr. heat – used for the same purpose as before the SP implementation, and 920
MWh/a electricity).
In location Trhove Sviny was installed a new biomass boiler with ORC unit in 2005. Installation a new biomass boiler fired
by wood chips – capacity 2.8 MW and efficiency 80%. The output of the boiler will cover the needs of a connected ORC
unit to generate heat and electricity in parallel. In total 23,800 MWh/a of energy will be generated (19,600 MWh/a heat and
4,200 MWh/a electricity).
ORC Unit Boiler house Jevicko Heating Plant Trhove Sviny
Output of heat 1.16 MW 2.80 MW
Output of electricity 0.15 MW 0.60 MW
Heat generation 5,555 MWh/y 19,600 MWh/y
Electricity generation 920 MWh/y 4,200 MWh/y
Annual utilization ORC unit 6,130 hours 7,000 hours

72
Tebodin Ukraine CFI
Climate Technologies in Ukraine. Market Penetration Study
Order number: 71994
Document number: DR-001
Revision: C
August 28, 2015
Page 72 / 109
Unit investments for technology implementation
Cost item Amount* Unit costs
ORC system 150 kWe € 801,481 5,343 € / kWe
ORC system 600 kWe € 2,885,714 4,809 € / kWe
*excluding 21% VAT
Based on the Consultant’s experience with similar projects, the costs shown in the table above are reasonable as a
renewable energy investment. Unit costs are standard prices for the Czech Republic and year 2014.
Energy savings
In order to reduce electricity purchases the company in Jevicko decided to invest in an integrated overall energy concept
which allows to replace a significant share of purchased electricity from fossil fuels by own generation from renewable
sources.
Energy type Before After Difference
Heat generation 5,555 MWh/y 5,555 MWh/y 0 MWh/y
Electricity generation 0 MWh/y 920 MWh/y 920 MWh/y
Heat generation will remain equal to present because heat consumption will not change. Electricity generation by ORC
system will reach 920 MWh/yr. which will allow replacing the 72% of electricity generation by fossil fuels.
Replaced electricity generation from fossil fuels by RE sources shown final energy
Electricity MWh/a Grid purchase Generation by RE Replaced
final energy - electricity 1,275 920 72%
CO2 emission savings
Calculated using factor 1.17 t CO2/MWh for electricity as per Annex 6 of Decree Nr. 480/2012 of Coll.
CO2 emissions
Boiler house Jevicko Heating Plant Trhove Sviny
Electric energy generation 920 MWh/y 4,200 MWh/y
CO2 emissions reduction19
1,076 t CO2/y 4,914 t CO2/y
Reduction of CO2 100 % 100 %
19
100% CO2 emission reduction as projects are generating 920 MWh and 4200 MWh renewable electricity respectively.

73
Tebodin Ukraine CFI
Climate Technologies in Ukraine. Market Penetration Study
Order number: 71994
Document number: DR-001
Revision: C
August 28, 2015
Page 73 / 109
Average Pay-back period, Internal Rate of Return
In this case is calculated only Boiler house Jevicko and the cost shown in the table below are for new biomass boiler
(capacity 1.16 MW) with connected ORC unit (capacity 150 kWe) due to impossibility to separate operational costs.
Indicator Value
Investment costs (boiler and ORC only) € 1,044,074
Project lifetime: 20 years
Annual electricity generation (final energy): 920 MWh/y
Annual heat generation (final energy) 5,555 MWh/y
Selling price of heat in SP area 39 € /MWh
Selling price of electricity to the public grid (30%) 37 € /MWh
Selling price of electricity to the SP area (70%) 89 € /MWh
State bonus (tariff) for green heat production 6.67 € /MWh
State bonus (tariff) for green electric energy production 58.15 € /MWh
Energy tariffs maturity (as per decree 165/2012 Coll.)20
20 years
Annual income from energy sales to customers (including state bonus for green energy production)
21
€ 369,966
Operational costs (including wood chips, staff and maintenance) € 230,907
Simple payback period 7.5 years
Real payback period 9.7 years
Net present value (NPV) € 688,902
Discount rate 5 %
Internal rate of return (IRR) 11.9 %
Estimate of market volume and potential
The ORC is a mature technology for waste heat recovery, biomass and geothermal power, but is still very uncommon for
solar applications. The ORC market is growing rapidly. Since the first installed commercial ORC plants in Trhove Sviny in
20
The tariffs are determined by the Energy Regulatory Office annually as per decree 165/2012 Coll. There is no regular indexation. 21
Energy tariffs are based on current agreements with customers and amount to 6.67 € /MWh for heat and 58.15 € /MWh for electricity as
per Price decision of Energy Regulatory Office No. 4/2013.

74
Tebodin Ukraine CFI
Climate Technologies in Ukraine. Market Penetration Study
Order number: 71994
Document number: DR-001
Revision: C
August 28, 2015
Page 74 / 109
the 2005, an almost-exponential growth has been started. Moreover, systems are mainly installed in the MW heat power
range and very few ORC plants exist in the kW heat power range.
ORC applications in the Czech Republic
Figure 4.1. ORC applications in the Czech Republic
1 Trhové Sviny 7 Moravská Třebová 13 Šlapanov
2 Žatec 8 Strážnice 14 Rybníček
3 Třebíč 9 Břeclav 15 Bečvary
4 Jetřichovec 10 Sedlec 16 Jihlava
5 Horní Suchá 11 Bratčice 17 Žerotín
6 Smolotely 12 Kyselov
The variety of ORC modules is large and can be categorized according to unit size, type of technology, and target
application.
The new ORC unit in Jevíčko that is located in a wood processing plant is the only application in industry.
Other ORC units are realised in (district) heating plants for heating purposes in the residential sector, examples are:
No.1 – district heating plant Trhove Sviny
No.2 – district heating plant Žatec
No.3 – district heating plant Třebíč
Other ORC units are often connected to biogas plants on farms.
Providers of ORC technology
Turboden (Italian manufacturer), supplied in the Czech Republic by Schiestl spol. s r.o., - www.turboden.eu,
http://www.schiestl.cz/
Kohlbach (Austrian manufacturer) – www.kohlbach.at
GE Jenbacher (Austrian manufacturer) – www.jenbacher.com
Triogen (Dutch manufacturer) - http://www.triogen.nl/,
o References: http://www.triogen.nl/references/reference-overview

75
Tebodin Ukraine CFI
Climate Technologies in Ukraine. Market Penetration Study
Order number: 71994
Document number: DR-001
Revision: C
August 28, 2015
Page 75 / 109
Ormat (US manufacturer) - http://www.ormat.com/
4.4.2 Heat recovery systems
Examples of technologies application in sectors of industry
Waste heat can be used on all devices that generate a waste heat transfer medium at a higher temperature, while the
waste heat can be used not only in the device itself, but also for other equipment or purposes (heating, domestic hot water,
etc.). This measure can thus reduce the consumption of any fuel or electricity.
Theoretically waste heat from the appropriate technological equipment in any kind of industrial operation or ventilation of
larger halls can be used. Waste heat can be supplied not only to a lower temperature (by heat exchanger) but also at a
higher temperature (heat pumps, thermal transformers). At temperatures of waste heat higher than about 150°C it is
possible to re-supply not only heat but also electricity (e.g. through ORC).
Use of waste heat must allow specific design of the facility, which produces waste heat - e.g. clear drying air inlet and clear
exhaust air outlet. The problem with some machines is that they do not have a clear inlet for drying air (because many
openings suck air into the machine) and exhaust air is not extracted from one specific point.
In general, it cannot be said that the individual projects on waste heat recovery are always comparable. The differences are
mainly in the layout configuration of source, consumption and method of implementation.
It remains difficult to compare a simple heat recovery from the exhaust of ventilation air into the intake air in one single heat
exchanger with the production of electricity from waste combustion.
The following table shows some typical projects of heat recovery with specific parameters:
Project description
Investment costs
Savings
Specific investment costs per savings
Reducing of consumption
Saved fuel /
energy
CO2 savings
Simple time of return. without
subsidies
1,000 CZK GJ CZK/GJ % t years
Heating of air for a production hall by waste heat
500 423 1,182 0 Natural
gas 23.5 5.8
Installation of a combustion heat exchanger - use of waste heat for heating production halls
2,000 4,730 423 0 Natural
gas 262.8 2.1
Using heat combustion products to preheat the material entering the furnace
2,000 1,785 1,120 0 Natural
gas 99.2 5.5
Heat utilization of degas the unit RTO (regenerative thermal oxidizer) combustion of organic substances with the use of heat
8,800 26,078 337 0 Natural
gas 1,448.8 1.2
Additional cooling of combustion products behind incinerator
500 7,171 70 0 Natural
gas 398.4 0.3
Installing two heat exchangers combustion products / air and air / water
29,000 19,492 1,488 52 Natural
gas 1,082.9 8.1

76
Tebodin Ukraine CFI
Climate Technologies in Ukraine. Market Penetration Study
Order number: 71994
Document number: DR-001
Revision: C
August 28, 2015
Page 76 / 109
Project description
Investment costs
Savings
Specific investment costs per savings
Reducing of consumption
Saved fuel /
energy
CO2 savings
Simple time of return. without
subsidies
1,000 CZK GJ CZK/GJ % t years
Installing three heat exchangers combustion products / air. Use of heat from combustion products from heating furnaces
1,700 6,044 281 21 Natural
gas 335.8 1.8
Installing heat exchanger air / water, using heat from printing machines for hot water
350 3,243 108 37 Natural
gas 180.2 0.3
Installing heat exchangers 12,500 16,767 746 25 Natural
gas 931.5 3.4
Use of energy for hot water radiant heating system in a foundry
2,600 2,800 929 8 Natural
gas 155.6 4.8
Installation of the heat exchanger behind a tunnel furnace
6,750 213 31,690 17 Natural
gas 11.8 3.2
Using heat from the preheating and cooling of clinker
242,112 66,193 3,658 19 Electricity 21,512 4.8
Source: expert estimates from the Czech Republic, 2015
Unit investments for technology implementation
The above table shows that it is very difficult to determine the general framework of investment costs.
The adverse effect of the investment could be any aggressive substances in the waste medium or below the dew point
condensation that requires more expensive, corrosion-resistant material heat transfer surfaces of the heat exchanger. This
would mean an additional increase of investment costs.
Energy savings (compared to the baseline situation – without the technology installed)
According to the table above the typical energy savings of heat recovery systems are about 25%.
СО2 emission savings
An amount of 823,444 t CO2 (64,167 t CO2 coal, 102,778 CO2 natural gas, 656,500 CO2 electricity) could be saved
provided that all total energy savings potential quantified in 6) will be carried out. This number, 4.57 PJ, is the total energy
saving potential for heat recovery.
Average Pay-back period or IRR
Generally, the use of waste heat is technically simple and economically in most cases very favourable. The economic
evaluation of waste heat utilization is influenced mainly by the price of fuel which is being replaced or price of electricity.
The extent of payback period is very significant from 0.5 years (e.g. simple water registers installed in the air duct when
recovering heat from natural gas) to more than 10 years (e.g. production electricity from the hot air or combustion products
using ORC).

77
Tebodin Ukraine CFI
Climate Technologies in Ukraine. Market Penetration Study
Order number: 71994
Document number: DR-001
Revision: C
August 28, 2015
Page 77 / 109
The typical projects shown in the table that have a pay-back of 0.3; 1.2; 1.8 years are basically unique and have been
mostly realized already (i.e. there is no potential for such projects anymore). In discussion with experts from the field we
came to a simple payback of new projects in industry of 5 to 7 years.
Estimate of market volume and potential
Based on projects described in 1) and projects, which were carried out in Operational programmes we estimated energy
savings potential for heat recovery systems as follows:
Total energy savings 4.57 PJ, from which is:
0,70 PJ - coke, hard coal and brown coal
1,85 PJ - natural gas
2,02 PJ – electricity
Competitive analysis
The Czech Republic has a wide range of producers of various types of heat exchangers, most producers do not specialize
only in the heat exchanges but generally in thermal technology. Furthermore, there are represented many foreign
producers of heat exchangers.
Several examples of heat exchange producers on the Czech market are:
HENNLICH s.r.o. - https://www.hennlich.cz/
Ventos, s.r.o. - http://www.ventos.cz/
TEDOM a.s. - http://kogenerace.tedom.com/
PBS ENERGO, a.s. - http://www.pbsenergo.cz/
Barriers for technologies introduction
One of the main barriers is often technically difficult installation of waste energy utilization. Companies have concerns
about compliance with the exact process technology of products and maintaining the quality, therefore they do not decide
to install equipment for the use of waste energy so often, even if large amount of waste heat is produced and installation
would be economically very favourable (payback period 3-4 years).
Another barrier is the concern about irreversible contaminating of heat exchangers with dirt from combustion products,
which is in some production technology as yet unproven.
4.4.3 Energy Management Systems, automation and practices
Implementation of energy management using M&T/ESCO method
This section presents a short overview of implementation of energy management and identification of other energy
efficiency measures in five industrial companies in the Czech Republic.
One of the most difficult and also most important stages of the energy management system introduction is setting of
anticipated/targeted consumptions and dependences of energy consumption on monitored variables. Reporting about
energy consumption and costs of main production processes is crucial for energy management.
The close cooperation between staff and provider of technical assistance is needed. This cooperation is supporting the
successful and effective path for development and implementation of energy saving measures based on extensive
experience of the enterprise members and their knowledge of the relevant technology.
Investment costs
78
Tebodin Ukraine CFI
Climate Technologies in Ukraine. Market Penetration Study
Order number: 71994
Document number: DR-001
Revision: C
August 28, 2015
Page 78 / 109
Investment costs of energy management system implementation are affected by many factors. Size and variety of the
company energy management have the most decisive influence. Energy management system implementation costs are
mostly ranging from 10,000 CZK to 1 mil. CZK22
, except in cases of very small or extremely large energy management
systems.
Pay-back period
The annual operating costs usually vary between 10% - 20% of energy management system implementation costs. The
average pay-back period is ranging from 1 to 4 years. It depends on initial state of energy management and also
ability/motivation of energy management operator.
Some examples of implemented energy management systems by European producers are given below.
Aluminium production
An example manufacturer is a major European and the largest domestic manufacturer of aluminium packaging materials
and rolled semi-products, employing over 800 people from the Bruntál region (east of the Czech Republic). Company’s
main products are aluminium-based rolled products and packaging materials. Technology process is quite energy
demanding and has significant impact on quality of final product.
Identified energy efficient measures:
Melting process reconstruction and control;
Accurate material flow planning for pre-heat;
Building dislocation;
Outside lighting control.
Unit investments for technology implementation
The overall investment costs of the example installation amounted to 1,415,000 USD (with exchange rate at time of
investment - 19.3 CZK / 1 USD, December 2008).
Energy savings
Savings in electrical energy were 4,241 MWh/y and in natural gas 7,744 MWh/y. The total savings from the implemented
measures were 673,700 $ /y.
CO2 emission savings
Calculated greenhouse gas emission savings achieved were 9,684 tons/y.
Average Pay-back period
The average Pay-back period of the investment was 25 months.
Brick manufacturing
The assortment of the example manufacturer includes fireclay bricks, high-alumina bricks, and silica bricks, insulating
bricks, refractory clays and grog, magnetite bricks for night-storage heaters, ceramic chimney pipes, refractory mortars,
mastics and castables.
22
Current exchange rate 26 CZK/1 USD, 27 CZK / 1 EUR
79
Tebodin Ukraine CFI
Climate Technologies in Ukraine. Market Penetration Study
Order number: 71994
Document number: DR-001
Revision: C
August 28, 2015
Page 79 / 109
Company is one of the biggest producers and suppliers of refractory products and raw materials. Manufacture is
located in Velké Opatovice (centre of the country). Company produces and supplies complete or partial linings of the
thermal aggregates, especially for coke ovens, blast furnaces (including hot blast stoves), glass furnaces, electrolysers for
the primary production of alumina and others. The nowadays annual production capacity is 100,000 tons.
Identified energy efficient measures:
Fitting the flap valve to the original location of tunnel oven 3, control (reduction) of draught flue, reduction of
natural gas pressure;
Blocking of individual branches of dust separator when mixer is not running;
Replacing of pressure regulators at compressors, reducing the pressure in the reservoir from 8.5 to 7 bar,
replacement of defective safety valves, reduction of the use of compressed air for clothing or trolley cleaning,
repair of detected leaks.
Unit investments for technology implementation
The total budget for the energy management system implementation, including specialized software and the subsequent
technical assistance at the client’s site was 153,170 USD (with exchange rate at time of investment - 19.34 CZK / 1 USD,
December 2008).
Energy savings
There were more than 25 energy savings measures which were documented in the database of energy saving measures.
Many of the measures were no-less or low-cost organizational and small technical measures. Some investment measures
were also identified and will be implemented. Measures identified within the first months of monitoring and targeting full
operation accounted for over 9% reduction of total energy costs.
Savings in electrical energy were 1,930 MWh/year and in natural gas 3,817 MWh/year. The total savings from the
implemented measures were 260,000 $ /y.
CO2 emission savings
Calculated greenhouse gas emission savings achieved were 1,851 tons/y.
Average payback period
The average payback period of the investment was 7 months.
Kaolin production
The company is the prominent Czech supplier of washed kaolin and kaolin-based products designed primarily for ceramics,
paper and chemical industry.
Nowadays the company includes following activities such as ceramic kaolin, filler kaolin for paper industry, calcined kaolin
and mixtures, plasters, mortars and wall paints, stoneware articles, sanitary and garden ceramics, mining of clays,
processing of bentonite clays, production of cat litters and mining and processing of natural sandstone. The principal base
of raw materials is in the region of Karlovy Vary (West of Czech Republic).
Identified energy efficient measures:
Only monitoring system of energy consumption of demand side.
Unit investments for technology implementation
The overall investment costs of the example installation amounted to 129,700 USD (with exchange rate at time of
investment - 22.20 CZK /1 USD, July 2006).

80
Tebodin Ukraine CFI
Climate Technologies in Ukraine. Market Penetration Study
Order number: 71994
Document number: DR-001
Revision: C
August 28, 2015
Page 80 / 109
Energy savings
Potential for savings guaranteed in electrical energy were 230 MWh and in natural gas 1,020 MWh. The total savings from
the implemented measures were 44,200 USD.
CO2 emission savings
Total sum of guaranteed greenhouse gas emission savings was 303 tons CO2.
Average Pay-back period
The average Pay-back period of the investment was 2.9 years.
Steel production
The Company’s main product range includes carbon, carbon manganese and high-grade alloy structural steels, and, to a
lesser extent, stainless and tool steel. Micro-alloyed structural steel also accounts for a significant part of production. The
Company currently produces round bars with a diameter of 70 to 300 millimetres, square billets of 70 to 165 millimetres
and blooms of 170 to 300 millimetres. The entire production assortment is created using the SBQ bar steel. Before the
Project only monitoring system of energy consumption of demand side were implemented.
Technology process in the company is very energy demanding and has significant impact on quality of final product.
Energy savings and cost reduction was main target of the company top management.
Manufacture is located near Kladno town. The nowadays annual production capacity is 300 000 tons.
Identified energy efficient measures:
Sub-metering system were extended, old meters were replaced;
There was a regular energy management system implemented including setting up of working groups, using of
analysing software tool, and rising of management support.
Unit investments for technology implementation
The overall investment costs of the example installation amounted to 174,500 USD (with exchange rate at time of
investment - 23.8 CZK / 1 USD, December 2005).
Energy savings
Savings in electrical energy were 300 MWh, in fuel 18,800 MWh. The total savings from the implemented measures were
529,100 USD.
CO2 emission savings
Global environmental benefits in total (sum of fuel combustion, electricity, heat and others) were 4,100 tons CO2.
Average Pay-back period
The average Pay-back period of the investment was 3 years for the energy management system with extended sub-
metering installation. New walking beam furnace was going to be installed in 2008.
Brewery
This project was realised in one of the biggest small breweries in Czech Republic. It brews more than 150 000 hl of beer
annually. The original metering system did not allow monitoring of energy with efficient and strategic approach to manage
energy costs and its carriers.
The sub-metering system was slightly extended; new meters were placed to the condensate conduits. Structure of Energy
Cost Centres (ECCs) was proposed based on energy flows mapped already within the energy audit before the project start

81
Tebodin Ukraine CFI
Climate Technologies in Ukraine. Market Penetration Study
Order number: 71994
Document number: DR-001
Revision: C
August 28, 2015
Page 81 / 109
up. New system gathering data about secondary energy consumption was commissioned in spring 2007. Targets for
individual ECCs were agreed with the company in December 2007.
Identified energy efficient measures:
New and modern chillers + heat pump for space heating;
Biogas generation from water treatment plant sewage;
Installation of cogeneration units for biogas firing + electricity generation.
Unit investments for technology implementation
The overall investment costs of the example installation amounted to 1,578,000 USD with exchange rate at time of
investment – 19.34 CZK / 1 USD, December 2008).
Energy savings
The total sum of guaranteed savings, except for the process-related savings was 300MWh. The total savings from the
implemented measures were 11,230 USD.
Electric energy savings were 150 MWh/year, water savings 1200 m3/year and natural gas savings 180 MWh/year. Energy
costs savings were 240,000 USD/year
CO2 emission savings
Global environmental benefits in total (sum of fuel combustion, electricity, heat and others) were 211 tons/ CO2.
Average Pay-back period
The simple Pay-back period of the investment was 6.5 years (78 months).
4.4.4 Water Management Systems
Water management systems in the Czech Republic and EU
One of the widely used methodology for optimising the consumption of water in processes on sites is by introducing
process integration techniques e.g. Pinch Technology. The application of Pinch Technology in chemical industry has
succeeded in waste water savings of up to 60 %. Performance examples for waste water flow reduction:
• Chemicals and fibres 25 %
• Chemicals 40 %
• Oil Refining 20–30 %
• Coal Chemicals 50 %
• Polymers 60 %.
Another example of process water optimisation is from ceramic industry, where the repeated re-use of process waste water
(cleaning water after suitable treatment) in the same process step bring significant water savings. Process waste water
recycling ratios in different ceramic industry sectors:
Wall and floor tiles up to 80 %;
Sanitary ware and household ceramics up to 50 %
The following table shows samples of water management technologies in sectors, which have high water consumption
and/or generate a lot of waste waters:

82
Tebodin Ukraine CFI
Climate Technologies in Ukraine. Market Penetration Study
Order number: 71994
Document number: DR-001
Revision: C
August 28, 2015
Page 82 / 109
Industry sector
Technology name
Project/technology description Investment costs
23 in EUR
Reducing of consumption
PBP in years
Iron and steel
Frequency-controlled pumps and fans
Better and faster adjustment of water flow rates and off-gas flow rates according to the demands of different process conditions
€ 1,241 – 8,000 per frequency control with capacity 11 - 150 kW
Energy savings in electromotive system min. 30%; water savings min. 15 %
2.3
Organic fine chemicals
Water-free vacuum generation
Water-free vacuum generation - by mechanical pumping systems in a closed circuit procedure or by means of dry running pumps
89,500 Water savings over 10 %
1
Chlorine-alkali
Recycling of waste water from other production processes
Recycling salt-containing effluents from other production processes to the brine system of the chloric-alkali plant.
11,000,000 Reduced consumption of salt and water.
2.5 - 3
Dairy (cheese production)
Ultrafiltration for protein standardisation of cheese milk
Production capacity: 25000 t/yr. yellow cheese production; filtration capacity is 65000 l/h.
430,000
Electrical energy 19 kWh/t cheese, thermal energy 49 kWh/t cheese, water 300 l/t cheese
5.9
Sugar Re-use of process water
Reuse of sugar beet water/waste water (flume water, condensate from the evaporation and crystallisation stages)
Site specific Water consumption reduction up to 60 %
3
Sugar Dry transport of sugar beets
Replacement of wet transport by dry transport of sugar beet for pre-treatment
Site specific Water consumption reduction up to 50 %
3
Beer Re-use of bottle pasteurising water
Overflows from the pasteurisers are collected, sent to a cooling tower and returned to the pasteurizer.
162,000
Reduced water consumption by 15 %, chemical consumption by 23 %, and waste water volume by 50 %.
1.25
Pulp Dry debarking with debarking drum
Capacity of about 1300 per 90 % air dry pulp (ADt)/d
15,000,000 for new system; 4 – 6,000,000 for conversion of existing system.
Waste water load decreases by 5 – 10 m
3/
ADt NA
Pulp and paper
Vacuum systems Energy efficient vacuum systems for dewatering
Site specific
Water savings of up to 95% (1,000,000 m
3/
year); electricity savings of 20 – 45%
4
23
Source: EU BREFs and expert estimation in CR

83
Tebodin Ukraine CFI
Climate Technologies in Ukraine. Market Penetration Study
Order number: 71994
Document number: DR-001
Revision: C
August 28, 2015
Page 83 / 109
Waste water treatment (WWT)
Waste water from majority of industry (e.g. food, drink, paper, chemicals) installations requires combination of primary and
secondary treatment techniques. Further treatment may require tertiary treatments to achieve the discharge limits. And
also generated sludge needs to be treated by one or combination of techniques.
The example of WWT plant in sugar plant with capacity 7,500 t of processed beets per day and WWT capacity 3,000 m3/d
- has both anaerobic and aerobic treatment stages. The anaerobic stage has the efficiency for COD removal 88% and
produces 7,300 m3/day of biogas with 80% of methane and calorific value 27 MJ/m
3. The aerobic stage treats the water to
the required COD level (100 mg/l COD). The price for this WWT plant was € 3.5 million in 2011.
Unit investments for technology implementation
The above table shows that it is very difficult to determine the general investment costs since every water optimization
measure or waste water treatment depends on the site specific conditions, existing infrastructure, maintenance and the aim
of each measure.
The adverse effect of the investment in water reuse and recycling is the pollution of the process water which may need
treatment and thus additional increase of investment costs.
Energy and water savings (compared to the baseline situation)
According to the table above only some of the water optimization technologies bring also energy savings. These are
frequency-controlled pumps and fans (energy savings 30 %), ultrafiltration for protein standardization of cheese milk
(energy savings 10 %), vacuum systems for dewatering (energy savings 20 – 45 %).
Water savings of the above listed technologies and measures are in the range of 10 – 95 %. Bigger savings are typical in
pulp, paper, and food and drinks production.
СО2 emission savings
Not relevant for water optimisation technologies and WWT
Average Pay-back period or IRR
The water reuse and recycling economic depends on the following factors:
the water source availability,
price for water (abstraction or supply),
energy (fuel) price,
requirements and possibilities for waste waters’ discharge.
The technologies listed in the above table have payback period from 1 to 6 years.
The implementation of waste water treatment in EU is in majority driven by legal requirements for the quality of the waste
water discharges. Since the waste water treatment requires significant amount of energy it does not have favourable
payback period if any.
Estimate of market volume and potential
The estimation of the above listed technologies applicability in the CR is listed in the following table.
Industry sector Technology name Applicability on Czech market
Iron and steel Frequency-controlled pumps and fans Applied in all plants
Organic fine chemicals
Water-free vacuum generation Applied in some plants (less than 50 %)

84
Tebodin Ukraine CFI
Climate Technologies in Ukraine. Market Penetration Study
Order number: 71994
Document number: DR-001
Revision: C
August 28, 2015
Page 84 / 109
Chlorine-alkali Recycling of waste water from other production processes
Not applied in CR (there is only one plant).
Dairy (cheese production)
Ultrafiltration for protein standardisation of cheese milk
Applied in majority of cheese plants
Sugar Reuse of process water Applied in all plants
Sugar Dry transport of sugar beets Applied in all plants
Beer Re-use of bottle pasteurising water Applied in large breweries
Pulp Dry debarking with debarking drum Applied in 20 % of plants
Pulp and paper Vacuum systems Applied in all plants
The implementation of WWT in Czech industry plants is driven by the environmental legislation. Waste waters from any
industry installation has to be either treated to the level set by the water permit or discharged into the public sewerage
system, which is treated by the municipal WWT plant. Generally it can be stated that all large water polluting installations
are operating WWT plant or at least pre-treatment technology either alone or together with other polluting installations on
the site.
Competitive analysis
Producers and suppliers of the water optimization technologies are listed in the following table.
Industry sector
Project/technology name producer/ supplier website
Iron and steel Frequency-controlled pumps and fans
FRECON, spol. s r.o.
Danfoss s.r.o.
ABB
http://www.frecon.cz
http://www.danfoss.com
http://www.abb.com
Organic fine chemicals
Water-free vacuum generation
Festo, s.r.o.
Runtech systems
http://www.festo.com
http://www.runtech.fi
Chlorine-alkali Recycling salt-containing effluents to the brine system
ThyssenKrupp Uhde
Pall Corporation
http://www.thyssenkrupp-electrolysis.com/
http://www.pall.com/
Dairy Ultrafiltration for protein standardisation of milk
Membraine s.r.o www.mega.cz
www.ralex.eu
Sugar
Re-use of process water Alfa Laval
Perry Videx
ZVU POTEZ a.s.
http://local.alfalaval.com
http://www.perryvidex.com/
http://www.zvupotez.cz/ Dry transport of sugar beets
Beer Re-use of bottle pasteurising water
Alfa Laval
ZVU POTEZ a.s.
http://local.alfalaval.com
http://www.zvupotez.cz/
Pulp and paper Dry debarking with debarking drum
PAPCEL, a. s. http://www.papcel.cz
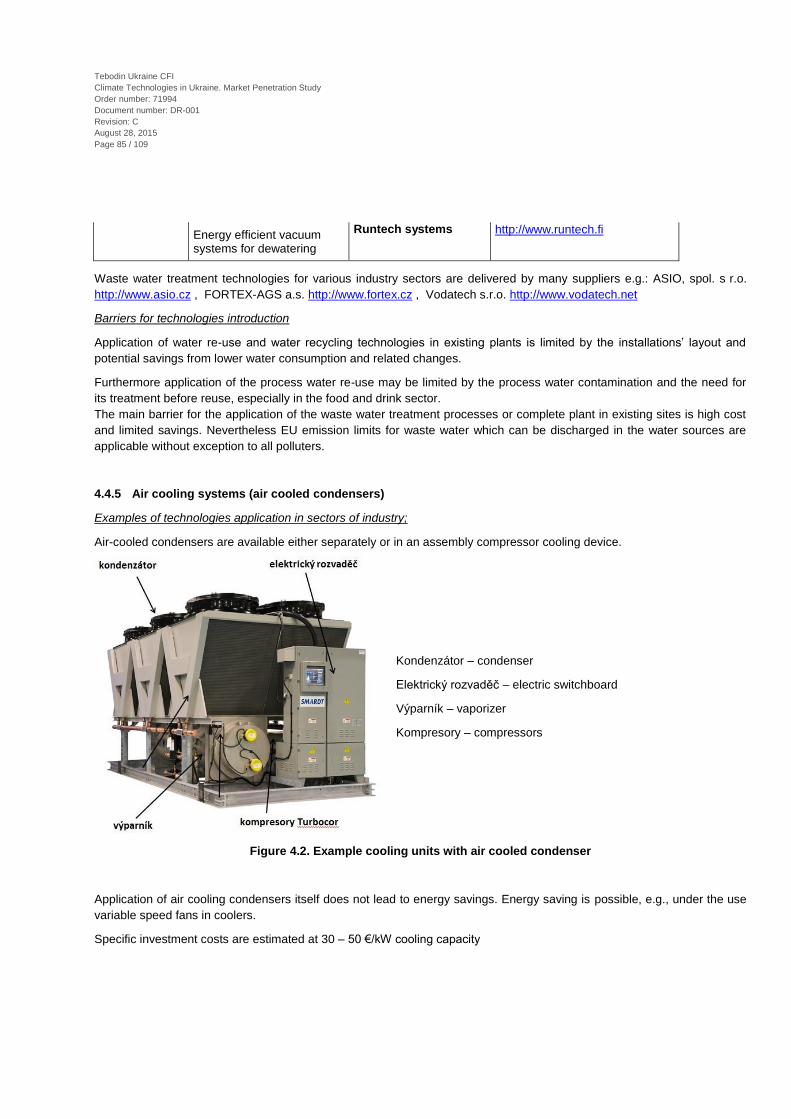
85
Tebodin Ukraine CFI
Climate Technologies in Ukraine. Market Penetration Study
Order number: 71994
Document number: DR-001
Revision: C
August 28, 2015
Page 85 / 109
Energy efficient vacuum systems for dewatering
Runtech systems http://www.runtech.fi
Waste water treatment technologies for various industry sectors are delivered by many suppliers e.g.: ASIO, spol. s r.o.
http://www.asio.cz , FORTEX-AGS a.s. http://www.fortex.cz , Vodatech s.r.o. http://www.vodatech.net
Barriers for technologies introduction
Application of water re-use and water recycling technologies in existing plants is limited by the installations’ layout and
potential savings from lower water consumption and related changes.
Furthermore application of the process water re-use may be limited by the process water contamination and the need for
its treatment before reuse, especially in the food and drink sector.
The main barrier for the application of the waste water treatment processes or complete plant in existing sites is high cost
and limited savings. Nevertheless EU emission limits for waste water which can be discharged in the water sources are
applicable without exception to all polluters.
4.4.5 Air cooling systems (air cooled condensers)
Examples of technologies application in sectors of industry;
Air-cooled condensers are available either separately or in an assembly compressor cooling device.
Kondenzátor – condenser
Elektrický rozvaděč – electric switchboard
Výparník – vaporizer
Kompresory – compressors
Figure 4.2. Example cooling units with air cooled condenser
Application of air cooling condensers itself does not lead to energy savings. Energy saving is possible, e.g., under the use
variable speed fans in coolers.
Specific investment costs are estimated at 30 – 50 €/kW cooling capacity

86
Tebodin Ukraine CFI
Climate Technologies in Ukraine. Market Penetration Study
Order number: 71994
Document number: DR-001
Revision: C
August 28, 2015
Page 86 / 109
5 Current standards in Ukraine
Table 5.1 Country snapshot
Population: 45 million
HDI rank (2014): 83rd of 187 countries
GDP (2014): $ 177 billion (PPP)
GDP/capita: $ 3,933 (PPP)
FDI, net inflows (2014): $ -12,241 million
Investment in energy with private participation (2013): $ 724 million
Ease of Doing Business Rank (2014): 96th of 189 countries
Energy use (2014*): 74 million toe
Energy trade: imports 33 percent of energy used
GDP / energy use: $ 5,04 thousand (PPP)/toe
Electricity price for industry (since 1 March 2015):
1st class consumers (>35kV)- $c 4,8 per kWh
2nd class consumers(<35kV)- $c 5,9 per kWh
Electricity price for households (01-Apr - 31-Aug-2015):
<100 kW/month- $c 1.56 per kWh
100<600 kW/month- $c 2.69 per kWh
>600 kW/month- $c 5.97 per kWh
RE Share of total energy use: 6,9 %
GHG emissions: 390 Mt CO2e
Per capita GHG emissions: 8.5 tCO2e per capita
GHG emissions per GDP 2,2 t CO2e/million $ GDP PPP
Source: IFC24
, WB database25
, Financial portal26
, Enerdata27
, Ministry of Fuel and Energy of Ukraine28
, State Statistics Service of Ukraine29
Growth in real GDP halted in 2012–13 and fell sharply in 2014 against the backdrop of geopolitical tensions. After five
consecutive quarters of negative growth that started in the second half of 2012, Ukraine’s GDP grew by 3.7 percent year-
on-year in the last quarter of 2013 because of a good harvest and a low statistical base. This brought GDP growth to 0.0
percent in 2013 (0.2 percent in 2012). Negative trends in the real sector have deepened in 2014 due to the situation in
eastern Ukraine, developments that were impacted primarily by the conflict, which intensified in the second half of 2014.
Real GDP fell by 6.3% in 2014, but this excludes Crimea and part of the war zone.
Ukraine is one of the largest GHG emitters in the world at 400 MtCO2e per year. It is also one of the least efficient users of
energy, with economic output per unit of energy consumed three times above the EU average. Moreover, 33% of Ukraine’s
primary energy supply is imported, undermining the country’s energy security. As global prices have risen, the Ukrainian
24
Climate-Smart Business: Investment Potential in EMENA, IFC, 2013 25
http://data.worldbank.org/indicator/IE.PPI.ENGY.CD 26
http://index.minfin.com.ua/ 27
https://yearbook.enerdata.ru/renewable-in-electricity-production-share-by-region.html 28
http://mpe.kmu.gov.ua/ 29
http://www.ukrstat.gov.ua/

87
Tebodin Ukraine CFI
Climate Technologies in Ukraine. Market Penetration Study
Order number: 71994
Document number: DR-001
Revision: C
August 28, 2015
Page 87 / 109
government has placed new emphasis on improving the efficiency of its energy distribution and use, as well as diversifying
its energy supply. The country announced major modernization programs for its principal industries - including metals,
cement, paper, plastics. These public initiatives create and enhance the enabling environment to exploit investment
opportunities to upgrade industrial equipment and improve resource efficiency.
In order to develop renewable energy sources, Ukraine adopted the amendments on 01.04.200930
to the Law of Ukraine
“On Electricity Industry” of 16.10.1997 No. 575/97-VR31
.
“Green” tariff is granted to the electricity generated from alternative energy sources (except blast furnace and coke gases,
and for hydro energy – produced only by small hydropower plants), and is effective till 1 January 2030.
The State guarantees that the entire volume of electricity generated from alternative (renewable) sources is bought by the
electric power wholesale market (EPWM) (at the moment represented by the state-owned enterprise “Energorynok”) at the
“green” tariff.
Table 5.2 “Green” tariffs factors as of 01.01.2015
Energy source Formula
applied to
tariff
Tariff for
01.09
€/kWh
“Green”
tariff factor
Peak
hours
factor
Tariff,
€/ kWh
А В С
Electricity generated from
wind energy at the facilities
which installed capacity
does not exceed 600
kW
А·В 0,05385 1,2 - 0,0646
is in the range
between 600 kW and
2,000 kW
А·В 0,05385 1,4 - 0,0754
is over 2,000 kW А·В 0,05385 2,1 - 0,1131
Electricity generated from
wind energy at the single
turbine which installed
capacity
does not exceed 600
kW
А·В 0,05385 1,08 - 0,0581
is in the range
between 600 kW and
2,000 kW
А·В 0,05385 1,26 - 0,0678
is over 2,000 kW А·В 0,05385 1,89 - 0,1018
Electricity generated from
biomass
А·В 0,05385 2,07 - 0,1239
Electricity generated from
biogas
А·В 0,05385 2,07 - 0,1239
Electricity generated from
solar energy
by land facilities А·В·С 0,05385 3,15 1,8 0,4653
by facilities installed
on building roofs
which capacity is over
100 kW
А·В·С 0,05385 3,24 1,8 0,4459
by facilities installed
on building roofs
which capacity is
under 100 kW and the
facilities which are
installed on building
А·В·С 0,05385 3,33 1,8 0,4265
30
http://zakon3.rada.gov.ua/laws/show/1220-17 31
http://zakon3.rada.gov.ua/laws/show/575/97-%D0%B2%D1%80

88
Tebodin Ukraine CFI
Climate Technologies in Ukraine. Market Penetration Study
Order number: 71994
Document number: DR-001
Revision: C
August 28, 2015
Page 88 / 109
Energy source Formula
applied to
tariff
Tariff for
01.09
€/kWh
“Green”
tariff factor
Peak
hours
factor
Tariff,
€/ kWh
facades regardless of
their capacity
Electricity produced by
micro hydropower plants
А·В·С 0,05385 1,8 1,8 0,1745
Electricity produced by mini
hydropower plants
А·В·С 0,05385 1,44 1,8 0,1396
Electricity produced by
small hydropower plants
А·В·С 0,05385 1,08 1,8 0,1047
Recently, the experts has been discussing feasibility of so high “green” tariffs as it was profitable to sell all own ‘green’
electricity to the network, while for the own purpose to by the electricity from the network. On 27.02.2015, the National
Commission for State Energy and Public Utilities Regulation adopted Resolution No. 49332
setting temporary limits on the
“green” tariff (till 01.04.2015). The Resolution cuts the “green” tariff rates by 50% for all types of generation except solar
energy, with the rate for solar energy being reduced by 55% (the reductions in February were 10% and 20%, respectively).
This decision evoked negative reaction among investors in renewable energy33,34
. It is worth to note that this decision puts
at threat the implementation of the National Renewable Energy Action Plan until 2020. NREAP sets the target: – to achieve
11% share of renewable energy sources in the country’s final energy consumption by 2020, and this value is an
international commitment35
.
So, the most likely scenario is that the limitations of the “green” tariff would be cancelled by the regulatory body.
As such, there are no specific standards as for climate technologies in Ukraine. However, there are requirements for e.g.
cogeneration plants, whose owners would like to sell electricity and heat in the network (Law of Ukraine ‘On combined heat
and power generation (cogeneration) and waste energy potential’, #2509-15, revision dd. 02.03.2014), as well as the
procedure for the establishment of such facilities (Procedure of CHP qualification, enacted by Order of CMU #627 dated
12.06.2013).
5.1 Cogeneration
Co-production of heat and electricity is practiced in Ukraine since long ago. Similar to “electrification” the process got the
name “calorification”. The term “cogeneration” appeared much later.
Structurally, the Power and Heat Plant unit consists of a boiler and turbine. In the former combusted fuel (oil, gas and coal)
produces superheated steam, which is then supplied to the turbine, which, in turn, rotates the rotor of the generator.
Excess steam is removed from the turbine and the heat exchanger is a heat source for water heating. The typical structure
of PHP is shown in Figure below:
32
http://www.nerc.gov.ua/index.php?id=14326 33
http://www.rbc.ua/rus/interview/glava-pravleniya-cnbm-international-corp-1426686898.html 34
http://forbes.ua/nation/1388147-sovsem-zelenyj-regulyator-snizil-tarif-na-energiyu-iz-vozobnovlyaemyh-istochnikov 35
http://eig-engineering.com/en/novosti/60-snizhenie-ili-otmena-zelenogo-tarifa-vybrosit-vetryanuyu-energetiku-ukrainy-za-bort

89
Tebodin Ukraine CFI
Climate Technologies in Ukraine. Market Penetration Study
Order number: 71994
Document number: DR-001
Revision: C
August 28, 2015
Page 89 / 109
Figure 5.1 Process flow diagram of conventional Power and Heat Plant
Enterprises built by the state for the production of electricity and heat, have enormous power (thousands of megawatts)
and capable of providing heat and power to the big settlements and enterprises. The share of these enterprises in the
power supply structure of Ukraine is still substantial (~41%).
Often these plants are located on a certain distance from the settlements. Thermal energy from PHP comes to consumers
through the piping with the length from several kilometres (steam) to 20-30 km (hot water). The length of heating piping and
associated losses is a huge disadvantage of central heating.
Currently the energy sector of Ukraine is in a difficult position, in particular because:
extremely high deterioration of heat and power generating equipment (80% of the equipment has been in
operation for over than 40 years and has worked out its 1.5-2 operational resources)
acute shortage of own primary energy resources;
situation with the country's economy, which does not allow making necessary investments.
Lower capacity CHP installations became a main alternative to the large power and heat plants.
In addition to the above, among the driving factors for business to switch to lower capacity CHP installations are:
the deterioration of heat and power supply networks and associated the poor quality of electricity and heat;
the high tariffs for centralized heat and electricity
As of 01 March 2015 in Ukraine it was installed 238 CHP units with the total capacity about 1 GWe, which is about 1.8% of
the total country’s installed capacity36
.
36
http://interfax.com.ua/news/economic/253648.html
Cooling Tower Chimney
TurbineBoiler
Pump Station
Hot water
Consumers
Electricity
Superheated
steam
Water Fuel
Exhaust
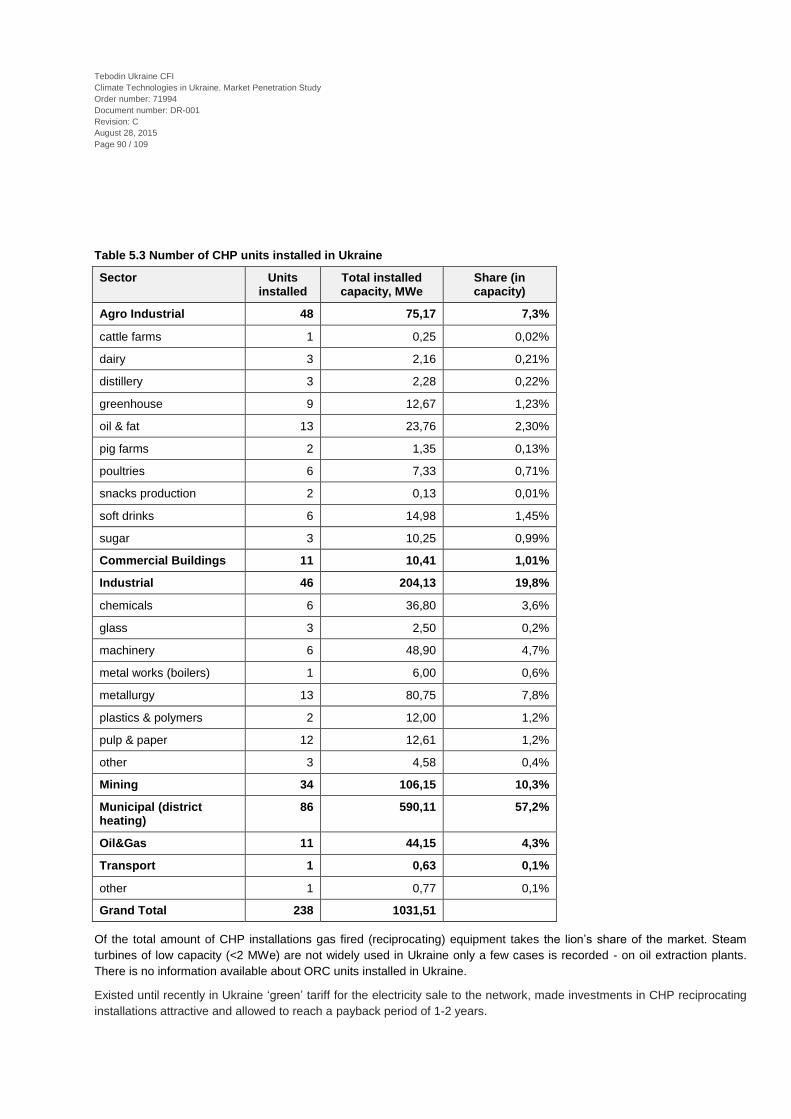
90
Tebodin Ukraine CFI
Climate Technologies in Ukraine. Market Penetration Study
Order number: 71994
Document number: DR-001
Revision: C
August 28, 2015
Page 90 / 109
Table 5.3 Number of CHP units installed in Ukraine
Sector Units installed
Total installed capacity, MWe
Share (in capacity)
Agro Industrial 48 75,17 7,3%
cattle farms 1 0,25 0,02%
dairy 3 2,16 0,21%
distillery 3 2,28 0,22%
greenhouse 9 12,67 1,23%
oil & fat 13 23,76 2,30%
pig farms 2 1,35 0,13%
poultries 6 7,33 0,71%
snacks production 2 0,13 0,01%
soft drinks 6 14,98 1,45%
sugar 3 10,25 0,99%
Commercial Buildings 11 10,41 1,01%
Industrial 46 204,13 19,8%
chemicals 6 36,80 3,6%
glass 3 2,50 0,2%
machinery 6 48,90 4,7%
metal works (boilers) 1 6,00 0,6%
metallurgy 13 80,75 7,8%
plastics & polymers 2 12,00 1,2%
pulp & paper 12 12,61 1,2%
other 3 4,58 0,4%
Mining 34 106,15 10,3%
Municipal (district heating)
86 590,11 57,2%
Oil&Gas 11 44,15 4,3%
Transport 1 0,63 0,1%
other 1 0,77 0,1%
Grand Total 238 1031,51
Of the total amount of CHP installations gas fired (reciprocating) equipment takes the lion’s share of the market. Steam
turbines of low capacity (<2 MWe) are not widely used in Ukraine only a few cases is recorded - on oil extraction plants.
There is no information available about ORC units installed in Ukraine.
Existed until recently in Ukraine ‘green’ tariff for the electricity sale to the network, made investments in CHP reciprocating
installations attractive and allowed to reach a payback period of 1-2 years.

91
Tebodin Ukraine CFI
Climate Technologies in Ukraine. Market Penetration Study
Order number: 71994
Document number: DR-001
Revision: C
August 28, 2015
Page 91 / 109
Table 5.4 Installed CHP units split by capacity
Gas fired (reciprocating) units installed
Total installed capacity, MWe
Share (in capacity)
Steam turbines installed
Total installed capacity, MWe
Share (in capacity)
Total 189 (80%) 281.34 27% of total 31 (13%) 327.95 31% of total
of them <2MWe 148 140.66 50.0% 6 9.95 3.0%
>2MWe <6MWe 39 122.84 43.7% 18 97.00 29.6%
>6MWe 2 17.85 6.3% 7 221.00 67.4%
Of the total number of installed gas fired (reciprocating) units, half capacities are using natural gas, others – biogas, landfill
gas and coal gas methane.
Table 5.5 Installed reciprocating CHP units by fuel type
NG fired Units
Total installed capacity, MWe
Other fuels* fired Units
Total installed capacity, MWe
Agro Industrial 25 42.48 14 11.74
cattle farm 1 0.25
dairy 2 1.54 1 0.62
distillery 3 2.28
greenhouse 6 9.86 2 2.06
oil & fat 6 9.56
pig farm 2 1.35
poultry 6 7.33
snacks production 2 0.13
soft drinks 6 14.98
sugar 2 4.25
Commercial Buildings 11 10.41 - -
Industrial 19 26.08 4 2.30
chemicals 3 1.80
glass 3 2.50
machine build 3 12.90
pulp & paper 11 6.61
other 3 4.58
Mining - - 33 94.15
Municipal (district heating)
60 52.75 12 5.89
Oil&Gas 1 4.30 8 29.85
Transport 1 0.63
other 1 0.77

92
Tebodin Ukraine CFI
Climate Technologies in Ukraine. Market Penetration Study
Order number: 71994
Document number: DR-001
Revision: C
August 28, 2015
Page 92 / 109
NG fired Units
Total installed capacity, MWe
Other fuels* fired Units
Total installed capacity, MWe
Grand Total 119 138.06 70 143.28
* biogas, coal bed methane, blast furnace gas, etc.)
There are vast opportunities for energy efficiency improvements in the industry and agro industry.
Case Astarta
In 2013 Astarta commissioned a biogas plant of daily capacity for biogas production up to 150,000 м³. All gas is burned in
the boiler. The steam is partially used for process needs, partially for production of 6 MW of electricity with the use of back
pressure steam turbine.
Case Slavutich
On breweries Slavutich (Carlsberg Group) in Zaporizhzhya and Kyiv as part of waste water treatment facilities are installed
bioreactors of “Enviro Chemie” which produce 2,000 – 4,000 m3. All gas is burned in boiler, hot water is used for process
needs. The waste heat is not used.
Case Akhtyrka heat and power plant
The project of energy efficiency increase in Akhtyrka heat and power plant (LLC "Brock-Energy", Akhtyrka, Sumy region)
was executed in 2008 – 201037
.
On this plant was installed a small power generating unit, which includes a steam turbine P-0.75-0.4 / 0.03 (P-0.75) with a
capacity of 0.75 MWe (manufactured by JSC "Energotech", St.-Petersburg) and small boiler of 10 t/hour of steam with
parameters of 1.4 MPa, 230°C.
On the plant also previously have been installed: steam boilers TC-35u (3 pcs.), boilers KVGM-50 (2 pcs.), and condensed
steam turbines AT-6 and AP-6 with a capacity of 6 MWe each.
During the heating season the turbine P-0,75 is supplied with steam from AP-6 turbine, in the summer time - from small
steam boiler. The economic effect is achieved due to additional electricity generation and water heating from steam source
with lower parameters. The boiler with a vapour pressure of 0.6 MPa at the outlet and super heater (230 C) was replaced
by boiler which produces saturated steam with a standard pressure of 1.4 MPa.
The estimated project payback period was ~ 2.1 years, investments ~ 3,565 thousand UAH. (Based on tariff for "industrial"
gas – 2,570.7 UAH/1000m3, gas for the population - 872.8 UAH/1000m
3 , electricity - 0.7015 UAH/(kWh), including VAT,
actual in 2009).
The trial operation of the turbine was carried out with a number of deviations from the project:
0.2-0.3 MWe in the summer period - only for internal needs of the plant
higher pressure of outlet steam - 0.05 MPa, compared with the calculated 0.03 MPa, due to increased losses in
the exhaust duct
Due to above reasons the real payback period was increased 1.4 times and reached 3 years.
37
Experience of energy conservation projects with the use of steam turbines of small power capacity, by N.Yu. Babak, Energy and Heat
processes and equipment: http://repository.kpi.kharkov.ua/handle/KhPI-Press/1110

93
Tebodin Ukraine CFI
Climate Technologies in Ukraine. Market Penetration Study
Order number: 71994
Document number: DR-001
Revision: C
August 28, 2015
Page 93 / 109
5.2 Heat recovery systems
In case of waste heat utilisation, due to differences in heat recuperation techniques (“flue gas / water”, “flue gas / steam”,
“flue gas / air”) , the unification issue is a problem which is difficult to resolve.
The main (sub)-sectors of new technologies applications in Ukraine are
Agroindustry:
Bakeries (baking ovens)
Industry:
Metallurgy (metallurgical furnaces)
Cement industry (clinker kilns)
Specific investments for implementing mentioned technologies
Technology Investments, € / kW
flue gas / water 250 - 340
flue gas / steam 350 - 540
flue gas / air 300 - 420
disposal systems with source temperature 60 - 70 °C 850 - 1230
Impact on energy consumption (energy saving effect)
increase efficiency by 5 - 28% for steam and hot water boilers;
increase the efficiency by 20 - 43% for technological lines (bakery, confectionery, ovens)
Impact on CO2 emissions (whether achieved by reducing emissions)
When installing heat exchangers on boilers or CHP in a greenhouses, the CO2 in the daytime is not released into
the atmosphere but goes to the plants feeding (reducing emissions by 40 - 55%);
When installing a heat exchanger of the furnace smelting of non-ferrous metals, it almost entirely limits the
emissions from the combustion and evaporation of paints, varnishes, oils, and epoxy resins. Due to contact with a
relatively "cold" heat exchanger surfaces evaporations are transferred from the vapour to the solid phase and
deposited;
When installing heat recovery in systems "with the transition dew point" partly ~ 7% CO2 is absorbed by
condensate.
Payback period
Technology PBP, years
flue gas / water 0.3- 0.6
flue gas / steam 0.9- 1.9
flue gas / air 0.8- 1.8
disposal systems with source temperature 60 - 70 °C 1.3 - 3.6
In general, it cannot be said that the individual projects on waste heat recovery are always comparable, so the total amount
of heat recovery installation in Ukraine is difficult to estimate. The differences are mainly in the layout configuration of

94
Tebodin Ukraine CFI
Climate Technologies in Ukraine. Market Penetration Study
Order number: 71994
Document number: DR-001
Revision: C
August 28, 2015
Page 94 / 109
source, consumption and method of implementation. So market penetration estimation is based mainly on subjective
opinion of market players.
5.3 Energy Management Systems, automation and practicies
The key precondition for successful introduction of energy management system is energy consumption control and
metering. Although ISO50001 “Energy management systems - Requirements with guidance for use” standard does not
require to launch automated energy consumption control and metering (technical metering), this system, if available at the
enterprise, multiplies effects of energy saving and where corrective measures are taken it provides the enterprise the
opportunity to save more energy resources.
First, terminology should be specified. So, item 3.35 of the Guidelines for Use of Electricity (GUE) establishes the following
requirements: 38
“3.35 Facilities (except apartment houses and inhabited areas) with 150 kW connected capacity of power plants and
monthly average consumption during previous 12 accounting periods for operating power plants or declared power
consumption for new power plants of 50 thousand kWh and more may be equipped with local data collecting and
processing equipment…”
A consumer may join local data collecting and processing devices into an automated system of commercial metering of
consumer electric power.
According to the letter of the National Electricity Regulatory Commission No.5664/19/17-07 of 24.09.2007 “Clarification of
the interpretations of the terms "local data collecting and processing equipment" and "automated system of commercial
metering" in the Guidelines for Use of Electricity”39
, a fundamental difference between the two systems is that the intended
purpose of LDCPE is to collect and transmit primary data. At the same time, ASCMPC may join several LDCPEs into a
system capable of collecting, accumulating, analysing and reflecting the obtained data.
Thus, GUE encourage consumers to use systems for analysis of energy consumption with automated systems of
commercial metering.
It should be noted that the order of the Ministry of Economic Development of 16.09.2014 № 1111 adopted as a national
standard International standard ISO50001:2014 "Energy management systems - Requirements with guidance for use (ISO
50001: 2011, IDT)".
The International Organizations are providing support to the implementation of ISO50001 standard in Ukraine. UNIDO
started implementation of the project “Introduction of Energy Management System Standard in Ukrainian Industry”. The
project aims at contributing to a sustainable transformation of industrial energy usage practices in Ukraine, by putting in
place Energy Management Systems (EMS), along with the introduction and promotion of the Energy Management
Standard ISO50001. The project is funded by the Global Environmental Facility and will be implemented over the period
2014 to 2019.
Barriers
In experts’ opinion, the main barrier is corruption in energy supplying organizations, specifically, non-competitive bidding
requirements. This barrier considerably limits the marketplace of metering devices and systems, since energy suppliers
currently are key purchasers.
Speaking of industrial consumers, the main barrier to introduction of technical metering systems is unwillingness to use
them. Technical metering systems mean capital investments, analysis of collected data, taking corrective measures
(response to energy overconsumption). As a rule, this means for the staff both additional duties and responsibility for
38
http://zakon4.rada.gov.ua/laws/show/z0417-96/page3 39
http://www.oblenergo.odessa.ua/pdf/letter_askue.pdf
95
Tebodin Ukraine CFI
Climate Technologies in Ukraine. Market Penetration Study
Order number: 71994
Document number: DR-001
Revision: C
August 28, 2015
Page 95 / 109
achieving the results, as well as potential dismissal if high savings are achieved (suspected staff’s low performance before
the technical system of energy metering was installed).
5.4 Water management systems
Water consumption minimisation, optimisation and recycling measures and technologies are integrated in production and
support processes, thus it is difficult to compare them and their effectivity. The incentives for introduction of water
minimisation and recycling are increasing water and energy cost.
Waste water treatment technologies are more standardised, although each water treatment process has to be designed
and adjusted to the treated water pollution and load. There are legal requirements for waste water treatment and also there
are incentives for minimisation of discharging effluents in the form of payments for its volume and pollution.
5.5 Air cooling systems (air cooled condencers)
Air cooling condensers are mainly part of complex refrigeration and air-conditioning equipment installed in dairies,
bakeries, beverages producing and meat processing plants, temperature controlled warehouses. Industrial applications are
reported for printing sector and polymers production.
Air cooling condensers could be effectively applied under the total capacity of the heat transfer up to 2-3 MW. Under the
larger total heat transfer capacity the cooling water tower should be applied – in case of large enterprises greenfield
construction.
Application of air cooling condensers itself does not lead to energy savings. Energy saving is possible, e.g., under the use
variable speed fans in coolers.
Market information in open sources is scarce, so the market penetration can be assessed based on estimates of market
players.
Most Ukrainian suppliers and assemblers use equipment manufactured by Alfa Laval, Gunter and SPR.
Based on the information from company “ES Engineering”40
, the total capacity of air cooling condensers installed in
Ukraine is estimated at 92 MW.
5.6 Identified barriers to climate technology transfer in Ukraine
If prior 2005 the main barrier and de-motivator for introduction and development of climate technologies in the Ukrainian
market were low prices for energy and other resources, since 2005 rising energy prices started to be a motivator for the
actions towards increasing of efficiency both for private and state resource users.
Examples from Central European countries like the Czech Republic shows that complete abolishment of price subsidies for
energy carriers was a main factor towards rational use of energy in industry. The creation of the carbon market, setting a
price for CO2 emissions, has potentially the same effect. Here, however, the fluctuation in the CO2 price remains a problem
and is not yet a good guideline for investments in climate technologies.
Still the energy and resource saving as well as CO2 reduction programs are rather company specific in Ukraine. The
development of optimal programs to increase energy and resource efficiency as well as implementation of CO2 reduction
initiatives require high level and complex qualification of in-house personnel as well as outsourced energy auditing
specialism and engineering solutions, on the one hand, and strategic vision of the future development of the company by
40
Complex services on the design, supply, installation and service of thermal engineering systems, http://www.ese.ua/index.php/glavnaya

96
Tebodin Ukraine CFI
Climate Technologies in Ukraine. Market Penetration Study
Order number: 71994
Document number: DR-001
Revision: C
August 28, 2015
Page 96 / 109
the owners and managers, on the other hand. In its turn, strategic thinking depends on long-term investment expectations
and climate both on local and external markets.
Corruption and non-transparent procurement are red-flag barriers raised during all interviews the Consultant performed
with the technology providers both international and local. Corruption is mentioned as applicable as for end-users as well
as for mediators (such as power supply companies).
As a sample of legislative incentives and motivators for the market adoption of the amendments dated 2009 to the Law of
Ukraine “On Electricity Industry” on ‘green’ tariff and adoption by Ukraine of ISO 50001 standard in 2014 shall be
mentioned. The order of the Ministry of Economic Development of 16.09.2014 № 1111 adopted as a national standard
International standard ISO50001:2014 ‘Energy management systems - Requirements with guidance for use (ISO 50001:
2011, IDT)’. The International Organizations are providing support to the implementation of ISO50001 standard in Ukraine.
UNIDO started implementation of the project ‘Introduction of Energy Management System Standard in Ukrainian Industry’.
The project aims at contributing to a sustainable transformation of industrial energy usage practices in Ukraine, by putting
in place Energy Management Systems (EMS), along with the introduction and promotion of the Energy Management
Standard ISO50001. The project is funded by the Global Environmental Facility and will be implemented over the period
2014 to 2019.
Since 2014 new barriers challenged the market in a form of lack of political stability, including risks related to the running
military conflict in the East of Ukraine with the developments unpredictable to forecast. Political instability is complimenting
by negative macroeconomic developments that in particular include the following negative influences but not limited to:
Drastic fluctuations of the national currency exchange rate towards foreign currencies and corresponding
unpredictable risks related both for raw material, equipment and technology imports and exports of production and
technologies;
Loss or slippage of usual and large Russian sales market both for end-users from various industry and
agroindustry sectors as well as technology developers and providers and necessity to search and apply for new
markets opportunities.
Specific barriers are related to the problems with the raw materials for some end-users e.g. in food and drinks sector,
namely producers of milk and meat cattle in Ukraine.
Based on Eco questionnaire the Consultant may summarize own and interviewed market players’ vision as of current
barriers and motivators for climate technologies penetration as follows:
What obstacles are stopping your company or organisation from investing in or working with energy efficiency
and renewable energy ?
The top three barriers and motivations Choice 1 (the most common
answer)
Choice 2 Choice 3
Economic and financial (e.g. difficulty obtaining loans, high cost of technology, uncertain financial environment)
Policy/legal/regulatory (e.g. unstable and uncertain policies, problems in getting clearances, import taxations and certification requirements)
Capacity (e.g. lack of skilled personnel to manage more complex technologies, inadequate training to identify and implement technologies, lack of service providers)
From your company's perspective what are the top three economic and financial obstacles to investment or
involvement with energy efficiency and renewable energy technology?
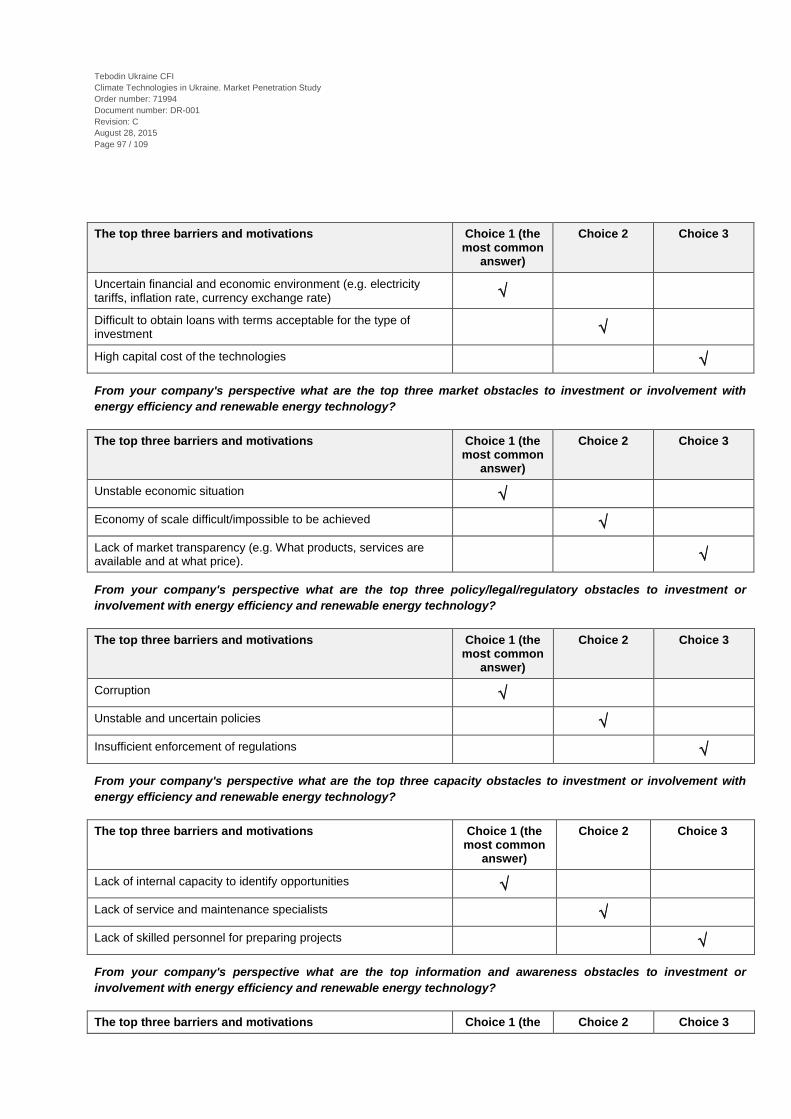
97
Tebodin Ukraine CFI
Climate Technologies in Ukraine. Market Penetration Study
Order number: 71994
Document number: DR-001
Revision: C
August 28, 2015
Page 97 / 109
The top three barriers and motivations Choice 1 (the most common
answer)
Choice 2 Choice 3
Uncertain financial and economic environment (e.g. electricity tariffs, inflation rate, currency exchange rate)
Difficult to obtain loans with terms acceptable for the type of investment
High capital cost of the technologies
From your company's perspective what are the top three market obstacles to investment or involvement with
energy efficiency and renewable energy technology?
The top three barriers and motivations Choice 1 (the most common
answer)
Choice 2 Choice 3
Unstable economic situation
Economy of scale difficult/impossible to be achieved
Lack of market transparency (e.g. What products, services are available and at what price).
From your company's perspective what are the top three policy/legal/regulatory obstacles to investment or
involvement with energy efficiency and renewable energy technology?
The top three barriers and motivations Choice 1 (the most common
answer)
Choice 2 Choice 3
Corruption
Unstable and uncertain policies
Insufficient enforcement of regulations
From your company's perspective what are the top three capacity obstacles to investment or involvement with
energy efficiency and renewable energy technology?
The top three barriers and motivations Choice 1 (the most common
answer)
Choice 2 Choice 3
Lack of internal capacity to identify opportunities
Lack of service and maintenance specialists
Lack of skilled personnel for preparing projects
From your company's perspective what are the top information and awareness obstacles to investment or
involvement with energy efficiency and renewable energy technology?
The top three barriers and motivations Choice 1 (the Choice 2 Choice 3

98
Tebodin Ukraine CFI
Climate Technologies in Ukraine. Market Penetration Study
Order number: 71994
Document number: DR-001
Revision: C
August 28, 2015
Page 98 / 109
most common answer)
Poor or lack of information about costs and benefits of technologies
Insufficient demonstration of technology in the country
Lack of agencies, organizations or sources to provide information
Motivations for energy efficiency and renewable energy investments
The following questions relate to Consultant’s perception of motivations to invest in energy efficiency technology and/or
renewable energy technologies.
What, in your view, are the top three motivators to invest in energy efficiency and/or renewable energy in Ukraine
right now?
The top three barriers and motivations Choice 1 (most important)
Choice 2 Choice 3
Reduction of operational costs (energy costs, carbon tax)
Energy security
Existing legal and regulatory requirements (green tariff)
Thinking about your company, what would most motivate investment in energy efficiency and/or renewable
energy technologies?
The top three barriers and motivations Choice 1 (most important)
Choice 2 Choice 3
Operational savings potential
Affordability of technology
Legal and regulatory requirements
99
Tebodin Ukraine CFI
Climate Technologies in Ukraine. Market Penetration Study
Order number: 71994
Document number: DR-001
Revision: C
August 28, 2015
Page 99 / 109
6 Ukraine’s market potential and penetration
According to IFC In the cement and metal industries of Ukraine, the investment potential is estimated at $5 billion each.
Regarding the renewable energy, resource efficiency, and water use, heavy industries investment potential is estimated at
$2.1 billion, power sector modernization at $3.9 billion, biomass opportunities estimated at over $6 billion. The potential for
industrial energy efficiency is estimated at more than $3 billion.
Investment opportunities exist across industry sectors for the replacement and efficiency improvement of industrial energy
equipment and lighting. Over two-thirds of infrastructure and equipment is outdated due to a lack of modernization since
the Soviet era. Investment potential in the metals sector has been estimated at over $1 billion. Natural gas prices in
Ukraine have increased steeply in recent years, making other energy efficiency measures, beyond industry, financially
attractive. For instance, the payback time of changing an old and inefficient boiler to a new efficient one is typically less
than two years, and internal rate of return (IRR) can be over 50 percent.
Overall, IFC estimates put the commercial climate-smart business investment potential in Ukraine at over $43 billion..
Ukraine has tremendous agricultural potential that has a critical role to play in contributing to global food security. In 2014,
agriculture contributed up to 23 percent to the country’s GDP and constituted 36 percent of national exports. However, this
potential has not been fully exploited, due to depressed farm incomes and an inadequate policy framework that has
reduced private investment to below the levels required to modernize the sector.
Examples of ill-advised policy measures include repeated grain export restrictions (most recently in 2010–11, now replaced
by export taxes); interventions in domestic food markets to control prices; overregulated food safety controls that are not
World Trade Organization (WTO) compliant; weaknesses in contract enforcement that have discouraged commodity
financing and risk insurance mechanisms; and an incomplete process of land reform. The Bank, in cooperation with the
International Finance Corporation (IFC), is assisting the Government in developing a sound policy framework and
investment climate in the sector.
Based on major resource potentials, current low penetration, and strong public facilitation, biomass represents more than
two-thirds of the total estimated renewable potential, offering opportunities estimated at over $6 billion. Public support is
strong, and, with an attractive feed-in tariff in place, the biomass energy sector is prepared for intensive development.
The municipal services sector in Ukraine suffers from decades of underinvestment and poor maintenance. The need to
invest in water and wastewater utilities is growing dramatically, and the existing low tariff levels are a major limitation to the
sustainability of these utilities. The need for rehabilitation is exacerbated by the overall high energy consumption in water
production and wastewater treatment. It is estimated that energy intensity in Ukraine is one of the highest in the region.
Improving service delivery through the rehabilitation of infrastructure and the promotion of energy-efficiency solutions offers
the possibility of driving utilities toward financial sustainability while providing improved services.
6.1 Cogeneration market potential and penetration
Among the pre-defined (sub) sectors the most important for the installation of biogas-based CHP are the sugar industry,
breweries and distilleries. Despite the high share of enterprises with installed equipment for the biogas production (83%,
31% and 86% respectively)41
cogeneration is used only on a few of them.
Ukrainian sugar industry is fully privatized. About 70% of the sugar beet produced in vertically integrated holdings
(Agroprodinvest, Ukrros, Astarta, Raiz-sugar, Mriya, etc.). In 2014 it was operational 38 sugar plants in Ukraine42
. Their
production capacities vary from a few thousand to 100 thousand tonnes of sugar per season. Virtually all sugar factories in
Ukraine are of potential interest for the implementation of co-generation.
41
The development of biogas technology in Ukraine and Germany: the regulatory and legal framework, the state and prospects
(http://www.uabio.org/img/files/news/pdf/Razvitie_biogazovyh_technologiy_1.pdf ) 42
http://economics.unian.ua/agro/961581-ukrajina-moje-zbilshiti-virobnitstvo-tsukru-na-34.html
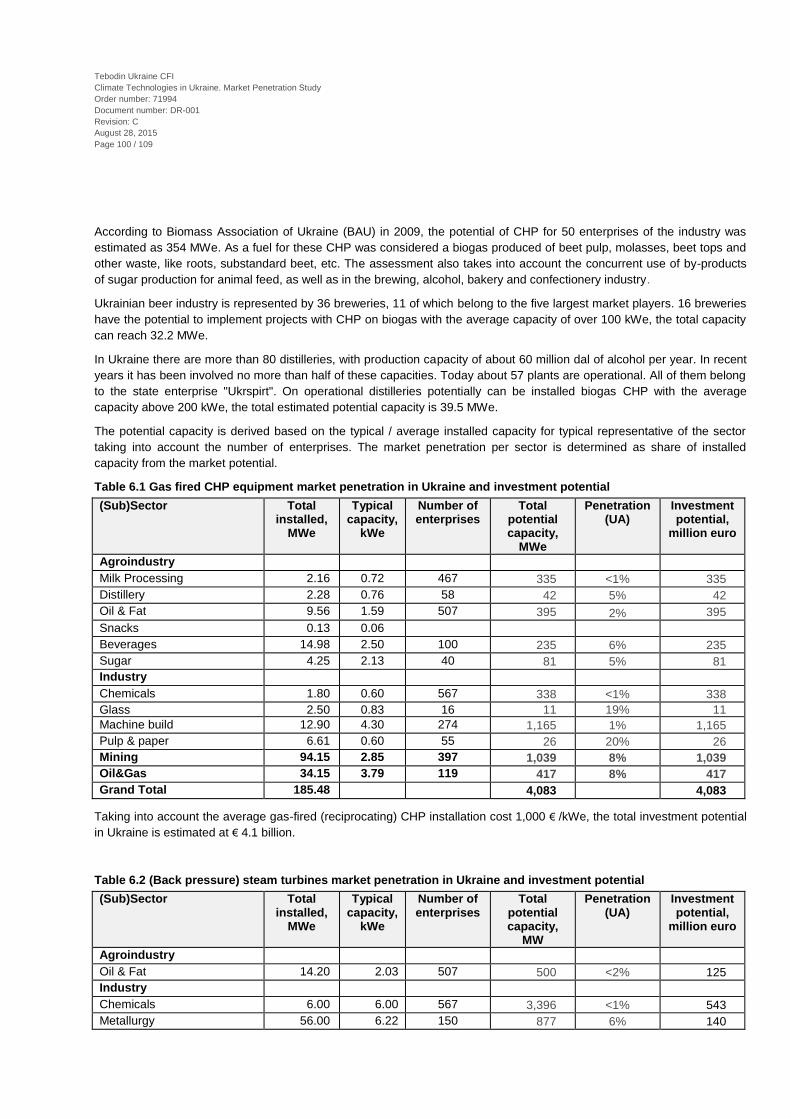
100
Tebodin Ukraine CFI
Climate Technologies in Ukraine. Market Penetration Study
Order number: 71994
Document number: DR-001
Revision: C
August 28, 2015
Page 100 / 109
According to Biomass Association of Ukraine (BAU) in 2009, the potential of CHP for 50 enterprises of the industry was
estimated as 354 MWe. As a fuel for these CHP was considered a biogas produced of beet pulp, molasses, beet tops and
other waste, like roots, substandard beet, etc. The assessment also takes into account the concurrent use of by-products
of sugar production for animal feed, as well as in the brewing, alcohol, bakery and confectionery industry.
Ukrainian beer industry is represented by 36 breweries, 11 of which belong to the five largest market players. 16 breweries
have the potential to implement projects with CHP on biogas with the average capacity of over 100 kWe, the total capacity
can reach 32.2 MWe.
In Ukraine there are more than 80 distilleries, with production capacity of about 60 million dal of alcohol per year. In recent
years it has been involved no more than half of these capacities. Today about 57 plants are operational. All of them belong
to the state enterprise "Ukrspirt". On operational distilleries potentially can be installed biogas CHP with the average
capacity above 200 kWe, the total estimated potential capacity is 39.5 MWe.
The potential capacity is derived based on the typical / average installed capacity for typical representative of the sector
taking into account the number of enterprises. The market penetration per sector is determined as share of installed
capacity from the market potential.
Table 6.1 Gas fired CHP equipment market penetration in Ukraine and investment potential
(Sub)Sector Total installed,
MWe
Typical capacity,
kWe
Number of enterprises
Total potential capacity,
MWe
Penetration (UA)
Investment potential,
million euro
Agroindustry
Milk Processing 2.16 0.72 467 335 <1% 335
Distillery 2.28 0.76 58 42 5% 42
Oil & Fat 9.56 1.59 507 395 2% 395
Snacks 0.13 0.06
Beverages 14.98 2.50 100 235 6% 235
Sugar 4.25 2.13 40 81 5% 81
Industry
Chemicals 1.80 0.60 567 338 <1% 338
Glass 2.50 0.83 16 11 19% 11
Machine build 12.90 4.30 274 1,165 1% 1,165
Pulp & paper 6.61 0.60 55 26 20% 26
Mining 94.15 2.85 397 1,039 8% 1,039
Oil&Gas 34.15 3.79 119 417 8% 417
Grand Total 185.48 4,083 4,083
Taking into account the average gas-fired (reciprocating) CHP installation cost 1,000 € /kWe, the total investment potential
in Ukraine is estimated at € 4.1 billion.
Table 6.2 (Back pressure) steam turbines market penetration in Ukraine and investment potential
(Sub)Sector Total installed,
MWe
Typical capacity,
kWe
Number of enterprises
Total potential capacity,
MW
Penetration (UA)
Investment potential,
million euro
Agroindustry
Oil & Fat 14.20 2.03 507 500 <2% 125
Industry
Chemicals 6.00 6.00 567 3,396 <1% 543
Metallurgy 56.00 6.22 150 877 6% 140
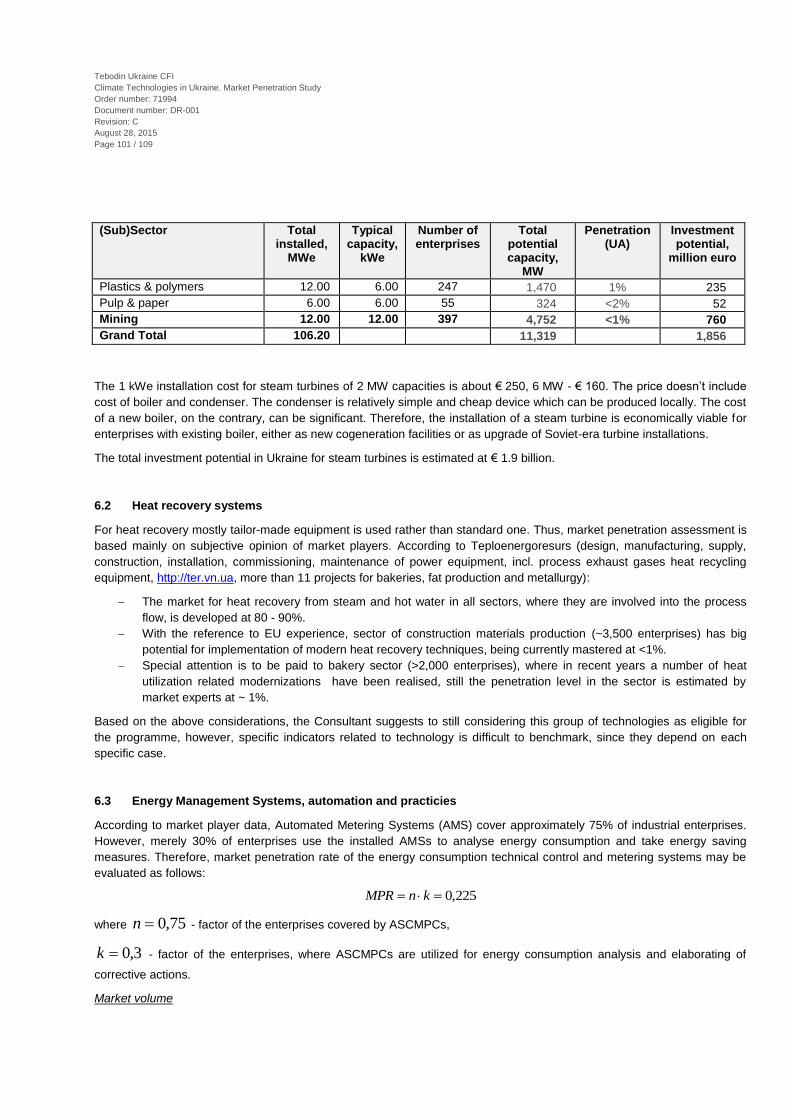
101
Tebodin Ukraine CFI
Climate Technologies in Ukraine. Market Penetration Study
Order number: 71994
Document number: DR-001
Revision: C
August 28, 2015
Page 101 / 109
(Sub)Sector Total installed,
MWe
Typical capacity,
kWe
Number of enterprises
Total potential capacity,
MW
Penetration (UA)
Investment potential,
million euro
Plastics & polymers 12.00 6.00 247 1,470 1% 235
Pulp & paper 6.00 6.00 55 324 <2% 52
Mining 12.00 12.00 397 4,752 <1% 760
Grand Total 106.20 11,319 1,856
The 1 kWe installation cost for steam turbines of 2 MW capacities is about € 250, 6 MW - € 160. The price doesn’t include
cost of boiler and condenser. The condenser is relatively simple and cheap device which can be produced locally. The cost
of a new boiler, on the contrary, can be significant. Therefore, the installation of a steam turbine is economically viable for
enterprises with existing boiler, either as new cogeneration facilities or as upgrade of Soviet-era turbine installations.
The total investment potential in Ukraine for steam turbines is estimated at € 1.9 billion.
6.2 Heat recovery systems
For heat recovery mostly tailor-made equipment is used rather than standard one. Thus, market penetration assessment is
based mainly on subjective opinion of market players. According to Teploenergoresurs (design, manufacturing, supply,
construction, installation, commissioning, maintenance of power equipment, incl. process exhaust gases heat recycling
equipment, http://ter.vn.ua, more than 11 projects for bakeries, fat production and metallurgy):
The market for heat recovery from steam and hot water in all sectors, where they are involved into the process
flow, is developed at 80 - 90%.
With the reference to EU experience, sector of construction materials production (~3,500 enterprises) has big
potential for implementation of modern heat recovery techniques, being currently mastered at <1%.
Special attention is to be paid to bakery sector (>2,000 enterprises), where in recent years a number of heat
utilization related modernizations have been realised, still the penetration level in the sector is estimated by
market experts at ~ 1%.
Based on the above considerations, the Consultant suggests to still considering this group of technologies as eligible for
the programme, however, specific indicators related to technology is difficult to benchmark, since they depend on each
specific case.
6.3 Energy Management Systems, automation and practicies
According to market player data, Automated Metering Systems (AMS) cover approximately 75% of industrial enterprises.
However, merely 30% of enterprises use the installed AMSs to analyse energy consumption and take energy saving
measures. Therefore, market penetration rate of the energy consumption technical control and metering systems may be
evaluated as follows:
225,0 knMPR
where 75,0n - factor of the enterprises covered by ASCMPCs,
3,0k - factor of the enterprises, where ASCMPCs are utilized for energy consumption analysis and elaborating of
corrective actions.
Market volume

102
Tebodin Ukraine CFI
Climate Technologies in Ukraine. Market Penetration Study
Order number: 71994
Document number: DR-001
Revision: C
August 28, 2015
Page 102 / 109
To determine the size of energy consumption technical control and metering marketplace, we are to define a target user
(potential consumer). Small, medium and large industrial enterprises in the selected industrial sectors may be defined as
target consumers. Micro enterprises are not included, since the number of metering points at these enterprises is small (1-
5) and there is no need to launch the automated system.
Large enterprises – 382.
Middle-size enterprises – 5,651.
Small enterprises – 115,211.
Microenterprises – 103,32243
.
According to market data the cost of metering point is:
Electricity: € 1,000±20%;
Natural gas: € 3,000±20%;
Heat/hot water: € 1,500±20%;
Cold water: € 1,000±20%;
Compressed air: € 3,000±20%.
The cost of metering point depends on number of points, type of meter, precision of measurements.
The tables below demonstrates the evaluation of market volume based on number of enterprises, average number of
different control points on enterprises, penetration rate.
Table 6.3 Number of meters per size of enterprise and market sector
Number of points for control. Large enterprises
Number of points for control. Middle-size
enterprises
Number of points for control. Small enterprises
El-
cit
y
Nat.
ga
s
Hea
t/h
ot
wa
ter
Co
ld w
ate
r
Co
mp
. a
ir
El-
cit
y
Nat.
ga
s
Hea
t/h
ot
wa
ter
Co
ld w
ate
r
Co
mp
. a
ir
El-
cit
y
Nat.
ga
s
Hea
t/h
ot
wa
ter
Co
ld w
ate
r
Co
mp
. a
ir
Agro Industry
Beverages 150 4 10 4 2 30 1 6 4 1 10 1 2 1 1
Bakeries 50 6 4 2 1 20 2 6 1 1 5 1 2 1 1
Milk processing 50 4 10 2 1 50 2 6 1 1 10 1 2 1 1
Oil extraction, Fat production
150 2 6 2 1 50 2 6 1 1 10 1 2 1 1
Sugar 100 2 12 6 2 50 2 6 3 1 10 1 2 1 1
Industry
Building materials (cement and dry mixtures, glass, bricks etc.)
150 4 10 20 4 50 2 6 1 2 10 1 2 1 1
43
http://www.ukrstat.gov.ua/

103
Tebodin Ukraine CFI
Climate Technologies in Ukraine. Market Penetration Study
Order number: 71994
Document number: DR-001
Revision: C
August 28, 2015
Page 103 / 109
Number of points for control. Large enterprises
Number of points for control. Middle-size
enterprises
Number of points for control. Small enterprises
El-
cit
y
Na
t. g
as
He
at/
ho
t
wa
ter
Co
ld w
ate
r
Co
mp
. a
ir
El-
cit
y
Na
t. g
as
He
at/
ho
t
wa
ter
Co
ld w
ate
r
Co
mp
. a
ir
El-
cit
y
Na
t. g
as
He
at/
ho
t
wa
ter
Co
ld w
ate
r
Co
mp
. a
ir
Basic chemicals, plastics and polymers, fertilizers
150 20 10 10 4 50 2 6 1 2 10 1 2 1 1
Other chemicals 150 20 10 10 4 50 2 6 1 2 10 1 2 1 1
Pulp & Paper 150 4 20 10 4 50 2 10 1 1 10 1 2 1 1
Steel and metals, metal works
400 30 20 100 20 50 4 4 1 5 10 1 2 1 1
Wood working and processing
150 2 20 2 1 50 1 10 1 1 10 1 2 1 1
Pharmaceuticals and Medical equipment
150 2 6 6 2 50 1 4 1 1 10 1 2 1 1
Oil & Gas
Extraction (gas, mining, etc.)
300 10 10 10 20 50 1 6 1 2 10 1 2 1 1
Oil refineries 150 10 20 20 4 50 1 6 1 2 10 1 2 1 1
Table 6.4 Investment potential in EMS per size of enterprise and market sector
EMS investment potential.
Large enterprises, ‘000 EUR
EMS investment potential.
Middle-size enterprises,
‘000 EUR
EMS investment potential.
Small enterprises, ‘000 EUR
Ele
ctr
icit
y
Nat.
ga
s
Hea
t/h
ot
wa
ter
Co
ld w
ate
r
Co
mp
. a
ir
Ele
ctr
icit
y
Nat.
ga
s
Hea
t/h
ot
wa
ter
Co
ld w
ate
r
Co
mp
. a
ir
Ele
ctr
icit
y
Nat.
ga
s
Hea
t/h
ot
wa
ter
Co
ld w
ate
r
Co
mp
. a
ir
Agro Industry
Beverages 150 12 15 4 6 30 3 9 4 3 10 3 3 1 3
Bakeries 50 18 6 2 3 20 6 9 1 3 5 3 3 1 3
Milk processing 50 12 15 2 3 50 6 9 1 3 10 3 3 1 3
Oil extraction, Fat
production
150 6 9 2 3 50 6 9 1 3 10 3 3 1 3
Sugar 100 6 18 6 6 50 6 9 3 3 10 3 3 1 3
Industry
Building materials
(cement and dry
mixtures, glass,
bricks etc.)
150 12 15 20 12 50 6 9 1 6 10 3 3 1 3
Basic chemicals,
plastics and
polymers, fertilizers
150 60 15 10 12 50 6 9 1 6 10 3 3 1 3
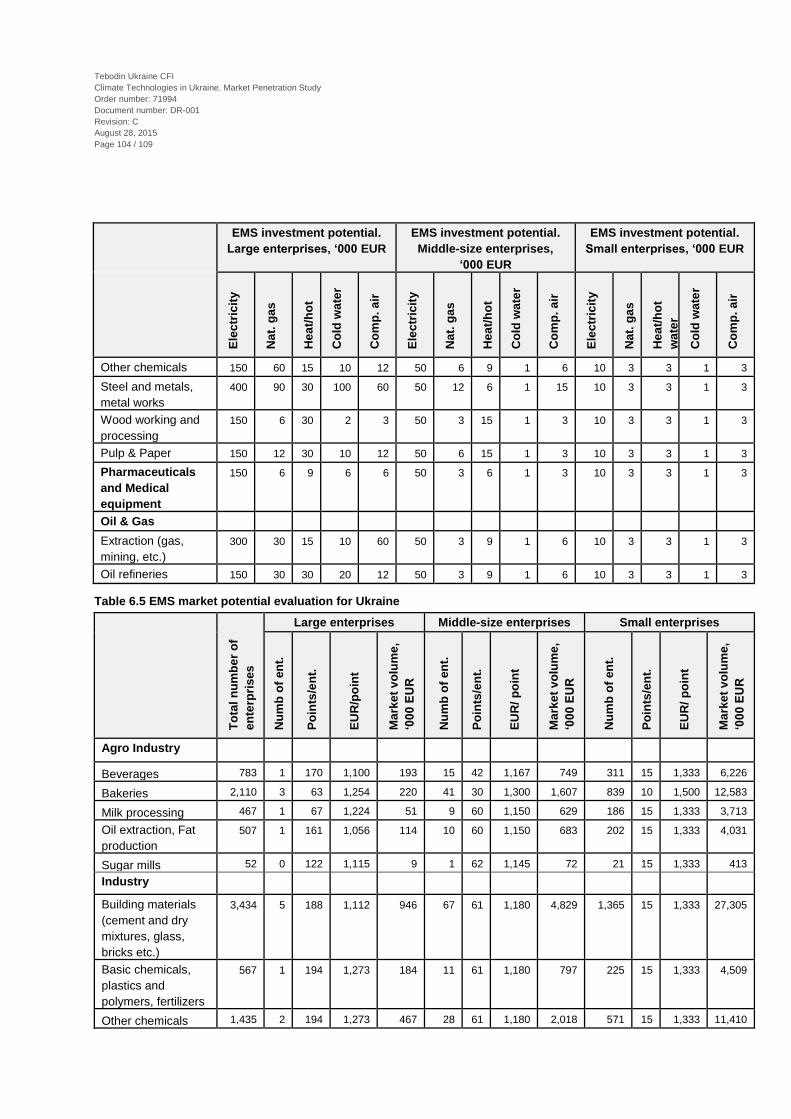
104
Tebodin Ukraine CFI
Climate Technologies in Ukraine. Market Penetration Study
Order number: 71994
Document number: DR-001
Revision: C
August 28, 2015
Page 104 / 109
EMS investment potential.
Large enterprises, ‘000 EUR
EMS investment potential.
Middle-size enterprises,
‘000 EUR
EMS investment potential.
Small enterprises, ‘000 EUR
Ele
ctr
icit
y
Na
t. g
as
He
at/
ho
t
wa
ter
Co
ld w
ate
r
Co
mp
. a
ir
Ele
ctr
icit
y
Na
t. g
as
He
at/
ho
t
wa
ter
Co
ld w
ate
r
Co
mp
. a
ir
Ele
ctr
icit
y
Na
t. g
as
He
at/
ho
t
wa
ter
Co
ld w
ate
r
Co
mp
. a
ir
Other chemicals 150 60 15 10 12 50 6 9 1 6 10 3 3 1 3
Steel and metals,
metal works
400 90 30 100 60 50 12 6 1 15 10 3 3 1 3
Wood working and
processing
150 6 30 2 3 50 3 15 1 3 10 3 3 1 3
Pulp & Paper 150 12 30 10 12 50 6 15 1 3 10 3 3 1 3
Pharmaceuticals
and Medical
equipment
150 6 9 6 6 50 3 6 1 3 10 3 3 1 3
Oil & Gas
Extraction (gas,
mining, etc.)
300 30 15 10 60 50 3 9 1 6 10 3 3 1 3
Oil refineries 150 30 30 20 12 50 3 9 1 6 10 3 3 1 3
Table 6.5 EMS market potential evaluation for Ukraine
To
tal
nu
mb
er
of
en
terp
ris
es
Large enterprises Middle-size enterprises Small enterprises
Nu
mb
of
en
t.
Po
ints
/en
t.
EU
R/p
oin
t
Ma
rke
t v
olu
me
,
‘00
0 E
UR
Nu
mb
of
en
t.
Po
ints
/en
t.
EU
R/
po
int
Ma
rke
t v
olu
me
,
‘00
0 E
UR
Nu
mb
of
en
t.
Po
ints
/en
t.
EU
R/
po
int
Ma
rke
t v
olu
me
,
‘00
0 E
UR
Agro Industry
Beverages 783 1 170 1,100 193 15 42 1,167 749 311 15 1,333 6,226
Bakeries 2,110 3 63 1,254 220 41 30 1,300 1,607 839 10 1,500 12,583
Milk processing 467 1 67 1,224 51 9 60 1,150 629 186 15 1,333 3,713
Oil extraction, Fat
production
507 1 161 1,056 114 10 60 1,150 683 202 15 1,333 4,031
Sugar mills 52 0 122 1,115 9 1 62 1,145 72 21 15 1,333 413
Industry
Building materials
(cement and dry
mixtures, glass,
bricks etc.)
3,434 5 188 1,112 946 67 61 1,180 4,829 1,365 15 1,333 27,305
Basic chemicals,
plastics and
polymers, fertilizers
567 1 194 1,273 184 11 61 1,180 797 225 15 1,333 4,509
Other chemicals 1,435 2 194 1,273 467 28 61 1,180 2,018 571 15 1,333 11,410

105
Tebodin Ukraine CFI
Climate Technologies in Ukraine. Market Penetration Study
Order number: 71994
Document number: DR-001
Revision: C
August 28, 2015
Page 105 / 109
T
ota
l n
um
be
r o
f
en
terp
ris
es
Large enterprises Middle-size enterprises Small enterprises
Nu
mb
of
en
t.
Po
ints
/en
t.
EU
R/p
oin
t
Ma
rke
t v
olu
me
,
‘00
0 E
UR
Nu
mb
of
en
t.
Po
ints
/en
t.
EU
R/
po
int
Ma
rke
t v
olu
me
,
‘00
0 E
UR
Nu
mb
of
en
t.
Po
ints
/en
t.
EU
R/
po
int
Ma
rke
t v
olu
me
,
‘00
0 E
UR
Pulp & Paper 1,065 1 188 1,138 300 21 64 1,172 1,560 423 15 1,333 8,468
Steel and metals,
metal works
7,834 10 570 1,193 7,019 153 64 1,313 12,852 3,115 15 1,333 62,292
Wood working and
processing
3,224 4 175 1,091 811 63 63 1,143 4,533 1,282 15 1,333 25,636
Pharmaceuticals
and Medical
equipment
248 0 166 1,066 578 5 57 1,105 305 99 15 1,333 1,972
Oil & Gas
Extraction (gas,
mining, etc.)
1,918 3 350 1,186 1,048 37 60 1,150 2,585 763 15 1,333 15,251
Oil refineries 144 0 204 1,186 459 3 60 1,150 194 57 15 1,333 1,145
Total 23,788 32 12,399 464 32,009 9,459 184,954
At the average penetration level at 23%, the number of potential consumers of energy consumption technical control and
metering equipment is estimated at 10,000, while the total number of metering points is about 175 thousand. In monetary
equivalent, the estimated investment potential for energy management systems in Ukraine can be estimated at € 230
million.
6.4 Water management systems
A benchmark of the potential market could be based on market penetration estimated for the Czech Republic.
Table 6.6 WMS applicability benchmark
Industry sector Technology name Applicability on market
Iron and steel Frequency-controlled pumps and fans Applied in all plants
Organic fine chemicals Water-free vacuum generation Applied in some plants (less than 50 %)
Chlorine-alkali Recycling of waste water from other production processes
Not applied in CR (there is only one plant).
Dairy (cheese production) Ultrafiltration for protein standardisation of cheese milk
Applied in majority of cheese plants
Sugar Reuse of process water Applied in all plants
Sugar Dry transport of sugar beets Applied in all plants
Breweries Re-use of bottle pasteurising water Applied in large breweries
Pulp Dry debarking with debarking drum Applied in 20 % of plants
Pulp and Paper Vacuum systems Applied in all plants

106
Tebodin Ukraine CFI
Climate Technologies in Ukraine. Market Penetration Study
Order number: 71994
Document number: DR-001
Revision: C
August 28, 2015
Page 106 / 109
Based on the above considerations, the Consultant suggests to still considering this group of technologies as eligible for
the programme, however, specific indicators related to technology is difficult to benchmark, since they depend on each
specific case.
6.5 Air cooling systems (air cooled condencers)
The potential capacity is derived based on the typical / average cooling capacity for typical representative of the sector
taking into account the number of enterprises. The market penetration per sector is determined as share of installed
capacity from potential.
Table 6.7 Air cooling systems market penetration in Ukraine and investment potential
(Sub)Sector Total
installed
, MW
Typical
capacity,
kW
Number of
enterprises
Total
potential
capacity,
MW
Penetration
(UA)
Investment
Potential,
mio euro
Agro Industry
Bakery 0.27 150 1,362 204 <1% 10.41
Beverages (water, beer*) 11.03 200 100 9 55% 0.46
Distillery 3.13 470 58 24 12% 1.45
Vinery 1.82 300 9 1 67% 0.05
Cold storage 7.59 600 400 232 3% 14.41
Confectionery 3.77 300 470 137 <3% 8.23
Oil & Fat 1.87 350 507 176 1% 10.54
Meat processing 41.77 350 882 267 11% 16.02
Fish processing 0.87 50 257 12 <7% 0.83
Fruit & Vegetables processing 0.43 150 357 53 1% 2.71
Milk processing 7.41 400 230 85 8% 5.08
Industry
Metal processing 0.97 150 700 101 1% 5.13
Pharma 2.22 50 100 3 44% 0.19
Plastics & polymers 8.73 300 90 18 32% 1.10
Printing 0.30 50 1,930 96 <1% 6.64
Grand Total 92.16 1,418 83.22
* Without mini-breweries, supplying to a single restaurant.
The investment potential per sector was calculated taking into account the installation cost:
Table 6.8 Unit prices for air cooling systems in Ukraine
Capacity Cost € /kW
Producer Alfa-Laval / Guntner SPR
<100 kW 77 60

107
Tebodin Ukraine CFI
Climate Technologies in Ukraine. Market Penetration Study
Order number: 71994
Document number: DR-001
Revision: C
August 28, 2015
Page 107 / 109
Capacity Cost € /kW
100-300 kW 56 46
300-500 kW 60 -
500-1,000 kW 61 -
2,000 kW 54 -
The total investment potential is estimated at € 83 million.

108
Tebodin Ukraine CFI
Climate Technologies in Ukraine. Market Penetration Study
Order number: 71994
Document number: DR-001
Revision: C
August 28, 2015
Page 108 / 109
6.6 Summary of penetration and investment potential
The considerations above can be summarized as follows.
Table 6.9 Climate Technologies penetration in Ukraine and prospects for investment
Climate Technology
Sector
Co-generation Heat recovery
EMS WMS Air cooling
Gas engine
CHP < 2 MW
Gas engine
CHP > 2 MW < 6
MW
Organic Rankine
Cycle (ORC)
Steam turbine CHP > 2 MW < 6
MW
Agro Industrial
dairy <1% 80–90%* 20% 8%
meat processing 11%
distillery 5% 80–90%* 11%
oil & fat 2-3% 1% 83–91%* 20% 1%
bakeries 1% 20% <1%
beverages 5% 80–90%* 20% 55%
sugar 5% 80–90%* 20%
Industrial
construction materials <1% 20%
chemicals <1% <1% 80–90%* 20%
glass 20% 80–90%* 20%
machinery 1% 20%
metallurgy 6% 80–90%* 20% 5%
plastics & polymers <1% 20% 30%
pulp & paper 20% <2% 80–90%* 20%
wood processing n/a 20%
Mining 8% <1%
Oil&Gas <8% 80–90%*
Pharma 20% 45%
Legend:
Technologies/sectors perspective for investments
* - the high penetration level of heat recovery technologies doesn’t reflect the necessity of modernization in almost every sector, modernization will create the demand on new heat recovery technologies implementation.

109
Tebodin Ukraine CFI
Climate Technologies in Ukraine. Market Penetration Study
Order number: 71994
Document number: DR-001
Revision: C
August 28, 2015
Page 109 / 109
Table 6.10. EU benchmark and key indicators for CT implementation in Ukraine
PBP EU,
years
PBP UA,
years
Penetra-tion EU**
Penetra-tion UA
Technology related CO2 reduction,
t/MWh
CO2 reduction potential, mio t/year
Invest-ment
potential, bn euro
1. Co-generation:
Gas engine CHP < 2 MW 6 - 10 1 - 2* 3 1-20%
(3) 0.97 8.77 1.147
Gas engine CHP > 2 MW < 6 MW
6 - 10 1 - 2* 3 7% (3) 0.99 22.92 2.937
Organic Rankine Cycle (ORC)
7 - 10 2 - 4 2 n/a 1.17 n/a n/a
Steam turbine CHP > 2 MW < 6 MW
7 - 10 3 - 4 3 1-6% (3) 1.17 104.41 1.856
2. Heat recovery 0.5 - 10 < 4 2 - 3 <1%
(except boilers)
effect is present
n/a n/a
3. Management systems, automation and practices
1 - 4 n/a 2 - 3 22.5%
(1) effect is present
n/a 0.229
4. Water management systems: 1 - 6 n/a 2 - 3 - 4 low (1) not relevant - n/a
5. Air cooling systems (air cooled condensers)
3 1-67% (2-3)
not relevant - 0.083
Total 136.10 6.251
* - For electricity sellers, depending on feed in tariff
** Penetration legend: 1-‘introduction of new technology’; 2-‘increased acceptance of new technology’; 3-‘growing importance and application of technology’; 4-‘fully mature technology’
The total assessed investment potential for the eligible technologies is estimated at € 6.25 billion. At that, the CO2
accountable reduction is estimated at 136 million tons per year, which means invested € 44 will reduce CO2 emission by
1Mt/y.


