April 2011
CHINA LINEN TEXTILE INDUSTRY, LTD.
Investor Presentation
1
Safe Harbor Statement
Statements in this presentation may be "forward-looking statements" within the meaning of federal securities laws. You can identifythese forward-looking statements by terminology such as “will"," expects”, “anticipates”, “estimates”, “plans”, “future”, “intends”,“believes” and similar statements. The matters discussed herein that are forward-looking statements are based on currentmanagement expectations that involve risks and uncertainties that may result in such expectations not being realized. Forward-looking statements involve risks and uncertainties that may cause actual results, performance or financial condition to be materiallydifferent from the expectations of future results, performance or financial condition expressed or implied in any forward-lookingstatements. Such factors include, but are not limited to the company's ability to complete product orders, coordinate product designwith its customers, ability to expand and grow its distribution channels, political and economic factors in the People's Republic ofChina, the Company's ability to find attractive acquisition candidates, dependence on a limited number of larger customers andother factors detailed in the Company’s filings with the Securities and Exchange Commission. Actual outcomes and results maydiffer materially from what is expressed or forecasted in such forward-looking statements due to numerous potential risks anduncertainties. Forward-looking statements made during this presentation speak only as of the date on which they are made, and wedo not undertake any obligation to update any forward-looking statement to reflect events or circumstances after the date of thispresentation.
Because forward-looking statements are subject to risks and uncertainties, we caution you not to place undue reliance on anyforward-looking statements. All written or oral forward-looking statements by the Company or persons acting on its behalf arequalified by these cautionary statements.
We undertake no obligation to publicly update or revise any forward-looking statements or other information or data contained inthis presentation, whether to reflect any change in our expectations with respect to such statements or any change in events,conditions or circumstances on which any such statements are based or otherwise.
2
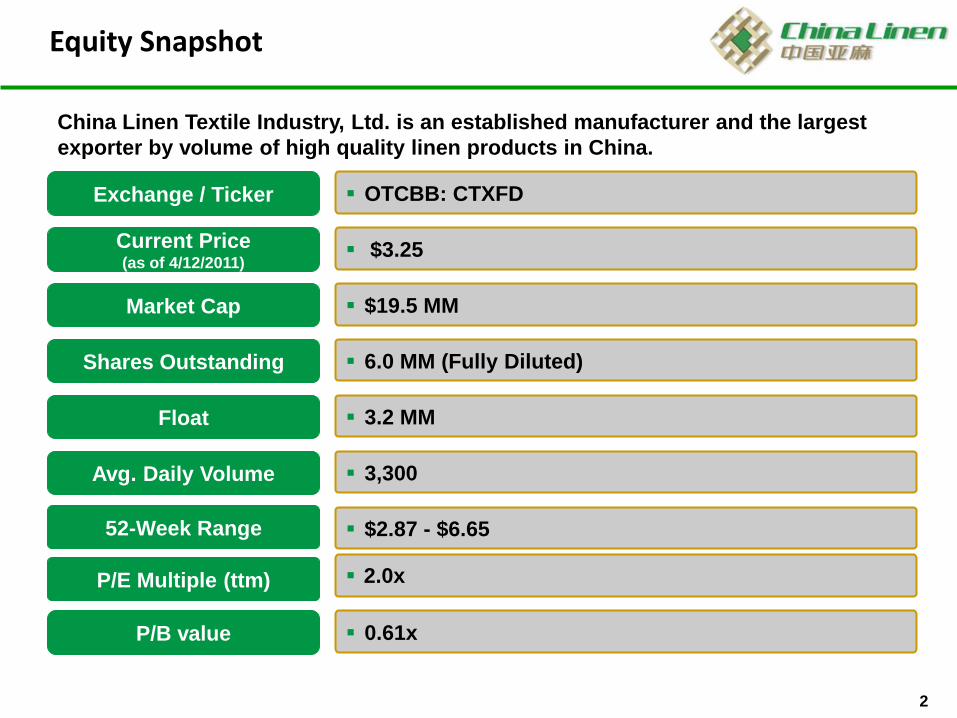
Exchange / Ticker OTCBB: CTXFD
P/E Multiple (ttm) 2.0x
P/B value 0.61x
Float 3.2 MM
52-Week Range $2.87 - $6.65
6.0 MM (Fully Diluted)
Market Cap $19.5 MM
Current Price (as of 4/12/2011)
$3.25
Shares Outstanding
Avg. Daily Volume 3,300
Equity Snapshot
China Linen Textile Industry, Ltd. is an established manufacturer and the largest
exporter by volume of high quality linen products in China.

3
Investment Summary
Consistent sales and earnings growth. China Linen has shown it can grow sales
and earnings consistently. Revenues have grown linearly from $8.4 million in 2004 to $49.1 million in
2010. Net income has followed suit, jumping from $364,000 to $9.6 million over the same period.
Expanding markets and increasing capacity. China Linen is expanding its
customer base in Europe, North American and the Middle East and tapping into the increasing
domestic demand. While its current production can’t meet the demand, the company intends to add
capacity through acquisition and upgrading an existing facility with the objective to double capacity over
the next three to five years.
Margin improvement and vertical integration. The company has improved its
gross margin from 27% in 2007 to 31% in 2010. It also plans to extend to the higher end of the
industrial chain. The eventual goal to cover the entire chain may afford it many years of growth through
continued margin expansion and increased sales.
Continued growth and cheap valuation. 2010 revenue of $49.1 million and net
income of $9.6 million, up 67.1% and 66.9%, respectively, over a year ago. The company provided
2011 revenue guidance of $58-$63 million and net income guidance of $11.5-$12.6 million. Due to the
recent Chinese small cap pull back, the stock is trading at a P/E multiple of 2.0x. For value investors,
shares are selling well below book value per share.
4
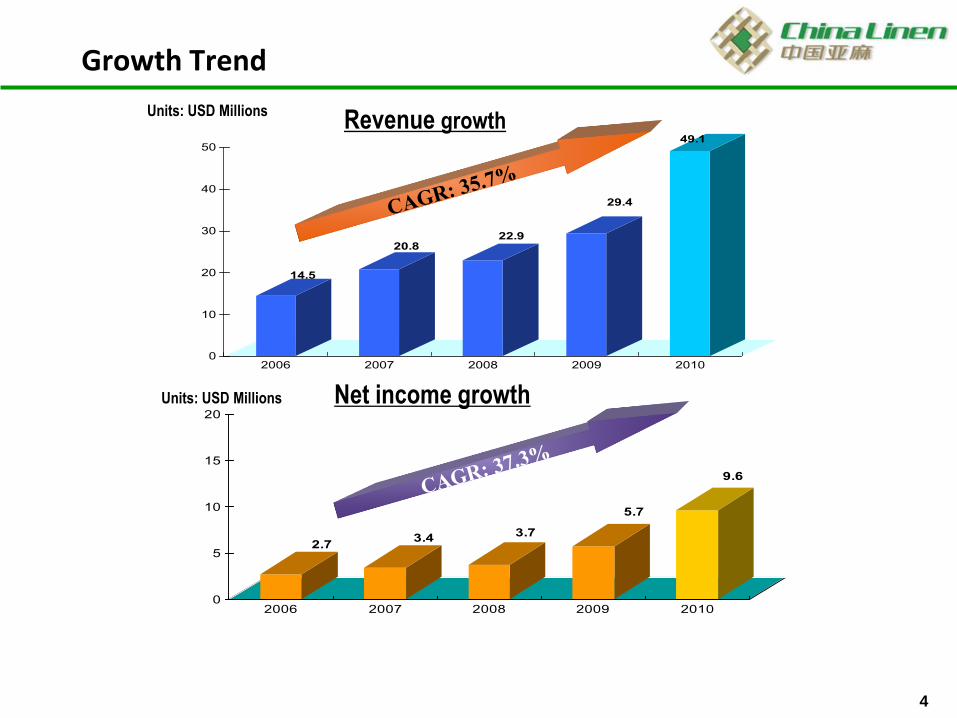
Growth Trend
14.5
20.822.9
29.4
49.1
0
10
20
30
40
50
2006 2007 2008 2009 2010
Units: USD MillionsRevenue growth
2.73.4
3.7
5.7
9.6
0
5
10
15
20
2006 2007 2008 2009 2010
Net income growthUnits: USD Millions
5
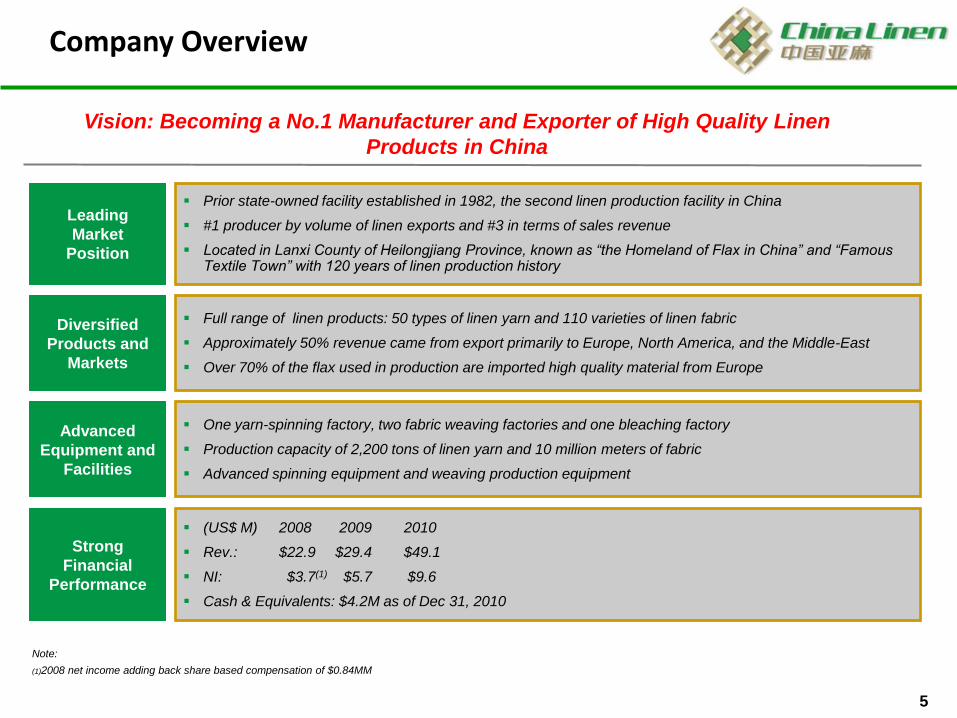
Prior state-owned facility established in 1982, the second linen production facility in China
#1 producer by volume of linen exports and #3 in terms of sales revenue
Located in Lanxi County of Heilongjiang Province, known as “the Homeland of Flax in China” and “Famous Textile Town” with 120 years of linen production history
Leading
Market
Position
Full range of linen products: 50 types of linen yarn and 110 varieties of linen fabric
Approximately 50% revenue came from export primarily to Europe, North America, and the Middle-East
Over 70% of the flax used in production are imported high quality material from Europe
Diversified
Products and
Markets
Vision: Becoming a No.1 Manufacturer and Exporter of High Quality Linen
Products in China
One yarn-spinning factory, two fabric weaving factories and one bleaching factory
Production capacity of 2,200 tons of linen yarn and 10 million meters of fabric
Advanced spinning equipment and weaving production equipment
Advanced
Equipment and
Facilities
Strong
Financial
Performance
(US$ M) 2008 2009 2010
Rev.: $22.9 $29.4 $49.1
NI: $3.7(1) $5.7 $9.6
Cash & Equivalents: $4.2M as of Dec 31, 2010
Note:
(1)2008 net income adding back share based compensation of $0.84MM
Company Overview
6
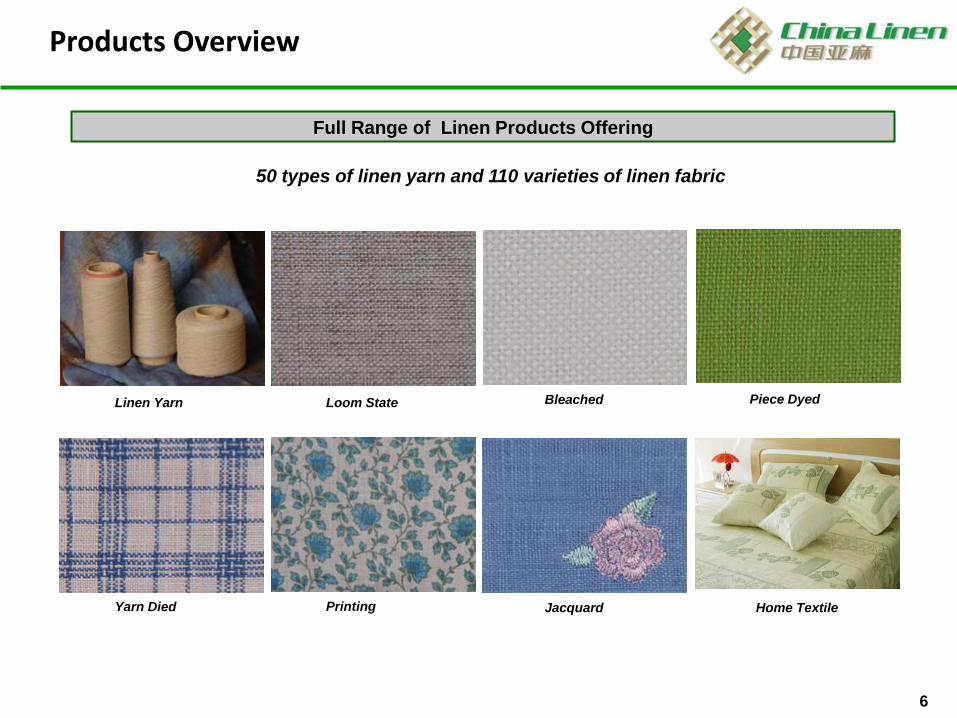
Full Range of Linen Products Offering
Products Overview
Linen Yarn Loom State Bleached Piece Dyed
Yarn Died Printing Jacquard Home Textile
50 types of linen yarn and 110 varieties of linen fabric
7
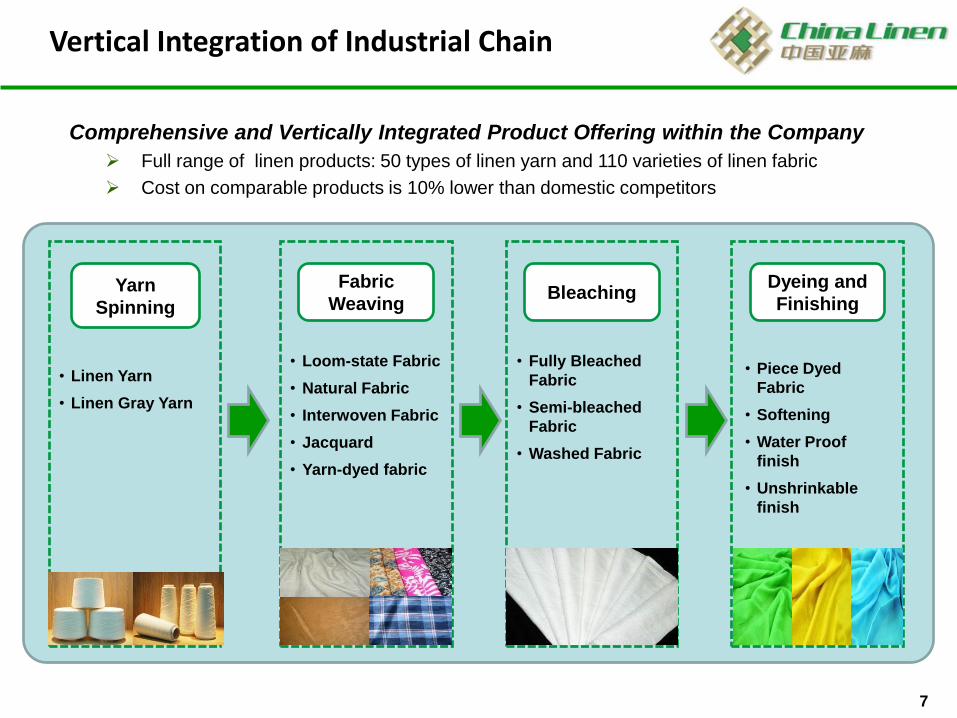
Yarn
Spinning
Fabric
Weaving Bleaching
Dyeing and
Finishing
• Loom-state Fabric
• Natural Fabric
• Interwoven Fabric
• Jacquard
• Yarn-dyed fabric
• Fully Bleached
Fabric
• Semi-bleached
Fabric
• Washed Fabric
• Piece Dyed
Fabric
• Softening
• Water Proof
finish
• Unshrinkable
finish
• Linen Yarn
• Linen Gray Yarn
Vertical Integration of Industrial Chain
Comprehensive and Vertically Integrated Product Offering within the Company
Full range of linen products: 50 types of linen yarn and 110 varieties of linen fabric
Cost on comparable products is 10% lower than domestic competitors
8
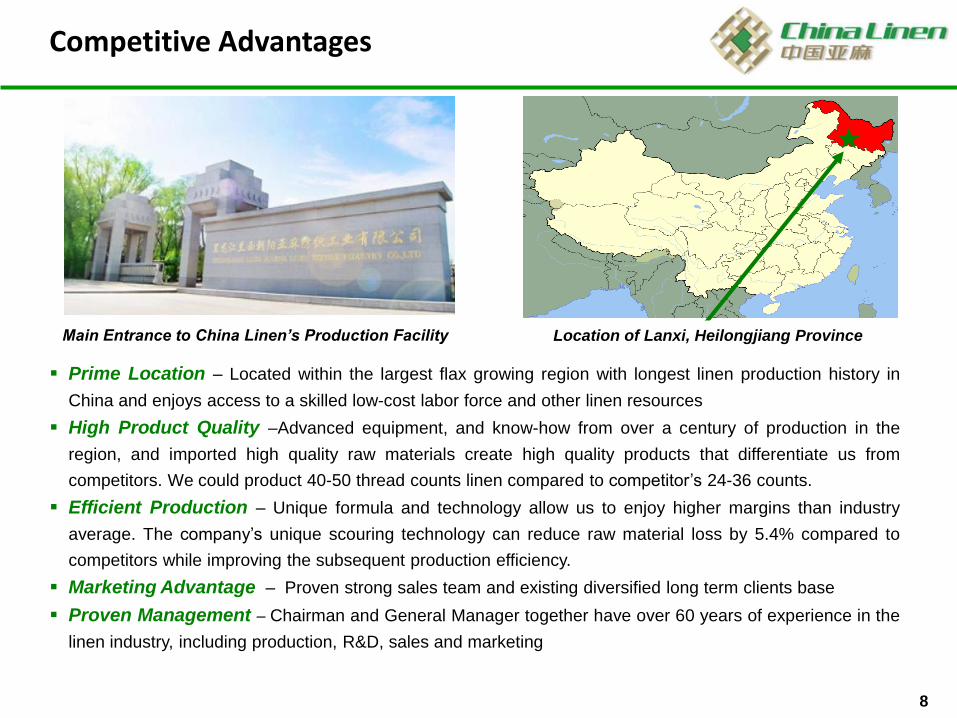
Prime Location – Located within the largest flax growing region with longest linen production history in
China and enjoys access to a skilled low-cost labor force and other linen resources
High Product Quality –Advanced equipment, and know-how from over a century of production in the
region, and imported high quality raw materials create high quality products that differentiate us from
competitors. We could product 40-50 thread counts linen compared to competitor’s 24-36 counts.
Efficient Production – Unique formula and technology allow us to enjoy higher margins than industry
average. The company’s unique scouring technology can reduce raw material loss by 5.4% compared to
competitors while improving the subsequent production efficiency.
Marketing Advantage – Proven strong sales team and existing diversified long term clients base
Proven Management – Chairman and General Manager together have over 60 years of experience in the
linen industry, including production, R&D, sales and marketing
Competitive Advantages
★
Main Entrance to China Linen’s Production Facility Location of Lanxi, Heilongjiang Province
9
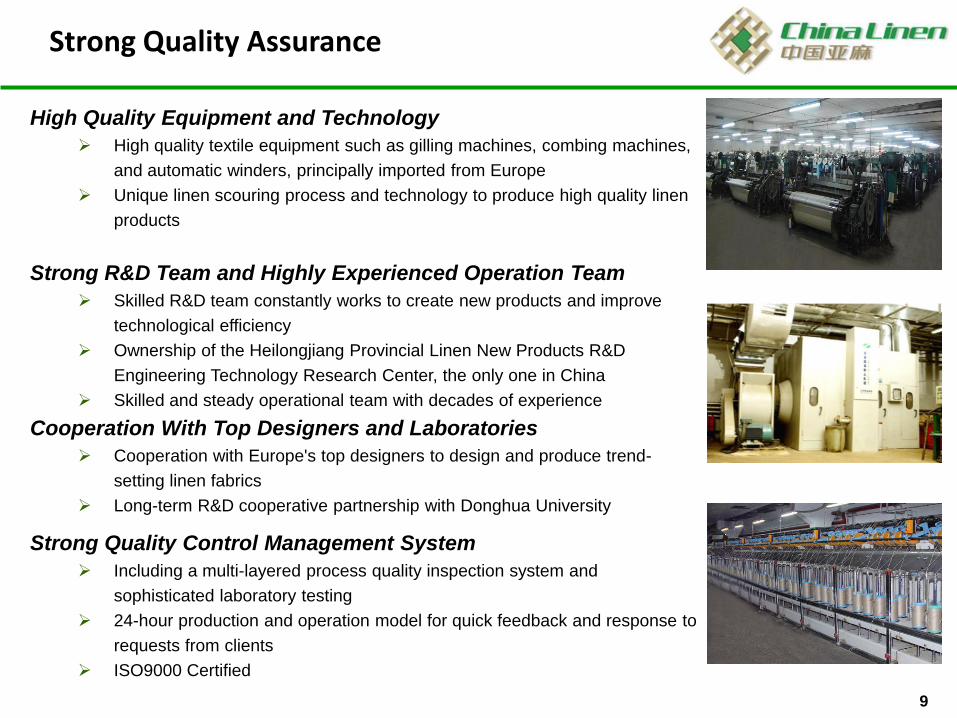
Strong Quality Assurance
High Quality Equipment and Technology
High quality textile equipment such as gilling machines, combing machines,
and automatic winders, principally imported from Europe
Unique linen scouring process and technology to produce high quality linen
products
Strong R&D Team and Highly Experienced Operation Team
Skilled R&D team constantly works to create new products and improve
technological efficiency
Ownership of the Heilongjiang Provincial Linen New Products R&D
Engineering Technology Research Center, the only one in China
Skilled and steady operational team with decades of experience
Cooperation With Top Designers and Laboratories
Cooperation with Europe's top designers to design and produce trend-
setting linen fabrics
Long-term R&D cooperative partnership with Donghua University
Strong Quality Control Management System
Including a multi-layered process quality inspection system and
sophisticated laboratory testing
24-hour production and operation model for quick feedback and response to
requests from clients
ISO9000 Certified
10
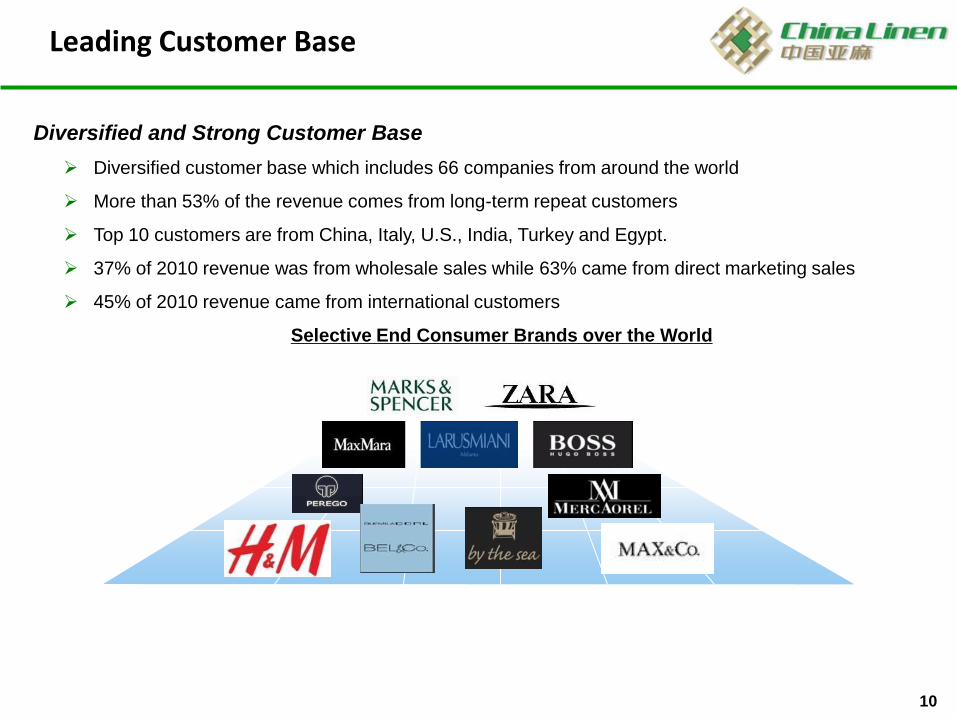
Leading Customer Base
Diversified and Strong Customer Base
Diversified customer base which includes 66 companies from around the world
More than 53% of the revenue comes from long-term repeat customers
Top 10 customers are from China, Italy, U.S., India, Turkey and Egypt.
37% of 2010 revenue was from wholesale sales while 63% came from direct marketing sales
45% of 2010 revenue came from international customers
Selective End Consumer Brands over the World
11
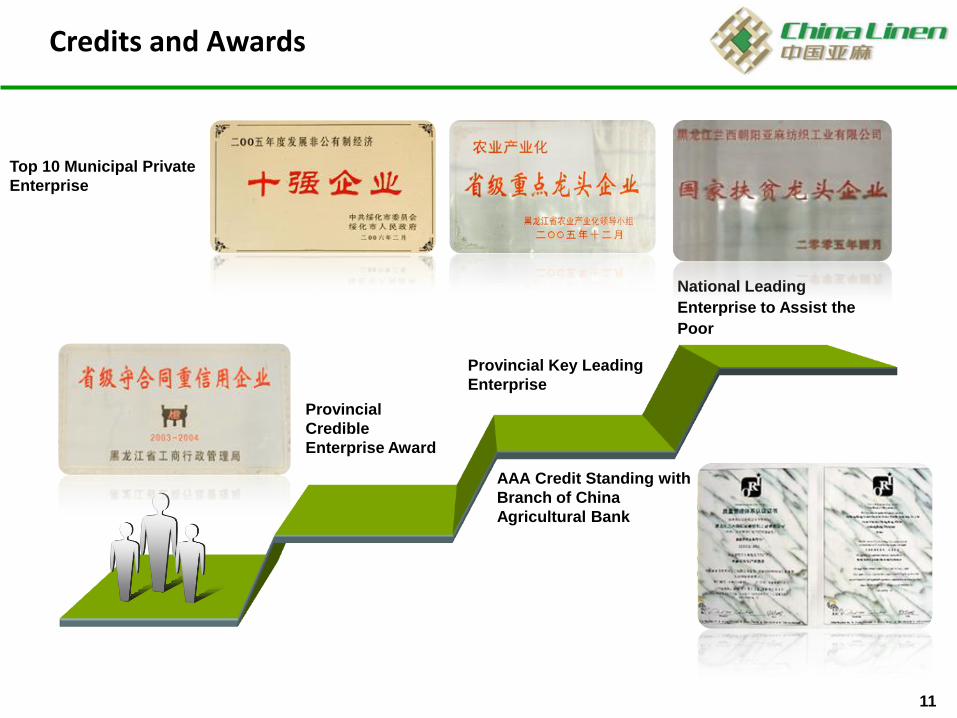
Provincial Key Leading
Enterprise
National Leading
Enterprise to Assist the
Poor
Top 10 Municipal Private
Enterprise
AAA Credit Standing with
Branch of China
Agricultural Bank
Provincial
Credible
Enterprise Award
Credits and Awards
12
Note:
(1)2008 Chinese Statistical Yearbook.
(2)Company estimate based upon compilation of industry data.
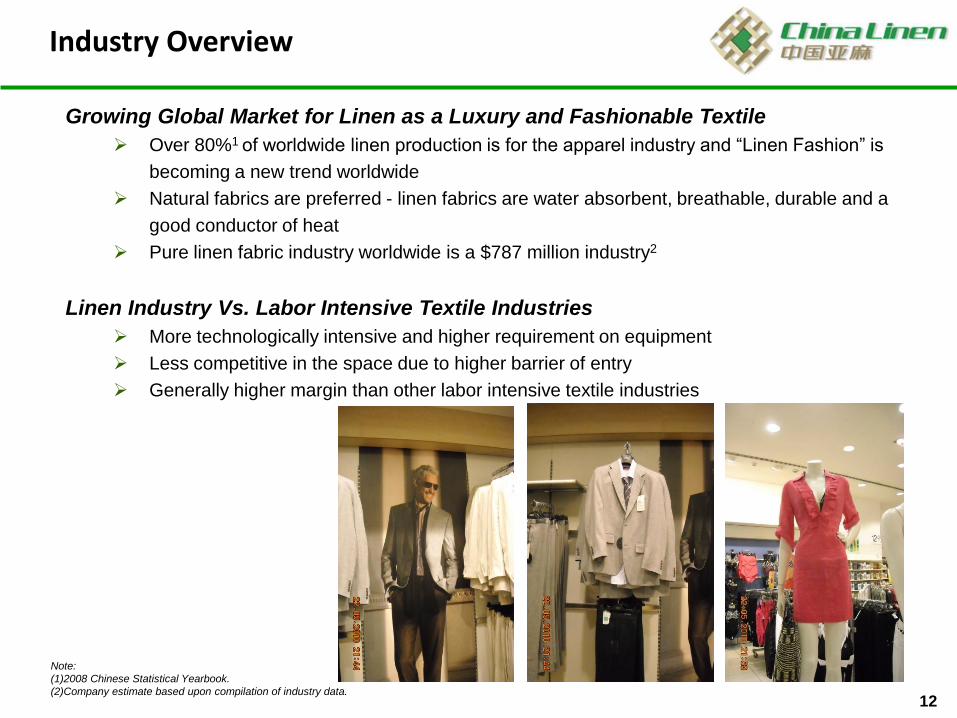
Growing Global Market for Linen as a Luxury and Fashionable Textile
Over 80%1 of worldwide linen production is for the apparel industry and “Linen Fashion” is
becoming a new trend worldwide
Natural fabrics are preferred - linen fabrics are water absorbent, breathable, durable and a
good conductor of heat
Pure linen fabric industry worldwide is a $787 million industry2
Linen Industry Vs. Labor Intensive Textile Industries
More technologically intensive and higher requirement on equipment
Less competitive in the space due to higher barrier of entry
Generally higher margin than other labor intensive textile industries
Industry Overview
13
Source: Company data and 2008 Chinese Statistical Yearbook, latest available data on linen export.
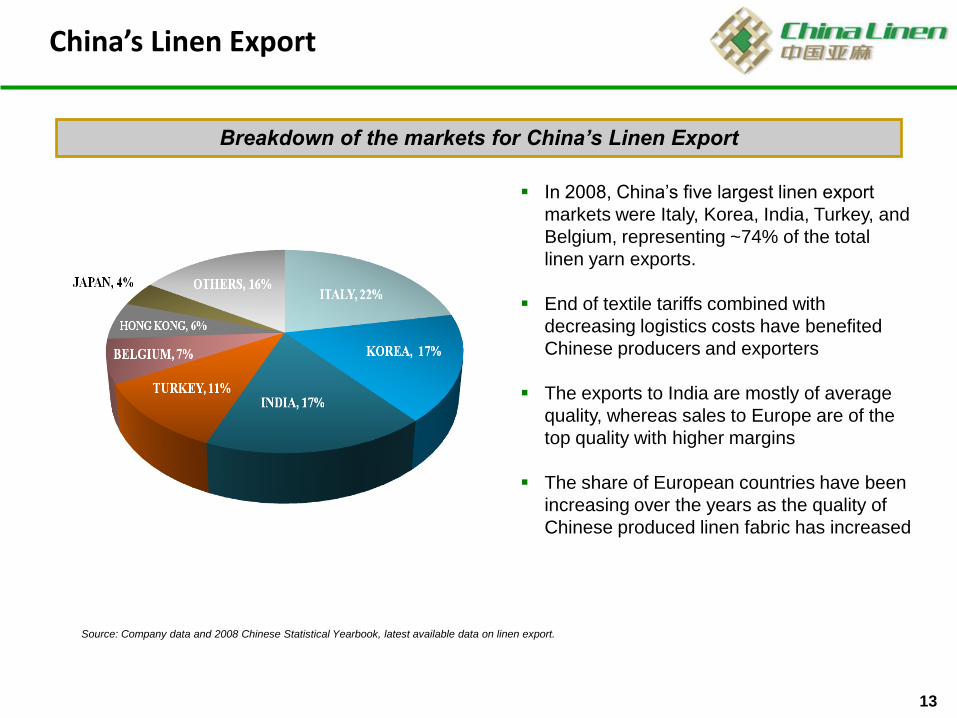
Breakdown of the markets for China’s Linen Export
In 2008, China’s five largest linen export
markets were Italy, Korea, India, Turkey, and
Belgium, representing ~74% of the total
linen yarn exports.
End of textile tariffs combined with
decreasing logistics costs have benefited
Chinese producers and exporters
The exports to India are mostly of average
quality, whereas sales to Europe are of the
top quality with higher margins
The share of European countries have been
increasing over the years as the quality of
Chinese produced linen fabric has increased
China’s Linen Export
14
Source: Company data and 2008 Chinese Statistical Yearbook and China Linen Textile Association.
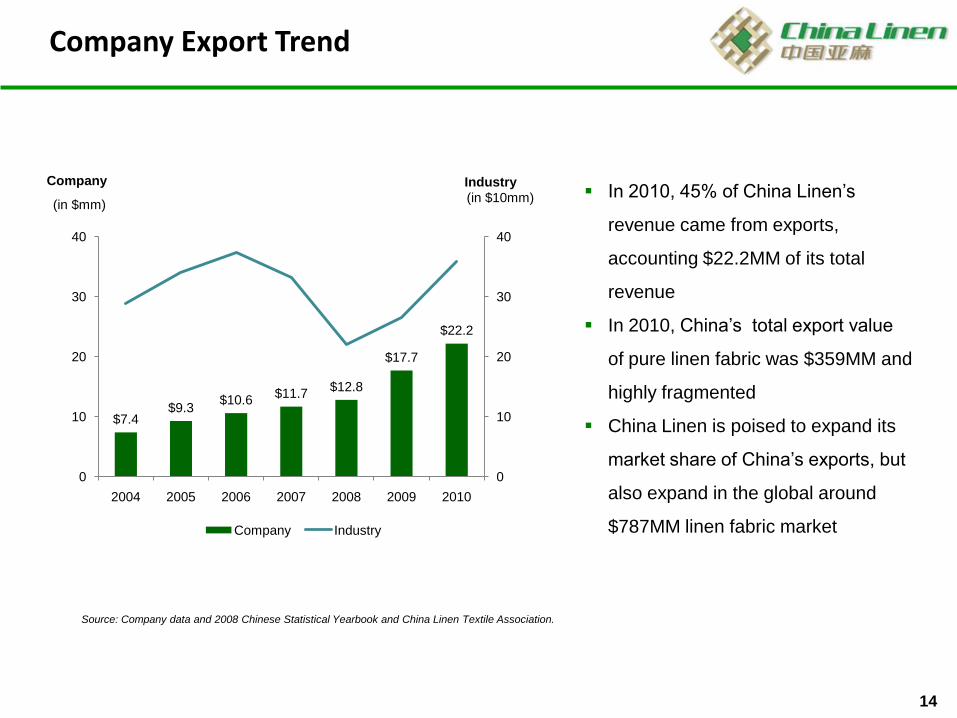
IndustryCompany In 2010, 45% of China Linen’s
revenue came from exports,
accounting $22.2MM of its total
revenue
In 2010, China’s total export value
of pure linen fabric was $359MM and
highly fragmented
China Linen is poised to expand its
market share of China’s exports, but
also expand in the global around
$787MM linen fabric market
Company Export Trend
(in $10mm)(in $mm)
$7.4$9.3
$10.6$11.7
$12.8
$17.7
$22.2
0
10
20
30
40
0
10
20
30
40
2004 2005 2006 2007 2008 2009 2010
Company Industry
15
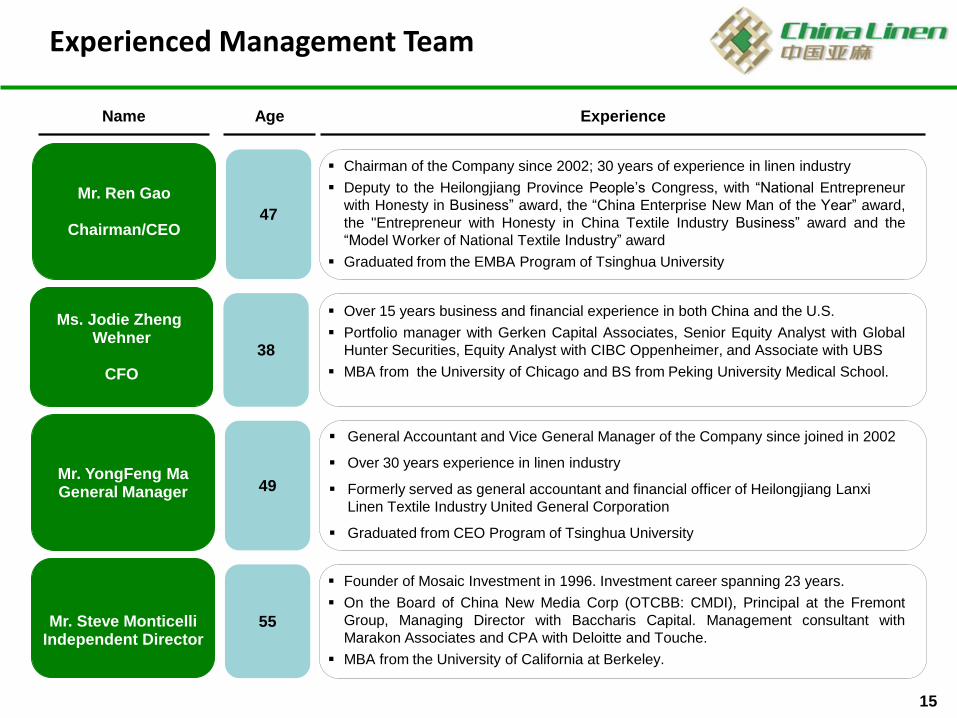
Experienced Management Team
Name
Mr. Ren Gao
Chairman/CEO47
Chairman of the Company since 2002; 30 years of experience in linen industry
Deputy to the Heilongjiang Province People’s Congress, with “National Entrepreneur
with Honesty in Business” award, the “China Enterprise New Man of the Year” award,
the "Entrepreneur with Honesty in China Textile Industry Business” award and the
“Model Worker of National Textile Industry” award
Graduated from the EMBA Program of Tsinghua University
Age Experience
Ms. Jodie Zheng Wehner
CFO
38
Over 15 years business and financial experience in both China and the U.S.
Portfolio manager with Gerken Capital Associates, Senior Equity Analyst with Global
Hunter Securities, Equity Analyst with CIBC Oppenheimer, and Associate with UBS
MBA from the University of Chicago and BS from Peking University Medical School.
Mr. YongFeng MaGeneral Manager 49
Mr. Steve MonticelliIndependent Director
55
Founder of Mosaic Investment in 1996. Investment career spanning 23 years.
On the Board of China New Media Corp (OTCBB: CMDI), Principal at the Fremont
Group, Managing Director with Baccharis Capital. Management consultant with
Marakon Associates and CPA with Deloitte and Touche.
MBA from the University of California at Berkeley.
General Accountant and Vice General Manager of the Company since joined in 2002
Over 30 years experience in linen industry
Formerly served as general accountant and financial officer of Heilongjiang Lanxi
Linen Textile Industry United General Corporation
Graduated from CEO Program of Tsinghua University
16
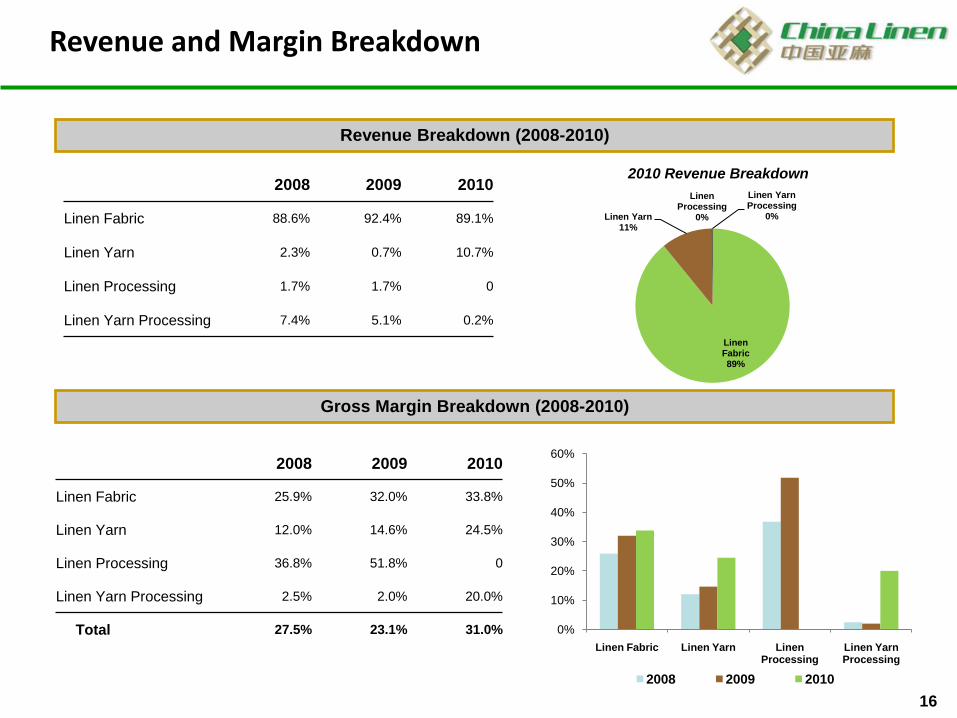
Revenue and Margin Breakdown
2008 2009 2010
Linen Fabric 88.6% 92.4% 89.1%
Linen Yarn 2.3% 0.7% 10.7%
Linen Processing 1.7% 1.7% 0
Linen Yarn Processing 7.4% 5.1% 0.2%
Revenue Breakdown (2008-2010)
Gross Margin Breakdown (2008-2010)
2008 2009 2010
Linen Fabric 25.9% 32.0% 33.8%
Linen Yarn 12.0% 14.6% 24.5%
Linen Processing 36.8% 51.8% 0
Linen Yarn Processing 2.5% 2.0% 20.0%
Total 27.5% 23.1% 31.0%
2010 Revenue Breakdown
Linen Fabric89%
Linen Yarn11%
Linen Processing
0%
Linen Yarn Processing
0%
0%
10%
20%
30%
40%
50%
60%
Linen Fabric Linen Yarn Linen Processing
Linen Yarn Processing
2008 2009 2010
17
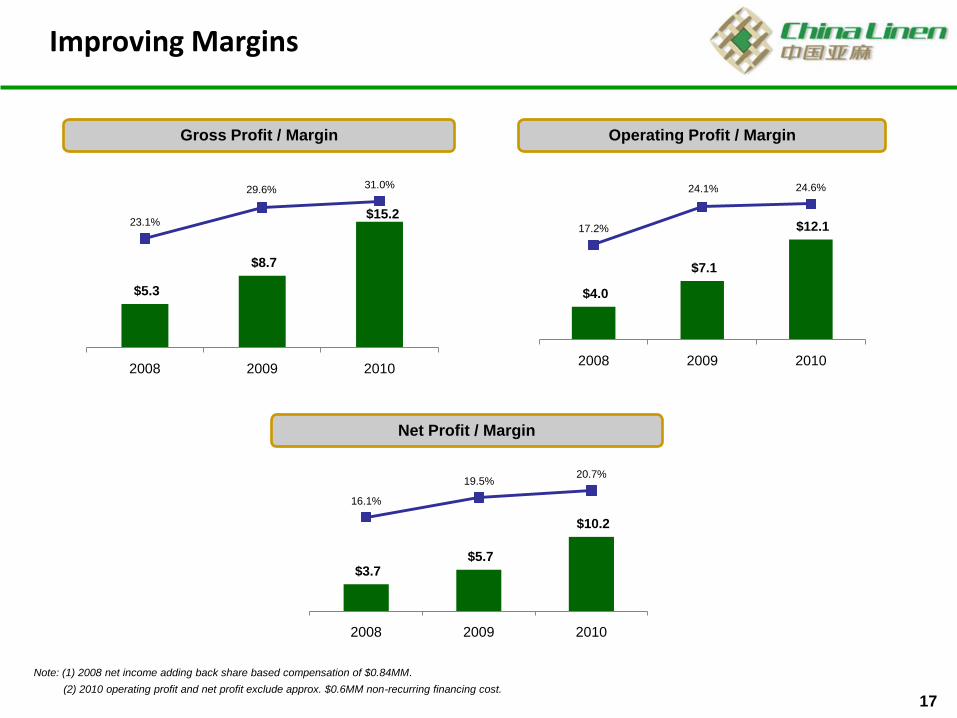
Improving Margins
Gross Profit / Margin Operating Profit / Margin
Net Profit / Margin
Note: (1) 2008 net income adding back share based compensation of $0.84MM.
(2) 2010 operating profit and net profit exclude approx. $0.6MM non-recurring financing cost.
$5.3
$8.7
$15.2 23.1%
29.6% 31.0%
2008 2009 2010
$4.0
$7.1
$12.1 17.2%
24.1% 24.6%
2008 2009 2010
$3.7 $5.7
$10.2
16.1%
19.5%20.7%
2008 2009 2010
18
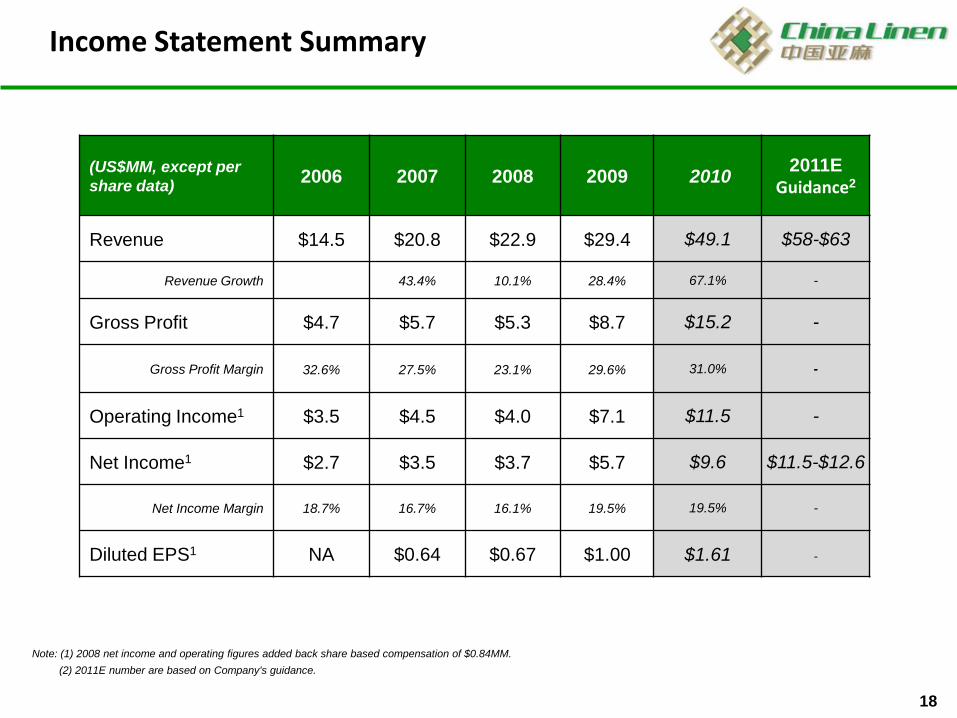
Income Statement Summary
Note: (1) 2008 net income and operating figures added back share based compensation of $0.84MM.
(2) 2011E number are based on Company's guidance.
(US$MM, except per
share data)2006 2007 2008 2009 2010
2011E Guidance2
Revenue $14.5 $20.8 $22.9 $29.4 $49.1 $58-$63
Revenue Growth 43.4% 10.1% 28.4% 67.1% -
Gross Profit $4.7 $5.7 $5.3 $8.7 $15.2 -
Gross Profit Margin 32.6% 27.5% 23.1% 29.6% 31.0% -
Operating Income1 $3.5 $4.5 $4.0 $7.1 $11.5 -
Net Income1 $2.7 $3.5 $3.7 $5.7 $9.6 $11.5-$12.6
Net Income Margin 18.7% 16.7% 16.1% 19.5% 19.5% -
Diluted EPS1 NA $0.64 $0.67 $1.00 $1.61 -
19
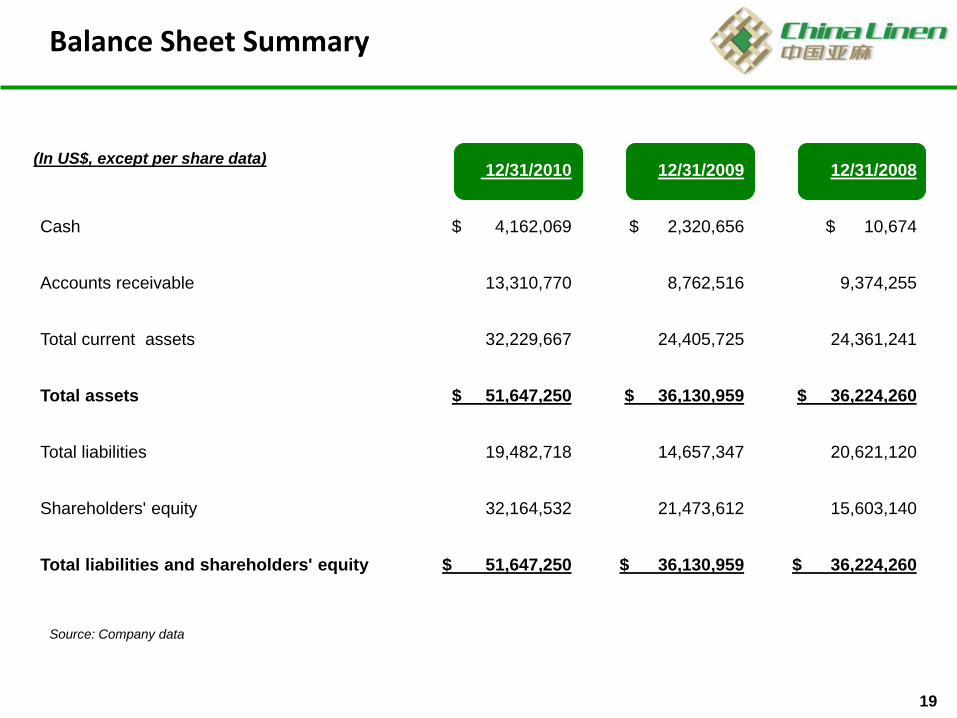
12/31/2010 12/31/2009 12/31/2008
Cash $ 4,162,069 $ 2,320,656 $ 10,674
Accounts receivable 13,310,770 8,762,516 9,374,255
Total current assets 32,229,667 24,405,725 24,361,241
Total assets $ 51,647,250 $ 36,130,959 $ 36,224,260
Total liabilities 19,482,718 14,657,347 20,621,120
Shareholders' equity 32,164,532 21,473,612 15,603,140
Total liabilities and shareholders' equity $ 51,647,250 $ 36,130,959 $ 36,224,260
Source: Company data
Balance Sheet Summary
(In US$, except per share data)
20
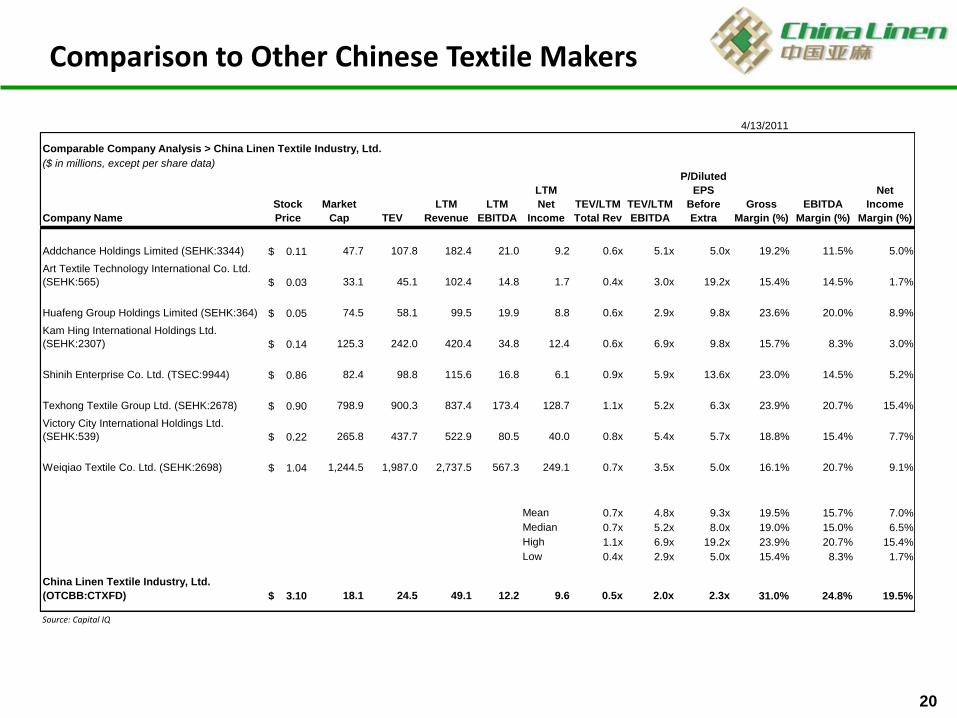
Comparison to Other Chinese Textile Makers
4/13/2011
Comparable Company Analysis > China Linen Textile Industry, Ltd.
($ in millions, except per share data)
Company Name
Stock
Price
Market
Cap TEV
LTM
Revenue
LTM
EBITDA
LTM
Net
Income
TEV/LTM
Total Rev
TEV/LTM
EBITDA
P/Diluted
EPS
Before
Extra
Gross
Margin (%)
EBITDA
Margin (%)
Net
Income
Margin (%)
Addchance Holdings Limited (SEHK:3344) 0.11$ 47.7 107.8 182.4 21.0 9.2 0.6x 5.1x 5.0x 19.2% 11.5% 5.0%
Art Textile Technology International Co. Ltd.
(SEHK:565) 0.03$ 33.1 45.1 102.4 14.8 1.7 0.4x 3.0x 19.2x 15.4% 14.5% 1.7%
Huafeng Group Holdings Limited (SEHK:364) 0.05$ 74.5 58.1 99.5 19.9 8.8 0.6x 2.9x 9.8x 23.6% 20.0% 8.9%
Kam Hing International Holdings Ltd.
(SEHK:2307) 0.14$ 125.3 242.0 420.4 34.8 12.4 0.6x 6.9x 9.8x 15.7% 8.3% 3.0%
Shinih Enterprise Co. Ltd. (TSEC:9944) 0.86$ 82.4 98.8 115.6 16.8 6.1 0.9x 5.9x 13.6x 23.0% 14.5% 5.2%
Texhong Textile Group Ltd. (SEHK:2678) 0.90$ 798.9 900.3 837.4 173.4 128.7 1.1x 5.2x 6.3x 23.9% 20.7% 15.4%
Victory City International Holdings Ltd.
(SEHK:539) 0.22$ 265.8 437.7 522.9 80.5 40.0 0.8x 5.4x 5.7x 18.8% 15.4% 7.7%
Weiqiao Textile Co. Ltd. (SEHK:2698) 1.04$ 1,244.5 1,987.0 2,737.5 567.3 249.1 0.7x 3.5x 5.0x 16.1% 20.7% 9.1%
Mean 0.7x 4.8x 9.3x 19.5% 15.7% 7.0%
Median 0.7x 5.2x 8.0x 19.0% 15.0% 6.5%
High 1.1x 6.9x 19.2x 23.9% 20.7% 15.4%
Low 0.4x 2.9x 5.0x 15.4% 8.3% 1.7%
China Linen Textile Industry, Ltd.
(OTCBB:CTXFD) 3.10$ 18.1 24.5 49.1 12.2 9.6 0.5x 2.0x 2.3x 31.0% 24.8% 19.5%
Source: Capital IQ
21
Investment Summary
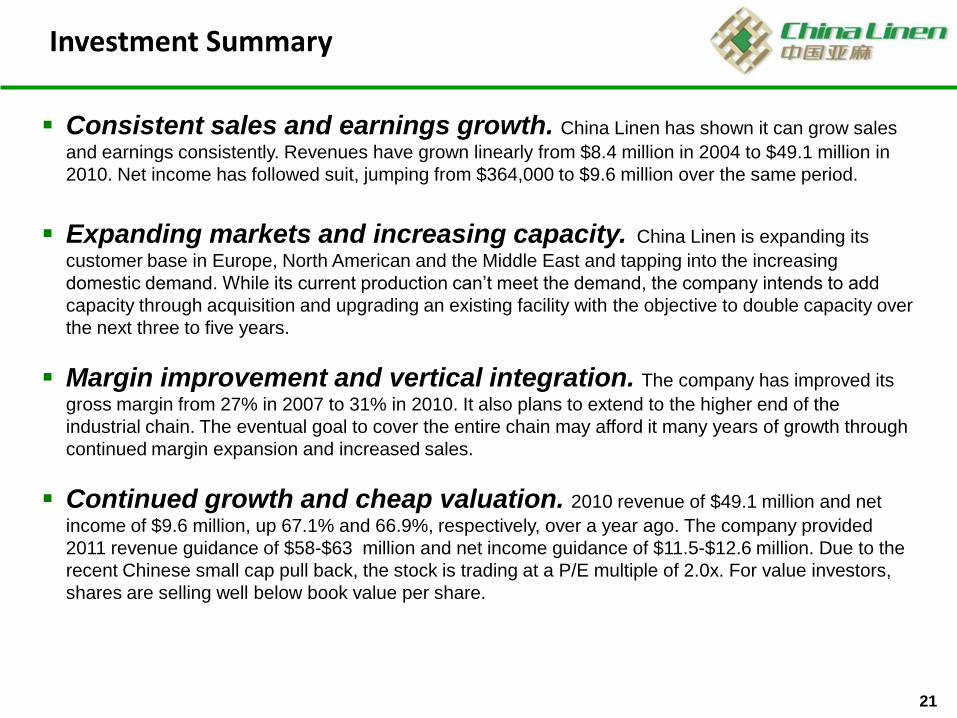
Consistent sales and earnings growth. China Linen has shown it can grow sales
and earnings consistently. Revenues have grown linearly from $8.4 million in 2004 to $49.1 million in
2010. Net income has followed suit, jumping from $364,000 to $9.6 million over the same period.
Expanding markets and increasing capacity. China Linen is expanding its
customer base in Europe, North American and the Middle East and tapping into the increasing
domestic demand. While its current production can’t meet the demand, the company intends to add
capacity through acquisition and upgrading an existing facility with the objective to double capacity over
the next three to five years.
Margin improvement and vertical integration. The company has improved its
gross margin from 27% in 2007 to 31% in 2010. It also plans to extend to the higher end of the
industrial chain. The eventual goal to cover the entire chain may afford it many years of growth through
continued margin expansion and increased sales.
Continued growth and cheap valuation. 2010 revenue of $49.1 million and net
income of $9.6 million, up 67.1% and 66.9%, respectively, over a year ago. The company provided
2011 revenue guidance of $58-$63 million and net income guidance of $11.5-$12.6 million. Due to the
recent Chinese small cap pull back, the stock is trading at a P/E multiple of 2.0x. For value investors,
shares are selling well below book value per share.
22
Company:
Jodie Zheng Wehner
China Linen Textile Industry, LTD.
Phone: +1 310 890 8048
Email: [email protected]
Investor Relations:
Scott Powell
HC International
Phone: +1 917 721 9480
Email: [email protected]
Contact Information
23
Appendix
24
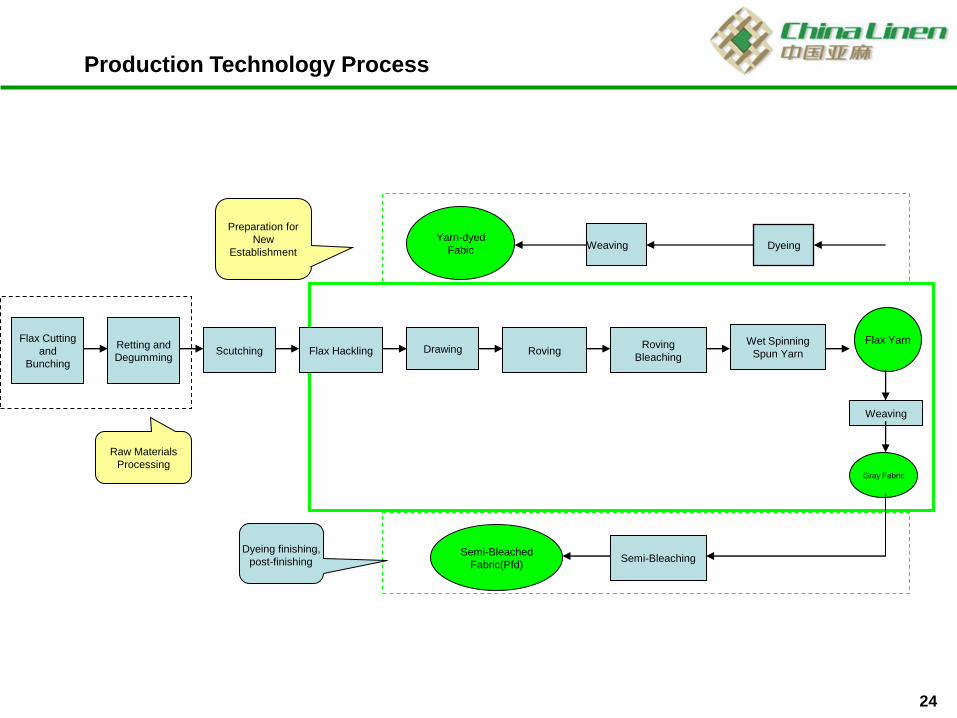
Flax Cutting
and
Bunching
Retting and
Degumming
Wet Spinning
Spun Yarn
Flax Yarn
Gray Fabric
Weaving
Semi-Bleached
Fabric(Pfd)
DyeingWeavingYarn-dyed
Fabic
Raw Materials
Processing
Dyeing finishing,
post-finishing
Preparation for
New
Establishment
Roving
BleachingRoving DrawingFlax HacklingScutching
Semi-Bleaching
Production Technology Process


