Characterization of Restart Pressure in Production
Pipeline for Waxy Crude Oil as A Result of Injection of
Non-Reacting Gas
by
Blythe Kollias Anak Biga
Dissertation submitted in partial fulfilment of
the requirements for the
Bachelor of Engineering (Hons)
Mechanical Engineering
JANUARY 2016
Universiti Teknologi PETRONAS
Bandar Seri Iskandar
31750 Tronoh
Perak Darul Ridzuan

i
CERTIFICATION OF APPROVAL
Characterization of Restart Pressure in Production Pipeline for Waxy Crude
Oil as A Result of Injection of Non-Reacting Gas
by
Blythe Kollias Anak Biga
16362
A project dissertation submitted to the
Mechanical Engineering Programme
Universiti Teknologi PETRONAS
in partial fulfilment of the requirement for the
BACHELOR OF ENGINEERING (Hons)
(MECHANICAL)
Approved by,
_____________________
(Ir Dr Shaharin Anwar bin Sulaiman)
UNIVERSITI TEKNOLOGI PETRONAS
TRONOH, PERAK
January 2016

ii
CERTIFICATION OF ORIGINALITY
This is to certify that I am responsible for the work submitted in this project, that the original work
is my own except as specified in the references and acknowledgements, and that the original work
contained herein have not undertaken or done by unspecified sources or persons.
BLYTHE KOLLIAS ANAK BIGA

iii
ABSTRACT
Wax deposition within the walls of production pipeline of crude oil causes flow assurance issue
due to reduction in flow rate. In the event of planned maintenance or an emergency shutdown due
to bad weather condition, the crude oil will stop flowing in the pipeline, in which the temperature
of the crude oil may drop below the Pour Point Temperature (PPT). As the crude oil is under a
quiescent condition, wax crude oil may precipitate out of its liquid phase and becomes a wax-gel
oil like substance, which may cause blockage in the pipeline. A high pumping pressure is needed
in order to restart the pipeline and disintegrate the wax-oil gel. A recent study on gas voids in cured
oil showed that the presence of gas voids within the pipeline could reduce the restart pressure
needed to restart a crude oil production pipeline. It was anticipated that the volume of the gas voids
could be increased through the injection of non-reacting gas in order to reduce the restart pressure
needed. However, there was no previous attempt to study if the proposal would be practical in
practice. The present study is aimed at studying the effects and effectiveness of gas bubbles
intrusion through injection of external gas with respect to the restart pressure. A waxy crude oil
flow loop was used in order to simulate the condition of a gelled waxy crude oil within the crude
oil production line. A nitrogen gas injection system was attached to the test rig in order to inject
the gas into the test section. The test section was injected with nitrogen gas just after the flow is
stopped and is under static cooling at water bath temperatures of 15ºC, 20ºC and 25ºC. Once the
crude oil temperature has dropped to the water bath’s temperature, the pipeline is restarted with
the aid of a 1.1 kW gear pump so as to disintegrate the wax within the pipeline. There were 2 ways
in which the restart pressure is applied, namely the instantaneous restart and gradual restart
approach. It was observed that the restart pressure under instantaneous and gradual start up
approach decreases as compared to a restart pressure of a non-injected pipeline. A maximum restart
pressure reduction of 11.48% and 17.44% was observed when the pressure is applied under
instantaneous restart and gradual restart pressure approach. Through this study, it is shown that
injection of nitrogen gas into the pipeline is able to reduce the restart pressure needed and thus
allowing pipeline operators to reduce their capital and operational expenditure on acquiring
additional pumps during pipeline restart operation.

iv
ACKNOWLEDGEMENT
First and foremost, I would like to express my sincere gratitude to my supervisor, Ir Dr
Shaharin Anwar Sulaiman for his endless guidance and support throughout the Final Year Project
(FYP) course which ran for two consecutive semesters. Under his guidance, I am able to complete
my FYP within the time frame given which is seven months and conduct the experiment in a
conducive manner.
I would like to thank Mr Girma Tadese Chala, Universiti Teknologi PETRONAS’s (UTP)
postgraduate student who guided me in operating the waxy crude oil flow loop which is located in
Mechanical Engineering Department lab. With his guidance and technical knowledge, the
experiment conducted was done in a very efficient and safe manner.
I would like to thank UTP for providing this course to final year students as it teaches students on
how to apply their theoretical engineering knowledge into practice. As a final year student, it is
imperative to apply all the knowledge that has been collected throughout five years of engineering
study in UTP. Throughout this FYP course, I have equipped myself with both technical and soft
skills through experimental works as well as presentations in which it is very much sought after in
the industry.
I would like to take this opportunity to thank the Lab, Facilities and Services Department of UTP
for consulting and guiding me throughout the FYP course. With their consultation, I managed to
complete the gas injection system which is required in this study.
I also would like to take this opportunity to acknowledge and thank everyone who has been
supporting me and giving guidance throughout the period of completion for this project. On top of
that, I would like to thank Dr Turnad Linggo Ginta and Dr Tamiru Alemu Lemma, coordinators
for Final Year Project 1 and Final Year Project 2 respectively for their efforts in ensuring any
arrangements made related to the course is within the scheduled time.
Finally, my sincerest gratitude to my fellow colleague for their help and support throughout the
course of this project
v
TABLE OF CONTENT
CERTIFICATION OF APPROVAL . . . . . . i
CERTIFICATION OF ORIGINALITY . . . . . . ii
ABSTRACT . . . . . . . . . . iii
ACKNOWLEDGEMENT . . . . . . . . iv
TABLE OF CONTENT . . . . . . . . v
LIST OF FIGURES . . . . . . . . vii
LIST OF TABLES . . . . . . . . . viii
CHAPTER 1: INTRODUCTION . . . . . . 1
1.1 Background . . . . . . 1
1.2 Problem Statement . . . . . 4
1.3 Objective and Scope of Study . . . . 5
CHAPTER 2: THEORY AND LITERATURE REVIEW . . 6
2.1 Characteristic of Waxy Crude Oil . . . 6
2.2 Wax Appearance Temperature (WAT) and Pour Point
Temperature (PPT) . . . . . 7
2.3 Restart Pressure of Pipeline . . . . 9
2.4 Yield Stress of Wax . . . . . 9
2.5 Effects of Cooling Rate on Crude Oil . . . 11
2.6 Effect of Pipe Diameter . . . . . 15
2.7 Thermal Shrinkage . . . . . 15
2.8 Intrusion of Gas into Waxy Crude Oil Pipeline . . 17
2.9 Usage of Nitrogen Gas in Oil and Gas Industry . . 19
CHAPTER 3: METHODOLOGY . . . . . . 20
3.1 Research Overview . . . . . 20
3.2 Gantt Chart / Project Planning . . . . 22

vi
3.3 Test Rig Set Up . . . . . . 24
3.4 Mechanism for Intrusion of Nitrogen . . . 26
3.5 Crude Oil Properties . . . . . 28
CHAPTER 4: RESULTS AND DISCUSSIONS . . . . 30
4.1 Restart Pressure of Pipeline . . . . 30
4.1.1 Instantaneous Restart Pressure . . . 31
4.1.2 Gradual Restart Pressure . . . 33
4.2 Effect of Gas to Oil Ratio (GOR) on Restart Pressure . 35
CHAPTER 5: CONCLUSIONS AND RECOMMENDATIONS . . 40
5.1 Conclusions . . . . . . 40
5.2 Recommendations . . . . . 41
REFERENCES . . . . . . . . . 43
APPENDIX . . . . . . . . . . 46
APPENDIX 1: Detailed Component Specifications of Waxy Crude Oil Flow Loop 47
APPENDIX 2: List of Components for Nitrogen Gas Injection System . . 49
APPENDIX 3: List of Calculations . . . . . . . 50

vii
LIST OF FIGURES
Figure 1.1 Cross-sectional view of paraffin deposits in pipeline 2
Figure 1.2 Puteri Field, Offshore Terengganu, Peninsular Malaysia 4
Figure 2.1 Yielding process of a waxy crude oil 11
Figure 2.2 Size and number of wax crystals formed under low and high cooling rate 12
Figure 2.3 Gel failure stress vs cooling rate 13
Figure 2.4 Cross-polarized microscope photo of wax-oil gel for
(a) Cooling rate of 3.5ºC/hr and (b) Cooling rate of 20ºC/hr. 14
Figure 2.5 Gas voids formation on waxy crude oil 16
Figure 2.6 Effect of cooling rates on gas void distribution near the
pipe wall 17
Figure 2.7 Effect of cooling rates on gas voids distribution around the center
of the pipe 17
Figure 2.8 (a) Restart pressure of waxy crude oil at different water temperature using
gradual pressure approach 18
Figure 2.9 (b) Restart pressure of waxy crude oil at different water temperature using
instantaneous pressure approach 19
Figure 3.1 Flow chart of research methodology 21
Figure 3.2 Gantt Chart for FYP 1 and FYP 2 23
Figure 3.3: Major components of way crude oil flow loop 24
Figure 3.4 Schematic of the waxy crude oil flow loop 26
Figure 3.7 Formation of gas voids into the test section 28
Figure 3.5 Schematic drawing of gas injection system 27
Figure 3.6 Completed nitrogen gas injection system set up 27
Figure 4.1 Formation of gas voids into the test section 30

viii
Figure 4.2 Pressure difference between a gas injected pipeline and non-injected
pipeline subjected to instantaneous restart pressure approach 33
Figure 4.3 Instantaneous restart pressure profile with the injection of nitrogen gas 34
Figure 4.4 Instantaneous restart pressure profile without nitrogen gas injection 35
Figure 4.5 Restart pressure difference between gas injected pipeline and non-injected
pipeline subjected to gradual restart pressure approach 35
Figure 4.6 Gradual restart pressure profile with the injection of nitrogen gas 36
Figure 4.7 Gradual restart pressure profile without the injection of nitrogen gas 37
Figure 4.8 Restart pressure against gas to crude oil volume ratio using instantaneous
restart pressure approach 37
Figure 4.9 Instantaneous restart pressure profile with varying volume of injected
nitrogen gas 38
Figure 4.10 Restart pressure recorded with varying gas to oil volume ratio using the
gradual restart approach 39
Figure 4.11 Gradual restart pressure profile with varying volume of injected
nitrogen gas 39
LIST OF TABLES
Table 2.1 Terminology and its definitions 8
Table 2.2 Waxy crude oil temperature regions and its condition 9
Table 2.3 Physical and Chemical Properties of Nitrogen 19
Table 3.2 Properties of Sepat-7 crude oil 28
Table 4.1 Restart pressure and restart time comparison using instantaneous
pressure 31
Table 4.2 Pressure difference between an injected pipeline and non-injected
pipeline 33

ix
Table 4.3 Restart pressure and restart time comparison using gradual restart
pressure 34
Table 4.4 Pressure difference between gas injected and non-injected pipeline 35
Table 4.5 Summary of restart pressure with varying gas to oil volume ratio using
instantaneous restart pressure approach 37
Table 4.6 Summary of restart pressure with varying gas to oil ratio using gradual
restart pressure approach 38

1
CHAPTER 1
INTRODUCTION
This chapter discusses about the background on the flow assurance issues due to presence
of paraffin (wax) in waxy crude oil. This in turn will affect the pressure needed in order to
restart the crude oil flow as the required pressure will be higher as compared to its operating
pressure. The problem statement, objective and the scope of study are further discussed in
detail within this chapter.
1.1 Background
Crude oil is currently the primary source of energy throughout the world. The global
demand for this resource provides a challenge as we need to source for heavier, waxy crude
oils and this leads to deeper water depth exploration within the oil producing region. Within
the last decade, the exploration within the new oilfields has resulted a production of high
quantities of waxy crude oil, in which it accounts for 20% of world petroleum reserves. It
has been forecasted that the oil production from the deep sea water in 2017 will be three
times greater at 8 million barrels a day as compared to the deep sea water production in
2002 (Venkatesan et al., 2002). Waxy crude oil is defined as a crude oil having a high pour
point temperature (PPT) and low American Petroleum Institute (API) gravity and would
contain paraffin wax (alkanes) (Bomba, 1986).
The current problem with waxy crude oil towards production is flow assurance
issues due to paraffin (wax) deposition during the production and processing stage
(Hamami et al., 1999). Paraffin wax deposition has cost billions of dollars to the oil and
gas production industry as it reduces the production rate, increases the cost of chemical to
mitigate pipeline blockage, choking of the flow line, equipment failure and an increase in
horse power requirement. Due to this problem, based on the United States Department of
Energy, the cost of remediation for pipeline blockage in water depths of around 400 meter
can easily reach US $1 million/mile (Venkatesan et al., 2005).

2
According to Venkatesen (2005), under operating condition at reservoir
temperature around 70ºC - 150ºC and pressures in the range of 8000-15000 psi, the wax
molecules are soluble in crude oil and exhibits properties of Newtonian liquid. As the crude
oil is transported within the pipeline, the crude oil temperature decreases, causing the
temperature of it to drop below the Wax Appearance Temperature (WAT). WAT is a
temperature region in which visible crystallization is observed. This is due to heat loss of
crude oil to the surrounding, causing wax deposition along the pipeline. If the flow of the
crude oil is stopped due to emergency situation such as during a bad weather or during a
planned maintenance, the quiescent condition in the pipeline will cause the temperature
and the solubility of the wax to decrease even further and the wax molecules will precipitate
out of its liquid phase. If the crude oil is left trapped in the pipeline (depending on the rate
of cooling), the temperature of the crude oil will drop below the Pour Point Temperature
(PPT) and will become wax-oil gel due to the interlocking of solid wax crystals. At this
conditions, the wax-oil gel will cause blockages within the pipeline (Lee et al., 2007).
Figure 1.1 shows cross-sectional view of a cut-away segment of a pipeline due to
paraffin deposits along the pipe wall. The internal bore is significantly reduced and thus
reducing the effective crude oil flow rate. The deposition of wax is largely dependent on
flow rate of the crude oil, the temperature differential between the crude oil and the pipe
surface, the cooling rate between the crude oil and the pipe surface and the pipeline surface
properties (Misra, 1995).
Figure 1.1: Cross-sectional view of paraffin deposits in pipeline (Venkatesan et al., 2005)
Wax Gel
Deposit Pipeline
Internal Bore

3
As a result of the blockage, the current operating pressure is not sufficient in order
to displace the gelled oil. The pressure which must be applied needs to be more than the
operating pressure in order to overcome the yield stress of the gelled oil and this will require
the procurement pump with higher pumping capacity in order to restart the pipeline. A
business will need to spend more on their capital expenditure (CAPEX) and operational
expenditure (OPEX) in order to install additional pump in order to restart the pipeline.
In order to predict a restart pressure of a clogged pipeline, this conventional
pressure difference is obtained through (Lee et al., 2007):
∆𝑃 =4𝜏𝑦𝐿
𝐷 (1.1)
where ∆𝑝, L, D and 𝜏𝑦 are pressure difference applied to break the gel, length of the
pipeline, internal diameter of the pipeline and yield stress of the gel respectively. The yield
stress of the gel must be determined first before the pressure difference can be calculated.
Major heavy oil producing countries such as Venezuela, Mexico, Canada, Oman
and California has flow assurance related issues such as wax deposition within its pipelines
and flowlines (Mehta et al., 2004). According to Venkatesan et al (2005), Lasmo Oil
Company (UK) had to abandon an off-shore oil platform due to wax plugging issue that
keeps recurring and had cost them over 100 million dollars to remediate. The oil and gas
fields in Malaysia suffers from the same problem as well, having wax deposition within its
pipelines. The Puteri Field, located in Block PM 318 in Offshore Terengganu Peninsular
Malaysia had wax deposition issues in which it stopped the oil production all together
(Ragbir, 2014). The Puteri crude oil has a high cloud point of 69ºC and pour point
temperature of 49ºC and provides flow assurance issues during operation. Due to a
prolonged shutdown combined with the average water temperature of 24 degrees Celcius,
it has caused a large wax plug in the Puteri Full Well Stream (FWS) pipeline, making the
pipeline unserviceable. Figure 1.2 shows the Puteri Field which is located offshore of
Terengganu, Peninsular Malaysia. The problems faced in Malaysia is not comparable to
the other parts of the world as the composition of the crude oil, the operating water depth,
seabed temperature and WAT and PPT of crude oil is different since it is dependent on
geographical location.

4
Figure 1.2: Puteri Field, Offshore Terengganu, Peninsular Malaysia (NFX, 2012)
1.2 Problem Statement
The presence of local gas voids that happens during thermal shrinkage due to
decrease in the volume of waxy-crude gel during cooling was observed by previous
researchers and it is believed to ease in restarting the pipeline. Previous studies on thermal
shrinkage with relation to gas voids have concluded that gas voids along the waxy-oil gel
structure is able to ease in restart pressure. Vinay et al (2007) observed that gas voids within
the range of 4%-8% of the total length of the pipe were not unusual under shutdown
conditions. The volume of the gas voids within the gel structure can be
increased/manipulated through the injection of non-reacting gas into the pipeline.
However, it is uncertain on how effective is the gas void in reducing the restart pressure.
On top of that, the effectiveness of gas voids volume within the waxy-oil gelled structure
in easing the restart pressure through the injection of external gas still remains unclear. Not
only that, the ability of the gas to penetrate into the crude oil during flow and when the
flow is completely stop flowing remains unclear as well. It was noted that air was used in
the previous study conducted by Zakaria (2014). Since air might not be feasible for this
study due to its combustion supportive nature, nitrogen gas which is a gas with inert/non-
combustible properties will be used. Additional study using nitrogen gas may be required
in order to understand its usage in restart pressure. An isolated test may need to be
conducted in order to understand the effect of air on crude oil as opposed to nitrogen.
Therefore, there is a need to study the restart pressure with relation to the volume of the
artificial gas voids.
Puteri Field

5
1.3 Objective and Scope of Study
The objective of this work is to study the effects of gas bubbles intrusion through
injection of external gas in restart pumping. Through the injection of gas bubbles into the
pipeline, it is anticipated that the restart pressure will be reduced as this affects the
compressibility of the gelled crude within the pipeline as the gelled crude have more space
to move when a pressure is applied. With the reduction in restart pressure, a business is
able to reduce their OPEX and CAPEX as they might not have to spend more on additional
pumps.
The scope of the study is the experimental works of intrusion of gas bubbles at the
inlet of the test section of the test rig, under which the gas injection will be done after the
pipeline has stop flowing and before the crude oil gelation occurs. The crude oil used under
this study is taken from Sepat Field, Offshore Terengganu, Peninsular Malaysia. This crude
oil is kept constant throughout the study as crude oil is known to have different wax
appearance temperature, pour point temperature, density and viscosity parameters
depending on its location. Under this study, the experiment is conducted on a waxy crude
oil flow loop which is located in Universiti Teknologi PETRONAS (UTP).

6
CHAPTER 2
THEORY AND LITERATURE REVIEW
This chapter discusses in detail regarding previous works done by other researchers related
to waxy crude oil and the restart pressure. Parameters which contributes to the ease in
restart pressure is identified and discussed as well. The fundamentals and terminologies
used are described in a more detailed manner as to give an overview to the readers about
the current work.
2.1 Characteristics of Waxy Crude Oil
Waxy or highly paraffinic crude oil can cause severe damage to subsea pipelines,
due the capability of the wax-oil gel to deposit within the pipeline. Waxes are mixtures
which contains long chain hydrocarbons (n-paraffins) with carbon chain lengths with a
range of C15 to C75+ (Hunt, 1996). Paraffin, the organic compound within the crude oil
are classified possibly being in the deposit as (1) aliphatic hydrocarbons (both straight and
branched chains), (2) aromatic hydrocarbons, (3) napthenes and (4) resins and asphaltenes
(Shock et al., 1955). The gelled oil exhibits a complex time-dependent rheology with a
yield stress and viscosity in which it depends on the time duration of shearing. It was noted
that paraffin compounds which contains more than 20 carbon atoms are a potential threat
to most of the oilfield operators. According to Hamami (1999), these waxes are crystalline
in nature and will usually precipitate or crystallize out from the crude oil at temperature
below its cloud point or “Wax Appearance Temperature (WAT)” point. Furthermore,
according to Venkatesan et.al (2005), the deposition of paraffin takes place due to its
solubility which is highly affected by temperature. He added that under reservoir
temperatures at a range of 70-150ºC and with the pressure range of 8000-15000 psi,
paraffin is soluble and behaves as a non-Newtonian fluid. As temperature of the crude oil
decreases, the solubility of paraffin in the crude oil decreases drastically, in which it allows
them to precipitate out and crystalize onto the pipeline wall. Waxy crude oils are considered
to be thixotropic materials, apart than being a shear dependent, in which the rheological
7
properties such as the viscosity and the yield stress depends on the thermal and mechanical
history (Livescu, 2012 ; Tiwary et al., 2004). It was noted by Cazaux et al., (1998) that the
key parameters in order to define the structure of the wax-oil gel structure would be through
the shape of the crystal and the density of the wax crystals. Both size and shape of the wax
crystal that is present in crude oil depends on the shear rate and the asphaltene fraction.
Both of these parameters depends on the surrounding pipeline temperature as well as the
cooling rate of the crude oil.
2.2 Wax Appearance Temperature (WAT) and Pour Point Temperature (PPT)
The temperature of the crude oil decreases as it moves along the pipeline due heat
loss to the seabed in which it has a temperature range of 2ºC - 25ºC. Wax will start to
precipitate out from the crude oil when the crude oil temperature reaches below the ‘cloud
point’ or the “Wax Appearance Temperature (WAT)” point (Venkatesan et al., 2005).
WAT is the temperature region in which visible crystallization occurs. As the temperature
of the crude reaches WAT, the energy of the molecular motion becomes hindered and
moves closer together to form a cluster of adjacently aligned chains. At temperature below
the WAT, the crude oil will exhibit non-Newtonian fluid properties. The quality of the wax
as well as the structure of the wax crystals being deposited along the walls of the pipeline
will influence the crude oil flow. The process of nucleation begins when these paraffin
molecules continues to attach to one another and reaches its critical size. Clusters of this
molecule is called nuclei (Hamami, 1999). Thermodynamic WAT and experimentally-
measured WAT were defined differently, according to Karan et al., (2000). There are
currently different methods in which the WAT and cloud point temperature can be
measured. Due to this, the true definition of WAT largely depends on the measurement
principles of the equipment and the techniques as well as the procedures used during
measurement. A thermodynamic WAT is defined as a true solid-liquid phase temperature
boundary whereby the solid and liquid phases exist in an equilibrium at a fixed pressure.
An experimentally-measured WAT is obtained experimentally at a fixed pressure in which
it is usually lower than the thermodynamic WAT. The difference in thermodynamic WAT
and experimentally-measured WAT is largely due to the sensitivity of the measuring
equipment used. The experimentally-measured WAT depends largely on the sensitivity of

8
the equipment since the temperature obtained represents the point in which the first crystal
is first visibly detected.
There are several experimental technique that are currently being used in the
laboratory in order to determine the WAT such as American Society for Testing and
Materials (ASTM) D2500-88 or IP 219/82 methods, cold finger (CF), light transmittance
(LT), cross polar microscopy (CPM), differential scanning calorimetry (DSC), filter
plugging (FP) , Fourier Transform (FT-IR) spectroscopy (Hamami et al., 2004), Fourier
Transform Infrared (FTIR) light scattering, differential scanning calorimetry (DSC)
ultrasonic (Karan et al., 2000) and many more (Hammami et al., 2004)
Pour Point Temperature (PPT) defined as temperature in which the crude oil
solidifies, producing wax-oil gels along the pipeline. This causes the amount of precipitated
wax to increase significantly. The PPT is a rheological property of a waxy crude oil and is
generally being used to define the ‘waxiness’ of the crude oil (Karan et al., 2000). PPT is
usually tested/measured by using the ASTM D97 procedure. A new testing standard which
is the ASTM D 5853-93, is used specifically to measure a crude oil’s PPT. According to
Ahmad (2012), the range of PPT for crude oil Malaysia is in between 18ºC - 36ºC.
Table 2.1 shows the terminology alongside with its definition and Table 2.2 shows
the crude oil regions and its conditions.
Table 2.1: Terminology and its definitions (Karan et al., 2000)
Terminology Definition
Wax Appearance
Temperature (WAT) The temperature at which the first crystals are detected
Pour Point
Temperature (PPT)
The temperature in which crude oil solidifies during a temperature
drop, causing an increase in the amount of precipitated wax
Boiling Point The temperature at which the vapour pressure of the liquids equals
the pressure surrounding the liquid and changes into vapour
Melting Point The temperature at which it changes state from solid to liquid

9
Table 2.2: Waxy crude oil temperature regions and its condition (Karan et al., 2000)
Region Condition
Above WAT The fluid acts as a Newtonian fluid and no
occurrence of wax deposition
Between WAT and PPT The crude oil exhibits mild non-Newtonian
fluid properties
Below PPT The crude oil has tendency to become gel
under non-flowing condition
2.3 Restart Pressure of Pipeline
In order to restart a pipeline after a shutdown period due to maintenance or bad
weather, an applied pressure higher than the normal operating pressure is usually required
in order to displace and overcome the yield strength of the gelled crude oil. The pressure
difference, ∆𝑃 is calculated through Equation (1.1). (∆𝑃 =4𝜏𝑦𝐿
𝐷). When the restart pressure
is applied and the oil begins to flow, it will subject further shear within the pipeline and
causes a breakdown through the waxy structure. This causes the oil viscosity to decrease
and the oil flow to increase over time (Ronningsen, 1991). The amount of time needed to
restart the pipeline depends on the pressure being applied and the rate of change of viscosity
under shear stress as well as the compressibility of the oil. Theoretically, the gelled oil and
the displacing liquid is assumed to be incompressible but that is not the case in practice.
This has caused overestimation in the restart pressure of a gelled pipeline. Under practical
conditions, both the gelled oil and the displacing liquid is compressible and the oil is not
homogenous within the pipeline.
2.4 Yield Stress of Wax
The problem of paraffin deposition within the pipeline walls is not new during the
production and transportation phase of crude oil. The cooled wax-oil gel within the pipeline
has a very high yield stress, in some cases far exceeds the maximum allowable pressure
that the particular pipeline may handle (Davidson et al., 2004 ; Lee et al., 2007 ; Shafquet
et al., 2013). A gel strength can be measured in terms of its yield stress and therefore it is

10
necessary to estimate the gel’s strength in order to restart a blocked pipeline. In many years,
there have many researches on how to overcome the restart problem of waxy crude oil in
pipeline. Fossen et al (2013) noted that several techniques such as small pipe diameter
restart experiments, the usage of rheometer and studies of the physics of the gel during the
formation and breaking using an applied external shear force can be performed in order to
assess the magnitude of the yield stress. Obtained yield stress will determine the required
pumping pressure in order to initiate the flow during restart operations (Fossen et al., 2013).
There are multiple factors that affects the investigation of restart pressure as observed by
Phillips et al., (2011) and (2012). These factors include the rate of fluid cooling and shear
forces acting on the fluid during cooling.
Wardhaugh and Boger (1991) in their paper has described qualitatively the yielding
of waxy crude oils in detailed manner. The three mechanism for yielding of waxy crude oil
are: (a) elastic response (b) creep and (c) sudden and dramatic failure. Figure 2.1 shows the
transition from the elastic response to creep corresponds to the elastic limit yield stress
(𝜏𝑒). At the starting point of the fracture (point B), the stress corresponds to static yield
stress (𝜏𝑠) while the dynamic yield stress (𝜏𝑑), can be calculated after the complete fracture
of the structure (at point C). Based on this experiment, it is observed that the elastic limit
and the static yield stress are dependent upon the strength of the interlocking network of
wax crystal before it was disturbed. The dynamic yield stress is highly dependent on the
concentration and the size of the wax particles within the oil after the structure is
completely disintegrated (Chang et al.,1998).

11
Figure 2.1: Yielding process of a waxy crude oil (Chang et al., 1998)
2.5 Effects of Cooling Rate on Crude Oil
There were several researches done on effect of cooling rates on a strength of a
gelled wax. In an experiment conducted by Venkatesen et al (2005), a Cambridge Optical
Shearing System (CSS 450) was used in order to observe the crystal structure of a wax that
was formed under shear which was subjected to different cooling rates. It was found that
the wax particle formed under a lower cooling rate of 1.8ºF/min were larger in size than
the ones that was been formed under a high cooling rate of 10.8ºF/min. The maximum
length of wax crystals formed was about 37 μm and 17 μm respectively for low and high
cooling rate respectively. Within the study, it was noted that there were higher number of
wax crystals being formed under a high cooling rate as compared to the lower cooling rate.
This happens due to the decrement in crystal size and an increment in crystal number
density as the cooling rate increases, leading to a higher number of wax crystals being
formed. Figure 2.2 shows the effect of cooling rate on the size and number of wax crystals
subjected to low cooling rate and high cooling rate of 1.8ºF/min and 10.8ºF/min
respectively.

12
Figure 2.2: Size and number of wax crystals formed under low and high cooling rate
(Top: 1.8ºF/min; Bottom: 10.8ºF/min) ( Venkatesen et al. 2005)
Based on an experiment conducted by Lee et al (2007), in which a wax-oil mixture
which was composed of 15% food grade paraffin (Gulf Wax), 33% kerosene and 52%
mineral oil by weight was used in order to study the cohesive failure and adhesive failure
of the wax subjected to low and high cooling rates of 3.5ºC/hr and 20ºC/hr respectively.
The strength and the restart pressure of the wax-oil gel is dependent on the cooling rate
under quiescent condition. Figure 2.3 shows the gel stress strength against rate of cooling.
As shown in Figure 2.3, it was found that the gel failure strength increases with increasing
cooling rates at low cooling rates and decreases at high cooling rate and there exists a
delineation point between them.

13
Figure 2.3: Gel failure stress vs cooling rate (Lee et al., 2007)
Based on Figure 2.3, when the cooling rate is below the delineation point of 7ºC/hr,
the cohesive strength of the wax-oil gel is higher as compared to the adhesive strength and
thus the gel will suffer from adhesive failure. In this case, the gel breaks away adhesively
at the interface of the pipe metal surface. At a higher cooling rate beyond the delineation
point, the gel will have a high adhesive strength as compared to the cohesive strength and
thus will fail cohesively. By this, the gel will break within the gel structure itself cohesively.
Figure 2.4 shows the cross polar microscope photo of wax-oil gel under low and
high cooling rate of 3.5ºC/hr and 20ºC/hr respectively.

14
Figure 2.4: Cross-polarized microscope photo of wax-oil gel for (a) Cooling rate of
3.5ºC/hr and (b) Cooling rate of 20ºC/hr (Lee et al., 2007)
As shown in Figure 2.4, the wax crystals formed under low cooling rate has a larger
crystals and has a sheet like shape with an average surface area of 20 μm 𝑥 50 μm whereas
the wax crystals formed under a high cooling rate is smaller and has the shape of a
needlelike crystals and has an average surface area of 1μm 𝑥 20 μm. It was noted that the
wax crystals subjected to high cooling rate has higher density as compared to the wax
crystal subjected to low cooling rate. With this observation, it explains why there is a

15
decrement in cohesive strength and an increment in adhesive strength as the cooling rate
increases.
2.6 Effect of Pipe Diameter
Several researches have been conducted in order to study the dependency of yield
stress of the wax on pipe diameter. A study by Davenport and Boger (1991) was conducted,
in which pipes with diameter of 6-75 mm were used and they found that the yield values
increases with decreasing pipe diameter. Another recent experiment conducted by Philips
et al., (2011), in which small pipe sizes of 5.9 mm and 12.7 mm inner diameter were used.
Through their experiments and numerical simulations, they have suggested several model
predictions in which it is related to fluid volume shrinkage, shrinkage flow and void
formation during a gel formation. It has been noted that the calculated restart pressures
based on a small diameter pipe experiments would be too conservative, in which this would
lead an overestimate of the restart pressure. An overestimate in the restart pressure would
lead to an over design of the pump. A recent study by Fossen et al., (2013) in which an
experiment was conducted on a larger diameter pipes, in order to study the effect of the
pipe diameter on the yield stress. In the experiment, 3 carbon steel pipes with diameters of
28 mm, 55 mm and 82 mm at the length of 5.8 m were used and mounted horizontally and
levelled. It was found during the experiment that the predicted restart pressure obtained
based on the yield stress found on a 4.3 mm diameter pipe deviated by 140% in comparison
to that of an 82 mm diameter pipe. Through this study, it was found that restart pressure
could be over predicted if the calculation was made from yield stress values taken from a
small diameter pipe experiment.
2.7 Thermal Shrinkage
As the crude oil undergoes gelation process, a phenomenon called “thermal
shrinkage” takes place. As mentioned by Shafquet et al., (2013), gas voids appear during
thermal shrinkage process in which it results in compressible nature. These gas voids affect
the compressibility of the gelled structure since they have space for it to move due to
applied pressure from a liquid and this significantly reduces the restart pressure required to
break the wax-oil gel. Figure 2.5 shows the gas voids formed within gelled waxy crude oil.
Experiments conducted by Wasch et al (2007), in which 1.5D numerical model was used

16
in order to demonstrate that the flow could be restarted with a pumping pressure well below
the value predicted by Equation 1.1 due to the presence of gas voids along the pipeline.
Figure 2.5: Gas voids formation on waxy crude oil (Chala et al., 2014)
The location and volume of gas voids strongly depends on the cooling rate of the
crude oil and temperature as observed by Henaut et al (1999). As mentioned by Lee et al.,
(2007), there are many factors that contribute to the wax-oil gel properties since not all
wax-oil gel formed within the pipeline is homogenous due to thermal and shear history
within its axial and radial locations inside the pipeline. Due to this, the size and the shape
of the wax crystals that is near the pipe wall might be different than those found at the
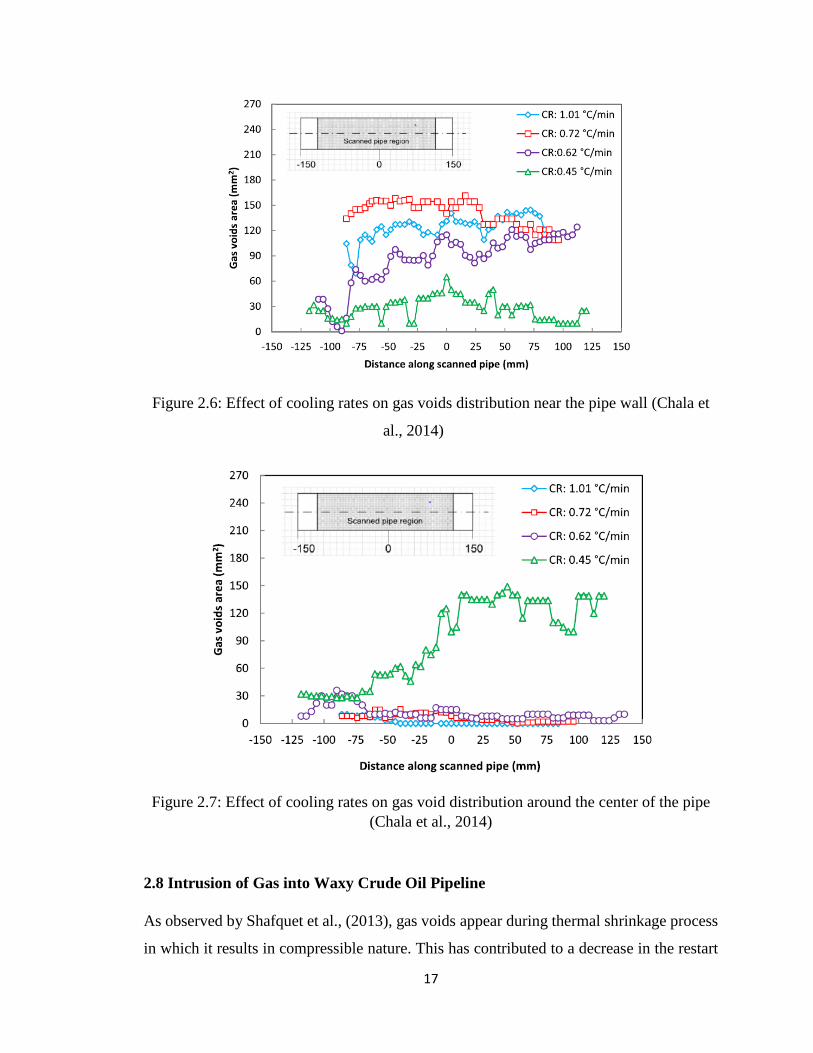
center of the pipeline. Another research by Chala et al (2014) was done in order to observe
and quantify the gas voids within the gelled crude oil due to thermal shrinkage, in which it
was proven that gas voids formation depends not only on temperature of the crude oil but
also on the cooling rate. A high cooling rate of 1.01ºC/min was observed to have large gas
voids area near the wall of the pipe. Figure 2.6 shows the effect of cooling rates on gas
voids distribution near the pipe wall. Along the center of the pipe, it was noted that low
cooling rate of 0.45ºC/min has a large gas voids area as compared to high cooling rate of
1.01ºC/min along the center of the pipe. Figure 2.7 shows the effect of cooling rates on gas
voids distribution around the center of the pipe. This shows that gas voids within the cooled
gel has a profound effect on the restart pressure of pipeline.
17
Figure 2.6: Effect of cooling rates on gas voids distribution near the pipe wall (Chala et
al., 2014)
Figure 2.7: Effect of cooling rates on gas void distribution around the center of the pipe
(Chala et al., 2014)
2.8 Intrusion of Gas into Waxy Crude Oil Pipeline
As observed by Shafquet et al., (2013), gas voids appear during thermal shrinkage process
in which it results in compressible nature. This has contributed to a decrease in the restart

18
pressure required in order to restart a pipeline. Due to the presence of a naturally occurring
gas voids within the gel, a study was done by Zakaria (2014), in which gas was injected
into a production pipeline of a waxy crude oil. This allows for more creation of voids as
the gas is injected into the pipeline prior to shut down in order to further reduce the restart
pressure. The experiment was conducted on a waxy crude oil flow loop test rig, in which
the seabed temperature of 15ºC, 20ºC and 25ºC was simulated. It was found that there was
a significant difference in restart pressure with and without the gas intrusion using a gradual
flow start up method and instantaneous flow start up method. Under the gradual flow start
up method, the pressure difference ranges between 0.2 to 0.51 bar and it was further noted
that the differences in restart pressure increases as the water temperature decreases. It was
noted that the effect of gas intrusion is more significant with water at lower temperature.
Figure 2.7 (a) shows the restart pressure of waxy crude oil at different water temperature
using gradual pressure approach. Under the instantaneous flow start up method, the
pressure reduction within the range of 0.25 bar to 0.56 bar was noted, in which the highest
pressure reduction was found when the water temperature is around 20ºC. Figure 2.7 (b)
shows the restart pressure of waxy crude oil at different water temperature using
instantaneous pressure approach. Although the study was done, it was not known
quantitatively on how much volume of gas was injected within the test section.
Figure 2.7 (a): Restart pressure of waxy crude oil at different water temperature using
gradual pressure approach (Zakaria, 2014)
2.21
1.97
1.35
2.72
2.27
1.55
1
2
3
10 15 20 25 30
Inle
t P
ress
ure
(b
ar)
Water Temperature (ºC)
With gas intrusion

19
Figure 2.7 (b): Restart pressure of waxy crude oil at different water temperature using
instantaneous pressure approach (Zakaria, 2014)
2.9 Usage of Nitrogen Gas in Oil and Gas Industry
Nitrogen, is a chemical element with a symbol N and has an atomic number 7. Under its
standard condition and at a room temperature, nitrogen gas has an odorless, colorless,
tasteless, non-irritating and inert capabilities. In an atmosphere, nitrogen gas makes up
around 78% while the remaining balance is primarily oxygen gas, which stands at 21%.
The chemical properties of nitrogen are shown in Appendix 1. Nitrogen gas is often used
to keep materials free of contaminants such as oxygen, in which it is able to corrode an
equipment or present a fire and explosion hazard when it comes into contact with a
flammable liquid. Since nitrogen gas exhibits inert capabilities such as not able to support
combustion, it is widely used within the oil and gas industries. The usage of nitrogen gas
within industry is primarily used for inert gas lift, well clean outs, underbalance drilling
(UBD), purging of instrument panels, pipeline purging or pigging, marine riser tensioner
for offshore drilling, heave compensation for offshore lifting and drilling operations,
fracking, enhanced oil recovery (EOR), dry gas compressor sealing, dry bulk transfer and
air pressure vessel’s (APV) for floating offshore platforms (NOXERIOR). Pipeline
purging with the usage of nitrogen gas is usually done after a pigging operation has been
completed. A dry nitrogen gas is being run through the pipeline in order to dry up any
remaining water that still exist in the pipeline.
1.54
1.09
0.93
1.86
1.65
1.18
0.5
0.7
0.9
1.1
1.3
1.5
1.7
1.9
2.1
10 15 20 25 30
Inle
t P
ress
ure
(b
ar)
Water Temperature (ºC)
Without gas intrusion
With gas intrusion

20
CHAPTER 3
METHODOLOGY
This chapter covers the experiment planning and the project schedule of the current studies,
in which it is presented in the form of process flow chart and Gantt chart. The components
used within the experiment is discussed here as well.
3.1 Research Overview
Figure 3.1 shows the detailed flow chart for methodology used in this study. The
background study regarding the restart pressure of waxy crude oil flow is first conducted.
In this phase, the problems and challenges faced during production and transportation of
waxy crude oil is outlined and identified. This presents the magnitude of the problem
currently being faced by the industry as it affects the pipeline integrity and the overall
CAPEX and OPEX of the facilities. Once the background study has been conducted, the
literature review phase is then conducted. During this stage, previous studies and
researches regarding restart pressure of waxy crude oil are gathered and discuss. The
findings at this stage is significant as it presents the data that has been captured in the
researcher’s previous experiments. At this stage, the parameters and conditions that
attributes to the ease of restart is identified. After the literature review phase is done, the
waxy crude oil flow loop experiment planning and consultation is conducted. At this stage,
a discussion session was conducted with the lab technician and graduate assistant in order
to find out more regarding the test rig that is available in Block 18, Mechanical Engineering
Department, Universiti Teknologi PETRONAS. At this stage as well, the duration of the
experiment can be estimated in order to efficiently utilize the machine. Next, the
familiarization process with the test rig was conducted. As the test loop is an expensive
and sophisticated machine, it is at upmost importance to learn on how to operate and know
all the health, safety and environment (HSE) rules when operating the test loop. This
ensures the reliability as well as the integrity of the machine when conducting the

21
experiment later on. The familiarization process was conducted by the graduate assistant
as he is very familiar with waxy crude flow loop test rig.
Figure 3.1: Flow chart of research methodology

22
The design of the gas system into the pipeline was then commenced. At this stage,
a system was implemented in order to inject the gas into the test section of the test rig.
Once the gas injection system is planned, the proposed system is then implemented and the
setup of the experiment can begin. The was done as to ensure that there is no mishap that
could happen during the later part of the experiment. An experiment was then carried out
with different gas flow rate in order to verify on its function. The result from this
experiment was analysed to see if the system needs any modification.
Once the system is verified and no more modification is done towards the test rig,
the experiment regarding restart pressure with respect to different oil cooling rates and the
temperature with the injected gas was commenced. All the data gathered were discussed
once the experiment was done. The findings and discussion were then compiled into a
report.
3.2 Gantt Chart / Project Planning
The project planning for Final Year Project 1 (FYP 1) is outlined and showed below
under Figure 3.2. The duration given in order to complete the activities was 15 weeks
starting from 21st September 2015 (Week 1) up to 21st December 2015 (Week 14). A
comprehensive back ground study on problems with respect to restart pressure of waxy
crude oil in which it was conducted on Week 1 up to Week 4. Concurrently, a
comprehensive literature review was done on Week 3 in FYP 1 up to Week 24 in FYP 2.
This long period is needed in order to continuously study on the parameters that affect the
restart pressure of the waxy crude oil in a pipeline. The initial experiment planning and
consultation was done on Week 7 up to Week 12. At this phase, a few introductory sessions
with regards to lab facilities as well as the equipment was conducted with the lab assistant
and the graduate assistant at Block 18, Mechanical Engineering Department, Universiti
Teknologi PETRONAS. This concludes all the activities in FYP 1.
The initial design of the nitrogen gas injection system was outlined in Week 15 and
Week 18 in FYP 2 and it includes all the necessary procurement of all the related
components needed for the gas injection system. A familiarization process with the flow

23
loop test rig was conducted on Week 17 up to Week 20 in which the graduate assistant
showed how to operate the test rig safely and in a proper manner. At this phase, all Health,
Safety and Environment (HSE) with respect to operate the test rig is shown, as well as the
proper way to operate the machine so that it does not break down during the experiment
phase. This particular process was followed by the fabrication of nitrogen gas injection
system in which it was done in the same period of Week 19 and Week 22. After nitrogen
gas injection system was in place, the whole test rig was set up and a small experiment was
conducted in order to ensure that all components work perfectly. The first experiment on
restart pressure without any gas intrusion was conducted in Week 21 up to Week 22. On
top of that, another experiment on restart pressure with gas intrusion with varying
volumetric flow rate was conducted on Week 22. Once that is done, another experiment on
pipeline restart with gas intrusion at different crude oil flow conditions was conducted in
Week 23 up to Week 26. In Week 23 to Week 26, one of the completed experiment was
repeated in order to assess the data’s repeatability. Once the experiment phase is done, the
results are then analysed in Week 23 up to Week 26. At this phase, all the results regarding
the experiment conducted earlier were discussed and presented in a proper manner.
There are 4 project milestones for this study, which are (1) background study completion,
(2) initial experiment planning completion, (3) completion of waxy crude oil flow loop
familiarization process, (4) completion of gas injection system, (5) completion of
experiment and (6) completion of dissertation.

24
Figure 3.2: Gantt chart for FYP 1 and FYP 2
3.3 Test Rig Set Up
The Waxy Crude Oil Flow Loop (test rig) as shown in Figure 3.3, which is currently
located in Block 18, Mechanical Engineering Department, Universiti Teknologi
PETRONAS, was used in order to carry out the experiment on restart pressure of pipeline.
This particular test rig comes with several key components in which it enables the
researchers to study more on the properties of the wax as well as the restart pressure needed
in order to restart a waxy crude oil pipeline. A detailed component specification is provided
in Appendix 2 An acrylic test section of 1.2 m long with a diameter of 30 mm is immersed
in a water bath in which it was used in order to observe any physical changes within the
crude oil when it is subjected to low temperature environment. An evaporative coil is
placed within the water bath section in order to cool down the water. This is done as to
mimic the seabed temperature condition. The evaporative coil is then connected to a chiller
system and the temperature can be adjusted on the control panel. A temperature and
pressure sensor is placed at the upstream and downstream of the test section, in which it is
able to monitor any changes. The readings from both the temperature and pressure sensor
is then displayed on the control panel. As the acrylic test piece within the flow loop is
detachable and can be taken out from the water bath, the effects of thermal shrinkage can
= key milestone

25
be studied. A crude oil flow meter is used in order to measure the flow rate of the crude oil
flowing inside the pipeline. It is connected upstream part of the pipeline and is a 1” corrollis
flowmeter and was manufactured by Micron Motion Transmitter with model number
1700I12ABZEZZZ. A temperature sensor is placed within the storage tank in order
monitor the temperature of the crude oil during the stirring process.
Figure 3.3: Major components of way crude oil flow loop
Based on the schematic in Figure 3.4, the whole rig acts as a closed loop system in
which the waxy crude oil is circulated throughout the whole system in one complete cycle.
The waxy crude oil is placed within the storage tank and heated to its operating condition
(70ºC), in which it is stirred continuously to remove its past thermal behaviour and enhance
the flow of the crude oil in the closed loop. During at any point in time whereby the test
rig is not being used, the wax starts to solidify within the whole system, making it quit
difficult in order to restart it. Therefore, the crude oil within the storage tank needs to be
heated first, including the pipes within the system through the usage of trace heaters/heat
tape. At this temperature, the crude oil behaves as Newtonian fluid and flows normally
within the test piece. The pippings within the systems are rolled with trace heaters/heat
tape all the way except for the test section piece within the water bath. Both the trace heaters
along the pipe and heater within the storage tank is switched on at the same time. Once
crude oil is heated up to a temperature of 70ºC, a gear pump manufactured by Marelli
Motori from Italy with the model number MOT 3-MAA 90L6-B3 which is located
Control
Panel
Cold Water
Bath
Crude Oil Tank
Motor for
Electric Stirrer

26
upstream (after the storage tank), is then operated in order to build enough pressure in order
to disintegrate the gelled crude oil in the acrylic test section. The crude oil starts flowing
and then returns to the crude oil storage tank to be reheated and maintained at a temperature
range of 60º-90ºC. The experiment can then be commenced by shutting off the gear pump
that operates the crude oil and allow the water bath to cool down the crude oil through the
usage of chiller system. The wax in the crude oil slowly solidify due to the low temperature
within the water bath.
Figure 3.4: Schematic of the waxy crude oil flow loop
3.4 Mechanism for Intrusion of Nitrogen
A nitrogen gas injection system was built and implemented to the current waxy crude oil
flow loop test rig. A nitrogen gas cylinder is first connected to the gas flow meter through
a ¼ inch stainless steel reinforced Teflon hose with the length of 1.5 m. From the gas flow
meter, it is then connected to a ball valve via ¼ inch stainless steel reinforced Teflon hose
with a length of 1 m. The diameter of the hose is ¼ inch or 6.35 mm. The nitrogen gas will

27
supply at a rate of 1 L/min through the 6.35 mm hose. The pressure of which the nitrogen
gas will leave the gas cylinder will be set at 3.5 bar via the nitrogen gas regulator. The ball
valve will be connected to the test rig through the opening along the oil pipeline which is
covered with a heat tracer.
During the experiment, the nitrogen gas will be injected into the system during the
gelling process of the crude oil after the crude oil has stopped flowing. A ball valve was
placed at the inlet of the injection site in order to control the nitrogen gas flow. In this
study, nitrogen gas with the volume of 50 mL was injected into the test section by opening
the ball valve for a specific period of time. The period of time needed to open the ball valve
in order to allow a known volume of gas to intrude the test section was calculated by using
the following equation:
𝑡𝑣 = 𝑉
𝑄 (3.1)
where tv,V and Q are the period of time needed to open the ball valve (s), the known gas
volume that needs to be injected (mL) and the volumetric flow rate of the gas (LPM)
respectively.
The components used in order to set up the gas injection system is shown in
Appendix 2 and the schematic of the gas injection system is shown in Figure 3.5. The
completed nitrogen gas injection is shown in Figure 3.6.
Figure 3.5 Schematic drawing of gas injection system

28
Figure 3.6: Completed nitrogen gas injection system set up
Figure 3.7 shows the gas voids that was formed through the injection of 50 mL of nitrogen
gas into the test section.
Figure 3.7: Formation of gas voids into the test section
Nitrogen gas tank
Gas flow meter
Ball Valve
Gas injection inlet
¼" stainless steel
reinforced hose
Gas void formation
Test section

29
3.5 Crude Oil Properties
For this experiment, the type of waxy crude oil to be used is identified. As different oil
fields will have a different physical and chemical composition, it is important to know the
characteristics of the crude oil being used in this particular experiment. The properties of
the crude oil will have an effect on the gelation of the wax in the crude oil during the
cooling period, and thus will result in different restart pressure depending on the type of
the crude oil being used. In this present study, only one type of crude oil, namely the Sepat-
7 was used in order to ensure the comparison between data obtained later on in the
experiment is relevant. The crude oil has been supplied by PETRONAS CARIGALI Sdn
Bhd and was taken from the Sepat field, offshore Terengganu. The properties of Sepat-7
crude oil are shown in Table 3.1. The density of the crude oil was determined from the
Coriolis flow meter at temperature above 38.5ºC, the specific gravity was through a
calculation, the dynamic viscosity was determined through viscometer, the WAT was
determined through the ASTM D3117 method and the PPT was determined through ASTM
D97 method.
Table 3.2 : Properties of Sepat-7 crude oil (Chala et al., 2014)
Crude Name Sepat-7
Origin Sepat Field, Offshore Terengganu ,
Peninsular Malaysia
Pour Point Temperature (PPT) 36ºC
Wax Appearance Temperature
(WAT) 38.5ºC
Density 850 kg/m3
Viscosity 0.002 Pa
Specific Gravity 0.85

30
CHAPTER 4
RESULTS AND DISCUSSION
This chapter discusses the data which was obtained through the experiment. All the results
obtained from the experiment will be tabled and discussed in a detailed manner. In the
Section 4.1, the result from the nitrogen gas injection system is shown and for the
subsequent sections, the results of restart pressure with varying cooling rates that was
subjected under two different start up conditions is presented and discussed.
4.1 Restart Pressure of Pipeline
The waxy crude oil test rig was equipped with a 1.1 kW gear pump in which it was
placed further upstream from the test section, right after the crude oil tank. The pump was
used to provide pumping pressure / restart pressure needed to disintegrate the gelled wax
within the test section. All the pipping system that connects to and after the test section
were equipped with a trace heater and it was set at 70ºC so as to liquefy any remaining
gelled wax. The initial / inlet temperature at the test section was set at 70ºC so as to simulate
temperature from the wellhead. Under this experiment, there were two ways in which a
restart pressure was applied, namely instantaneous restart and gradual restart. In an
instantaneous restart, maximum allowable pressure up to 2 bar was applied instantaneously
on the gelled wax within the test section. In a gradual restart, a maximum allowable
pressure of up to 2 bar is applied in a gradual manner / incremental manner up to a point
the gelled wax begins to disintegrate. The pressure at which the gelled wax starts to
disintegrate in both instantaneous and gradual restart is captured by a data logger. Within
this study, the water bath temperature was set at 20ºC, 25ºC and 30ºC so as to simulate the
seabed temperature. Under both approaches, nitrogen gas was injected in order to study the
effects of gas injection with respect to its restart pressure. The pipeline is restarted under
both cases when the temperature of the gelled wax reaches the water bath temperature.
With the experiment data obtained, the restart pressure for both injected and non-injected
pipeline were studied and compared.

31
4.1.1 Instantaneous Restart Pressure
As mentioned in Section 4.1, a maximum allowable pressure of up to 2 bar was
instantaneously applied on to the gelled wax within the test section. Pressure builds up
instantaneously at the point the after pump was switched on, which was placed at the
upstream part of the test section and once the pressure is high enough, the gelled wax starts
to disintegrate and the pipeline will resume flowing condition. Table 4.1 shows the
summary results of instantaneous restart on the gelled wax pipeline with and without the
gas injection. The restart time refers to the time taken for the gel to disintegrate at the
moment the gear pump is switched on and the restart pressure refers to the pressure at the
moment the gelled wax disintegrates.
Table 4.1: Restart pressure and restart time comparison using instantaneous pressure
Instantaneous Restart
Initial
Temperature,
Ti (ºC)
Water Bath
Temperature,
Tw, (ºC)
Restart Pressure, Pr
(Bar)
Restart Time, Tr
(s)
Without
Injection
With
Injection
Without
Injection
With
Injection
70 30 1.415 1.368 16 18
70 25 1.563 1.465 10 26
70 20 1.785 1.58 9 21
In Table 4.1, the initial temperature is kept constant at 70ºC and the water bath
temperature varies from 20ºC, 25ºC and 30ºC. It is noted that the restart pressure of the
waxy crude oil pipeline is higher when the nitrogen gas not injected as compared to the
restart pressure of a pipeline that has been injected with a nitrogen gas. Restart pressure of
1.785 bar, 1.563 bar and 1.415 bar was observed for water temperature of 20ºC, 25ºC and
30ºC respectively when it was not injected with gas. A lower restart pressure of 1.58 bar,
1.465 bar and 1.368 bar was observed for water temperature of 20ºC, 25ºC and 30ºC
respectively when the test section is injected with nitrogen gas. The presence of gas voids
allows for a lower restart pressure since the gelled wax has a lot of space to move when
pressure was applied (Lee et al., 2008). This therefore reduces the amount of restart
pressure needed as compared to the restart pressure of a non-injected pipeline. As the water
temperature bath decreases, the restart pressure of the pipeline for both with and without

32
nitrogen gas injection increases. This is largely due to a high cooling rate between the crude
oil and the water bath temperature. A mentioned by Lee et al (2007), a slower cooling rate
would yield a large, sheet like wax crystals in which it has low density as compared to the
wax crystals that was formed under a high cooling rate. Wax crystals formed under high
cooling rate was observed to be small in size and as result, the network wax-crystal
structure loses its interconnectivity. Under a high cooling rate, the increased density and
number of wax crystals increase the adhesive strength as the needle like crystal allows
larger effective surface area at the interface between the wall (Greiner et al., 2007). This
explains why a higher restart pressure was observed as the cooling rate is increased. The
average cooling rate, 𝐶𝑎𝑣𝑔, was calculated by using the following equation:
𝐶𝑎𝑣𝑔 = ∆𝑇
𝑆 (4.1)
whereby ∆𝑇, s and 𝐶𝑎𝑣𝑔 is the temperate difference between the crude oil at the inlet and
the water bath temperature (initial temperature – final temperature), time taken in minute
for the crude oil to reach the final temperature and the average cooling rate in minute
respectively. All static cooling period was kept constant at 60 minutes and the cooling rate
for 20ºC, 25ºC and 30ºC are 0.666ºC/min, 0.75ºC/min and 0.833ºC/min respectively.
Table 4.2 shows the difference in restart pressure between a gas injected pipeline
and a non-injected pipeline which was subjected to instantaneous restart. Figure 4.1 shows
a graphical representation of the restart pressure difference between a gas injected pipeline
and non-injected pipeline. Figure 4.2 shows the instantaneous restart pressure profile of
gas injected at test section and Figure 4.3 shows the instantaneous restart pressure profile
of pipeline without gas injection.
Table 4.2: Pressure difference between an injected pipeline and non-injected pipeline
Initial
Temperature,
Ti (ºC)
Water Bath
Temperature,
Tw, (ºC)
Restart Pressure, Pr
(Bar) Pressure
Difference,
Δ Pr
Percentage
Difference,
% Without
Injection
With
Injection
70 30 1.415 1.368 0.047 3.32
70 25 1.563 1.465 0.098 6.27
70 20 1.785 1.58 0.205 11.48

33
Figure 4.1: Pressure difference between a gas injected pipeline and non-injected pipeline
subjected to instantaneous restart pressure approach
The percentage difference between the restart pressure of a non-injected pipeline
and injected pipeline is calculated by using the following equation:
%𝑃𝑟 = [(𝑃𝑟𝑤𝑜−𝑃𝑟𝑤)
𝑃𝑟𝑤𝑜] 𝑋 100% (4.2)
whereby 𝑃𝑟𝑤𝑜, 𝑃𝑟𝑤 and %𝑃𝑟 are restart pressure of pipeline without gas injection (bar),
restart pressure of pipeline with gas injection (bar) and percentage difference of restart
pressure respectively. As shown in Table 4.2, the biggest difference in restart pressure
when compared between a gas injected test section and a non-injected gas section is
11.48% when the water temperature is at 20ºC, followed by 6.27% when the water
temperature is at 25ºC and 3.32% when the water temperature is at 30ºC.
4.1.2 Gradual Restart Pressure
As mentioned in Section 4.1, a maximum allowable pressure of up to 2 bar was
gradually applied onto the gelled wax within the test section through the usage of a gear
pump. Pressure builds up gradually within the upstream part of the test section the moment
the pump is switched on and once the pressure is high enough, the gelled wax will start to
disintegrate and the test section will resume flowing condition. Table 4.3 shows the
summary result of restart pressure for gas injected test section and non-injected test section
when subjected to gradual restart pressure.
1.415
1.563
1.785
1.3681.465
1.58
1
1.2
1.4
1.6
1.8
2
15 20 25 30
Re
star
t P
ress
ure
(B
ar)
Water Bath Temperature (ºC)
with gas injection
without gas injection

34
Table 4.3: Restart pressure and restart time comparison using gradual restart pressure
Gradual Restart
Initial
Temperature,
Ti (ºC)
Water Bath
Temperature,
Tw, (ºC)
Restart Pressure, Pr
(Bar)
Restart Time, Tr
(s)
Without
Injection
With
Injection
Without
Injection
With
Injection
70 30 1.49 1.351 86 76
70 25 1.812 1.496 177 85
70 20 2.077 1.858 136 115
Table 4.3 shows the restart pressure for a non-gas injected test section is higher as
compared to the gas injected test section. It was shown that lowest restart pressure for a
gas injected pipeline was found to be at 1.351 bar when the water bath temperature was at
30ºC as compared to the restart pressure of 1.49 bar when the test section was not injected
with nitrogen gas. The highest restart pressure was found to be at 1.858 bar when the water
bath temperature was at 20ºC as compared to the restart pressure of 2.077 bar when the test
section was not injected with nitrogen gas. It can be observed that the restart time taken
reduces when the test section is injected with nitrogen gas. As the displacing fluid, which
in this case was a liquefied waxy crude oil moves and fills up the gas voids within the test
section, it effectively reduces the time taken in order to restart the pipeline. Table 4.4 shows
the difference of restart pressure between a gas injected test section and a non-injected test
section when it is subjected to gradual restart pressure approach.
Table 4.4: Pressure difference between gas injected and non-injected pipeline
Initial
Temperature,
Ti (ºC)
Water Bath
Temperature,
Tw, (ºC)
Restart Pressure, Pr
(Bar) Pressure
Difference,
Δ Pr
Percentage
Difference,
% Without
Injection
With
Injection
70 30 1.49 1.351 0.139 9.33
70 25 1.812 1.496 0.316 17.44
70 20 2.077 1.858 0.219 10.54

35
Table 4.4 shows the difference in restart pressure between a test section with and
without gas injection at 0.139 bar, 0.316 bar and 0.219 bar for water bath temperature of
20ºC, 25ºC and 30ºC respectively. The biggest difference in restart pressure can be
observed when the water bath temperature of 25ºC in which the percentage difference was
17.44 %, followed by 10.54% at water bath temperature of 20ºC and 9.33 % when the water
bath temperature was at 30ºC. As expected, the restart pressure decreases when the pipeline
has been injected with nitrogen gas due to the effect of compressibility that exist when
pressure is applied. Figure 4.4 shows the graphical representation of difference in restart
pressure for both gas injected and non-injected test section. Figure 4.5 and Figure 4.6 shows
the gradual restart pressure profile of a gas injected pipeline and non-injected test
respectively.
Figure 4.4: Restart pressure difference between gas injected pipeline and non-injected
pipeline subjected to gradual restart pressure approach
4.2 Effect of Gas Oil Ratio (GOR) on Restart Pressure
In this study, the effects of gas volume that was injected to the pipeline after the
pipeline has stop flowing and prior to static cooling process is studied. Within this study,
four volumes at 0 mL, 50 mL, 100 mL and 150 mL of nitrogen gas was used in order to
study its effect on the restart pressure of the pipeline. Both the initial temperature and the
water bath temperature are kept constant at 70ºC and 25ºC respectively. The volume of
injected nitrogen gas was adjusted by controlling the ball valve at the inlet of the gas
1.49
1.812
2.077
1.351
1.496
1.858
1
1.2
1.4
1.6
1.8
2
2.2
15 20 25 30
Re
star
t P
ress
ure
(B
ar)
Water Bath Temperature (ºC)
without gas injection
with gas injection

36
injection system which was placed at the upstream part of the test section. Using the
Equation 4.1, the duration or period in which the ball valve needs to be open at a volumetric
flow rate of 1 LPM can be calculated as the nitrogen gas volume is known. The volume of
the acrylic test section can be calculated through following equation:
𝑉𝑡 = 𝜋𝑑2𝐿
4 (4.3)
where Vt, d and L are volume of the test section (m3), internal diameter of the test section
and length of the test section respectively. The length and internal diameter of the test
section is 1.2 m and 0.03 m respectively. From the calculation using Equation 4.3, the
volume of the test section Vt, is 8.482 x 10⁻⁴ m3 or 848 mL. In this study, the effects of
varied nitrogen gas volume on the restart pressure needed was done by applying pressure
instantaneously and gradually onto the gelled wax within the test section. The gas to oil
volume ration was calculated using the following equation:
𝑅𝐺𝑂=𝑉𝑔
𝑉𝑡 (4.4)
where 𝑅𝐺𝑂, 𝑉𝑔 and 𝑉𝑡are gas to oil volume ratio, volume of nitrogen gas and volume of
crude oil in test section respectively. Table 4.5 shows the summary of the restart pressure
experiment with respect to different gas to oil volume ratio using the instantaneous restart
pressure approach and Figure 4.7 shows graphical representation of restart pressure
recorded. Figure 4.8 shows the instantaneous restart pressure profile with varying gas to
oil ratio.
Table 4.5: Summary of restart pressure with varying gas to oil volume ratio using
instantaneous restart pressure approach
Initial
Temperature,
Ti (ºC)
Water Bath
Temperature,
Tw, (ºC)
Volume of
Test Section,
Vt (mL)
Volume of
gas, Vg
(mL)
Gas to Oil
Ratio, RGO
Restart
Pressure,
Pr (Bar)
70 25
848 0 0 1.563
848 50 0.05894 1.465
848 100 0.11792 1.356
848 150 0.17688 1.209

37
As shown in Table 4.5, as the volume of the injected nitrogen gas increases, the
restart pressure needed to disintegrate the gelled wax decreases. At gas to oil volume ratio
of 0, the restart pressure recorded was 1.563 bar and for the subsequent gas to oil volume
ratio of 0.05894, 0.11792 and 0.17688, the restart pressure was recorded at 1.465 bar, 1.356
bar and 1.209 bar respectively. This shows a decrement in restart pressure as the gas to oil
ratio (GOR) is increasing when it is subjected to instantaneous restart pressure. This result
was expected due to the amount of volume in which the gelled wax is able to move as
pressure is applied through a displacing fluid. An increment in injected gas volume leads
to a high compressibility effect on the gelled wax.
Figure 4.7: Restart pressure at gas to crude oil volume ratio using instantaneous
restart pressure approach
A similar trend can also be observed when the pipeline is subjected to a gradual
restart pressure approach. In this study, both the initial temperature and water bath
temperature were kept constant at 70ºC and 25ºC respectively and the volume of the
nitrogen gas injected is 0 mL, 50 mL, 100 mL and 150 mL. Table 4.6 shows the summary
of restart pressure with varying gas to oil ratio using gradual restart pressure approach.
1.563
1.465
1.356
1.209
1
1.1
1.2
1.3
1.4
1.5
1.6
0 0.05 0.1 0.15 0.2
Re
star
t P
ress
ure
(B
ar)
Gas to Crude Oil Volume Ratio

38
Table 4.6: Summary of restart pressure with varying gas to oil ratio using gradual restart
pressure approach
Initial
Temperature,
Ti (ºC)
Water Bath
Temperature,
Tw, (ºC)
Volume
of Test
Section,
Vt (mL)
Volume
of gas, Vg
(mL)
Gas to Oil
Ratio, RGO
Restart
Pressure, Pr
(Bar)
70 25
848 0 0 1.789
848 50 0.05894 1.496
848 100 0.11792 1.396
848 150 0.17688 1.270
As shown in Table 4.6, at a gas to oil ratio of 0, the restart pressure was recorded
at 1.789 bar and for the next subsequent of gas to oil ratio of 0.05894, 0.11792 and 0.17688,
the restart pressure was recorded at 1.496 bar, 1.396 bar and 1.270 bar respectively. This
shows that as the gas to oil ratio increases, the restart pressure needed in order to resume
flowing condition within the pipeline decreases. Figure 4.9 shows the graphical
representation of restart pressure recorded with varying gas to oil volume ratio using the
gradual restart approach. Figure 4.10 shows the restart pressure profile with varying gas to
oil ratio subjected to gradual restart pressure.
Figure 4.9: Restart pressure recorded with varying gas to oil volume ratio using the
gradual restart approach
1.789
1.4961.396
1.27
1
1.2
1.4
1.6
1.8
2
0 0.05 0.1 0.15 0.2
Re
star
t P
ress
ure
(B
ar)
Gas to Crude Oil Volume Ratio

34
Figure 4.2: Instantaneous restart pressure profile with the injection of nitrogen gas
0
0.2
0.4
0.6
0.8
1
1.2
1.4
1.6
1.8
0 20 40 60 80 100 120 140
Re
star
t P
ress
ure
(B
ar)
Time taken to restart (s)
20ºC
25ºC
30ºC

35
Figure 4.3: Instantaneous restart pressure profile without nitrogen gas injection
0
0.2
0.4
0.6
0.8
1
1.2
1.4
1.6
1.8
2
0 20 40 60 80 100 120
Re
star
t P
ress
ure
(B
ar)
Time taken to restart (s)
20ºC
25ºC
30ºC
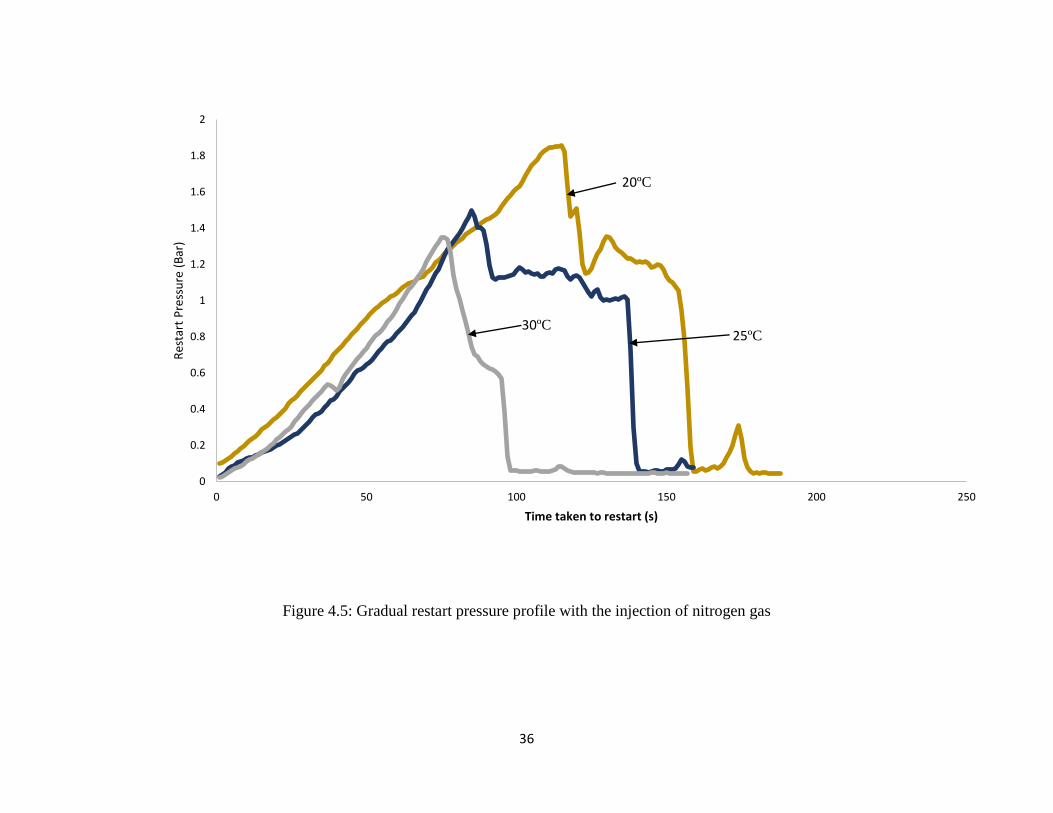
36
Figure 4.5: Gradual restart pressure profile with the injection of nitrogen gas
0
0.2
0.4
0.6
0.8
1
1.2
1.4
1.6
1.8
2
0 50 100 150 200 250
Res
tart
Pre
ssu
re (
Bar
)
Time taken to restart (s)
20ºC
25ºC30ºC

37
Figure 4.6: Gradual restart pressure profile without the injection of nitrogen gas
0
0.5
1
1.5
2
2.5
0 50 100 150 200 250
Re
star
t P
ress
ure
(B
ar)
Time taken to restart (s)
20ºC
25ºC
30ºC

38
Figure 4.8: Instantaneous restart pressure profile with varying volume of injected nitrogen gas
0
0.2
0.4
0.6
0.8
1
1.2
1.4
1.6
1.8
0 20 40 60 80 100 120
Re
star
t P
ress
ure
(B
ar)
Time taken to restart (s)
50 ml
0 mL
100 ml
150 ml

39
Figure 4.10: Gradual restart pressure profile with varying volume of injected nitrogen gas
0
0.2
0.4
0.6
0.8
1
1.2
1.4
1.6
1.8
2
0 50 100 150 200 250
Re
star
t P
ress
ure
(B
ar)
Time taken to restart (s)
50 ml
0 ml
100 ml
150 ml

40
CHAPTER 5
CONCLUSION AND RECOMMENDATION
In this chapter, the conclusion with respect to this study is presented in detailed manner.
All the findings that was noted during the experiment is discussed as well. Future
improvements related to the study for future expansion is listed out and discussed.
5.1 Conclusion
In this present study, the experiment for characterization of restart pressure in a
production pipeline for waxy crude oil as a result of injection of non-reacting gas was
successfully conducted. The objective of this work have been achieved, as implied by the
reduction in restart pressure for every run conducted. The following were the findings
observed throughout the experiment.
i) The formation of gas voids was found mainly at the downstream side of the test
section. After the nitrogen gas was injected into the test section, right after the
crude oil stopped flowing, most of the nitrogen gas moves downstream. As the
crude oil cools down to the same temperature of the water bath, it was noted
that the gas voids were growing larger due to the effects of thermal shrinkage.
ii) In both cases where by the restart pressure was applied instantaneously and
gradually, it was found that the restart pressure needed in order to disintegrate
the gelled wax was reduced at most by 11.48% at water temperature of 20ºC
and 17.44% at water temperature of 25ºC respectively. This was largely due to
the effects of compressibility of the gelled wax as there was space for the wax
to move when a pressure was applied.
iii) The restart pressure needed in order to resume flowing condition through
gradual restart pressure approach was found to be higher as compared to
instantaneous pressure approach as the gradual pressure build up was needed in
order to overcome the adhesive strength of the gelled wax.
iv) In both instantaneous and gradual restart pressure approach, it was found that
restart pressure was reduced as the gas to oil volume ratio increases. This was
due to the high volume of voids created by the nitrogen gas and causes the

41
gelled wax to compress even more when pressure was applied through
displacing fluid.
In essence, it was proven that the injection of nitrogen gas into the pipeline during static
cooling, prior to gelation is able to reduce the restart pressure. This can be significant as
oil and gas operators are able to save more cost on capital expenditure (CAPEX) and
operating expenditure (OPEX) during the designing stage of the pipeline. Production
pipeline that is currently in service would have a reduction in terms of its specific material
yield stress (SMYS) and therefore would not be able to support high pressure due to
corrosion and erosion activity that occurs during operation. If pressure applied is beyond
the pipeline’s SMYS, the chances that the pipeline would burst is significantly increased.
Since it was proven through the study conducted that gas intrusion is able to reduce the
restart pressure needed, it provides an assurance to pipeline operators that chances of
pipeline will burst is reduced during a restart operation.
5.2 Recommendation
The study conducted can be carried out in the future with further expansions as the
experiment conducted is only limited to water temperature of 20ºC, 25ºC and 30ºC. The
following recommendations can be used in order to further expand this study in the future.
i) It was found during the experiment that if the water temperature is lower than
20ºC, the restart pressure needed is greater than 2 bar which is the maximum
allowable pressure of the test section. During the experiment, it was noted that
gas bubbles will start to leak out at the upstream part of the test section causing
leakage of crude oil. It is proposed in further study that the material of the test
section is substituted with aluminium as it is able to with stand higher pressure.
ii) The gas injection site was done at the upstream side, which is beyond the test
section rather than on the test section itself. This causes problems as the
nitrogen gas injected might not enter the test section completely and some of
the gas might be trapped within the pipping. Due to this, there is an irregularity
when trying to recorded the restart pressure that is needed in order to
disintegrate the gelled wax within the test section. It is proposed in further
studies that the gas injection site is done on the test section itself, and the gas

42
being injected radially along the wall of the test section. This is to ensure that
all of the injected gas will be confined to the test section.
iii) A gas bleeding system might need to be implemented within the test rig so as
to remove any remaining gas that was injected in previous experiment run.
There were difficulties in obtaining the restart pressure as previously injected
gas was still present within the pipping and test section of the pipeline. This
produces an inaccurate reading when all the experiment runs were repeated.
iv) For this particular study, the crude oil is subjected to static cooling under
quiescent conditions. It is proposed in further study that crude oil can be cooled
gradually, in which it will lead to a complete no flow condition.

43
REFFERENCES
Ahmad, Mohd Fadzly (2012). Study of Thermal Shrinkage of Waxy Crude Oil in
Production Pipeline. Final Year Project. Universiti Teknologi PETRONAS.
Bomba. J (1986, January,28-31). Offshore Pipeline Transport of Waxy Crude Oils. Paper
presented at Offshore South East Asia Conference and Exhibition. Singapore
Cazaux .G, L. Barr_e, F. Brucy, Waxy Crude Cold Start: Assessment Through Gel
Structural Properties, SPE-49213, SPE Annual Technical Conference and
Exhibition, New Orleans, Louisiana, 27-30 September, 1998.
Chang, C.; Boger, D. V.; Nguyen, Q. D. The yielding of waxy crude oils. Ind. Eng. Chem.
Res. 1998, 37, 1551−1559.
Chang, C., Boger, D.V., Nguyen, Q.D., 2000. SPE Journal 5, 148–157.
Chala, G. T., Sulaiman, S. A., Japper-Jaafar, A., Kamil Wan Abdullah, W. A., and Mior
Mokhtar,M. M. (2014). Gas void formation in statically cooled waxy crude oil.
International Journal of Thermal Sciences, 86, 41-47.
Davidson, M. R., Dzuy Nguyen, Q., Chang, C., and Rønningsen, H. P. (2004). A model
for restart of a pipeline with compressible gelled waxy crude oil. Journal of non-newtonian
fluid mechanics, 123(2), 269-280.
Davenport, T. C.; Somper, R. S. H. The yield value and breakdown of crude oil gels. J.
Inst. Pet. 1971, 57, 86−105.
Fossen, M., Øyangen, T., and Velle, O. J. (2013). Effect of the Pipe Diameter on the Restart
Pressure of a Gelled Waxy Crude Oil. Energy & Fuels, 27(7), 3685-3691.
Greiner, C., Campo, A and Arzt, E. (2007). Adhesion of Bioinspired Micropatterned
Surfaces: Effects of Pillar Radius, Aspect Ratio and Preload. Langmuir. 23(7), 3495-3502
Hunt, A.: ‘‘Uncertainties Remain in Predicting Paraffin Deposition,’’ Oil Gas J. 94,
96~1996
Hamami.A and Raines. M.A (1999) “Paraffin Deposition from Crude Oils : Comparison
of Laboratory Results with Field Data”. SPE Journal(Vol 4)
Hénaut. I, Vincké, O. and Brucy, F. (1999). Waxy Crude Oil Restart: Mechanical
Properties of Gelled Oils. Presented at the SPE Annual Technical Conference and
Exhibition, Houston, Texas.
Karan, K., Ratulowski, J., and German, P. (2000, January). Measurement of waxy crude
properties using novel laboratory techniques. In SPE Annual Technical Conference and
Exhibition. Society of Petroleum Engineers.

44
Lee, H. S., Singh, P., Thomason, W. H., and Fogler, H. S. (2007). Waxy oil gel breaking
mechanisms: adhesive versus cohesive failure. Energy & Fuels, 22(1), 480-487
Livescu. S, Mathematical modeling of thixotropic drilling mud and crude oil flow in wells
and pipelinesda review, J. Petroleum Sci. Eng. 98e99 (2012), 174-184.
Mehta, A. P., Zabaras, G. J., Schoppa, W and Peters, D.J (2004, May, 3-6). Unlocking
Deepwater Oil Reserves – A Flow Assurance Perspective. Paper presented at Offshore
Technology Conference. Houston, Texas.
Misra. S, Baruah. S and Singh. K (1995). Paraffin Problems in Crude Oil Production And
Transportation: A Review. SPE Production & Facilities, Oil & Natural Gas Corp, Ltd.
Newfield Exploration, Malaysia: Newfield to accelerate offshore Est Belumut field Phase
2 Development. (2007). Retrieved April 10, 2016 from http://www.energy-
pedia.com/news/malaysia/newfield-to-accelerate-offshore-east-belumut-field-phase-ii-
development
Noxerior, Nitrogen Supply for Applications in the Oil & Gas Industry. (n.d). Retrieved
March 1, 2016 from http://www.noxerior.com/applucations/n2-applications/oil-gas.html
Phillips, D. A.; Forsdyke, I. N.; McCracken, I. R.; Ravenscroft, P. D. Novel approaches to
waxy crude restart: Part 2: An investigation of flow events following shut down. J. Pet.
Sci. Eng. 2011, 77, 286−304
Rønningsen, H.(1991) Wax Precipitation from North Sea Crude Oils Ph.D. Thesis, Statoil,
University of Oslo
Ragbir S. (2014). Offshore Installation of Technology of Puteri Heated Pipe-in-Pipe
System in Malaysia. Paper presented at Offshore Technology Conference Asia, Kuala
Lumpur.
Shock, D.A., Sudbury, J.D., and Crockett, J.J.: "Studies of the Mechanism of Paraffin
Deposition and Its Control," Journal of Petroleum Technology (Sept. 1955) 23.
Shafquet.A, Ismail.I, Jaafar.A (2013). Thermal Effect on void formation of waxy crude oil
using electrical capacitance tomography. Jurnal Teknologi. ISSN 0127-9696
Tiwary.D, A.K. Mehrotra, Phase transformation and rheological behaviour of highly
paraffinic ‘waxy’ mixtures, Can. J. Chem. Eng. 82 (2004).
Venkatesan. R, P.Singh, H. Fogler (2002). Delineating the pour point and gelation
temperature of waxy crude oils, SPE J, 7(4), 349
Vinay. G, Wachs, A. and Frigaard, I. 2007. Start-up Transients and Efficient Computation
of Isothermal Waxy Crude Oil Flows. Journal of Non-Newtonian Fluid Mechanics. 143:

45
141–156.
Venkatesan, R., Nagarajan, N. R., Paso, K., Yi, Y. B., Sastry, A. M., & Fogler, H. S. (2005).
The strength of paraffin gels formed under static and flow conditions. Chemical
engineering science, 60(13), 3587-3598.
Wardhaugh, L. T.; Boger, D. V. The measurement and description of the yielding
Behaviour of waxy crude oil. J. Rheol. 1991,35, 1121−1156.
Zakaria, A.K., Sulaiman, S.A and Japper-Jaafar, A. (2014). Intrusion of Inert Gas into
Production Pipeline of Waxy Crude Oil to Ease Restart Pumping. Final Year Project
Dissertation. Universiti Teknologi PETRONAS.

46
APPENDICES
Appendix 1 Physical and Chemical Properties of Nitrogen
Appendix 2 Detailed Component Specifications of Waxy Crude Oil Flow Loop
Appendix 3 List of Components for Nitrogen Gas Injection System
Appendix 4 List of Calculations

47
Appendix 1: Physical and Chemical Properties of Nitrogen
Chemical Formula N2
Molecular Weight 28.01
Boiling Point @ 1 atm -320.5
Freezing Point @ 1 atm -346
Critical Temperature -232.5
Critical Pressure 492.3 psia
Density, Gas @ 68 ºF (20ºC), 1 atm 0.0725 lb/scf
Specific Gravity, Gas @ 68 ºF (20ºC), 1 atm 0.97
Specific Volume Gas @ 68 ºF (20ºC), 1 atm 13.80 scf/lb
Latent Heat of Vaporization 2399 Btu/lb mole
Expansion Ratio, Liquid to Gas, Boiling Point to 68 ºF (20ºC) 1 to 694

48
Appendix 2: Detailed Component Specifications of Waxy Crude Oil Flow Loop

49

50
Appendix 3: List of Components for Nitrogen Gas Injection System

51
Appendix 4: List of Calculations

52
i) Calculation for period of valve opening time
a) For 50 mL
𝑡𝑣 = 50 𝑚𝐿
(1 𝐿𝑃𝑀 𝑥 1000
60)
∴ 𝑡𝑣 = 3 sec
b) For 100 mL
𝑡𝑣 = 100 𝑚𝐿
(1 𝐿𝑃𝑀 𝑥 1000
60)
∴ 𝑡𝑣 = 6 sec
c) For 150 mL
𝑡𝑣 = 150 𝑚𝐿
(1 𝐿𝑃𝑀 𝑥 1000
60)
∴ 𝑡𝑣 = 9 sec
ii) Calculation for cooling rate of crude oil
a) For 30 ºC
𝐶𝑎𝑣𝑔 = 40 º𝐶
60 𝑚𝑖𝑛
∴ 𝐶𝑎𝑣𝑔 = 0.667 º𝐶/𝑚𝑖𝑛
b) For 25 ºC
𝐶𝑎𝑣𝑔 = 45 º𝐶
60 𝑚𝑖𝑛
∴ 𝐶𝑎𝑣𝑔 = 0.75 º𝐶/𝑚𝑖𝑛
c) For 30 ºC
𝐶𝑎𝑣𝑔 = 40 º𝐶
60 𝑚𝑖𝑛
∴ 𝐶𝑎𝑣𝑔 = 0.8733 º𝐶/𝑚𝑖𝑛
iii) Calculation for % difference
a) Instantaneous Restart Approach
1) For 30 ºC
%𝑃𝑟 = [(0.047)
1.415] 𝑋 100%
∴ %Pr = 3.32 %\
2) For 25 ºC
%𝑃𝑟 = [(0.098)
1.569] 𝑋 100%
∴ %Pr = 6.27 %
3)For 20 ºC

53
%𝑃𝑟 = [(0.205)
1.785] 𝑋 100%
∴ %Pr = 11.48 %
b) Gradual Restart Approach
1) For 30 ºC
%𝑃𝑟 = [(0.139)
1.49] 𝑋 100%
∴ %𝑝𝑟 = 9.33 %
2) For 25 ºC
%𝑃𝑟 = [(0.316)
1.92] 𝑋 100%
∴ %𝑝𝑟 = 17.44 %
3)For 20 ºC
%𝑃𝑟 = [(0.219)
2.077] 𝑋 100%
∴ %𝑝𝑟 = 10.54 %
iv) Calculation of test section volume
𝑉𝑡 = 𝜋0.0321.2
4
∴ 𝑉𝑡 = 8.4823 𝑥 10−4 m2 or 848 mL
v) Calculation of Gas to Oil Ratio
i) For 50 mL
𝑅𝐺𝑂=
50 𝑚𝐿
848 𝑚𝐿
∴ 𝑅𝐺𝑂=0.05894 ii) For 100 mL
𝑅𝐺𝑂=
100 𝑚𝐿
848 𝑚𝐿
∴ 𝑅𝐺𝑂=0.11792 iii) For 150 mL
𝑅𝐺𝑂=
150 𝑚𝐿
848 𝑚𝐿
∴ 𝑅𝐺𝑂=0.17688


