
1
Chapter 13Air Pollution
Chapter Outline
•Historical Perspective•Sources and Types of Air Pollution
Smog•Trends in Air Quality•Meteorological Factors Affecting •Acid Precipitation
Signs of prosperity
Air Pollution – Meteorology
•weather conditions influence the dilution and dispersal of air pollutants
•air pollution effects weather and climate

2
Air Pollution – Meteorology
•Air Pollution Episodes or Events
often occur when there is no major change in the output of contaminants
•Quantity of contaminants emitted into the atmosphere
•Atmospheric conditions promote pollution events
Air Pollution: continuing threat to our health and welfare
•Average adult male
•30 lbs of air/day
•2.6 lbs of food/day
•4.4 lbs of water/day

3
Dust Bowl, Kansas 1937
Historical Perspective
•Air is never perfectly clean
•Natural sources of pollution have always existed
(ash, salt particles, pollen, spores, smoke from forest and brush fires, wind blown dust etc.)
•Humans accentuate natural pollution
• Tribes were partly nomadic to get away from their wastes-animal, vegetable and human
• Fire without chimneys• Products of incomplete combustion inside
living quarters
Historical EpisodesBefore the Industrial Revolution
4
• Chimney removed combustion products from inside to outside
• 61 A.D. Rome; Philosopher Seneca: “as soon as I had gotten out of the heavy air of Rome and the stink of the smoky chimneys…which poured forth ..pestilential vapors and soot…I felt an alteration of my disposition
Historical EpisodesBefore the Industrial Revolution
• 1784—Watt’s steam engine; boilers to burn fossil fuels (coal) to make steam to pump water and move machinery
• Smoke and ash from fossil fuels by powerplants, trains, ships: coal (and oil) burning = smoke, ash
• British Parliament studies 1819 1843 1848 1866 1875= lots of dirty air, nothing was done
Historical EpisodesThe Industrial Revolution

5
Smoke Abatement Era-U.S. 1880-1940’s
• No penalties for violations in early laws• Smoke abatement ordinances, stricter laws
starting in 1940’s with penalties• Natural gas = clean fuel• A. Ore Smelting Era 1900-1930’s
CuS + O2 = Cu +SO2 (SO3) same for Pb, Zn and Ni (pollutant)
• B. 1900—Electricity (Powerplant) + CARS
Disaster Era—1930’s--???
• A. Meuse Valley, Belgium, 1930• 1st modern air pollution disaster• River valley, densely populated• Highly industrialized• Winter, high barometric pressure• Thermal temperature inversion

6
Meuse Valley, Belgium, 1930
• 63 died (mostly elderly)• Sore throats, shortness of
breath, cough, phlegm, nausea, vomiting
• SO2, sulfur dioxide• H2O• SO4 sulfuric acid mist• Cattle, birds and rats died• Got little news coverage
Donora, Pennsylvania—Oct. 1948
• Monongahela River Valley• Industrial town—steel mill,
sulfuric acid plant, freight yard, etc.
• Population—14,000• Steep hills surrounding the
valley• Oct 26—temperature inversion
(warm air trapping cold air near the ground)
• Stable air, fog, lasted 4.5 days

7
1. 6000 people became ill2. 20 people died3. U.S. Public Health Service called in– first time air
pollution officially recognized as potential public health problem
4. Sulfur gases + particulates, sulfuric acid mist
Donora, Pennsylvania—Oct. 1948
Historical EpisodesLondon
December 19525-day event4000 deadAdditional events in 53 and 62
Combination of unusually cold period, coal burning, and stable atmospheric conditions under a high pressure system

8
Historic smog death toll risesaken from the BBC: Thursday, 5 December, 2002
Officials believe that as many as 12,000 people may have died in the great London smog of 1952.
Death toll "The interesting thing is that no one realized at the time that the no of deaths were increasing," he told the BBC. "There weren't bodies lying around in the street and no one really noticed that more people were dying."
"One of the first indications was that undertakers were running out of coffins and florists were running out of flowers. The number of deaths per day during and just after that smog were three to four times the normal."

9
World-wide Air Pollution Episode
• November 27-December 10, 1962• Thousands of excess deaths in many cities
including NYC, London, Boston, Paris
Bhopal, India Dec. 3, 1984• Union Carbide pesticide plant leak kills
up to 2,000 with up to 350,000 injured and 100,000 with permanent disabilities
• Methyl isocyanate (MIC)—used as an intermediary in manufacture of Sevin(Carbaryl)
• CO + Cl = phosgene• Phosgene + methylamine = MIC• MIC—irritant to the lungs---edema, fluid
(cause of death, bronchospasms, corneal opacity
• Hydrogen cyanide?• Sabotage or industrial accident?

10
Similarities among Disasters
• Winter months• Dense population• Heavy industrialization• Often valley• Temperature inversion• Stagnant air• Accident, or mixtures from non-accidents
Sources and Types of Air Pollution
Air pollutants: airborne particles and gasses that occur in concentrations that endanger the health and well-being of organisms or disrupt the orderly functioning of the environment
Primary pollutants: emitted directly from identifiable source
Secondary pollutants: produced in the atmosphere through chemical reactions

11
Sources and Types of Air Pollution
Primary pollutants:
Point sources factories, power plants
Mobil sources transportation, lawn mowers etc.
Biogenic sources all nonanthropogenic sources (trees, vegetation, gas seeps etc.)
Area sources small and individual sources (dry cleaners)
12
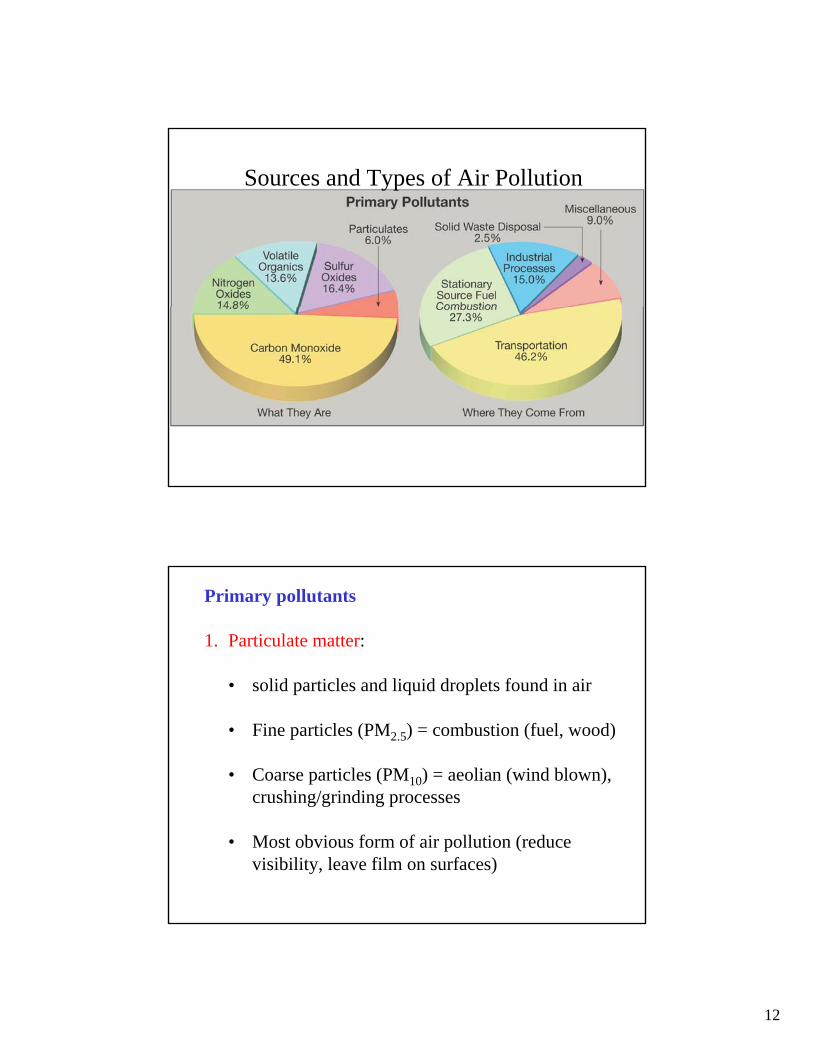
Sources and Types of Air Pollution
Primary pollutants
1. Particulate matter:
• solid particles and liquid droplets found in air
• Fine particles (PM2.5) = combustion (fuel, wood)
• Coarse particles (PM10) = aeolian (wind blown), crushing/grinding processes
• Most obvious form of air pollution (reduce visibility, leave film on surfaces)
13
Primary pollutants
2. Sulfur Dioxide (SO2):
• Colorless, corrosive gas
• Combustion of sulfur-containing fuels (coal, oil)
• Acid precipitation (H2SO4)
• Reduced lung function (short-term exposure)
Primary pollutants
3. Nitrogen Oxides (NOx):
• High-temperature Combustion (power plants, motor vehicles)
• Acid precipitation (HNO3)
• Smog Formation

14
Primary pollutants
4. Volatile Organic Compounds (VOC):
• Hydrocarbons (carbon and hydrogen)
• Methane (CH4)
• Incomplete combustion of gasoline
• React with NOx to form secondary pollutants
Primary pollutants
5. Carbon Monoxide (CO):
• Colorless, odorless, poisonous
• Incomplete burning of carbon in fuels
• Most abundant primary pollutant

15
Primary pollutants
6. Lead (Pb):
• Industrial sources
• Automotive sources (leaded gasoline)
• Bio-accumulates in blood, bones, soft tissues
• Damages nervous systems (children high risk)
Secondary pollutantsform as a result of reactions between primary pollutants (acid
precipitation, smog)
Smog: 1905 “smoke” & “fog”
a. London, “Classical” (coal burning, high humidity: smoke and sulfur dioxide)
b. Los Angeles “Photochemical”Sunlight triggers secondary reactions Ozone major component of photochemical smog

16
densely populated cities or urban areas, such as London, New York, Los Angeles, Mexico City, Houston, Toronto, Athens, Beijing, Hong Kong
Singapore
NYC
San Francisco

17
Secondary pollutants
• Ozone-photochemical smog-formation limited to daylight hours
acute: reactions within hours/days-decreased lung function-chest pain
chronic: gradual deterioration (O) years-premature aging of lungs-reduction in agricultural crop and commercial forest yields-overall weakening of forest ecosystems (disease, growth, reproduction)
Trends in Air Quality- economic activity- population growth- meteorological conditions- regulatory efforts
Clean Air Act 1970 Est. EPA
Great Depression WWII, Baby Boomers Drive

18
Clean Air Act of 1970
ParticulatesSulfur dioxideCarbon monoxideNitrogen oxidesOzoneLead (added later)
criteria pollutantsNational Ambient Air Quality Standards (Table 13-3)
Example Calculation:
CO 9 ppm 8-hr average
35 ppm 1-hr average
Comparison of 1970 & 2001 Emissions
1970 223 million tons
2001 170 million tons
24% Reduction
Keep In Mind
Population Increase
Miles driven/yr

19
Comparison of 1970 & 2001 Emissions
1970 223 million tons
2001 170 million tons
24% Reduction
Keep In Mind
Population Increase
Miles driven/yr
Population exposed to air below National Ambient Air Quality Standards in 2001
133 million people
Ozone most severe pollution problem
Indoor Air Pollution
Smoke, radon gas, formaldehyde
20% of US buildings are “sick”

20
Meteorological Factors Affecting Air Pollution
Wind: dilution of pollutants
Atmospheric stabilitySurface temperature inversionsInversions aloft

21
Wind Speed and Dilution of Pollutants
Pollution burst from stacks each second
Pollution Episodes more common during calm atmospheric conditions
High wind speed = more turbulent air = rapidly mixed with non-polluted air
Atmospheric stability
-determines the extent to which vertical motions will mix the pollution with cleaner air above
-Mixing depth = vertical distance between Earth’s surface and the height to which convectional movements extend
thick mixing depth = cleaner air
Stable air suppresses convectional motions
absolute stability: environmental lapse rate is less than the adiabatic wet rate

22
Atmospheric stability
-Mixing depth = greatest during summer ‘intense solar heating’
-Winter stability enhanced by temperature inversions
Atmospheric stability
-Mixing depth = greatest during summer ‘intense solar heating’
-Winter stability enhanced by temperature inversions
Los Angeles smog on 29 January 2004

23
Mesoscale
Country Breeze:
Urban heat island leads to warmer temps at night
Air moves from surrounding country side to city
Traps pollutants in the center of the city
Atmospheric stabilityInversions aloft

24
Acid Precipitation (Sulfur & Nitrogen Oxides)
Extent and potency of acid precipitation
Effects of acid precipitation
Precipitation pH ranges between 5 - 6
Acidity of Precipitation

25
Effects of Acid Precipitation
Human: upper respiratory deterioration, bronchitis among children
Environment: pH increase in lakes, leaching of toxins from soils, fish die off, reduction in crop yields, impair forest productivity
Stacks enhance travel of pollutants


