CHAPTER IV
THE GANDHIGRAM SERVICE VILLAGES: A PROFILE
Introduction
In the last three chapters, the background for the problem of analysis has
been created first by providing a statement of the problem under study, the
objectives and the methodology, second by building an overview of the Indian
Rural Energy Systems and then by a brief but comprehensive review of the
existing literature. In the present chapter, it is the context that the discussion is
concerned about. The context is the study area, which provides the geographical
background for the analysis and the interpretation that follow.
About Gandhigram
Gandhigram was founded in the year of India's independence (1947), by
a team of dedicated disciples of Mahatma Gandhi, led by Dr. T.S. Soundaram and
Dr. G. Ramachandran. Gandhigram Rural Institute (GRI) was started in 1956, as
the higher education centre in Gandhigram, patterned after Gandhi's concept of
'basic education'.
GRI, one of the 14 Rural Institutes of higher education, functioned under
the Central Government's programme to carry higher education to the doorsteps
of the village community. After 20 years of active work in promoting education
through rural experiences, the Government of India, on the recommendation of the
122
123
University Grants Commission (UGC), New Delhi, conferred the status of Deemed
University on GRI in 1976.
Today, GRI has carved for itself a niche in the rural higher education map
of India and the developing world. GRI is fully funded by the Ministry of Human
Resources Development, New Delhi through University Grants Commission.
Students are drawn from various States and Union Territories of the Indian Union
and the developing countries.
The borad objectives of the GRI are:
1. To provide for instruction and learning and to promote a casteless and classless society.
2. To provide for research and advancement and dissemination of knowledge.
3. To function as a centre for extension work leading to integrated rural development.
GRI has been working in the villages of Dindigul district. The extension
programmes have been in operation in some select villages of the district, which
have been adopted by the GRI to demonstrate the usefulness of its programmes
of research and extension. The extension programme in the villages include
creche, women's fora, children's fora, science clubs, farmers' fora, youth clubs,
peace committees, planning committees, self-help groups, people's education
centres. Various programmes are sponsored through the people's organisations
in the spheres of farming, cattle rearing, non-farm activities, forestry, energy uses,
environment, pre-school and non-formal education, sanitation, health and hygiene,
nutrition and family welfare.
The impacts generated among the people of the 37 service villages are:
Greater awareness among people, greater income generating skills in women,
124
higher enrolments at all levels of education, low drop out rates, greater girls'
enrollment, better health and nutritional status among pre-school children, low
incidence of child labour, improved leadership qualities, better status of women,
increased farming knowledge and technology adoption, added social
infrastructures, enriched rural resources, and greater utilisation of government
programmes by poorer families.
The profile constructed of the six villages, chosen for study, in this chapter,
quite clearly, depends on both the secondary and primary sources of information.
Demographic details (population and related matters), some of the salient
geographical features (location, climate, and water resources) and economic
details (land use patterns, energy uses, basic amenities, and services) have been
gleaned from the secondary and documentary sources. On the other hand, energy
and energy use related details have been taken from the primary sources, that is,
the village respondents. The insights gathered from two sets of data, one from the
200 respondents (152 belonging to both household and agricultural sectors; 48
households of landless labourers) of the field survey and the other from the people
who belonged to other sectors (industry, transport, commercial and services
sectors), that is, all those who worked in the four sectors in the six Gandhigram
Service Villages in the Dindigul taluk, Dindigul district of Tamil Nadu, are
summarised in this chapter to provide a comprehensive profile of the villages and
their people.
Location
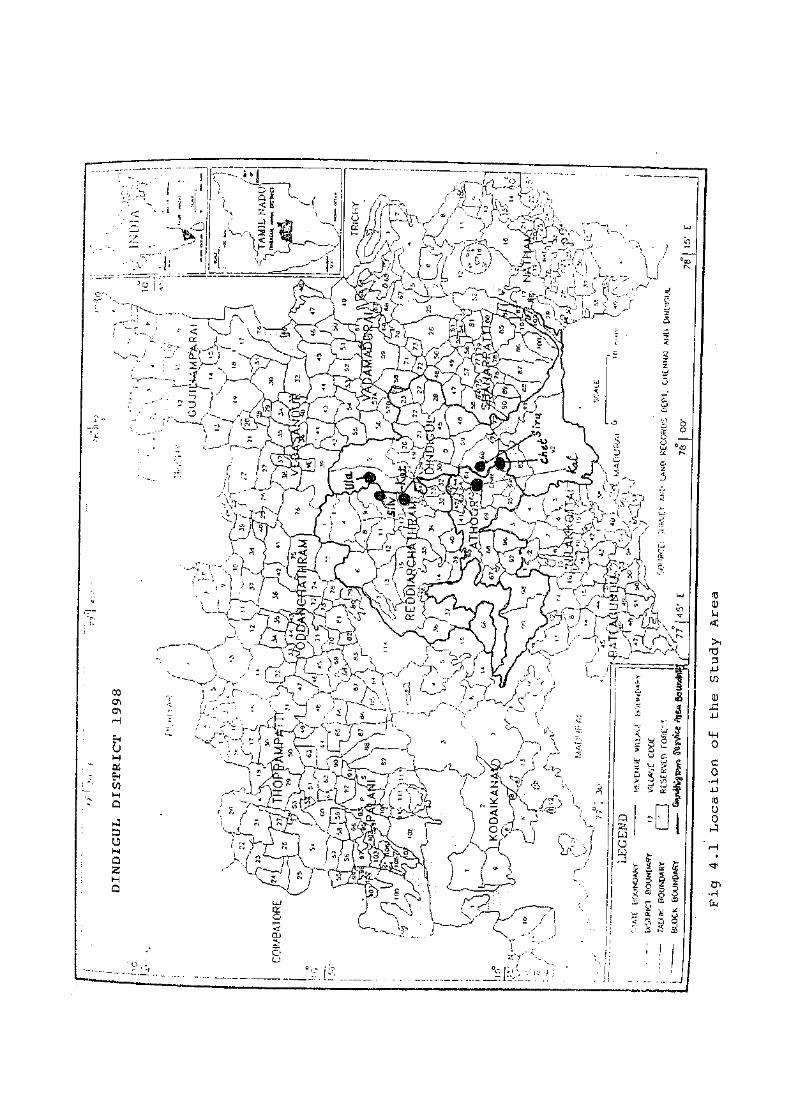
The geographical location of the study area can be appreciated from the
map in Figure 4.1, and the villages studied are as follows:
125
1. Chettiapatti, Athur Block;
2. Kalikkampatti, Athur Block;
3. Sirunaickenpatti, Dindigul Block;
4. Ulagampatti, Dindigul Block;
5. Kuttathupatti, Reddiarchatram Block; and
6. Silvarpatti, Reddiarchatram Block.
The villages are in two contiguous patches of three villages each. They
have been adopted by the GRI under its rural development programmes. The six
villages are so chosen as to belong to different development blocks, with 2 villages
each from three different blocks: Athur, Dindigul and Reddiarchatram. The
geographical location of the villages is within the area defined by 10° 05' N to 10°
9' N latitudes and 11° 30' E to 18° 20' E longitudes. Dindigul district, where the
villages are located, is bounded by Tiruchirappalli district on the east, Coimbatore
district and Kerala State on the west, Erode and Karur districts on the north and
Madurai district on the south. The district has a total area of 6,267 km2. It consists
of 7 taluks and 14 development blocks, under 3 revenue divisions.
Site and Situation
The villages of Chettiapatti and Kalikkampatti are in Athur Block,
Sirunaickenpatti and Ulagampatti are in Dindigul Block, and Kuttathupatti and
Silvarpatti are in Reddiarchatram Block. The average distance between thevillages
and their block headquarters is a mere 8 km.
The six villages, in the matter of energy, use both commercial and non
commercial sources of energy, whatever may be its form. The villages use only
popular forms of energies. They are also trying to familiarise themselves with the

126
non-conventional energies such as bio-gas and biomass. As the villages have an
already functioning small industrial, commercial and basic institutional set up, they
also use commercial energies such as electricity and petroleum in their day-to-day
life. Their use of human and animal power, firewood, agricultural residues in the
household, farming and small transport sectors is an everlasting event: these will
continue to have a sway over the rural population. There is however a need to
focus on the management of the energy resources in these villages and the
difficulties the village population faces upto.
Physiography, the Land Mosaic
The slope of the land is from west to east and also southeast. In general,
the topography is undulating in nature. Soil is the basic determinant of land uses.
Red and black cotton soils are predominant in the entire study area, providing a
congenial atmosphere for dry land cultivation. This is not simultaneously'prevalent
in other areas suitable for agricultural operations.
Climate
Temperature. The mean maximum temperature of the locality is 35.6° C
and the mean minimum temperature is 30.5° C. The months of December and
January are the coolest while May is the hottest month during the year. The area
is semi-arid and therefore dry. This is because of its location in the rain shadow.
The distribution of temperature is such that the study area is hot throughout the
season, as the maximum temperature declines to a low of 30.5° C in the month
of December and then begins to climb through the year to peak in May.
127
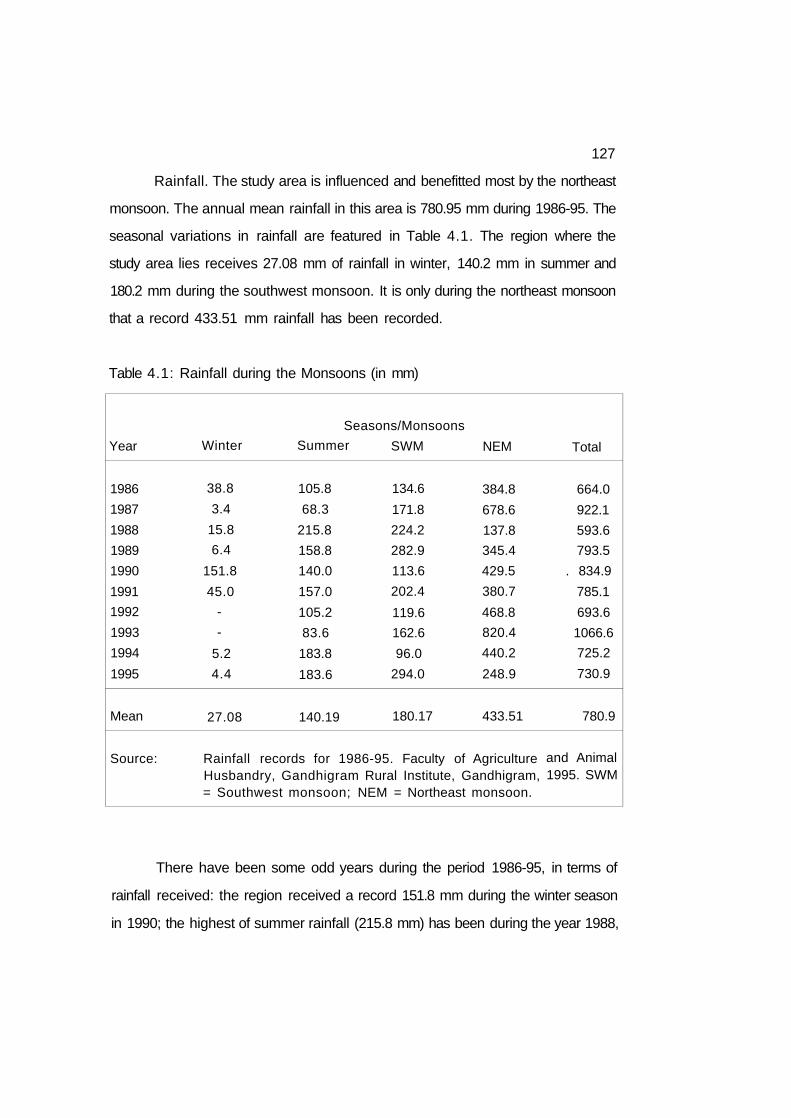
Rainfall. The study area is influenced and benefitted most by the northeast
monsoon. The annual mean rainfall in this area is 780.95 mm during 1986-95. The
seasonal variations in rainfall are featured in Table 4.1. The region where the
study area lies receives 27.08 mm of rainfall in winter, 140.2 mm in summer and
180.2 mm during the southwest monsoon. It is only during the northeast monsoon
that a record 433.51 mm rainfall has been recorded.
Table 4.1: Rainfall during the Monsoons (in mm)
Year
1986
1987
1988
1989
1990
1991
1992
1993
1994
1995
Mean
Source:
Winter
38.8
3.4
15.8
6.4
151.8
45.0
-
-
5.2
4.4
27.08
Seasons/Monsoons
Summer
105.8
68.3
215.8
158.8
140.0
157.0
105.2
83.6
183.8
183.6
140.19
SWM
134.6
171.8
224.2
282.9
113.6
202.4
119.6
162.6
96.0
294.0
180.17
NEM
384.8
678.6
137.8
345.4
429.5
380.7
468.8
820.4
440.2
248.9
433.51
Rainfall records for 1986-95. Faculty of Agriculture Husbandry, Gandhigram Rural Institute, Gandhigram, = Southwest monsoon; NEM = Northeast monsoon.
Total
664.0
922.1
593.6
793.5
. 834.9
785.1
693.6
1066.6
725.2
730.9
780.9
and Animal 1995. SWM
There have been some odd years during the period 1986-95, in terms of
rainfall received: the region received a record 151.8 mm during the winter season
in 1990; the highest of summer rainfall (215.8 mm) has been during the year 1988,
128
while the highest of southwest (294 mm) and of northeast (820.4 mm) rainfalls
have been during the years of 1995 and 1996, respectively.
It is also found that no year is identical to any other, in the pattern of
rainfall, indicating that there are always some variations over the years, no matter
how long is the period of concern. The year 1993 has been a relatively copious
(1,067 mm) year when compared to other years and the year of least rainfall has
been that of 1988 (593.6 mm). Four out of ten years have recorded rainfall less
than the average for the ten-year period. The farmers store up their water during
the rainy months, so that they could cultivate suitable crops, coinciding with the
rainfall.
Wind Speed. The annual average speed of wind in the study area is 53.6
km/h. The minimum wind speed is 33 km/h which is normally recorded in the
months of December and January. The maximum wind speed is 80 km/h, which
occurs in the month of July which is the windiest of the months in the study area.
The minimum wind speed recorded in July is 62 km/h, which is the highest among
the minimum wind speeds. It is normal to have high wind speeds in the southwest
monsoon season (June-September). In the other seasons, the wind speeds are
milder. The winds that blow down the leewards of the Western Ghats cause such
speeds and they are normally hot and dry, because of the rain shadow. These
data are helpful to the farmers, showing how fast they must tap the wind energy
during the windiest times.
Population Distribution
According to the village profile constructed by the Gandhigram Rural
Institute in 1993, the population of the study area is 8,035, of which 4,171 (or 52
129
per cent) are males and 3,861 (48 per cent) are females spread over Chettiapatti,
Kalikkampatti, Sirunaickenpatti, Ulagampatti, Kuttathupatti and Silvarpatti villages.
The six villages put together have 2,002 households, and 12,680 ha of
geographical area. Chettiapatti is the smallest of the villages with 830 persons
while Sirunaickenpatti is the largest with 2,144 persons. Of the rural male
population, the largest of 1,113 is obviously in Sirunaickenpatti, followed by
Kuttathupatti with 689, Ulagampatti with 941, Kalikkampatti with 553, Chettiapatti
with 452, and Silvarpatti with 426, totalling 4,174. There is a corresponding and
similar pattern and order in terms of female population as well.
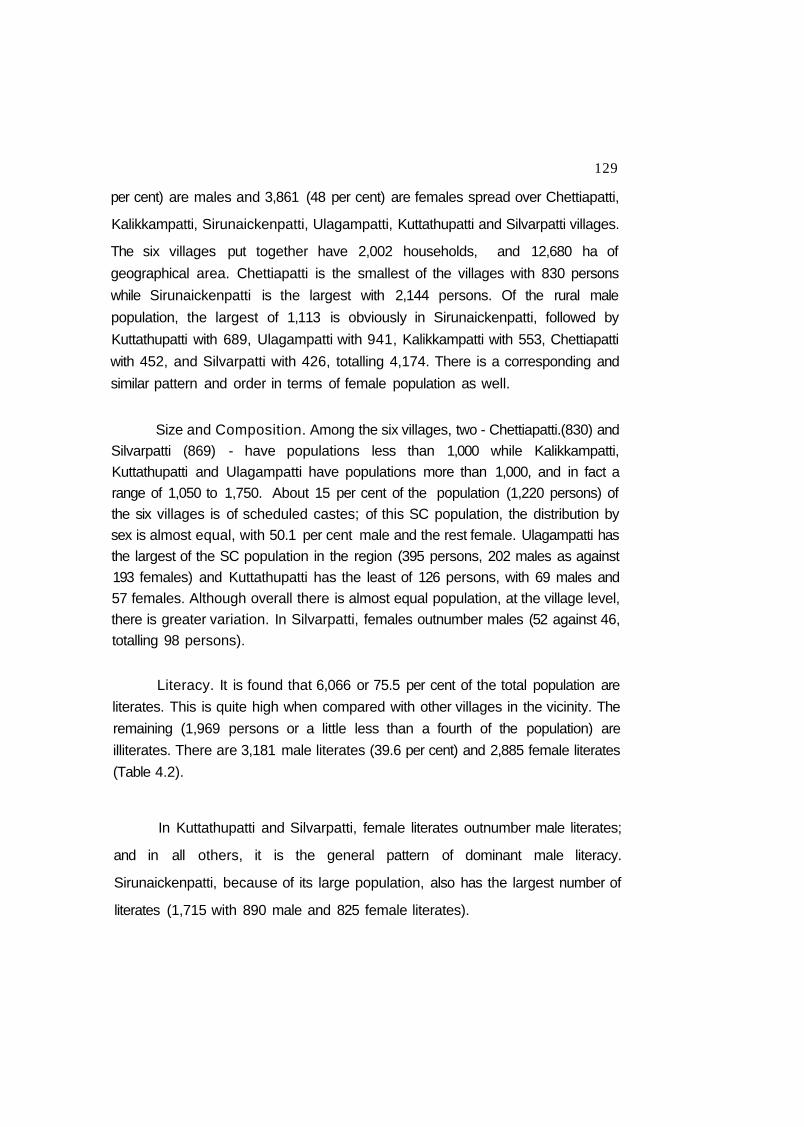
Size and Composition. Among the six villages, two - Chettiapatti.(830) and Silvarpatti (869) - have populations less than 1,000 while Kalikkampatti, Kuttathupatti and Ulagampatti have populations more than 1,000, and in fact a range of 1,050 to 1,750. About 15 per cent of the population (1,220 persons) of the six villages is of scheduled castes; of this SC population, the distribution by sex is almost equal, with 50.1 per cent male and the rest female. Ulagampatti has the largest of the SC population in the region (395 persons, 202 males as against 193 females) and Kuttathupatti has the least of 126 persons, with 69 males and 57 females. Although overall there is almost equal population, at the village level, there is greater variation. In Silvarpatti, females outnumber males (52 against 46, totalling 98 persons).
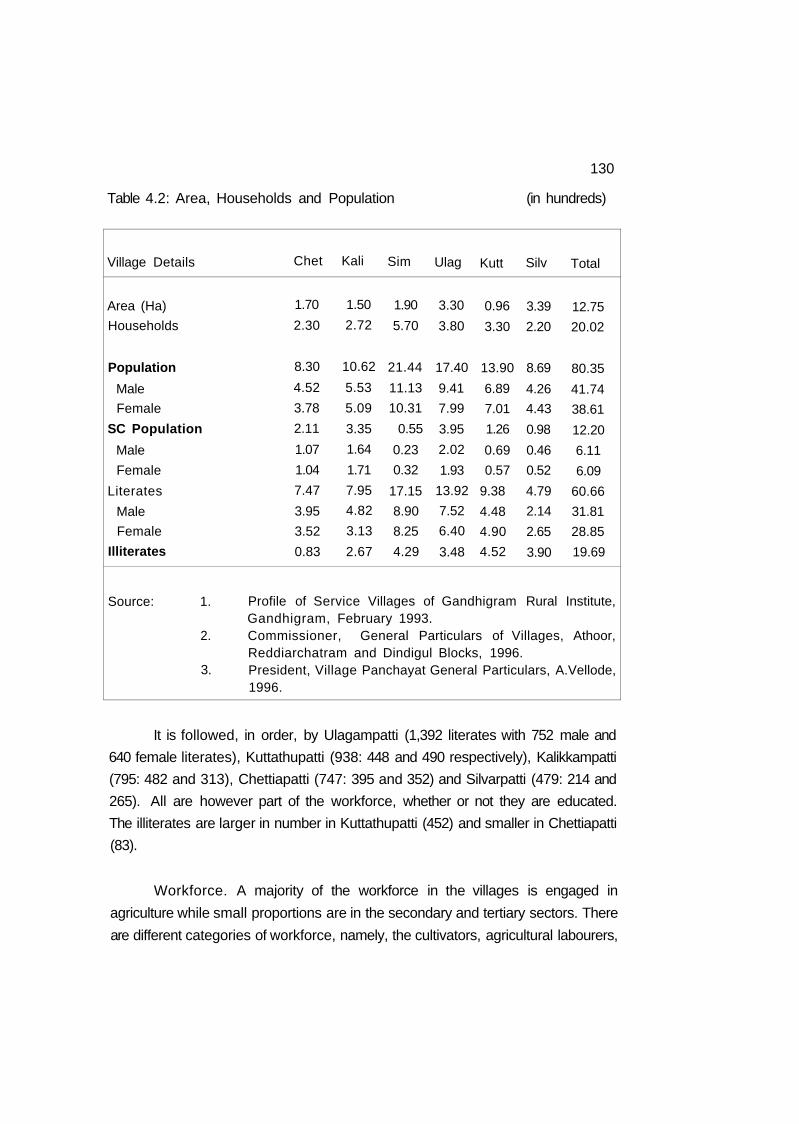
Literacy. It is found that 6,066 or 75.5 per cent of the total population are
literates. This is quite high when compared with other villages in the vicinity. The
remaining (1,969 persons or a little less than a fourth of the population) are
illiterates. There are 3,181 male literates (39.6 per cent) and 2,885 female literates
(Table 4.2).
In Kuttathupatti and Silvarpatti, female literates outnumber male literates;
and in all others, it is the general pattern of dominant male literacy.
Sirunaickenpatti, because of its large population, also has the largest number of
literates (1,715 with 890 male and 825 female literates).
130
Table 4.2: Area, Households and Population (in hundreds)
Village Details
Area (Ha)
Households
Population
Male
Female
SC Population
Male
Female
Literates
Male
Female
Illiterates
Source: 1.
2.
3.
Chet
1.70
2.30
8.30
4.52
3.78
2.11
1.07
1.04
7.47
3.95
3.52
0.83
Kali
1.50
2.72
10.62
5.53
5.09
3.35
1.64
1.71
7.95
4.82
3.13
2.67
Sim
1.90
5.70
21.44
11.13
10.31
0.55
0.23
0.32
17.15
8.90
8.25
4.29
Ulag
3.30
3.80
17.40
9.41
7.99
3.95
2.02
1.93
13.92
7.52
6.40
3.48
Kutt
0.96
3.30
13.90
6.89
7.01
1.26
0.69
0.57
9.38
4.48
4.90
4.52
Silv
3.39
2.20
8.69
4.26
4.43
0.98
0.46
0.52
4.79
2.14
2.65
3.90
Total
12.75
20.02
80.35
41.74
38.61
12.20
6.11
6.09
60.66
31.81
28.85
19.69
Profile of Service Villages of Gandhigram Rural Institute, Gandhigram, February 1993. Commissioner, General Particulars of Villages, Athoor, Reddiarchatram and Dindigul Blocks, 1996. President, Village Panchayat General Particulars, A.Vellode, 1996.
It is followed, in order, by Ulagampatti (1,392 literates with 752 male and
640 female literates), Kuttathupatti (938: 448 and 490 respectively), Kalikkampatti
(795: 482 and 313), Chettiapatti (747: 395 and 352) and Silvarpatti (479: 214 and
265). All are however part of the workforce, whether or not they are educated.
The illiterates are larger in number in Kuttathupatti (452) and smaller in Chettiapatti
(83).
Workforce. A majority of the workforce in the villages is engaged in
agriculture while small proportions are in the secondary and tertiary sectors. There
are different categories of workforce, namely, the cultivators, agricultural labourers,
mmmmmm
131
household industrial workers, and workers in manufacturing, processing, repairing
and other services. Table 4.3 shows the occupational structure of the population
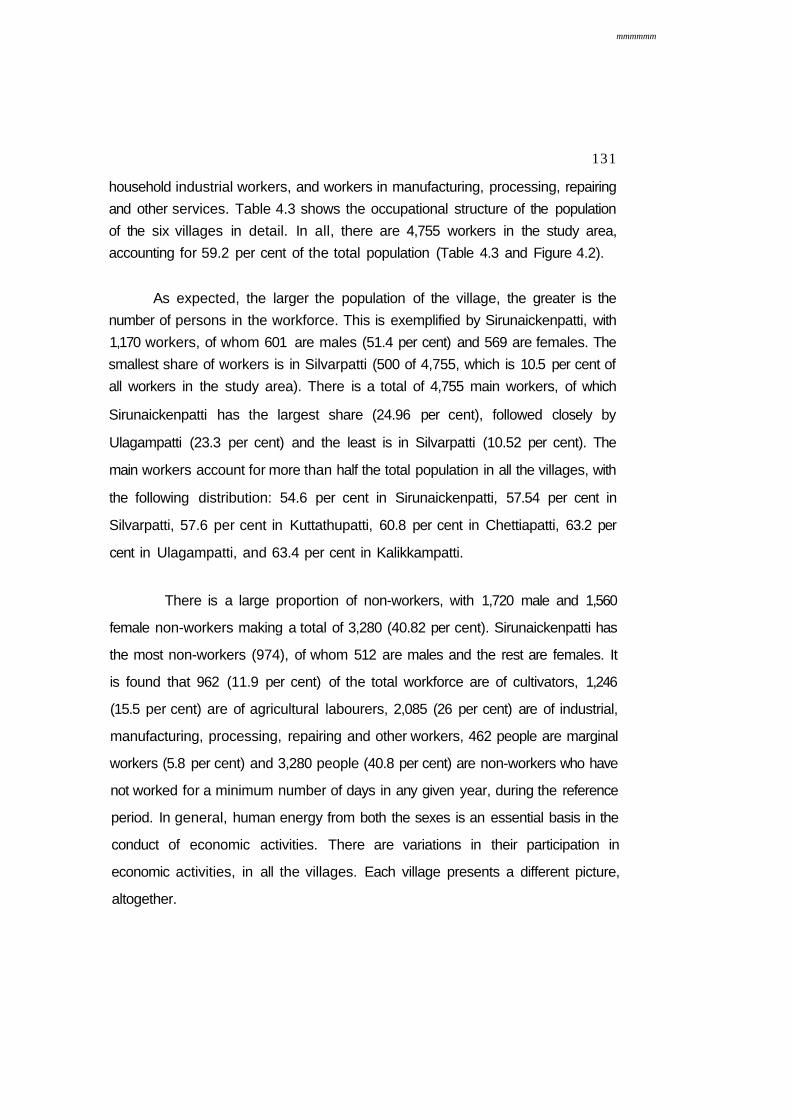
of the six villages in detail. In all, there are 4,755 workers in the study area,
accounting for 59.2 per cent of the total population (Table 4.3 and Figure 4.2).
As expected, the larger the population of the village, the greater is the
number of persons in the workforce. This is exemplified by Sirunaickenpatti, with
1,170 workers, of whom 601 are males (51.4 per cent) and 569 are females. The
smallest share of workers is in Silvarpatti (500 of 4,755, which is 10.5 per cent of
all workers in the study area). There is a total of 4,755 main workers, of which
Sirunaickenpatti has the largest share (24.96 per cent), followed closely by
Ulagampatti (23.3 per cent) and the least is in Silvarpatti (10.52 per cent). The
main workers account for more than half the total population in all the villages, with
the following distribution: 54.6 per cent in Sirunaickenpatti, 57.54 per cent in
Silvarpatti, 57.6 per cent in Kuttathupatti, 60.8 per cent in Chettiapatti, 63.2 per
cent in Ulagampatti, and 63.4 per cent in Kalikkampatti.
There is a large proportion of non-workers, with 1,720 male and 1,560
female non-workers making a total of 3,280 (40.82 per cent). Sirunaickenpatti has
the most non-workers (974), of whom 512 are males and the rest are females. It
is found that 962 (11.9 per cent) of the total workforce are of cultivators, 1,246
(15.5 per cent) are of agricultural labourers, 2,085 (26 per cent) are of industrial,
manufacturing, processing, repairing and other workers, 462 people are marginal
workers (5.8 per cent) and 3,280 people (40.8 per cent) are non-workers who have
not worked for a minimum number of days in any given year, during the reference
period. In general, human energy from both the sexes is an essential basis in the
conduct of economic activities. There are variations in their participation in
economic activities, in all the villages. Each village presents a different picture,
altogether.
Fig 4.2 - Workers and Non-Workers hv Village

132
Table 4.3: Major Workforce - Main Workers
Category
Cultivators
Male
Female
Agricultural Labour
Male
Female
Household Industry
and Others
Male
Female
Marginal Workers
Male
Female
Total
Non-workers
Male'
Female
Grand Total
Chet
65
60
76
94
107
78
10
15
505
194
131
830
Kali
75
59
100
113
135
104
35
52
673
208
181
1062
Sim
120
112
100
128
325
254
56
75
1170
512
462
2144
Villages
Ulag
135
126
120
150
315
175
37
49
1107
334
299
1740
Kutt
70
65
90
110
200
172
41
52
800
288
302
1390
Silv
40
35
75
90
110
110
17
23
500
184
185
869
Total
505
457
561
685
1192
893
196
266
4755
1720
1560
8035
Sources: As in Table 4.2 above.
Land Use Patterns
The current utilisation of land is such that the land may be classified as
wet, dry and waste lands. Dry land is far larger (755 ha) in area than wet land (56
ha), garden land (280 ha) and waste lands are just about 157 ha. In wet and dry
133
lands, both kharif and rabi crops are grown. These lands produce a variety of
woods and wood lots, for cooking and domestic purposes.
Cropping Pattern. The farmers of the study area are cultivators of paddy,
grapes, groundnut, coconut, flowers, vegetables, onion, and betel vines in their wet
lands. They also cultivate cereals (jowar, samai and bajra, these being the
millets)and pulses such as red gram, black gram, horsegram, and green gram in
their dry lands. Cotton is cultivated by them in the suitable seasons. Cereals,
pulses and vegetables are very essential and nutritious food items for human
survival in the villages, just as elsewhere.
Sources of Irrigation. In the Gandhigram Service villages, the farmers use
groundwater, from the wells, and the rain water for irrigation. They use open wells,
ponds and tanks for the purpose. There is neither tubewell nor canal for irrigation.
Animal Husbandry. Of the total livestock, 621 are milch, 375 are dry, 218
are not yet calved, 139 not fit for breeding, 20 are graded bullocks and 167 are
local bullocks. They provide much valuable dung which is used for cooking and
other domestic purposes, after some processing (Table 4.4).
Of the total livestock of 6,820 (large and small), 27.8 per cent accounts for
poultry birds (1,896), 32.73 per cent for sheep (2,232), 10.72 per cent for goats
(731), and the remaining of 28.75 per cent for cattle. The cattle population consists
of 621 milch cattle (9.1 per cent), 375 dry (5.5 per cent), 218 not yet calved (3.2
per cent), 139 unfit for milk and breeding (2.04 per cent) and 179 bullocks (2.62
per cent). The young stock of the cattle number 155 he-cattle and 274 she-cattle,
totalling 429 accounting for 6.3 per cent of all livestock.

Table 4.4: Livestock Population in the Study Area
134
Cattle
Milch
Large
Small
Dry
Large
Small
Uncalved
large
Small
Unfit for Milk and Breeding
Large Small
Bulls
Young Stock
Large: he-
Large: she-
Small: he-
Small: she-
Sheep
Goat
Poultry
Grand Total
Source:
Chet
60
18
10
11
18
4
84
10
26
40
8
7
1390
325
316
2327
Livestock Inspectors
Kali
57
52
27
13
19
16
7
2
21
8
26
3
10
158
49
184
652
Siru
231
34
167
9
53
6
11
1
70
13
65
1
7
72
41
320
1101
Villages
Ulag Kut
23
6
38
4
6
7
-
32
13
18
2
4
40
14
42
249
34
12
15
8
20
10
34
34
18
17
5
6
212
147
404
976
Silv
58
36
42
31
34
25
-
12
42
50
16
24
360
155
630
1515
Total
463
158
299
76 -
150
68
136
3
179
1-20
216
35
58
2232
731
1896
6820
Livestock Census for 1996-97, Sub-Centres -
Ambathurai, Alamarath
Thepakulathupatti, 1997.
jpatt i , Konur , Sukkampatti and
135
Chettiapatti alone has 2079 small stock and 248 large stock, totalling
2,327 which is about a third (34.12 per cent) of all livestock in the studyarea.
Silvarpatti accounts for 22.2 per cent of all livestock with 238 large and 1,277 small
stock. Sirunaickenpatti accounts for 16.1 per cent of all livestock: small stock 491
and large stock 610. This village has thus the highest number of large stock.
Kalikkampatti has 165 large animals and 487small animals, accounting for 9.6 per
cent of the cattle population of the study area (652). Kuttathupatti has 976 animals
(172 large and 804 small stock) which is 14.3 per cent of all livestock in the study
area. The smallest number of livestock is in Ulagampatti (large 130 and small 119,
a total of 249). In these villages, sheep and goats are common and Chettiapatti
tops in sheep (at 1,390) and Ulagampatti is at the bottom (just 40). As for poultry
birds, Silvarpatti tops with 630 birds, followed by Kuttathupatti with 404 birds,
Sirunaickenpatti with 320 birds, Chettiapatti 316 birds and the rest in small
numbers by Kalikkampatti (184) and Ulagampatti (32).
Social Institutions
Education and Health. There are three primary schools and three middle
schools in these villages. They cater to the education of children below 14 years
of age. Only three of the six villages have sub-health centres: Chettiapatti,
Ulagampatti, and Kuttathupatti. The first of these centres is attached to the Primary
Health Centre (PHC) at Alamarathupatti, while the second is attached to the PHC
of Thadicombu and the third to the PHC of Kannivadi. The PHCs are all located
within 5 km of the village centres. The sub-centres are responsible for the general
health of the people, their care and for counselling. Births and deaths are recorded
and documents are maintained at these centres.

136
Financial institutions. There are two Primary Agricultural Cooperative
Banks, one at Kuttathupatti and the other at Silvarpatti. Other villages are covered
by other similar banks, importantly the Canara Banks which are located in the
neighbouring villages.
These institutions provide both long and short term credits to the
people/farmers under various governmental programmes. In addition, the fair price
shops .also function in all the villages and they supply the essential commodities
through the Public Distribution System (PDS).
Transport and Communication
For transporting commodities and goods the villagers produce, such as
flowers and grapes, they depend mostly on the railway transport that exists and
the stations such as Ambathurai and Dindigul serve the villages. The National
Highway 7 traverses the area near about Chettiapatti, Kalikkampatti and
Sirunaickenpatti. Buses ply regularly from Dindigul to Kannivadi and Alagupatti,
passing through Kuttathupatti and Silvarpatti. Ulagampatti alone has separate bus
services to the district headquarters, which is Dindigul. Invariably, all the villages
are in possession of radios and colour television sets and they are the essential
communication media among the villages. World news, weather forecasts and day-
to-day agricultural information are all communicated to the people through these
media. The people of the villages are interested in the regional, national and
international news and programmes which are an influence - especially cultural -
on the people of the villages.
There are postal and telegraph office services, in the study area, and the
coverage is 100 per cent. Postal services are available in all the villages but the
137
services relate primarily to collection and delivery of letters. There are also
telephones, available to the people of the villages in these offices, for their urgent
and immediate correspondence. There is however no Police Department in any of
these villages, which are served by those in the vicinity.
Basic Needs
In all the villages, there is provision for drinking water supply, namely, a
overhead tank (for water storage). In addition, there are 5-6 hand pumps which
help the people to pump water out of the groundwater storage, for drinking and
other domestic purposes. Mud roads are available to the people on the move; the
Village Panchayats have maintained all of them. Black-topped roads are found in
good measure. Tar paved roads connect the villages of Kalikkampatti,
Sirunaickenpatti and Kuttathupatti with the nearest main road. Generally, the
residents are not facing any transport and marketing problems.
Integrated Nutrition and Noon Meal Programme
There are six Tamil Nadu Integrated Nutrition Programme (TNIP) centres
attached to the Balwadis and the Noon Meal centres attached to the schools.
Children below 4 years benefit greatly through the Nutrition Programme and the
Balwadis. The school students below 14 years are covered under the Noon Meal
Programme. The TNIP centres are also taking care of the registered pregnant and
breast-feeding mothers. Mahalir Sangam (Women's Association) has been
effectively functioning in each of the 'study villages, raising the interests and
protecting the rights of women. The women here are well aware of the
governmental programmes, meant for them.

Marketing Facilities
138
There are several markets hereabout and the study area is served by the
Dindigul Supermarket, and the ordinary markets in Chinnalapatti, Panchampatti,
Kannivadi and Thadicombu, for marketing their agricultural and other products.
Socio-Economic Development and Energy in Rural Tamil Nadu
Now we turn to information gathered from 200 sample households of the
six Gandhigram Service Villages, towards providing an understanding of the socio
economic milieu and development and the characteristic use of energy,
conventional as well as non-conventional, towards that development. Table 4.5
summarises the socio-economic status of the people of the six villages and
provides for an understanding of the variations among them. The study area is
dominated by the Christian population of all denominations (65 per cent) with the
Hindus accounting for 35 per cent. The sample chosen is representative of the
communal mix of the villages.
It appears that in Chettiapatti, Kalikkampatti and Silvarpatti, the Hindus
dominate as the majority population. Christian population is the majority in the
other three villages. There is a strong communal amity in the villages. The
backward classes, as deduced from the distribution of social classes in the
sample, account for 78 per cent of the total population; 8 per cent is of the most
backward classes; 12 per cent other backward classes and 2 per cent scheduled
castes and scheduled tribes. Hence, the sample is drawn heavily from the
backward classes. Sirunaickenpatti (27.5 per cent), Ulagampatti (18.5 percent)
and Kuttathupatti (13.5 per cent) account for higher proportions of backward
classes.

139
Table 4.5: Socio-Economic Status Of Respondents
Particulars
Religion Hinduism Christianity
Total
Social Status
BC MBC OBC SC/ST
Total
Size of Family SF MF BF
Total
Population Male Female Total Aged Work Force Children
Literates Mais Female Total.
Illiterates Male Female
Total
Farming Category MARG SF MF
BF LL
Total
Chet
20 3
23
10
1 12
-
23
13 8 2
23
60 63 123 17 50 56
54 53
107
6 10
16
6 5 3 1 8
23
Kali
18 9
27
12 9 6
27
14 10 3
27
70 74 144 14 72 58
63 52 115
7 22
29
10 14 1
. 2
27
Siru
2 55
57
55
1
-1 "
57
32 20 5
57
150 151 301 16
154 131
128 118 246
22 33
55
20 10 2
1 24
57
Village Ulag
1 37
38
37
--1
38
21 13 4
38
99 108 207 19
111 77
88 89 177
11 19
30
18 11 3
3 3
38
Kut
7 26
33
27 5
-1
33
10 12 11
33
107 111 218 24 93
101
81 71 152
26 40
66
15 5
-3 10
33
Silv
22
-
22
15
-6 1
22
10 8 4
22
60 63 123 17 61 45
52 42 94
8 21
29
15 2 1
3 1
22
Total
70 130
200
156 16 24 4
200
100 71 29
200
546 570 1116 107 541 468
466 425 891
80 145
225
84 47 10 11 48
200
140
"(Table 4.5 Continued)
Category
Land Details in acres
Wet Land Dry land
Total
Average Size of Land Holdings Percap Income (in '000) Percap Expenditure! in '000] Percap Energy Expenditure ('00)
Time Spent in Cooking/day in hrs
Livestock Bull Cow Buffalo Sheep Poultry
Total
Housing Ownership Owned Rented
Total
Housing Condition Pucca Tiled Thatched
Total
Stove Owned/Used Traditional Traditional/ Kerosene Others
Total
Chat
29.55 27.35
56,90
2.47 4.56 3.14
4.92
1.70
-16 7 -
30
56
19 4
23
4 12 7
23
13
8 2
23
Source: Computed by author from Note : Income and expenditures
Kali
31.45 32.85
64.30
2.38 6.84 4.59
4.19
2.00
4 36 2 3 5
54
26 1
27
7 11 9
27
18
9 -
27
Siru
41.10 44.70
85.80
1.51 6.55 3.64
3.58
1.70
7 74 1
-"5
93
52 5
57
4 30 23
57
36
8 13
57
Primary Data. are in rupees.
Villages Ulag
57.90 50.85
108.75
2.86 5.23 2.74
2.49
1.70
23 30 25 46 79
212
35 3
38
3 20 15
38
23
13 2
38
Kut
64.85 25.50
90.35
2.74 6.84 3.86
2.63
1.80
11 34 15 -20
82
31 2
33
3 18 12
33
19
13 1
33
Silv
109,05 18.30
127.35
5.79 7.45 3.76
2.00
1.90
11 13 18 --
42
21 1
22
2 10 10
22
12
7 3
22
Total
333.90 199.55
533.45
2.67 6.28 3.60
3.25
1.65
56 203 68 49 139
539
184" 16
200
23 101 76
200
121
58 21
200
141
Half the population in the villages belongs to small families (with less than
5 members); 35.5 per cent of the families is of medium sized (5-7 members) and
the big families (more than 7 members) account for 14.5 per cent of the total
population. A large number of small families (32) and medium families (20) has
been sampled from dominate Simnaickenpatti, while for big families a large
number has been chosen from Kuttathupatti (11).
The households chosen for interviews for an understanding of the socio
economic status of the villages account for about 14 per cent of "the total
population (1,116 persons). This accounts for 6.8 per cent of the male population
and 7.1 per cent of the total population. The population distribution as deduced
from the sample data shows that Simnaickenpatti (301 persons), Kuttathupatti (218
persons), Ulagampatti (207 persons), Kalikkampatti (144 persons), Chettiapatti and
Silvarpatti (123 persons each) are all represented in the order of their population
sizes. In all villages, the sample households show a larger female population than
male population. Nearly 10 per cent of the sampled population is of older
population, 48.5 per cent is of the main workers, and 42.0 per cent is of children.
Literates in the sampled households account for 14.7 per cent, 52.3 per
cent of them being males and the rest females. There is a repeat of the pattern
that the larger the population, the larger is the proportion of literates in the
sampled households. The sampled households show a little more than 20 per cent
of illiterate members.
The sample respondents (heads of households) interviewed for the study
reported here have the following distribution: 42.0 per cent marginal farmers, 23.5
per cent small farmers, 5 per cent medium farmers, 5.5 per cent large farmers
and 24 per cent landless labourers. Ten percent of the marginal farmers
142
interviewed hails from Sirunaickenpatti, 7 per cent of the small farmers come from
Kalikkampatti, 1.5 per cent each of medium farmers from Chettiapatti and
Ulagampatti, 1.5 per cent each of large farmers come from Ulagampatti,
Kuttathupatti and Silvarpatti. These are in fact the largest proportions of farmers
selected from the respective villages.
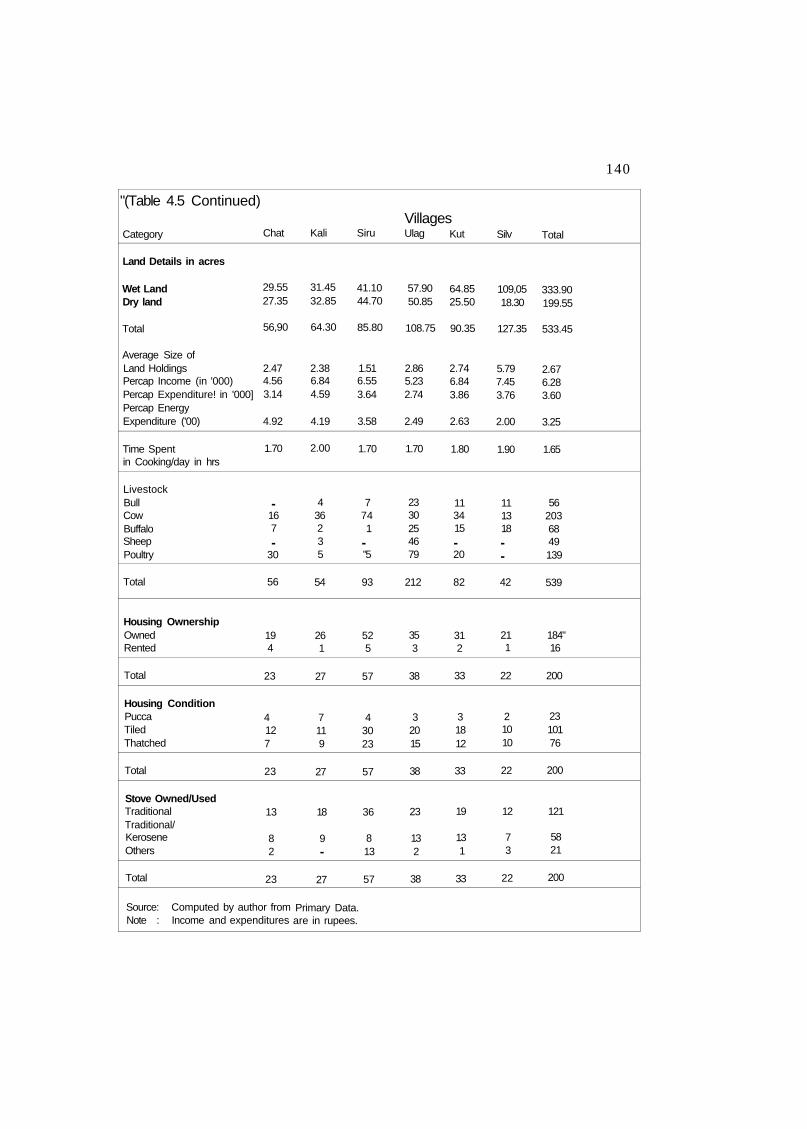
The average size of land holdings in the six villages is 2.67 acres (1.12 ha),
with a range of 1.51 acres in Sirunaickenpatti to 5.79 acres in Silvarpatti. The total
area of both wet and dry land owned by the sampled farmers is 533.45 acres, with
333.9 acres of wet land and 199.55 acres of dry land. There is more of wet land
than dry land in Chettiapatti (29.55 acres), Ulagampatti (57.9 acres), Kuttathupatti
(64.85 acres) and Silvarpatti (109.05 acres). Dry land accounts for higher
proportions in Kalikkampatti and Sirunaickenpatti.
It is seen that the 200 households own varying numbers of livestock
population, totalling 539. Cows are the largest in number with 203, followed by
poultry birds (139). There are 68 buffaloes, 56 bulls, 49 sheep, and 49 goats.
Ulagampatti appears to have the largest of the livestock population (39.3 per cent),
followed by 17.25 per cent of the livestock by Sirunaickenpatti, and 7.8 per cent
by Silvarpatti. Table 4.5 provides information on the distribution of livestock
population in the villages. This distribution has relevance to energy uses in them,
for the village households use cattle dung as a source of energy, dried dung cakes
being the most important fuel in the kitchen. It is important to note that the larger
the number of cattle in a farming household, the greater is their contribution to field
nutrients and cooking fuel. There is a tendency among the farming households to
possess a number of cattle, not just for milk but also for cattle manure and dung
fuel. Even poultry droppings come in useful as plant nutrients, but only if there is
an organised collection of the droppings.
143
It is also found that only 8 per cent of the households in these villages lives
in rented houses while 92 per cent of-them own their houses. Sirunaickenpatti
accounts for 26 per cent of the owned houses and 2.5 per cent of the rented
houses and thus this village accounts for the largest proportion of the own and
rented houses among the villages studied. Only 11.5 per cent of the households
have pucca (proper) houses, 38 per cent thatched houses and the rest tiled
houses (Table 4.5).
It is found that 121 of the sampled households owned and used traditonal
type of stoves with Sirunaickenpatti (31), and Ulagampatti (23) sharing a large
number. Fifty-eight households interchangeably use both traditional and kerosene
stoves with 13 each from Ulagampatti and Kuttathupatty. And the remaining the
21 households use other types of stoves, especially iron stoves.
Firewood and Residues from Various Sources
Data have been gathered from the respondents drawn from the six villages
as to how much of firewood and residue collections are made and consumed by
them, from their own sources, gathered from the villages and about, and
purchased from shops (Table 4.6, Figures 4.1 and 4.2). A total of 1,108,400 Kwh
of firewood, with 521,800 Kwh from own sources, 63,000 Kwh gathered from
village and 433,500 Kwh have been purchased by the respondents for use in their
homes, for a variety of purposes but mainly cooking. Collection from own sources
amounts to 133,700 Kwh in Kuttathupatti, 129,900 Kwh in Ulagampatti, 84,700
Kwh in Chettiapatti, 72,000 Kwh in Sirunaickenpatti, 54,700 Kwh in Kalikkampatti
and 46,800 Kwh in Silvarpatti.

ykMM

144
Table 4.6: Firewood and Residues Consumption by Respondents (in 10,000 Kwh)
Category
Firewood Owned Gathered Purchased
Total
Residues Owned Gathered Purchased
Total
Grand Total
Source:
Chet
8.47 0.99 3.48
12.94
0.07 0.03 0.01
0.11
13.05
Kali
5.47 0.59
5.02
11.08
0.12 0.09 0.01
0.22
11.30
Computed by the author from
Siru
7.20 2.28
19.56
29.04
0.29 0.09 0.05
0.43
29.47
primary
Village Ulag
12.99
4.71
17.70
0.16 0.05 0.08
0.29
17.99
data.
Kut
13.37 2.15 8.32
23.84
0.16 0.04 0.02
0.22
24.06
Silv
4.68 0.29 2.27
7.24
0.09 0.06 0.01
0.17
7.41
Total
52.18 6.30
43.35
101.84
0.89 0.36 0.19
1.44
103.28
It appears that except for Sirunaickenpatti, in all other villages, own sources
provide for large quantities of firewood collection. In Sirunaickenpatti, therefore,
purchased firewood amounts to 195,600.Kwh and is thus the highest amount
purchased by any of the six villages.Purchased firewood energy is 83,200 Kwh in
Kuttathupatti, 50,200 Kwh in Kalikkampatti, 47,100 Kwh in Ulagampatti, 34,800 in
Chettiapatti and 22,700 Kwh in Silvarpatti. Silvarpatti thus has the least amount of
firewood based energy and Sirunaickenpatti the largest amount of energy from
firewood owned, gathered and purchased.
Residues, principally crop residues, form the minor energy source for the
villages when considered in terms of non-commercial resources. A total of 14,400
Kwh of residues has been reported to have been collected from own sources
145
(8,900 Kwh), gathered from village sources (3,600 Kwh) and purchased (1,900
Kwh) from the open market. Own sources are seen to account for a larger part of
the residues so collected for use by the respondents, while the purchased residues
account for the smaller part of the collection. Sirunaickenpatti has the largest
collection equalling 4,300 Kwh, followed by Ulagampatti with 2,900 Kwh,
Kalikkampatti and Kuttathupatti with 2,200 Kwh each, Silvarpatti with 1,700 Kwh
and Chettiapatti with 1,100 Kwh.
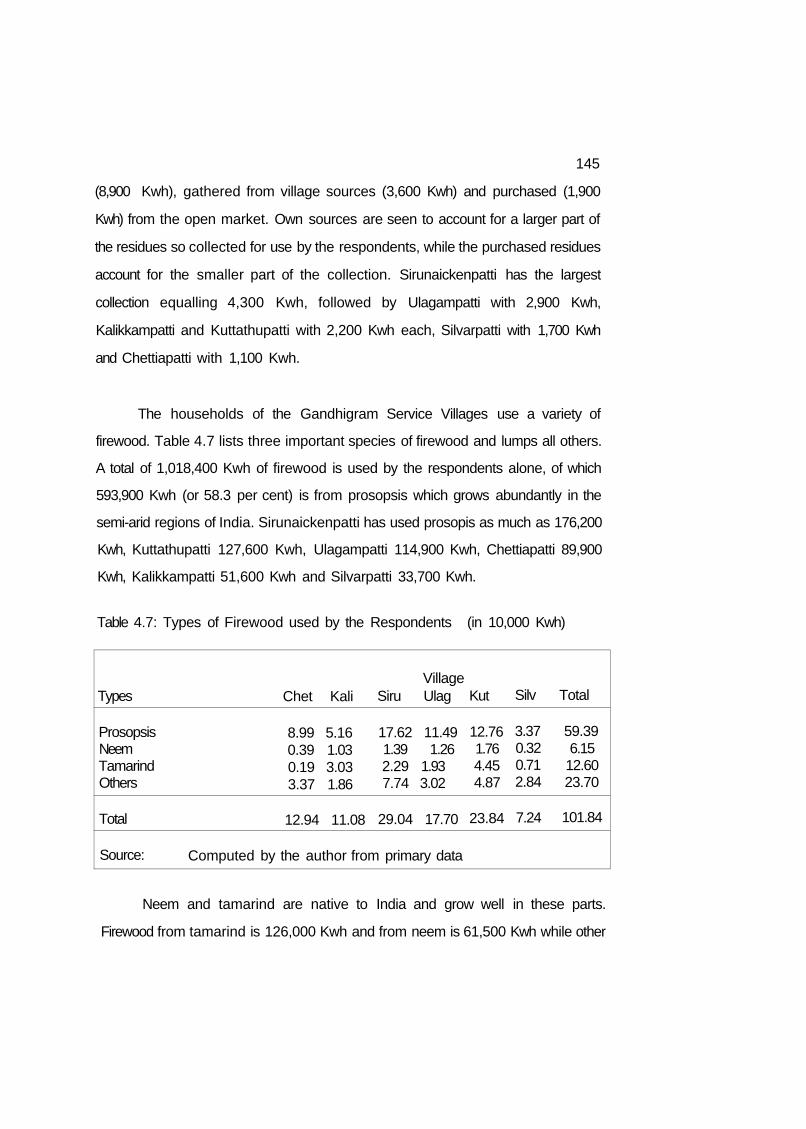
The households of the Gandhigram Service Villages use a variety of
firewood. Table 4.7 lists three important species of firewood and lumps all others.
A total of 1,018,400 Kwh of firewood is used by the respondents alone, of which
593,900 Kwh (or 58.3 per cent) is from prosopsis which grows abundantly in the
semi-arid regions of India. Sirunaickenpatti has used prosopis as much as 176,200
Kwh, Kuttathupatti 127,600 Kwh, Ulagampatti 114,900 Kwh, Chettiapatti 89,900
Kwh, Kalikkampatti 51,600 Kwh and Silvarpatti 33,700 Kwh.
Table 4.7: Types of Firewood used by the Respondents (in 10,000 Kwh)
Types
Prosopsis Neem Tamarind Others
Total
Source:
Chet Kali
8.99 5.16 0.39 1.03 0.19 3.03 3.37 1.86
12.94 11.08
Village Siru Ulag
17.62 11.49 1.39 1.26 2.29 1.93 7.74 3.02
29.04 17.70
Computed by the author from primary data
Kut
12.76 1.76 4.45 4.87
23.84
Silv
3.37 0.32 0.71 2.84
7.24
Total
59.39 6.15
12.60 23.70
101.84
Neem and tamarind are native to India and grow well in these parts.
Firewood from tamarind is 126,000 Kwh and from neem is 61,500 Kwh while other
146
sources give a total of 237,000 Kwh. Kuttathupatti has used a total of 44,500 Kwh
while Kalikkampatti 30,300 Kwh and the other villages progressively smaller and
smaller quantities. More than a fifth of the firewood used in these villages is from
'other' sources, with Sirunaickenpatti using as much as 77,400 Kwh, Kuttathupatti
48,700 Kwh, Chettiapatti 33,700 Kwh, Ulagampatti 30,200 Kwh, Silvarpatti 28,400
Kwh and Kalikkampatti 18,600 Kwh. The firewood usage reflects the natural,
renewable energy reources available to the people of these villages. They depend
very much on their environment to provide for their energy requirements.
Income, Expenditure and Energy Consumption
The total income of the sampled households from various sources but
primarily agriculture is more than Rs. 7 million. The farmers of Chettiapatti.account
for the smallest proportion of this income (Rs. 561 thousands or about 8 per cent)
and Sirunaickenpatti the highest (Rs. 1.97 million or 28.1 per cent). The medium
farmers in all the villages account for Rs. 484 thousands (6.9 per cent), and small
farmers for Rs. 2.043 million (29.1 per cent). Among the people of Chettiapatti, big
farmers make the least of the total income (Rs. 49.0 thousand out of Rs.561
thousand); even the landless labourers earn more income (Rs. 91 thousand) than
the big farmers of this village.
It is the medium (Rs.109 thousand) and small farmers (Rs.176.8 thousand)
who earn the highest income among the farmers and the landless of the village.
In Sirunaickenpatti, it is the landless labourers (Rs. 694 thousand) followed by
small farmers (Rs. 577 thousand) who make the highest income from all sources
(Rs. 1.97 million). In Kalikkampatti, it is the small farmers (Rs. 595 thousand) who
make the most income whereas in Ulagampatti it is the big farmers (Rs. 1.44
million), in Kuttathupatti it is the landless labourers (Rs. 489.3 thousand) and in

147
Silvarpatti it is the big farmers (Rs. 452.7 thousand). Thus, the income distribution
indicates to varied patterns by farmers categories and by the villages (Table 4.8).
The per capita income in the six villages is approximately Rs. 6,280, while
the range of per capita income is from Rs. 4,563 in Chettiapatti to Rs. 7,447 in
Silvarpatti. Among the marginal farmers, Ulagampatti shows the highest per capita
income (Rs. 7,408) and Silvarpatti the least (Rs. 4,062); among the small farmers,
Kuttathupatti has the highest per capita (Rs. 9,054) and Ulagampatti the smallest
(Rs. 4,186); as for the medium farmers, the farmers of Kalikkampatti show the
maximum per capita (Rs. 19,874) and those of Ulagampatti the minimum (Rs.
3,179); and among the big farmers, Silvarpatti has the highest per capita income
(Rs. 21,558) and Chettiapatti and Sirunaickenpatti the least (Rs. 6,125 each).
Table 4.8: Annual Income by Farmer Categories (in Thousand Rupees)
Category
MAR SF MF BF
LL
Total
Source:
Chet
135 177 109 49
91
561
Kali
221 595 139 -
30
985
Sim
539 577 112 49
694
1970
Village Ulag Kut
489 335 297 326 89 -144 342
63 489
1083 1492
Computed by the author from Primary Data. Incomes rounded off to the nearest thousand.
Silv
301 71 35
453
57
916
Total
2018 2403 484 1037
1425
7008
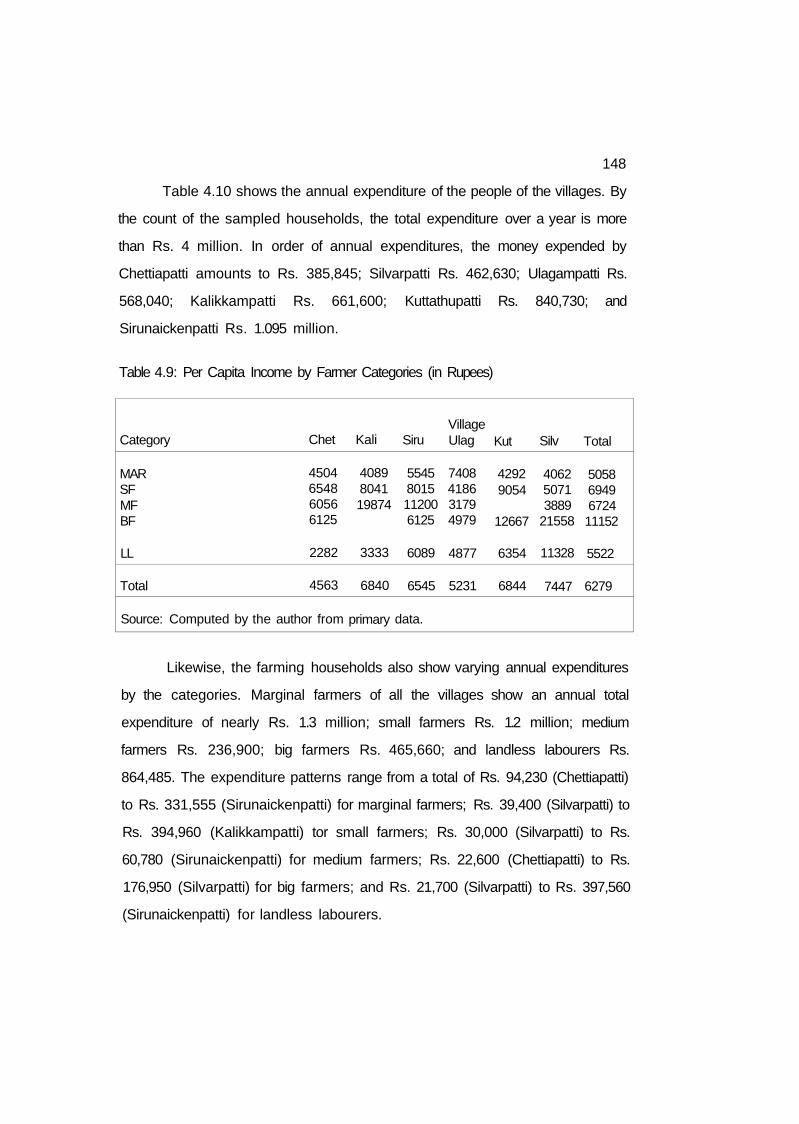
Table 4.9 brings out the variations in per capita incomes (Figure 4.3), both
by farmer categories and by the villages. Overall, the big farmers have a high per
capita (Rs. 11,152) and the marginal farmers a low per capita (Rs. 5,058).
148
Table 4.10 shows the annual expenditure of the people of the villages. By
the count of the sampled households, the total expenditure over a year is more
than Rs. 4 million. In order of annual expenditures, the money expended by
Chettiapatti amounts to Rs. 385,845; Silvarpatti Rs. 462,630; Ulagampatti Rs.
568,040; Kalikkampatti Rs. 661,600; Kuttathupatti Rs. 840,730; and
Sirunaickenpatti Rs. 1.095 million.
Table 4.9: Per Capita Income by Farmer Categories (in Rupees)
Category
MAR SF MF BF
LL
Total
Source: Computed by the
Chet
4504 6548 6056 6125
2282
4563
author from
Kali
4089 8041 19874
3333
6840
primary
Siru
5545 8015 11200 6125
6089
6545
data.
Village Ulag
7408 4186 3179 4979
4877
5231
Kut
4292 9054
12667
6354
6844
Silv
4062 5071 3889
21558
11328
7447
Total
5058 6949 6724 11152
5522
6279
Likewise, the farming households also show varying annual expenditures
by the categories. Marginal farmers of all the villages show an annual total
expenditure of nearly Rs. 1.3 million; small farmers Rs. 1.2 million; medium
farmers Rs. 236,900; big farmers Rs. 465,660; and landless labourers Rs.
864,485. The expenditure patterns range from a total of Rs. 94,230 (Chettiapatti)
to Rs. 331,555 (Sirunaickenpatti) for marginal farmers; Rs. 39,400 (Silvarpatti) to
Rs. 394,960 (Kalikkampatti) tor small farmers; Rs. 30,000 (Silvarpatti) to Rs.
60,780 (Sirunaickenpatti) for medium farmers; Rs. 22,600 (Chettiapatti) to Rs.
176,950 (Silvarpatti) for big farmers; and Rs. 21,700 (Silvarpatti) to Rs. 397,560
(Sirunaickenpatti) for landless labourers.
149
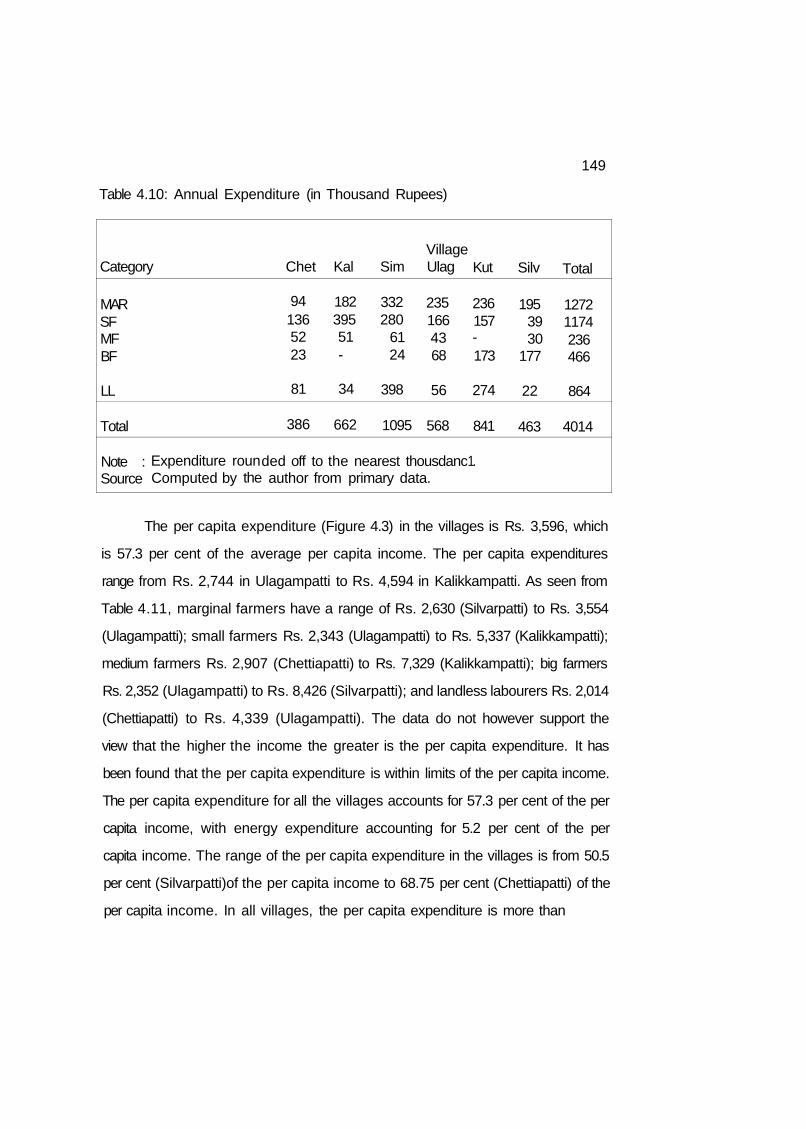
Table 4.10: Annual Expenditure (in Thousand Rupees)
Category
MAR SF MF BF
LL
Total
Note : Source
Expenditure roun Computed by the
Chet
94 136 52 23
81
386
Kal
182 395 51 -
34
662
Sim
332 280
61 24
398
1095
Village Ulag
235 166 43 68
56
568
ded off to the nearest thousdanc author from primary data.
Kut
236 157 -173
274
841
1.
Silv
195 39 30
177
22
463
Total
1272 1174 236 466
864
4014
The per capita expenditure (Figure 4.3) in the villages is Rs. 3,596, which
is 57.3 per cent of the average per capita income. The per capita expenditures
range from Rs. 2,744 in Ulagampatti to Rs. 4,594 in Kalikkampatti. As seen from
Table 4.11, marginal farmers have a range of Rs. 2,630 (Silvarpatti) to Rs. 3,554
(Ulagampatti); small farmers Rs. 2,343 (Ulagampatti) to Rs. 5,337 (Kalikkampatti);
medium farmers Rs. 2,907 (Chettiapatti) to Rs. 7,329 (Kalikkampatti); big farmers
Rs. 2,352 (Ulagampatti) to Rs. 8,426 (Silvarpatti); and landless labourers Rs. 2,014
(Chettiapatti) to Rs. 4,339 (Ulagampatti). The data do not however support the
view that the higher the income the greater is the per capita expenditure. It has
been found that the per capita expenditure is within limits of the per capita income.
The per capita expenditure for all the villages accounts for 57.3 per cent of the per
capita income, with energy expenditure accounting for 5.2 per cent of the per
capita income. The range of the per capita expenditure in the villages is from 50.5
per cent (Silvarpatti)of the per capita income to 68.75 per cent (Chettiapatti) of the
per capita income. In all villages, the per capita expenditure is more than
150
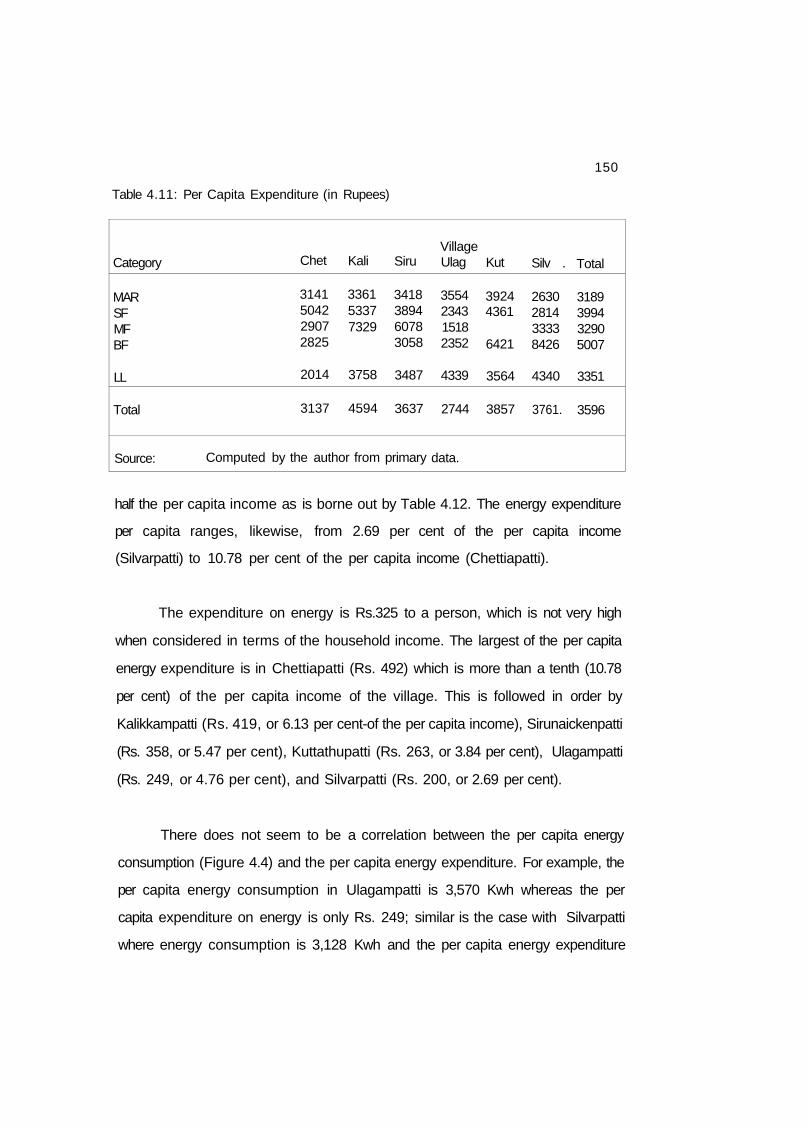
Table 4.11: Per Capita Expenditure (in Rupees)
Category
MAR SF MF BF
LL
Total
Source:
Chet
3141 5042 2907 2825
2014
3137
Kali
3361 5337 7329
3758
4594
Computed by the author from
Siru
3418 3894 6078 3058
3487
3637
primary
Village Ulag
3554 2343 1518 2352
4339
2744
data.
Kut
3924 4361
6421
3564
3857
Silv .
2630 2814 3333 8426
4340
3761.
Total
3189 3994 3290 5007
3351
3596
half the per capita income as is borne out by Table 4.12. The energy expenditure
per capita ranges, likewise, from 2.69 per cent of the per capita income
(Silvarpatti) to 10.78 per cent of the per capita income (Chettiapatti).
The expenditure on energy is Rs.325 to a person, which is not very high
when considered in terms of the household income. The largest of the per capita
energy expenditure is in Chettiapatti (Rs. 492) which is more than a tenth (10.78
per cent) of the per capita income of the village. This is followed in order by
Kalikkampatti (Rs. 419, or 6.13 per cent-of the per capita income), Sirunaickenpatti
(Rs. 358, or 5.47 per cent), Kuttathupatti (Rs. 263, or 3.84 per cent), Ulagampatti
(Rs. 249, or 4.76 per cent), and Silvarpatti (Rs. 200, or 2.69 per cent).
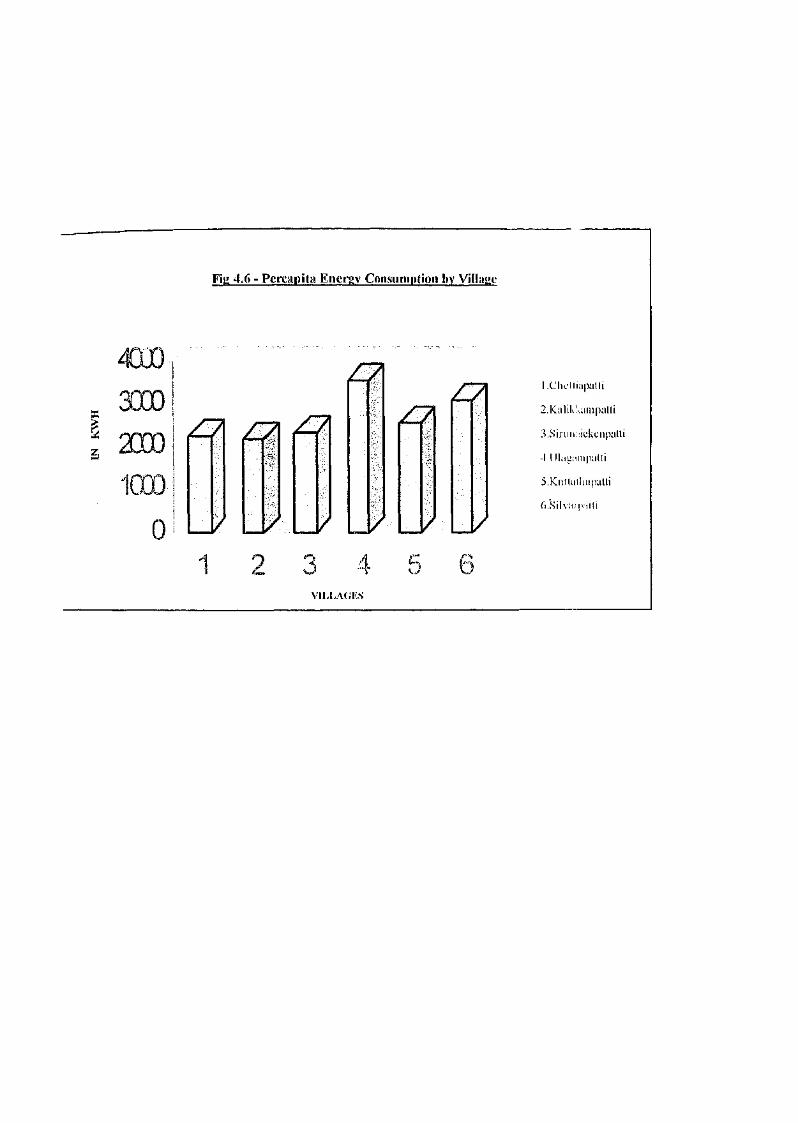
There does not seem to be a correlation between the per capita energy
consumption (Figure 4.4) and the per capita energy expenditure. For example, the
per capita energy consumption in Ulagampatti is 3,570 Kwh whereas the per
capita expenditure on energy is only Rs. 249; similar is the case with Silvarpatti
where energy consumption is 3,128 Kwh and the per capita energy expenditure
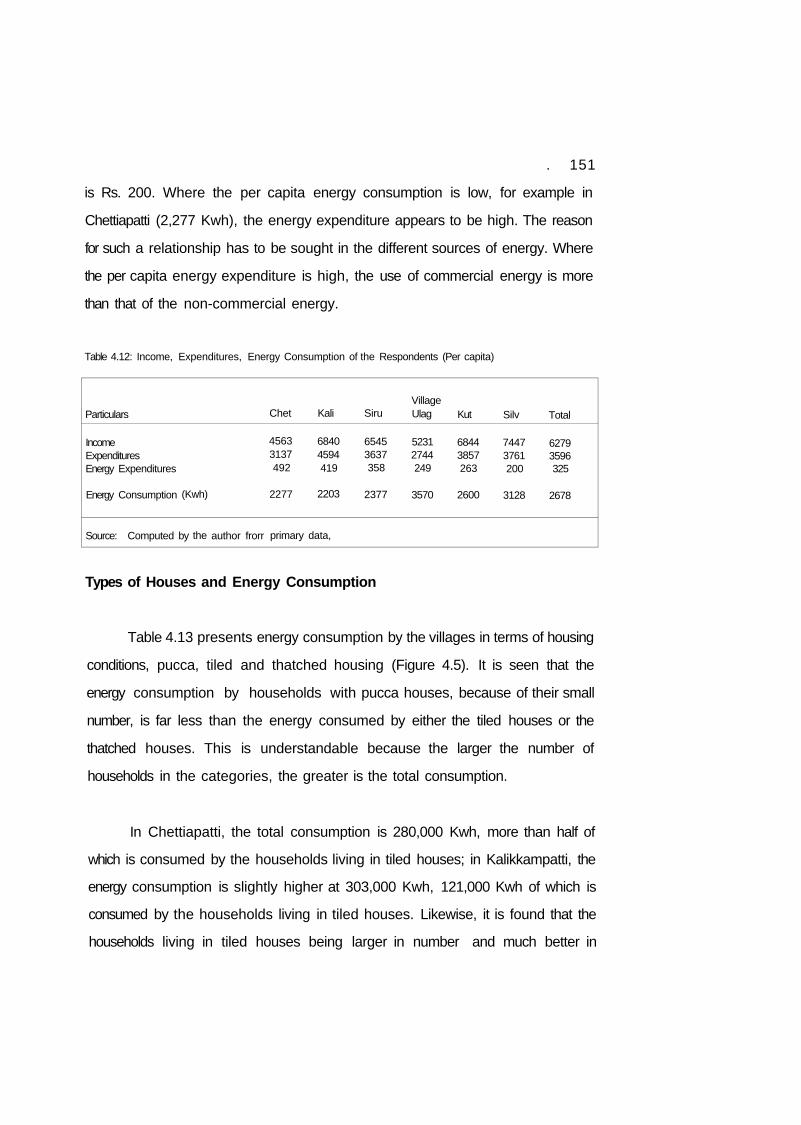
. 151
is Rs. 200. Where the per capita energy consumption is low, for example in
Chettiapatti (2,277 Kwh), the energy expenditure appears to be high. The reason
for such a relationship has to be sought in the different sources of energy. Where
the per capita energy expenditure is high, the use of commercial energy is more
than that of the non-commercial energy.
Table 4.12: Income, Expenditures, Energy Consumption of the Respondents (Per capita)
Particulars
Income Expenditures Energy Expenditures
Energy Consumption (Kwh)
Source: Computed by the author frorr
Chet
4563 3137 492
2277
primary
Kali
6840 4594 419
2203
data,
Siru
6545 3637 358
2377
Village Ulag
5231 2744 249
3570
Kut
6844 3857 263
2600
Silv
7447 3761 200
3128
Total
6279 3596 325
2678
Types of Houses and Energy Consumption
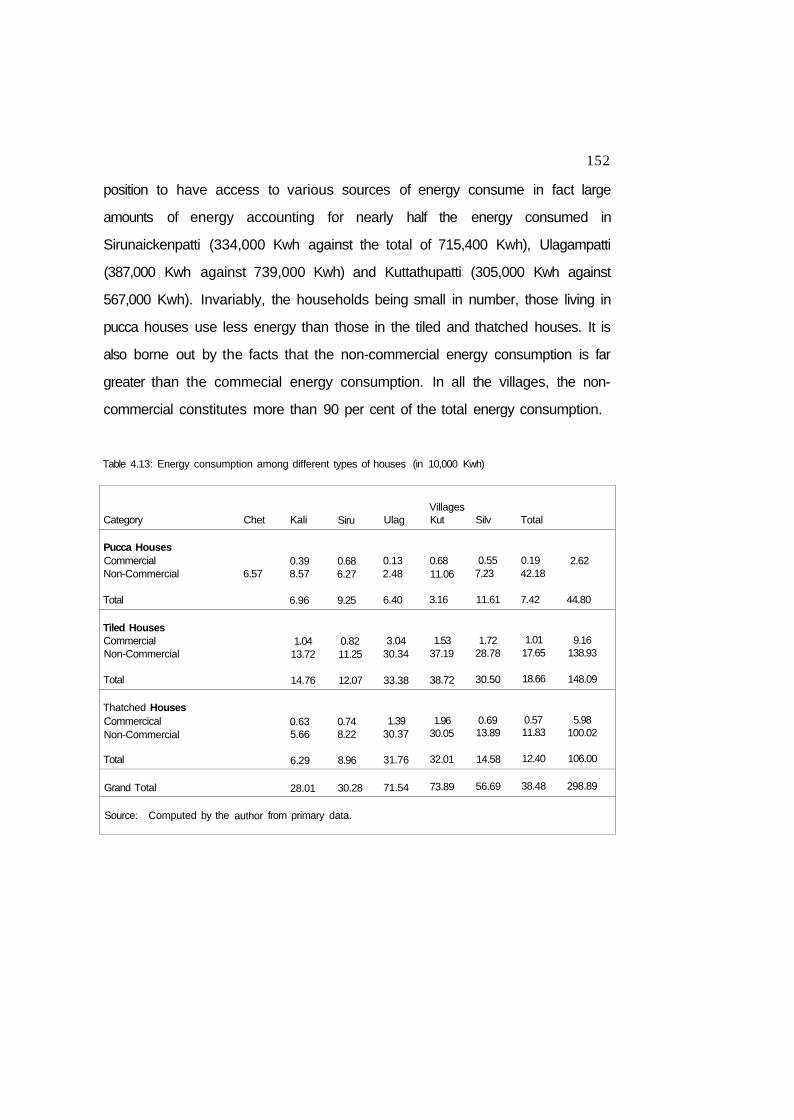
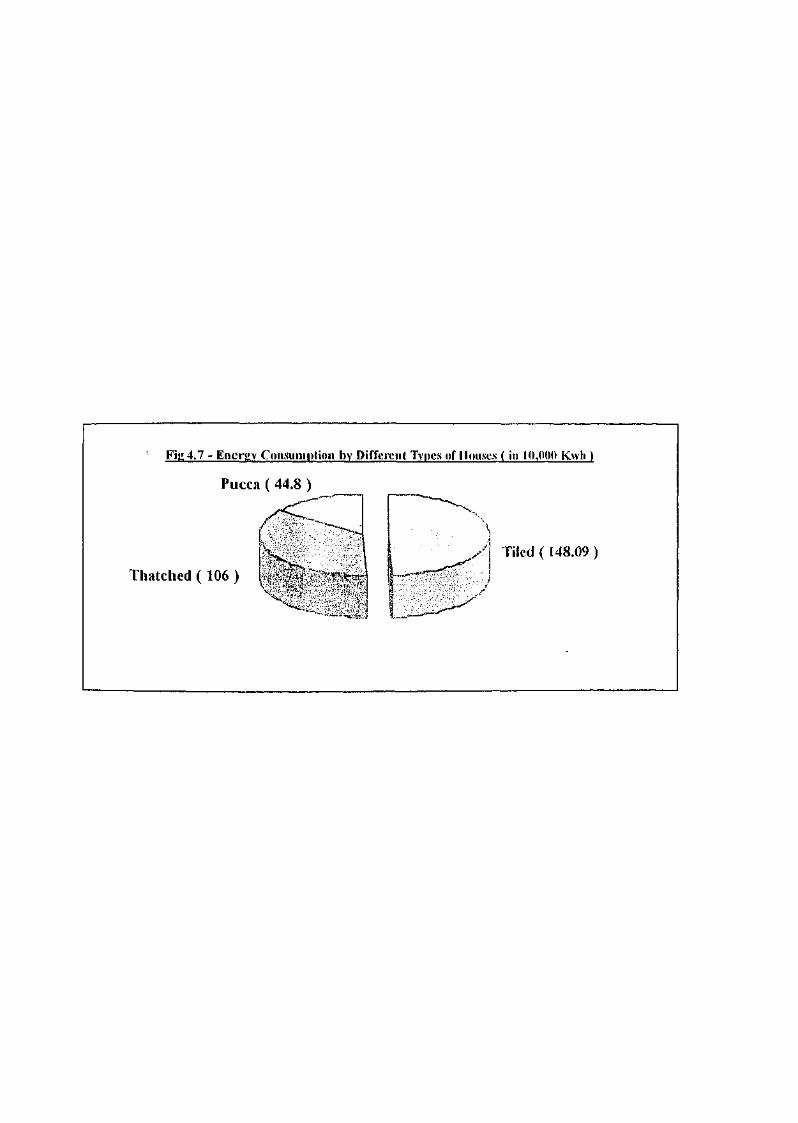
Table 4.13 presents energy consumption by the villages in terms of housing
conditions, pucca, tiled and thatched housing (Figure 4.5). It is seen that the
energy consumption by households with pucca houses, because of their small
number, is far less than the energy consumed by either the tiled houses or the
thatched houses. This is understandable because the larger the number of
households in the categories, the greater is the total consumption.
In Chettiapatti, the total consumption is 280,000 Kwh, more than half of
which is consumed by the households living in tiled houses; in Kalikkampatti, the
energy consumption is slightly higher at 303,000 Kwh, 121,000 Kwh of which is
consumed by the households living in tiled houses. Likewise, it is found that the
households living in tiled houses being larger in number and much better in
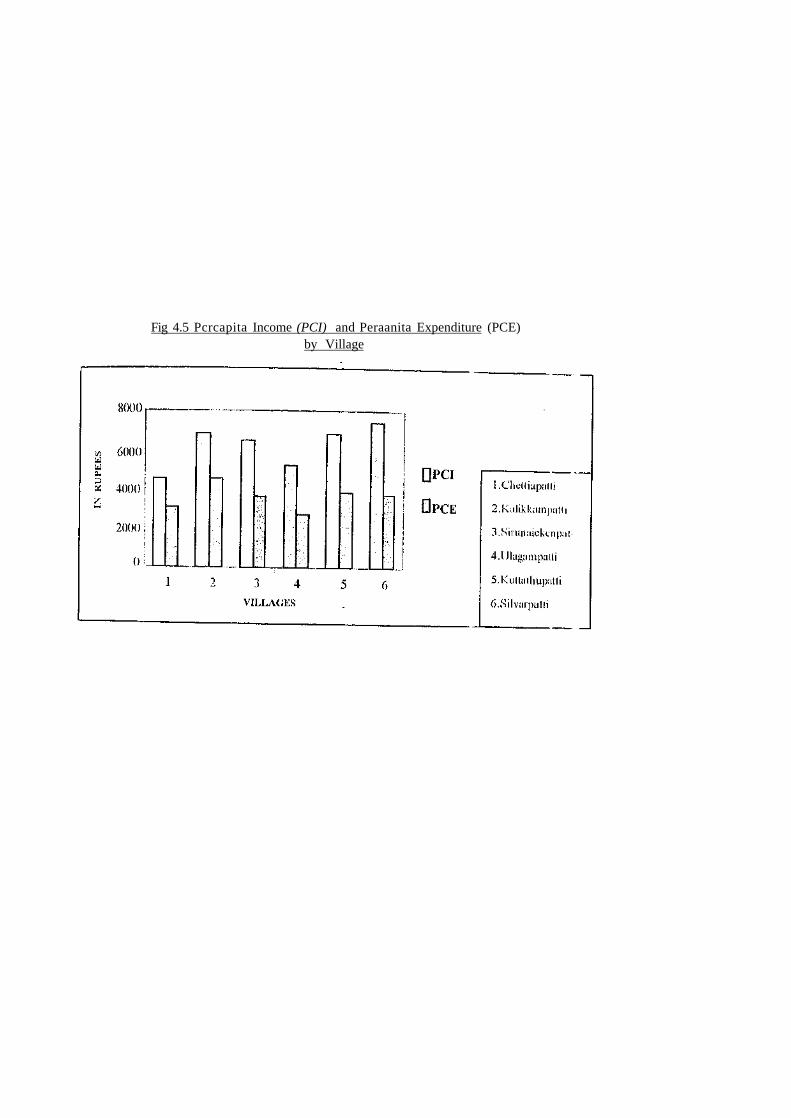
Fig 4.5 Pcrcapita Income (PCI) and Peraanita Expenditure (PCE) by Village
152
position to have access to various sources of energy consume in fact large
amounts of energy accounting for nearly half the energy consumed in
Sirunaickenpatti (334,000 Kwh against the total of 715,400 Kwh), Ulagampatti
(387,000 Kwh against 739,000 Kwh) and Kuttathupatti (305,000 Kwh against
567,000 Kwh). Invariably, the households being small in number, those living in
pucca houses use less energy than those in the tiled and thatched houses. It is
also borne out by the facts that the non-commercial energy consumption is far
greater than the commecial energy consumption. In all the villages, the non
commercial constitutes more than 90 per cent of the total energy consumption.
Table 4.13: Energy consumption among different types of houses (in 10,000 Kwh)
Category
Pucca Houses Commercial Non-Commercial
Total
Tiled Houses Commercial Non-Commercial
Total
Thatched Houses Commercical Non-Commercial
Total
Grand Total
Source: Computed by the
Chet
6.57
author
Kali
0.39 8.57
6.96
1.04 13.72
14.76
0.63 5.66
6.29
28.01
from primary
Siru
0.68 6.27
9.25
0.82 11.25
12.07
0.74 8.22
8.96
30.28
data.
Ulag
0.13 2.48
6.40
3.04 30.34
33.38
1.39 30.37
31.76
71.54
Villages Kut
0.68 11.06
3.16
1.53 37.19
38.72
1.96 30.05
32.01
73.89
Silv
0.55 7.23
11.61
1.72 28.78
30.50
0.69 13.89
14.58
56.69
Total
0.19 42.18
7.42
1.01 17.65
18.66
0.57 11.83
12.40
38.48
2.62
44.80
9.16 138.93
148.09
5.98 100.02
106.00
298.89
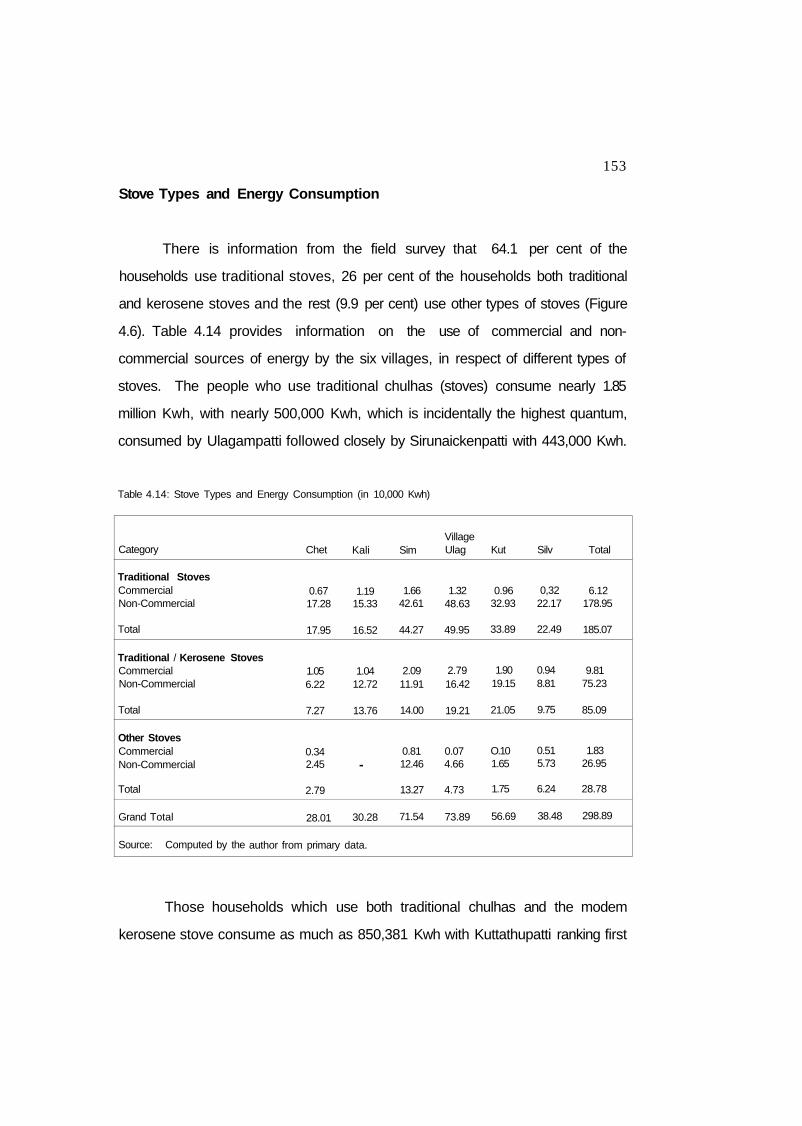
Stove Types and Energy Consumption
153
There is information from the field survey that 64.1 per cent of the
households use traditional stoves, 26 per cent of the households both traditional
and kerosene stoves and the rest (9.9 per cent) use other types of stoves (Figure
4.6). Table 4.14 provides information on the use of commercial and non
commercial sources of energy by the six villages, in respect of different types of
stoves. The people who use traditional chulhas (stoves) consume nearly 1.85
million Kwh, with nearly 500,000 Kwh, which is incidentally the highest quantum,
consumed by Ulagampatti followed closely by Sirunaickenpatti with 443,000 Kwh.
Table 4.14: Stove Types and Energy Consumption (in 10,000 Kwh)
Category
Traditional Stoves Commercial Non-Commercial
Total
Traditional / Kerosene Stoves Commercial Non-Commercial
Total
Other Stoves Commercial Non-Commercial
Total
Grand Total
Source: Computed by the author
Chet
0.67 17.28
17.95
1.05 6.22
7.27
0.34 2.45
2.79
28.01
from primary
Kali
1.19 15.33
16.52
1.04 12.72
13.76
-
30.28
data.
Sim
1.66 42.61
44.27
2.09 11.91
14.00
0.81 12.46
13.27
71.54
Village Ulag
1.32 48.63
49.95
2.79 16.42
19.21
0.07 4.66
4.73
73.89
Kut
0.96 32.93
33.89
1.90 19.15
21.05
O.10 1.65
1.75
56.69
Silv
0,32 22.17
22.49
0.94 8.81
9.75
0.51 5.73
6.24
38.48
Total
6.12 178.95
185.07
9.81 75.23
85.09
1.83 26.95
28.78
298.89
Those households which use both traditional chulhas and the modem
kerosene stove consume as much as 850,381 Kwh with Kuttathupatti ranking first


154
among the villages in the quantum consumed (211 thousand Kwh), followed
closely by Ulagampatti (192 thousand Kwh). The iron stove users (others) account
for 288 thousand Kwh, with nearly half of this consumed by Sirunaickenpatti
households (133 thousand Kwh).
There is support for the fact that the rural people consume largely non
commercial energy, commercial energy consumed being a negligible proportion of
the total, no matter what types of stoves they use in their households. In the'
households using the traditional chulhas, commecial energy consumed is 61,229
Kwh whereas non-commercial energy is of the order of 1.79 million Kwh.
Sirunaickenpatti is the largest user of commecial energy (16,620 Kwh) and
Ulagampatti is the largest user of non-commercial energy (486,280 Kwh). Non
commercial energy consumed by the largest user is nearly three times the
commercial energy consumed by the largest user among the villages. The largest
user of commercial energy among the households using both traditional and
kerosene stove is Ulagampatti at 27,880 Kwh and the largest user of non
commercial energy in those households is Kuttathupatti at 191,549 Kwh. Non
commercial energy consumption among the traditional chulha users accounts for
96.7 per cent, among those using both traditional and kerosene stoves accounts
for 88.5 per cent, and among those using iron stoves accounts for 93.6 per cent.
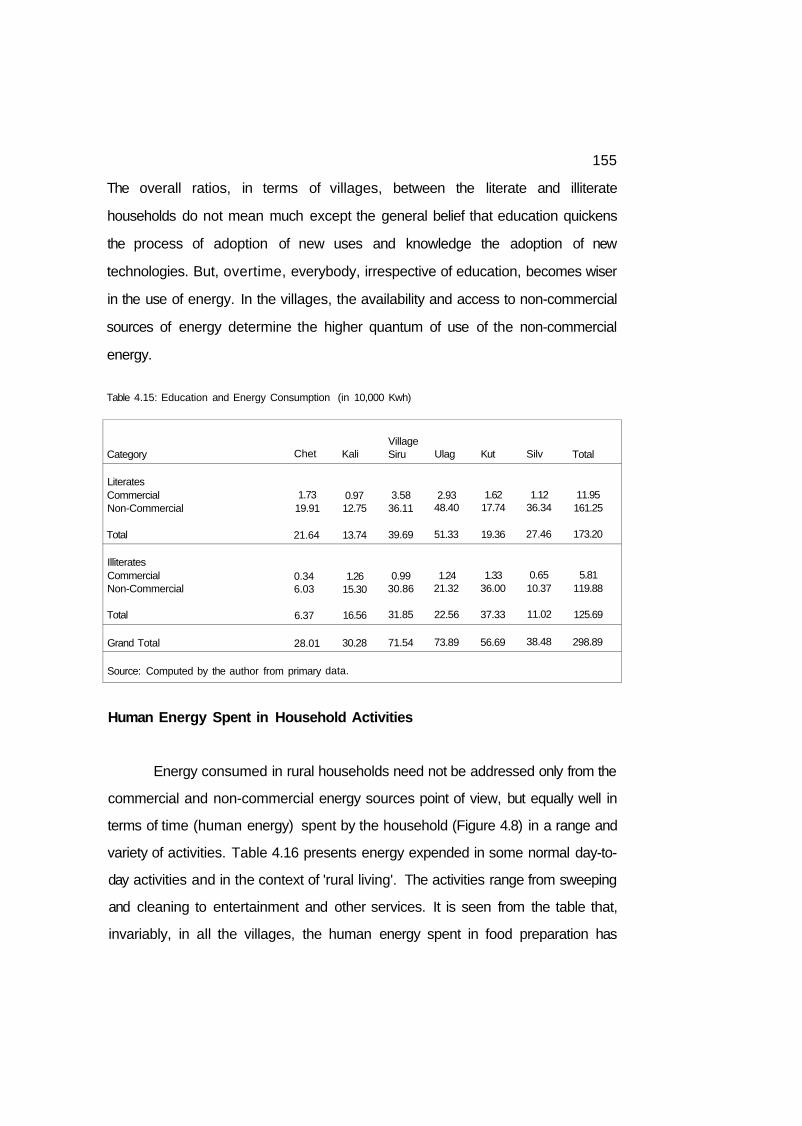
Education and Energy Consumption
There is information from the field survey about the levels of education of
the households and the energy use (Figure 4.7). The total consumption of energy
in the literate households is 1.73 million Kwh as against 1.26 million Kwh in the
illiterate households making the ratio 58:42. The consumption of commercial and
non-commercial energy by literate and illiterate households is shown in Table 4.15.

155
The overall ratios, in terms of villages, between the literate and illiterate
households do not mean much except the general belief that education quickens
the process of adoption of new uses and knowledge the adoption of new
technologies. But, overtime, everybody, irrespective of education, becomes wiser
in the use of energy. In the villages, the availability and access to non-commercial
sources of energy determine the higher quantum of use of the non-commercial
energy.
Table 4.15: Education and Energy Consumption (in 10,000 Kwh)
Category
Literates Commercial Non-Commercial
Total
Illiterates Commercial Non-Commercial
Total
Grand Total
Source: Computed by the author
Chet
1.73 19.91
21.64
0.34 6.03
6.37
28.01
from primary
Kali
0.97 12.75
13.74
1.26 15.30
16.56
30.28
data.
Village Siru
3.58 36.11
39.69
0.99 30.86
31.85
71.54
Ulag
2.93 48.40
51.33
1.24 21.32
22.56
73.89
Kut
1.62 17.74
19.36
1.33 36.00
37.33
56.69
Silv
1.12 36.34
27.46
0.65 10.37
11.02
38.48
Total
11.95 161.25
173.20
5.81 119.88
125.69
298.89
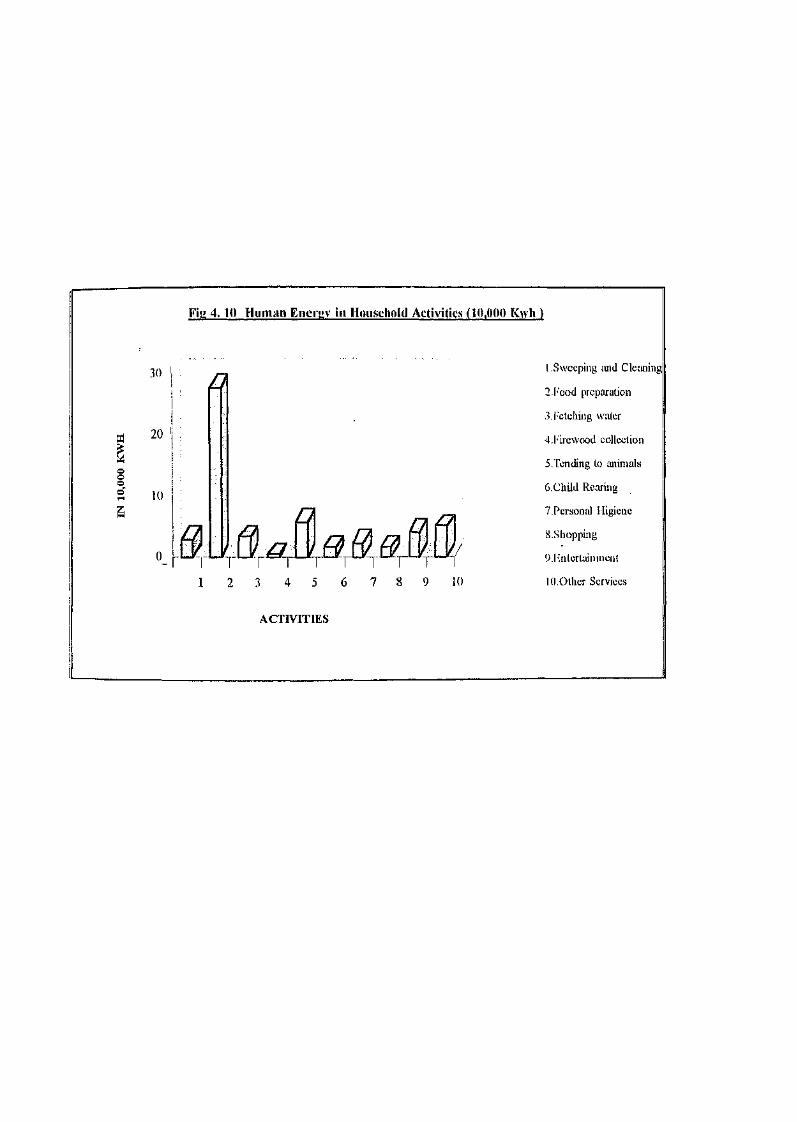
Human Energy Spent in Household Activities
Energy consumed in rural households need not be addressed only from the
commercial and non-commercial energy sources point of view, but equally well in
terms of time (human energy) spent by the household (Figure 4.8) in a range and
variety of activities. Table 4.16 presents energy expended in some normal day-to
day activities and in the context of 'rural living'. The activities range from sweeping
and cleaning to entertainment and other services. It is seen from the table that,
invariably, in all the villages, the human energy spent in food preparation has

156
resulted in high energy consumption (275,700 Kwh) which is a little more than half
the total energy spent in the activities (548,700 Kwh).
Table 4.16: Human Energy spent in household activities (in 10,000 Kwh)
Particulars
Sweeping and Cleaning (5.6) Food Prepared (50.2) Fetching Water (5.9) Firewood Collection (1.0) Tending to Aminals (10.8) Child Rearing (2.7) Personal Hygiene (4.2) Shopping (2.7) Entertainment (7.6) Other Services (9.3)
Total
Note : Figures in paratheses Source: Computed by the ai
Chat
0.31 3.53 0.33 0.09 0.46 0.19 0.30 0.17 0.37 0.73
6.48
represent percen thor from primary
Kali
0.46 2.62 0.59 0.07 0.89 0.19 0.37 0.22 0.70 0.49
6.60
Siru
0,76 9.05 0.81 0.10 1.44 0.43 0.56 0.38 0.99 2.53
17.04
Village Ulag
0.60 4.34 0.68 0.09 1.38 0.27 0,48 0.32 0.85 0.55
9.56
tage, which add up to 100.0, data.
Kut
0.60 4.90 0.47 0.12 0.99 0.20 0.35 0.27 0.72 0.47
9.09
Silv
0.32 3.13 0.33 0.07 0.79 0.18 0.26 0.14 0.55 0.33
6.10
Total
3.05 27.57 3.21 0.54 5.95 1.46 2.32 1.50 4,18 5.09
54.87
Tending to animals involves much time and the rural households under
study spend as much as 59,500 Kwh with Sirunaickenpatti (14,400 Kwh) and
Ulagampatti (13,800 Kwh) spending more time than all the others. Firewood
collection demands just about 5,400 Kwh. Entertainment appears to consume
more energy from the households, nearly 41,800 Kwh. The information gathered
from the field survey indicates that, in all 548,700 Kwh of time is spent in various
household activities. It is found that Sirunaickenpatti (170,400 Kwh) accounts for
31 per cent of all such energy whereas the others account for lesser and far
smaller amounts of energy: Chettiapatti 64,800 Kwh, Kalikkampatti 66,000 Kwh,
Ulagampatti 95,600 Kwh, Kuttathupatti 90,900 Kwh and Silvarpatti 61,000 Kwh.
Summary
157
The profile has briefly outlines the GRI and the characteristic features of
its villages in terms of geographical location, demography, climate, monsoon, land
use and cropping pattern, water potential, social institutions, transport and
communication, marketing facilities, social factors such as caste, religion, house
ownership and environmental conditions, livestock population, per capita income,
expenditure and so on. These socio-economic factors are informative for
identifying energy potentials that enable the researcher to carry out energy studies
at micro level. Thus the factors above pave the way for an analysis of the energy
consumption patterns across the sectors in the study area.


