
Impact of Accessibility on Urban Structure of Amritsar City 2012
Page | 34
CHAPTER - II
ACCESSIBILITY – URBAN STRUCTURE INTERFACE:
THEORETICAL FRAMEWORK
2.0. OVERVIEW OF THE CHAPTER
This chapter reviews the literature available for accessibility measures,
urban structure models and relationships tested between the two. Clarity
about concepts and definitions, parameters, approaches of measurement
and models have been done to facilitate selection of parameters and
approaches of measurement for the present research. Appreciation of
relationships between accessibility indices and urban structure parameters
has been done to theorize the base of relationships.
2.1. TRANSPORTATION AND URBAN STRUCTURE
Human settlements are conscious creations of man‟s creative urges. Inter
and intra city connections and interactions between physical, socio-cultural
and political forces have overwhelming effects on the structure of a city.
Some of the most significant factors that affect the urban structure include
rapid and massive growth, economic forces and the changing form of
transportation. Doxiadis [1970, pp. 393-404]2 after analyzing the growth of
few cities has concluded that even if cities are initially conceived with a very
definite structure and form, invariably change when they grow. That is why
cities are known to be dynamic entities and their land use patterns and land
economics keep on changing with time and space. Consequently, new
form, pattern and structure of a city emerge.
2 Doxiadis, C.A. (1970), Ekistics, the science of human settlements, Science, Vol. 170, No. 3956, October, pp. 393-404.

Impact of Accessibility on Urban Structure of Amritsar City 2012
Page | 35
Cities not only expand spatially in all directions but land use pattern,
densities, FARs, land values, rent structure, etc. are also effected directly,
which in turn reciprocate to affect each other. The basic components of the
city (the nodes) i.e. work, residential, educational and recreational places
cannot function individually. They have to interact for growth and
development. In this process, urban transportation provisions not only bind
these elements/ indices together but also profoundly control their
arrangements and functions.
Meier as cited by F. Stuart Chapin Jr. [1964]3 conceptualized the city in
terms of systems of interaction prompted by man's urge to maintain
communications (in the general sense) with his fellow men. At the present
stage in man‟s state of development, transportation and communications
technology supply the principle media of interaction. He holds that “-----
transportation overloads are imposing limiting conditions on opportunities
for interacting through transportation system.”[pp.51-52] Similarly, The
physical structure of a city, its size and sprawl, its way of life and character
are dependent upon the nature and quality of its public transport system.
Therefore, it can be said that transportation facilities determine the form,
shape, and structure of settlements. That is why the emphasis of
transportation planning has changed from easing congestion to
accessibility provisions. It is because of the fact that accessibility should be
provided to all sections of the society to enable them to take part in
activities and enrich the development of society like employment,
education, shopping, recreation, medical, etc. Thus, accessibility becomes
a function of landuse pattern and performance of the transportation system.
Under the process different physical and economic indicators of urban
structure are affected varyingly due to varying accessibility levels.
3 Chapin, Staurt, F. Jr. (1964), Selected theories of urban growth and structure,
Journal of the American Institute of Planners, Vol. 30, February, pp. 51-58.
Impact of Accessibility on Urban Structure of Amritsar City 2012
Page | 36
2.2. ACCESSIBILITY
The ever increasing transportation problems in urban areas have
transferred the emphasis of transport planning from minimization of travel
demand to integrated landuse – transport plans. In this context accessibility
provision is an explicit objective of transport planning. The planners are
interested in reduction of travel demand through proper reshuffling of
activities. It is in this context that accessibility is often discussed in contrast
to mobility. Mobility emphasizes the transportation system, while
accessibility also accounts for landuse patterns.4 Thus, accessibility is a
function of landuse pattern and performance of transportation system.
Access is an end rather than an impact on transport planning. Karlqvist
[1975, p.71] as cited by G. H. Pirie [1979]5 rightly observed that
"Accessibility has become a key concept for characterizing a fundamental
principle of human activity: maximum contacts through minimum activity."
Accessibility is a general term used differently in different disciplines. It is
believed that no single definition can encompass the meaning of
accessibility, as it contextually varies [Raju, 1996].6 There is no consensus
on an operational definition of the term „accessibility‟ and hence has been
defined in different ways by different researchers as per their requirements
and convenience. Gould [1969, p.64] as cited by D. R. Ingram [1971]7
rightly pointed, "Accessibility ---- is a slippery notion ---- one of those
common terms that everyone uses until faced with the problem of defining
and measuring it".
4 Bhatt, Chandra, et al (2000a), Development of an urban accessibility index:
literature review, Research Report – No.7- 4938-1, Centre for Transportation Research, The University of Texas, Austin, May.
5 Pirie, G. H. (1979), Measuring accessibility: a review and proposal, Environment and Planning, Vol. 11A, PP.299-312.
6 Raju, M. P. (1996), Accessibility as a determinant of intra urban public transport model share with Delhi as a case study, Unpublished Ph.D. Thesis, Planning, School of Planning and Architecture, New Delhi.
7 Ingram, D. R. (1971), The concept of accessibility: a search for an operational form, Regional Studies, 5. PP. 101-107.
Impact of Accessibility on Urban Structure of Amritsar City 2012
Page | 37
According to Ayeni [1979] and cited by E. Cater [1983]8, “Accessibility per
se is one of the most frequently used and yet little defined terms in urban
studies". However, researchers believe that it cannot remain clouded in
concepts; it must be clearly defined and, if possible, measurable
quantitatively in order to facilitate the determination of accessibility needs.
2.2.a Concept and Definition of Accessibility
Accessibility is a concept that has become central to physical planning
during the last fifty years. The term was first occasionally used in the 1920s
in location theory and regional planning, becoming important once transport
planning began [Batty, 2009].9 In general, accessibility means the ability or
the ease with which one could go from place to place. But it is applied in
varying forms in urban systems including transportation system. In spatial
planning it is used to explain spatial variations of the phenomena under
study, be it growth of towns; the location of facilities and functions; and the
juxtaposition of land uses, etc. It is one of the most commonly applied
terms in transportation discipline to study planning and operational
mechanisms of transport systems and other perceptual frameworks. In a
comprehensive urban planning context, accessibility is viewed as a
dynamic element in urban development and is a function of three factors:
the transport system, location, and the social attitudes of urban population.
Thus, accessibility is viewed as a paradox; neither travel time nor location
fully explains its concept [Raju, 1996].10 Different authors have defined the
term „accessibility‟ as per their perceptions and requirements. Following are
8 Cater, E. (1983), The impact of the M4 motorway on residential location in the
reading sub-region: the application of a disaggregated residential location model, in K.J. Button and D. Gillingwater (Eds.), Transport, location and spatial theory, Power Publishing Company Ltd., England, PP. 82-121.
9 Batty, Michael (2009), Notes on accessibility in search of a unified theory, in Daniel Koch, Lars Marcus and Jesper Steen (Eds.), Proceedings of the 7th international space syntax symposium, Stockholm: KTH, 2009.
10 Raju, M. P. (1996), Accessibility as a determinant of intra urban public transport model share with Delhi as a case study, Unpublished Ph.D. Thesis, Planning, School of Planning and Architecture, New Delhi.

Impact of Accessibility on Urban Structure of Amritsar City 2012
Page | 38
some of the quotes of authors while defining accessibility.
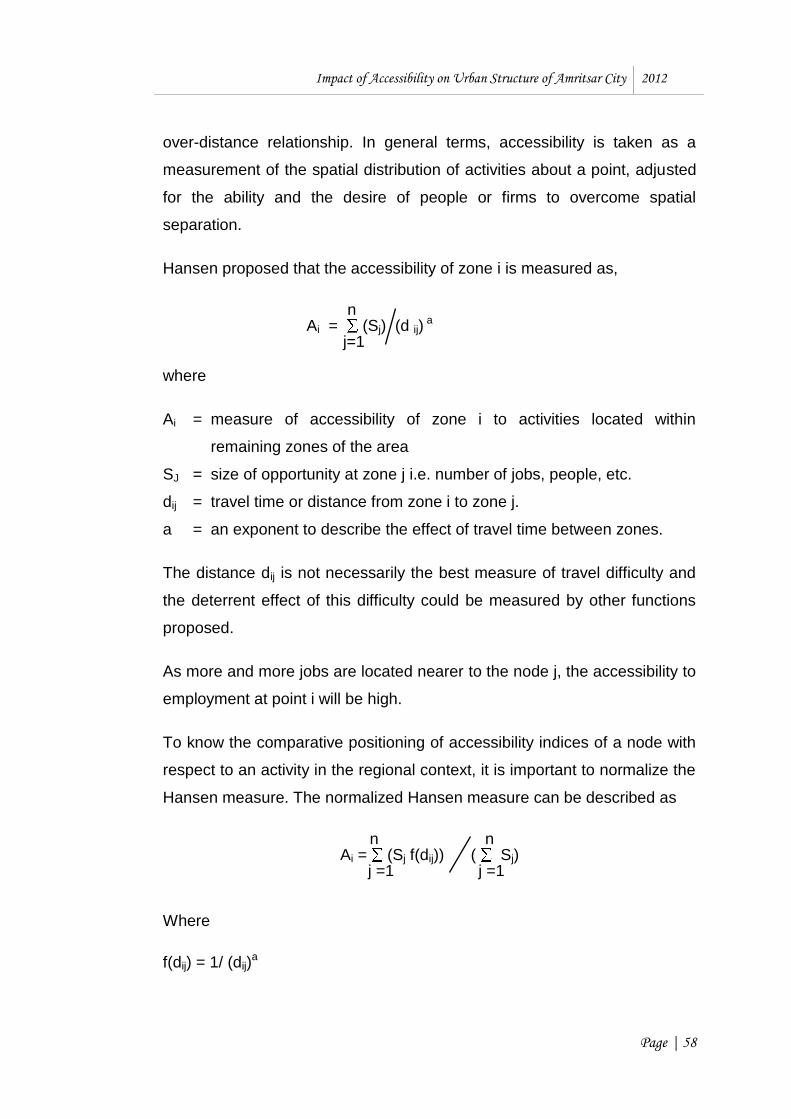
The credit of defining the term „accessibility‟ goes to Hansen [1959]11. He
defined accessibility “as the potential of opportunities for interaction". More
specifically, it is a measure of the intensity of the possibility of interaction
rather than just a measure of the ease of interaction. In general terms,
accessibility is a measurement of the spatial distribution of activities about
a point, adjusted for the ability and the desire of people or firms to
overcome spatial separation. Defined in this manner, accessibility is a
generalization of the population over distance relationship.
Wingo, Jr. [1961]12 states, "In technical sense, accessibility is a relative
quality accruing to a parcel of land by virtue of its relationship to a
transportation system operating at some specified level of service. ----- the
level of service of a transportation system is a reflection of the quantity of
transportation services supplied by the system and the volume of demand
that is asserted in it : it is, in short, a measure of system's efficiency, its
`output' per unit of cost."
As per Ingram [1971]13, “Accessibility may loosely be defined as the
inherent characteristics (or advantages) of a place with respect to
overcoming some form of spatially operating source of friction (for example,
time and/or distance)." In one sense the word `accessibility' means capable
of being reached, thus, implying a measure of the proximity between two
points. Alternatively, `accessibility' is related to the ability of a transportation
system to provide a low cost and/or quick method of overcoming the
distance between two locations. Ingram introduced two subsidiary notions
of accessibility i.e. `relative accessibility‟ and `integral accessibility'.
11 Hansen, W. G. (1959), How accessibility shapes land use, Journal of American
Institute of Town Planners, May, 25, 2, PP.73-76.
12 Wingo, L (Jr.), (1961), Transportation and urban land resources for the future, Inc., Washington, DC.
13 Ingram, D. R. (1971), The concept of accessibility: a search for an operational form, Regional Studies, 5. PP. 101-107.

Impact of Accessibility on Urban Structure of Amritsar City 2012
Page | 39
A B
`Relative accessibility' is defined as " the degree to which two places (or
points) on the same surface are connected” (refer figure 2.1.).
Figure 2.1. Relative Accessibility of Two Nodes
In other words, relative accessibility defines connectivity of two nodes by a
link as explained in figure 2.a. where nodes „A‟ and „B‟ are connected by a
link.
Whereas `Integral accessibility' is defined “for a given point as the degree
of interconnection with all other points on the same surface" (refer figure
2.2.).
Figure 2.2.: Integral Accessibility of Nodes
Thus, interconnectivity of node „A‟ with nodes „B‟, „C‟, and „D‟ defines the
integral accessibility of node „A‟.
Muraco [1972]14 states, “Accessibility is associated with the geographic
notion of situation, thus it is related to the elements of spatial relationships,
interaction, and connectivity.”
Zakaria [1974]15 defines accessibility as “The travel performance and the
quality of interaction between land use activities in the urban region. It
shows the trip linkage between one zone and the other zone of a region
and measures the locational advantages of that zone for various land
14 Muraco, W. A., (1972), Intra urban accessibility, Economic Geography, October,
Vol. 48, No. 4, PP.387-405.
15 Zakaria, T. (1974), Urban transportation accessibility measures: modifications and uses, Traffic Quarterly, July, Vol. 28, PP.467-479.
A
B
C
D
Impact of Accessibility on Urban Structure of Amritsar City 2012
Page | 40
uses.”
Haggerstrand [1974] as cited by M. J. Mosely et al [1977]16 states that,"
Accessibility has at least two sides. One is the legal/social. Frequently an
individual must fulfill certain requirements in terms of training, age, ability to
pay, support from others and so on in order to be permitted to pass the
barriers around the supply point he wants to reach. The other is the
physical. He must be able to command the transportation facilities which
are needed for reaching the supply point at suitable times".
Dalvi and Martin [1976]17 state that there are several aspects implied in the
term to be considered separately.
individuals, their purpose, preferences and decision-making
processes. The relative importance they attach to money costs,
time, comforts and convenience should all enter into the construction
of any meaningful measure.
the opportunities themselves.
the ability of transport system to provide low cost/or quick methods
of overcoming distance between different locations.
While defining physical accessibility Daly [1977]18 states, "Physical
accessibility is the ease with which people can reach distant but necessary
services."
According to Mitchell and Town as cited by Mosely et al [1977]19,
“Accessibility is the ability of the people to reach destinations at which they
can carry out a given activity."
16 Mosely, M. J., et al (1977), Rural transport and accessibility, Centre for East
Angalian Studies, University of East Anglia, Norwich, U.K, Vol.1.
17 Dalvi, M. Q and K. M. Martin (1976), The measurement of accessibility: some preliminary results, Transportation, 5, PP. 17- 42.
18 Mosely, M. J., et al (1977), Rural transport and accessibility, Centre for East Angalian Studies, University of East Anglia, Norwich, U.K, Vol.1.
19 Ibid

Impact of Accessibility on Urban Structure of Amritsar City 2012
Page | 41
According to Online TDM Encyclopedia [Victoria Transport Policy Institute,
2005, p.1]20, “Accessibility refers to the ability to reach desired goods,
services, activities and destinations (together called opportunities)”.
Conroy [1977] as cited by Pirie [1979[21 points out that “Accessibility is a
property of the arrangement of activities and the level of service on the
transportation system." In this statement the phrase `arrangement of
activities‟ is sufficiently broad to include the spatial, temporal, and
functional arrangement of activities.
Hensher and Stopher [1977] as cited by Pirie [1979]22 states, “Accessibility
is a property of people, opportunities and space, independent of trips
actually made."
Leake and Huzayyin [1979]23 defines accessibility “to be the ease of
traveling the origin and destination points of a trip. Ideally, `ease of travel'
can be satisfied by using the safest, most convenient, and most
comfortable means of travel, at minimum travel time and cost, and following
the shortest (most direct) route."
Hence, ease of travel, or accessibility, is a function of the transport system.
The latter is basically composed of two sub-systems, the transport
network(s) & number of transport modes and it is the characteristics & the
efficiency of these, which determines the physical meaning of accessibility.
The efficiency of any transport system, and hence the accessibility of
different places in an area, can be expressed by three major elements viz.,
20 Victoria Transport Policy Institute (2006), Accessibility: Defining, Evaluating and
Improving Accessibility, Online TDM Encyclopedia-Accessibility, www.vtpi.org/tdm/tdm84.htm., May, 6.
21 Pirie, G. H. (1979), Measuring accessibility: a review and proposal, Environment and Planning, Vol. 11A, PP.299-312.
22 Ibid
23 Leake, G. R. and A. S. Huzayyin (1979), Accessibility measures and their suitability for use in trip generation models, Traffic Engineering and Control, 20, 12, December, PP. 566-572.

Impact of Accessibility on Urban Structure of Amritsar City 2012
Page | 42
the network structure i.e. how is it connected and to what extent it
links different zones of the urban area.
the travel resistance on different links of the network as reflected by
travel distance, time and/or generalized costs.
the level of service provided by public transport in terms of service
frequency (bus/hour) and route coverage of the area.
According to Morris, Dumble and Wigan [1979]24, accessibility has
generally been defined as some measure of spatial separation of human
activities. Essentially, it denotes the ease with which activities may be
reached from a given location using a particular transportation system.
They interpreted accessibility “as a property of individuals and space which
is independent of actual trip making and which measures the potential or
opportunity to travel to selected activities. Alternatively, it may be held that
"proof of success" lies in the use of services and participation in activities,
not simply in the presence of opportunities.”
Short [1984]25 states, “Accessibility is the ease with which a household can
overcome the distances between the different centers of activity."
Pike and Vugioukas as cited by Short [1984]26 in their study define
accessibility in terms of
the disposition and attractiveness of land use; and
characteristics of transport system and its ability to connect people
with activity centres.
24 Morris, J. M., P. L. Dumble and M. R. Wigan (1979), Accessibility indicators for
transport planning, Transportation Research, Vol.13A, PP.91-109.
25 Short, J. R. (1984), An introduction to urban geography, Routledge and Kegan Paul, London, PP. 174-176.
26 Ibid

Impact of Accessibility on Urban Structure of Amritsar City 2012
Page | 43
Suryanarayan, Sarna and Malhotra [1986]27 interpreted accessibility “as an
indicator of location of household or group of households in relation to the
distribution of activities and to the transportation system which connects
them.”
While conducting traffic survey in London Murthy [1989]28 designates
`public transport accessibility' in terms of the number of routes serving the
zone, the frequency of the service on each route and the area of the zone.
Some studies consider additionally the characteristics of the population
actually residing in the study area and define accessibility of an area as the
average opportunity which the residents of the area possess to take part in
a particular activity or a set of activities.29
Gray as cited by Murthy [1989]30 defined `public transport accessibility' as,
"Adequacy of route distribution over the area served, vehicle capacity,
service frequency and operating time span, identification of stops and
vehicles and distribution; information on fares, schedules etc., as well as
fare paying; and well spaced stops and terminals."
Johnston [1994]31 defined accessibility as the ease with which one place
can be reached from another. It may be measured in terms of geodetic
distance, topological distance, journey distance, journey time or monetary
cost.
Firstly, general accessibility may be calculated from a single point to all
27 Suryanarayana, Y., A. C. Sarna and S. K. Malhotra (1986), Accessibility to
employment in Delhi - a case study, Road Research Papers, No. 215, Central Road Research Institute, New Delhi, India.
28 Murthy, D. N. (1989), Public transport and accessibility, Unpublished Thesis, School of Planning and Architecture, New Delhi, India.
29 Ibid
30 Ibid
31 Johnston R. J. (1994), The dictionary of human geography, Blackwell Publishers, U.K., 3
rd Edition, P. 2.
Impact of Accessibility on Urban Structure of Amritsar City 2012
Page | 44
other points or areas in the study region. Secondly, accessibility may be
related to the geographical content of other areas in the study: access to
employment opportunities, population, educational or health facilities, etc.
Thirdly, access to certain activities and facilities may be made less easy by
barriers other than physical distance (e.g. the effect of income and social
class) and attempt to incorporate these in measures of accessibility.
In all of these applications accessibility is seen to combine at least three
elements: the location of a place within the study region (in general,
centrally located places are more accessible); the form of the transport
system; and the location within the study area of the activities to which
access is being measured.
According to Sarkar and Crouch [1994]32, “Accessibility is concerned with
the opportunities that an individual or a type of person, at a given location
possesses to take part in particular activity or set of activities. It is a
function of the mobility of the individual, of the spatial location of the
opportunities relative to the starting point of the individual, of the time at
which the individual is able to participate in the activity and of the times at
which the activity is available”.
Bhat et al [2000a]33 defined accessibility „as a measure of the ease of an
individual to pursue an activity of a desired type, at a desired location, by a
desired mode, and at a desired time.‟
It is clear from the above discussion that the researchers have based the
definitions of accessibility primarily on three approaches viz.,
Spatial separation approach;
32 Sarkar, P. K. and F. O. Crouch (1994), Accessibility considerations for planning of
bicycle traffic in Indian cities, SPACE, School of Planning, New Delhi, 9, 3, July, PP. 79-87.
33 Bhat, Chandra, et al (2000a), Development of an urban accessibility index: literature review, Research Report – No.7- 4938-1, May. Centre for Transportation Research, The University of Texas, Austin, May.
Impact of Accessibility on Urban Structure of Amritsar City 2012
Page | 45
Gravity approach; and
Transport system approach
However, the usefulness of a particular definition depends on the objective
of the study under consideration. All the three approaches have used
following components to define accessibility.
Node – location or origin & destination point
Spatial separation – link/distance/time/cost /etc.
Service of transport system –availability & choice, route network,
frequency, etc.
Ease and ability to travel - safe, convenient, comfortable, cheap
means of travel
Potential opportunities or activities - distribution/spatial separation
Litman [2003]34 defines accessibility as „the ability to reach desired goods,
services, activities and destinations (together called opportunities).
Accessibility depends on mobility, mobility substitutes and opportunities.
According to Handy [2004] as cited by Halden, Jones and Wixey [2005],35
accessibility may be defined as the ability to get what you need, ideally with
a choice of destinations and using a choice of modes.
The Bureau of Transportation Statistics states that accessibility is
“fundamentally concerned with the opportunity that an individual at a given
location possesses to participate in a particular activity or set of activities.”
This concise statement captures the broad concept of accessibility, which
incorporates the underlying notions of accessibility as well access afforded
34 Litman, T. (2003), Accessibility: defining, evaluating and improving accessibility,
Victoria Transport Policy Institute, www.vtpi.org
35 Halden, Derek, Peter Jones and Sarah Wixey (2005), Measuring accessibility as experienced by different socially disadvantaged groups: accessibility analysis literature review, Transport Studies Group – University of Westminster, http://home.wmin.ac.uk/transport/download/SAMP_WP3_Accessibility_Modelling.pdf

Impact of Accessibility on Urban Structure of Amritsar City 2012
Page | 46
by socio-demographic characteristics. Accessibility measures in
transportation are concerned with distance/ travel time and cost [Maidment,
2011].36
As per Batty [2009],37 a well defined form of accessibility index associates
some measure of an opportunity at a place with the cost of actually
realizing that opportunity. In its early form, increased accessibility of a place
with respect to some fixed location was assumed to vary directly with a
measure of the size of the opportunity at some other place or location
and to vary inversely with the distance or time taken to access the
opportunities between the two places in question. This is a measure of
inter-zonal accessibility from one place to another, but the usual form is to
produce a composite index of total accessibility from one place or zone to
all others, which gives a measure of how easy or difficult it is to realise all
these opportunities from the place (zone) in question.
To generalize, accessibility can be defined as the ease of travel by
which the potential opportunities or activities at different nodal points
are overcome by some spatially operating source of friction, be it
distance, cost, time, the quality of transport service, etc.
2.2.b. Parameters and Indicators of Accessibility
While examining the impact of accessibility on different aspects of urban
structure/ system different researchers have used various factors that affect
accessibility measurement. According to Wachs [1978] as cited by Batty
[2009]38Accessibility indicators provide possibly the most useful and
appropriate means of summarizing a great deal of information on the
36 Maidment, David R., Spatial analysis of neighborhood accessibility,
http://www.crwr.utexas.edu/gis/gishydro03/Classroom/trmproj/Okola/feedback.htm#Top
37 Batty, Michael (2009), Notes on accessibility in search of a unified theory, in Daniel Koch, Lars Marcus & Jesper Steen (Eds.), Proceedings of the 7th International Space Syntax Symposium, Stockholm: KTH, 2009.
38 Ibid

Impact of Accessibility on Urban Structure of Amritsar City 2012
Page | 47
location of households in relation to the distribution of urban activities and
the transport system that connects them.
According to Morris, Dumble and Wigan [1979]39 four general guidelines
may be identified to assist the selection of accessibility indicators for
evaluation viz,
1. The indicator should incorporate an element of spatial separation
which is responsive to changes in the performance of the transport
system;
2. The measure should have sound behavioural foundation;
3. The indicator should be technically feasible and operationally
simple; and
4. The measure should be easy to interpret and preferably be
intelligible to the layman.
Keeping note of the requirements of a good accessibility measure some of
the important parameters suggested by the researchers are listed below.
According to Zakaria [1974]40, in order to account for interaction between
the transportation system and land use activities, the accessibility
measures should consider the following factors;.
The geographic distribution and intensity of land use activities.
The mode and quality of the transportation service. This includes
speed, cost, comfort, and convenience.
The socio-economic characteristics of travelers (such as income and
car ownership).
According to Leake and Huzayyin [1979]41 the accessibility of a place
39 Morris, J. M., P. L. Dumble and M. R. Wigan (1979), Accessibility indicators for
transport planning, Transportation Research, Vol.13A, PP.91-109.Ibid
40 Zakaria, T. (1974), Urban transportation accessibility measures: modifications and uses, Traffic Quarterly, July, Vol. 28, PP.467-479.
41 Leake, G. R. and A. S. Huzayyin (1979), Accessibility measures and their suitability for use in trip generation models, Traffic Engineering and Control, 20,

Impact of Accessibility on Urban Structure of Amritsar City 2012
Page | 48
depends on its location, the travel mode being considered and the time of
travel.
Place
District (represented by its centroid)
Zone (represented by its centroid)
Household location (place of residence)
Mode
Private
Public
All modes (public plus private)
Time period
Peak hours (weekday)
Off-peak (weekday)
Average daily (weekday)
Average daily (weekday)
Murthy [1989]42 identified following factors affecting accessibility.
Demographic characteristics
Density of the zone
Participation ratio (work force/employment)
Socio-economic characteristics
Household income
Vehicle ownership
Transport network characteristics
Land use pattern and intensity
Location of bus stand in relation to activity area
System's (public transport) characteristics
12, December, PP. 566-572.
42 Murthy, D. N. (1989), Public transport and accessibility, Unpublished Thesis, School of Planning and Architecture, New Delhi, India.
Impact of Accessibility on Urban Structure of Amritsar City 2012
Page | 49
Fare structure
Route network system
Frequency of bus service
Spacing of bus stops along the route
User's characteristics
Trip rate
Trip purpose
Mode of travel
Trip length
Travel time
Age/sex/physically handicapped, etc.
Thus, while defining accessibility researches have defined it on the basis of
network links, transport provisions, travel time & cost measures and some
gravitational attributes such as population, workforce, FAR, etc. Depending
upon research requirements the relevant parameter is considered for
assessing the accessibility of a point or node.
2.2.c. Approaches to Measure Accessibility
Different researchers have measured accessibility based on different
parameters. Broadly, these methods can be categorized into following
Spatial Separation Approach;
Cumulative-Opportunity Measure;
Activity-Interaction Approach;
Utility Measure;
Travel-Space Measure; and
Transport Mode Measure

Impact of Accessibility on Urban Structure of Amritsar City 2012
Page | 50
2.2.c.i. Spatial Separation Approach
The early interpretations of accessibility are based on spatial separation
measurements. It is the based on theory of networking or graph, which
defines accessibility on the basis of nodes and vertices (links). It interprets
accessibility as the `relative nearness' between different nodes on the
transport network. More explicitly, it is a measure of the spatial relationship
between a given element of the network (e.g. a point of intersection
between two links) and the remainder of the network [Leake and Huzayyin,
1979].43 In urban context, nodes may be considered as the activity areas
(work places, market places, residential areas, etc.) and roads/rail links are
the linking propositions to these nodes. Spatial separation approach
evaluates accessibility in a number of ways, as below.
Leake and Huzayyin Measures;
Shimble‟s Index;
Kansky‟s Measure;
Ingram‟s Accessibility Index; and
Alan Hay‟s Accessibility Measure.
Leake and Huzayyin [1979]44 approach used connectivity approach and
measured accessibility in terms of „Associated Number‟ and „Degree of
Node‟.
Associated number is the number of links in the shortest path from a
particular node to its remotest node. The lower the associated number of a
node, the more accessible is that node. The concept of 'associated
number' measures the relative accessibility of a node. For example, in
figure 2.c. the nodes 'c' and 'b' are at the same surface level and the
43 Leake, G. R. and A. S. Huzayyin (1979), Accessibility measures and their suitability for use in trip generation models, Traffic Engineering and Control, 20, 12, December, PP. 566-572.
44 Ibid

Impact of Accessibility on Urban Structure of Amritsar City 2012
Page | 51
Figure 2.3: Link and Node Diagram
farthest node from them is 'k'. The node 'b' is more accessible to 'k' than 'c'
because the associated number is lower i.e. 3.
Degree of node defines the number of links converging to each node. It is
obtained by the sum total of the row/column values in the n x n matrix and
explains the integral accessibility of the node. Values 0 and 1 are used for
non-existence and existence of a direct link between two nodes
respectively. The nodes characterized with larger sum of number of links
are more accessible than those having few linkages. In matrix 1, the node
`d' is the most accessible node (see figure 2.3 and matrix 1).
Leak and Huzzain‟s measures are based on existence or non-existence of
direct links but they do not present true picture of accessibility of a node.
a b C d e f g h k Total
a 0 0 1 0 0 0 0 0 0 1
b 0 0 1 1 0 0 0 0 0 2
c 1 1 0 0 0 1 0 0 0 3
d 0 1 0 0 1 1 1 0 0 4
e 0 0 0 1 0 0 0 0 0 1
f 0 0 1 1 0 0 0 0 0 2
g 0 0 0 1 0 0 0 1 1 3
h 0 0 0 0 0 0 1 0 0 1
k 0 0 0 0 0 0 1 0 0 1
Matrix 1

Impact of Accessibility on Urban Structure of Amritsar City 2012
Page | 52
The total length and actual distance traveled on the shortest path between
the nodes gives a better dimension of the accessibility measure.
Shimble‟s [1953]45 accessibility approach as cited by Leake and Huzayyin
[1979] suggested a graphical technique to measure integral accessibility of
different nodes. Shimble's measure took into account all possible
destinations for each node.
n Ai = lij
j=1
where
Ai = accessibility of node i with respect to all other nodes in the network.
lij = distance (i.e. the number of links in the path containing least number
of links) between node i and j.
n = the number of nodes in the network.
As per Shimble's index, lower sum of the row total will mean a higher
accessibility index and vice versa. To measure the Shimble's accessibility
index each link in the network is assigned a value as '1' and a N x N matrix
is formed by summing the number of links between two nodes. Shimble's
accessibility index as derived from figure 2.3. can be presented in matrix
form (matrix 2). In the matrix 2, node 'f' is the most accessible point in the
network.
But Shimble's accessibility index also faces the same problem as that
Leake and Huzayyin‟s i.e. measuring the shortest path with number of
links. There is every possibility that the links may be of different lengths that
may affect the accessibility index of the nodes to a large extent.
45 Leake, G. R. and A. S. Huzayyin (1979), Accessibility measures and their
suitability for use in trip generation models, Traffic Engineering and Control, 20, 12, December, PP. 566-572.

Impact of Accessibility on Urban Structure of Amritsar City 2012
Page | 53
Kansky46 as cited by Hay [1977] used a set of nodes and links (or using
graph terminology vertices and edges) to represent accessibility from a
network.
Let
e the number of edges (links)
v the number of vertices (nodes and terminals)
p the number of separate (i.e. completely unconnected) networks to which
can be added a fourth
m the total network length
There are large number of ways in which these can be used to describe
networks viz.,
B = (e / v) -------- (I)
`B‟ is in fact 1/2 of the average number of links serving each node. Values
above 1 indicate an increasing complexity.
G = (e-v+p / 2v-5) --------- (II)
46 Hay, Alan (1977), Transport networks, Coes The Printers Limited, Great Britain,
PP. 18-37.
a b c d E f g H k Total
a 0 2 1 3 4 3 4 5 5 27
b 2 0 1 1 2 2 3 4 4 19
c 1 1 0 2 3 1 2 3 3 16
d 3 1 2 0 1 1 2 3 3 15
e 4 2 3 1 0 2 3 4 4 23
f 3 2 1 1 2 0 1 2 2 14
g 4 3 2 2 3 1 0 1 1 17
h 5 4 3 3 4 2 1 0 2 24
k 5 4 3 3 4 2 1 2 0 24
Matrix 2

Impact of Accessibility on Urban Structure of Amritsar City 2012
Page | 54
This compares the number of closed circuits (loops) in a network (e-v+p)
against the maximum possible number of circuits which it might have
(2v-5). The range of the index is, thus, from zero to one, with the highest
value of G indicating the greatest level of connectivity. Thus, this index
introduces some notice of geographic scale.
Q = (m / e) --------- (III)
Clearly, the more densely a network is packed into a region and the greater
the number of junctions the shorter will edge lengths become. `Q',
therefore, may be expected to be high in ill-developed nets and low in well-
developed nets.
In some networks it is possible for links to cross each other without
intersecting (or without any possibility of traffic exchange): these networks
are non-planer. Under such situations following equation is used.
e-v+p G = v(v-1) ---------(IV)
As an improvement to the criticism of earlier approaches Ingram [1971]47
used distance as measure of accessibility to measure relative and integral
accessibility as under.
Relative accessibility measure
Aij = dij
where
Aij = accessibility from zone i to zone j
dij = separation between zones i to j measured by time, distance, cost, etc.
47 Ingram, D. R. (1971), The concept of accessibility: a search for an operational
form, Regional Studies, 5. PP. 101-107.
2- (v-1)

Impact of Accessibility on Urban Structure of Amritsar City 2012
Page | 55
Integral accessibility measure
n Ai = dij n
j=1
where
Ai = accessibility index for zone i
dij = separation between zones i & j measured by time, distance, cost,
etc.
n = number of zones
Lower the value of AI higher is the accessibility index of node i.
The effect of network (route or air) has an important role in the structuring
of the nodes. Hay [1977]48 measured accessibility by using route distance,
geodetic distance (crow-flies), route factor. Whereas route distance is an
important indicator in urban studies, geodetic distance and route factor are
quite significant to explain the pattern and entropy of nodes at the regional
level.
Route Distance or Cell Value Measure
It uses Shimble's formulation with the difference that instead of number of
links the actual distance is measured for each node viz.,
n Ai = dij j=1
Where
Ai = the accessibility of node i with respect to all other nodes
dij = the route distance between node i and j
48 Hay, Alan (1977), Transport networks, Coes The Printers Limited, Great Britain,
PP. 18-37.

Impact of Accessibility on Urban Structure of Amritsar City 2012
Page | 56
n = the number of nodes in the network
Lower the value of the row sum higher is the accessibility and vice versa.
Geodetic Distance (Crow-Flies) Measure
The formula used to calculate accessibility is same as that of route distance
with the difference that instead of route distance crow fly distance between
the nodes is taken. Since perfectly direct distances are measured,
therefore, it shows the relative locational accessibility of the places. A lower
geodetic distance will mean high accessibility.
Route Factor Measure
The effect of the network is reflected by the route factor. Route factor,
infact, explains that the nodes, which are more accessible, may not be
better served because there may be large residual between route distance
and geodetic distance. Route factor is calculated by dividing the route
distance by geodetic distance viz.,
Route Distance Route Factor = Geodetic Distance
The value of the route factor will be equal to or more than 1. Nodes with
route factor nearing 1 will mean better accessibility and better served by
the network.
As a result of application of various accessibility measures using graphical
technique different dimensions have been added to achieve a better
formulation of the accessibility index. The criticisms of different approaches
have directed the researchers to use different parameters (distance, cost,
time, etc.) to indicate separation between two nodes. But the level of
accessibility is a function of the activities, which are processed by different
nodes. It is the activity concentration at a point that demands accessibility

Impact of Accessibility on Urban Structure of Amritsar City 2012
Page | 57
measurement. As a consequence, different researchers have measured
accessibility to various opportunities at different locations.
2.2.c.ii. Cumulative Opportunities Measure
The simplest accessibility measure that takes account of both distance and
the objective of a trip is the cumulative–opportunity measure. This measure
defines a travel time or distance threshold and uses the number of potential
activities within that threshold as the accessibility for that spatial unit.
At = Ot t
Where
t = the threshold
Ot = an opportunity that can be reached within that threshold.
Often, several time or distance increments are used to create an isochronic
map. The only information needed for this measure is the location of all the
destinations within the desired threshold (e.g., jobs or hospital).
Researchers have investigated different ways of characterizing the
parameters for this type of measure. This measure is used to monitor
changes in accessibility due to changes in land use, the transportation
system, or growth in general.
2.2.c.iii. Activity-Interaction Approach
Hansen [1959]49 introduced the activity-interaction approach in 1959. He
introduced the activity potential to measure the accessibility index, in
addition to the ease of interaction. His approach follows the gravity model
and he defines accessibility as the potential of opportunities for interaction.
Defined in this manner accessibility is a generalization of the population-
49 Hansen, W. G. (1959), How accessibility shapes land use, Journal of American
Institute of Town Planners, 25, 2, May, PP.73-76.
Impact of Accessibility on Urban Structure of Amritsar City 2012
Page | 58
over-distance relationship. In general terms, accessibility is taken as a
measurement of the spatial distribution of activities about a point, adjusted
for the ability and the desire of people or firms to overcome spatial
separation.
Hansen proposed that the accessibility of zone i is measured as,
n Ai = (Sj) (d ij)
a j=1
where
Ai = measure of accessibility of zone i to activities located within
remaining zones of the area
SJ = size of opportunity at zone j i.e. number of jobs, people, etc.
dij = travel time or distance from zone i to zone j.
a = an exponent to describe the effect of travel time between zones.
The distance dij is not necessarily the best measure of travel difficulty and
the deterrent effect of this difficulty could be measured by other functions
proposed.
As more and more jobs are located nearer to the node j, the accessibility to
employment at point i will be high.
To know the comparative positioning of accessibility indices of a node with
respect to an activity in the regional context, it is important to normalize the
Hansen measure. The normalized Hansen measure can be described as
n n Ai = (Sj f(dij)) ( Sj)
j =1 j =1
Where
f(dij) = 1/ (dij)a

Impact of Accessibility on Urban Structure of Amritsar City 2012
Page | 59
Instead of using absolute number of opportunities, it uses the proportion of
the opportunities in the entire study area, namely,
n Sj Sj
j =1
The exponent 'a' may form a utility function to describe the effects of
various constraints on the network and other policy matters. But there is a
prior need to calibrate a 'gravity type' trip distribution model in order to
determine the power of the travel resistance term.
Many researchers have explored the appropriate nature of the impedance
factor of the gravity equation. Searching for an appropriate form and value
of the impedance function they find it appropriate to have different
parameter values for different kinds of attractions.
There are three main components of gravity model i.e. zone‟s
attractiveness, impedance measure between zones (e.g., time or distance),
and the form of impedance function. The attractiveness of a zone can be
modeled as number of jobs in a zone while assessing accessibility to
employment; number of retail positions or square footage devoted to retail
sales to assess accessibility to shopping. Spatial separation or impedance
function can be characterized by euclidean distance, actual distance, travel
time, combined measure, and perceived distance or cost. The most
common form of impedance measure is the exponential form and many
researchers use values ranging 0 – 1 for „a‟. Some researchers use
empirical data to determine a value that best describes the area under
consideration.
2.2.c.iv. Utility Measure
Utility measure is based on an individual‟s perceived utility for different
travel choices. The most general form of this measure is:
An = ( Max Uin )= In exp ( Vin ) i = C i = C

Impact of Accessibility on Urban Structure of Amritsar City 2012
Page | 60
That is, for individual n, accessibility is defined as the expected value of
maximum of the utilities over all alternative spatial destinations i in choice
set c.
2.2.c.v. Time - Space Measure
Time–space measures add another dimension to the conceptual framework
of accessibility corresponding to the time constraints of individuals under
considerations. Haggerstrand [1974] as cited by Mosely et al [1977]50
conducted early work in this area. He used a three-dimensional prism of
the space and time available to an individual for partaking in activities. The
motivation behind this approach to accessibility is that individuals have only
limited time periods during which to undertake activities. As travel times
increase, the size of their prisms shrinks. The space dimension of this
measure is calculated with the accessibility measures described in the
previous sections. Constraints on time are generally divided into three
classes viz.,
capability constraints – related to the limits of human performance
(e.g., people need to sleep every day);
coupling constraints – when an individual needs to be at a particular
location at a particular time (e.g. work); and
authority constraints – higher authorities that inhibit movement or
activities (e.g., park curfews).
In reorganizing the time-space accessibility of individuals, trip chaining can
be better evaluated.
2.2.c.vi. Transport Mode Accessibility Measure
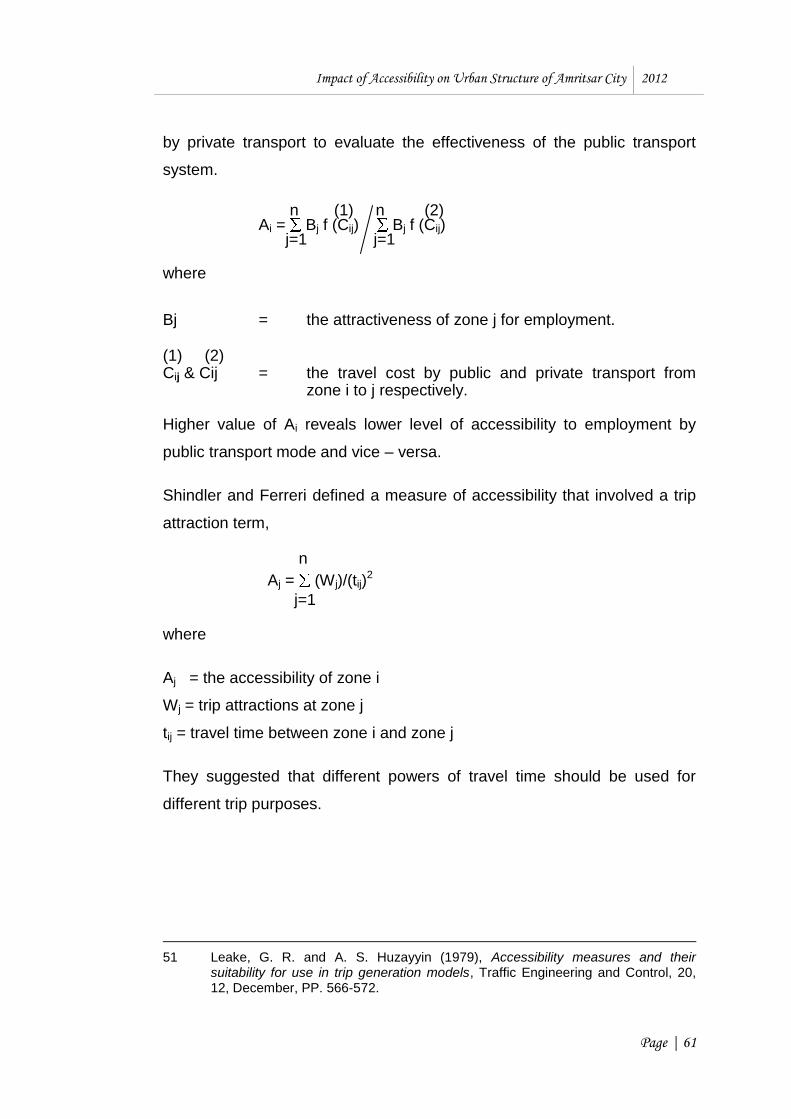
Shindler and Ferrari as cited by Leake and Huzayyin [1979]51 used the ratio
of the Hansen measure of access to employment by public transport to that
50 Mosely, M.J., et al (1977), Rural transport and accessibility, Centre for East
Angalian Studies, University of East Anglia, Norwich, U.K,1.
Impact of Accessibility on Urban Structure of Amritsar City 2012
Page | 61
by private transport to evaluate the effectiveness of the public transport
system.
n (1) n (2) Ai = Bj f (Cij) Bj f (Cij) j=1 j=1
where
Bj = the attractiveness of zone j for employment. (1) (2) Cij & Cij
= the travel cost by public and private transport from zone i to j respectively.
Higher value of Ai reveals lower level of accessibility to employment by
public transport mode and vice – versa.
Shindler and Ferreri defined a measure of accessibility that involved a trip
attraction term,
n
Aj = (Wj)/(tij)2
j=1
where
Aj = the accessibility of zone i
Wj = trip attractions at zone j
tij = travel time between zone i and zone j
They suggested that different powers of travel time should be used for
different trip purposes.
51 Leake, G. R. and A. S. Huzayyin (1979), Accessibility measures and their
suitability for use in trip generation models, Traffic Engineering and Control, 20, 12, December, PP. 566-572.

Impact of Accessibility on Urban Structure of Amritsar City 2012
Page | 62
Baltimore Metropolitan Area Transport Study52 used two measures of
accessibility in the trip generation stage. These measures were termed as
‘accessibility index’ and „transit service index'.
n A1i = 1 tij J=1
A2i = fi
where
A1i = accessibility index of zone i expressing the highway service
A2i = transit service index, or transit accessibility measure of zone i
tij = minimum travel time, by private modes, between zone i and j
fi = transit service frequency available at zone i
n = number of zones
London Traffic Survey53 used the following approach to measure public
transport accessibility of a zone.
Ai = ( Nri) ai
r
where
Ai = bus accessibility of zone i
Nri = off-peak frequency of buses on route r and passing through zone i
ai = the area of zone i in square miles
By taking the square root of Nri, this measure placed greater emphasis on
the number of services in the zone rather than on frequency of service. The
52 Leake, G. R. and A. S. Huzayyin (1979), Accessibility measures and their
suitability for use in trip generation models, Traffic Engineering and Control, 20, 12, December, PP. 566-572.
53 Ibid
Impact of Accessibility on Urban Structure of Amritsar City 2012
Page | 63
square root of the area was adopted in order to compensate for the
unequal size of the zones.
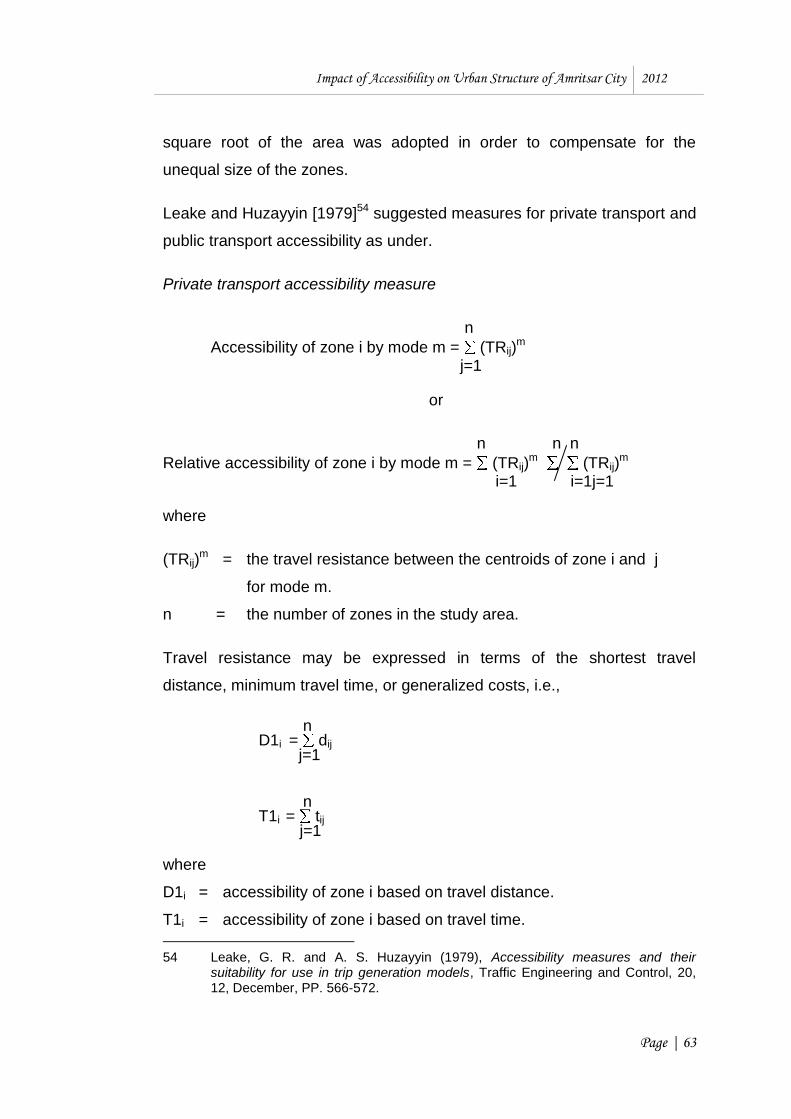
Leake and Huzayyin [1979]54 suggested measures for private transport and
public transport accessibility as under.
Private transport accessibility measure
n
Accessibility of zone i by mode m = (TRij)m
j=1
or
n n n
Relative accessibility of zone i by mode m = (TRij)m (TRij)
m i=1 i=1j=1
where
(TRij)m = the travel resistance between the centroids of zone i and j
for mode m.
n = the number of zones in the study area.
Travel resistance may be expressed in terms of the shortest travel
distance, minimum travel time, or generalized costs, i.e.,
n D1i = dij
j=1
n
T1i = tij j=1
where
D1i = accessibility of zone i based on travel distance.
T1i = accessibility of zone i based on travel time.
54 Leake, G. R. and A. S. Huzayyin (1979), Accessibility measures and their
suitability for use in trip generation models, Traffic Engineering and Control, 20, 12, December, PP. 566-572.

Impact of Accessibility on Urban Structure of Amritsar City 2012
Page | 64
dij = shortest route travel distance (Km.) between centroids of zone i
and zone j.
tij = minimum total travel time (min.)between the centroids of zone i
and zone j.
n = number of zones.
Another measure of accessibility based on travel time is
n T1i = 1 tij j=1
The main difference between T2i and T1i is that, with T2i increased
accessibility is associated with a higher value of the accessibility measure.
They suggested that closer the existing shortest travel distance routes
between zone centroids to the airline distances, the more efficient the
structure of the road network.
n
D2i = (1/ n – 1) (dij – a ij) j=1
n
D3i = (1/ n – 1) (aij / dij) j=1
where
D2i & D3i = measure of accessibility of the zone i
n and dij = the same as earlier
a = the airline distance (Km.) between the centroids of zone i
and zone j.
Low value of D2 and higher value of D3 are associated with high zonal
accessibility.
Impact of Accessibility on Urban Structure of Amritsar City 2012
Page | 65
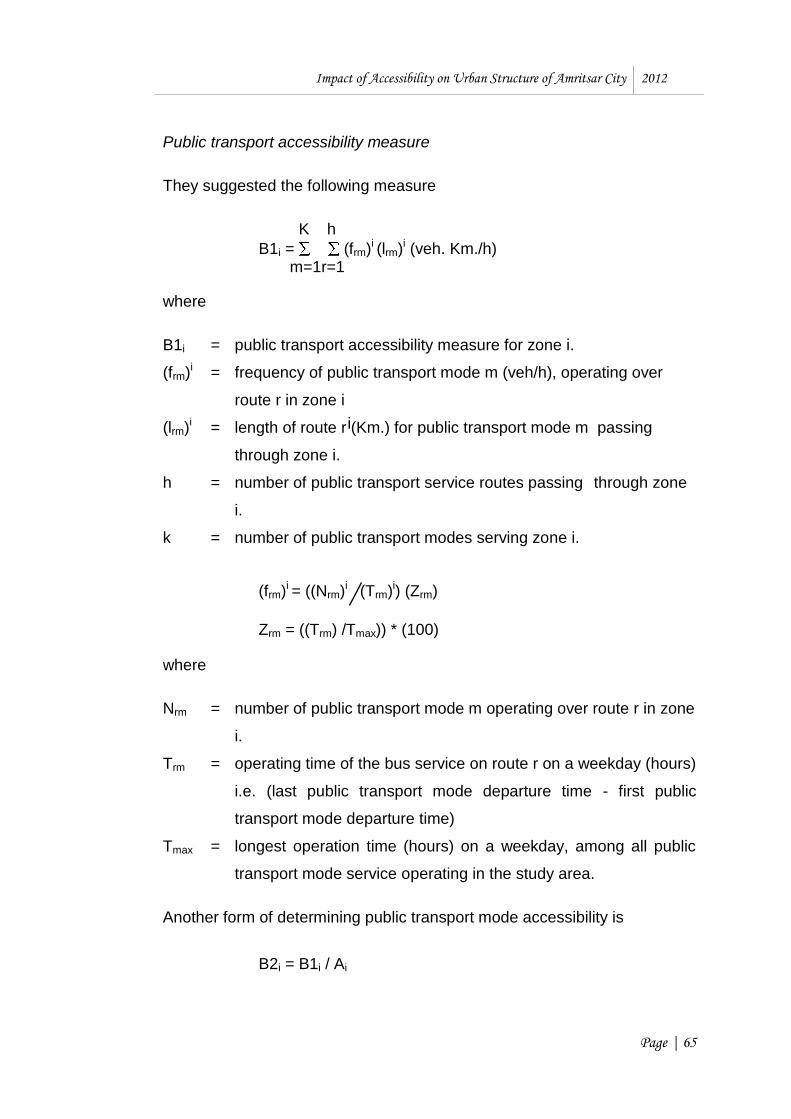
Public transport accessibility measure
They suggested the following measure
K h
B1i = (frm)i (lrm)i (veh. Km./h) m=1r=1
where
B1i = public transport accessibility measure for zone i.
(frm)i = frequency of public transport mode m (veh/h), operating over
route r in zone i
(lrm)i = length of route r (Km.) for public transport mode m passing
through zone i.
h = number of public transport service routes passing through zone
i.
k = number of public transport modes serving zone i.
(frm)i = ((Nrm)i
i
(Trm)i) (Zrm)
Zrm = ((Trm) /Tmax)) * (100)
where
Nrm = number of public transport mode m operating over route r in zone
i.
Trm = operating time of the bus service on route r on a weekday (hours)
i.e. (last public transport mode departure time - first public
transport mode departure time)
Tmax = longest operation time (hours) on a weekday, among all public
transport mode service operating in the study area.
Another form of determining public transport mode accessibility is
B2i = B1i / Ai

Impact of Accessibility on Urban Structure of Amritsar City 2012
Page | 66
where
Ai = the area of zone i (Km2)
In addition, there should be some limits to the distance walked to the bus
stop that the average traveller would consider acceptable. Therefore, the
following form is useful:
B3i = B1i * L i
where n
L i = ( (ar)i (Ai)) * 100
r=1
(ar)i = 2b * (Lr)
i
(ar)i = the area served by route r in zone (Km2)
(Lr)i = length of route r (Kms.) of the bus service passing through zone
i.
b = average walk distance (Km.) relevant to average walking speed
vw (Km./hr) to join route r after walking time tw (min.)
Lower value will indicate lower accessibility to that zone.
Short [1984]55 suggested the following measure
Aoi = Si / (tij) b
where
Aoi = access opportunity of zone i.
Si = size of facility (employee hours or some other measure) in zone j.
tij = distance and/or time taken to travel from zone i to j.
b = an exponent.
55 Short, J. R. (1984), An introduction to urban geography, Routledge and Kegan
Paul, London, PP. 174-176.

Impact of Accessibility on Urban Structure of Amritsar City 2012
Page | 67
Erie Transport Study56 adopted the following model to measure
accessibility.
n Qi = (Aj Fij) j=1
Fij = 1 / (door to door travel time) b
Where
Qi = accessibility index for zone i to the other zones.
Aj = attraction in zone j.
Fij = travel time friction factor for travel from zone i to j on a particular
transport mode.
n = number of zones.
b = varies with travel time.
Accessibility Friction Factor57 is a measure of mobility provided to the
people of zone by a specific public transit facility.
AFFi =(Ki/ K) * (N/ Ni)
where
AFFi = accessibility friction factor for zone i.
Ki = total bus trips in a day to zone i.
K = total bus trips in the whole city.
Ni = total mass transit person trips generated from zone i.
N = total mass transit trips performed in the whole city.
Higher value of AFFi to a zone will indicate higher accessibility of that zone.
56 Ahmed, M. I. (1980), Urban Travel Models, Unpublished Thesis, School of
Planning and Architecture, New Delhi, India.
57 Ibid

Impact of Accessibility on Urban Structure of Amritsar City 2012
Page | 68
Martin and Dalvi's [1976]58 used the following measure to calculate
accessibility.
n n
(Ai) k = (Wj e
-A cijk) Wj
j=1 j=1
where
(Ai) k = accessibility afforded by mode K to household residents in zone
i.
Wj = measure of attractiveness of zone j.
cijk = cost of travel from zone i to zone j by mode k.
Lower value of Ai gives higher level of accessibility.
Thus, accessibility measures established the basis to determine the
accessibility indices of different nodes on a two dimensional surface. The
geographical approach is more useful to determine the physical
accessibility of the node whereas activity-interaction approach establishes
the functional base to accessibility to determine the interaction levels
between the nodes. The accessibility assessment approach stands as a
useful indicator in urban and regional planning studies. The selection of a
particular approach to be adopted is largely dependent on the objective of
the study and the type of constraints that exist on the network.
2.3. STUDIES IN ACCESSIBILITY
Ingram in his study on "the concept of accessibility: a search for an
operational form" has measured accessibility in the city of Hamilton,
Ontario. He used distance as a measure of accessibility. Both straight line
and rectangular distances were measured. A significant correlation
between the two methods of calculating integral accessibility was found.
58 Martin, K. M. and M. Q. Dalvi (1976), The comparison of accessibility by public
and private transport, Traffic Engineering and Control, Vol. 17, No. 12, December, PP. 509-513.

Impact of Accessibility on Urban Structure of Amritsar City 2012
Page | 69
Martin and Dalvi's analyzed the pattern of accessibility by public and
private transport in Inner London by using modified Hansen measure. Four
measures of areal attractiveness viz. total employment, retail employment
(convenient goods), retail employment (durable goods), and population
were used to measure accessibility. Correlation coefficients between
different public transport indices were calculated. The following results
were found;
Highest correlations are between the measures using total and retail
employment (between 0.7 and 0.9) as the attractor variable.
The correlation of each of these measures with population as the
attractor variable is somewhat lower (between 0.2 and 0.4),
reflecting differing spatial distribution of total employment retail
employment. Whereas the convenience goods shopping facilities
follow more closely the distribution of population.
Accessibility based on total employment is closely related to
distance (- 0.79); whilst accessibility based on population showed
very little correlation (- 0.07).
Total employment accessibility showed strong negative correlation
both with distance and public transport travel time from the centre
reflecting relatively high concentration of job opportunities in the
central area.
Population accessibility showed an irregular pattern of relationship
with distance from the centre for public transport.
The spatial variations in public transit accessibility based on
population are considerably loss than for public transport
accessibility based on employment.
Suryanarayan, Sarna and Malhotra in their study on `accessibility to

Impact of Accessibility on Urban Structure of Amritsar City 2012
Page | 70
employment in Delhi' used normalized Hansen's measure to study
accessibility to employment. Cycle, public transport, scooter/motor cycle
and car were the modes taken for the study. The study laid the following
inferences.
1. Accessibility to government employment is generally better than to
the total employment in case of all the zones for various modes.
2. All the opportunities can be reached by car in case of govt. jobs in
50 minutes and in case of total employment in 60 minutes.
3. In case of short distances or travel time of 50 minutes, more
opportunities can be reached by cycle than bus though the
difference is marginal. For longer distance (travel time) the bus
serves better.
Muraco studied intra-urban accessibility for Indianapolis, Indiana,
Columbus and Ohio for 1954 to 1965 with respect to the relative nearness
either in the sense of a direct linkage (finite graph theory) or a minimum
expenditure to travel cost or time (network accessibility).
The analysis showed a reduction in accessibility outwards from the centre
of the said cities for both the periods. The analysis also identified the
location of high accessibility regions by employing principal component
analysis. The analysis showed that the Columbus is characterized by a
greater degree of centrality and corridor development compared to the
Indianapolis surface, which exhibits generally a more uniform accessibility
pattern.
Dallal's accessibility study on Inner London was studied with the following
objectives;
to produce a plan showing areas of varying overall household
accessibility to public transport in the Borough to be used as an
Impact of Accessibility on Urban Structure of Amritsar City 2012
Page | 71
input to decisions on land-use.
to help identify those geographical areas within the Borough and
groups within the community which are most in need of
improvements in public transport.
to provide an objective means of testing the effects of changes in
the routing and frequency of public transport services.
Frequency of the transport service and maximum walk time were used to
measure accessibility. The following results were drawn;
There is a tendency in the Borough for high-income households to
live in areas of high accessibility and for low income households to
live in areas of low accessibility. This contrasts with the situation in
outer metropolitan areas where high income households tend to be
located in outling (poor public transport) areas. The percentage of
people in the employer/manager/professional social groups was also
found to be higher in high accessibility areas.
Generally, higher incomes found amongst residents of high
accessibility areas were not reflected in higher levels of car
ownership. This is somewhat unusual and tends to suggest that
having good access to public transport services may act as a
disincentive to running a car.
The greater use of bus/ underground public transport in areas of
high public transport accessibility is accompanied mainly by lesser
use of walk mode.
2.4. URBAN STRUCTURE
Land use and transportation interaction is a dynamic process that involves
changes over spatial and temporal dimensions between the two systems.
Evolutions in transportation system create new accessibility levels that

Impact of Accessibility on Urban Structure of Amritsar City 2012
Page | 72
encourage changes in land use patterns. There have been many studies to
identify interaction between the two systems in terms of a time lag, the
magnitude of impact, and the spatial relationship. Property value change
has been popularly used in the regression model as an indication of land
use change as well as increased development. Time series analysis of
study conducted for Miami-Dade County, Florida showed that
transportation improvements impacted land uses at varying rates and
intensities [Chung and Zhoo, 2004].59
As the cities get larger, an urban form that diverges from a monocentric city
to a rather more complex spatial pattern of clusters would be expected.
According to Quinn as cited in Sehgal [2000]60, urban area is characterized
by five qualities of population – density, size, mobility, permanence and
heterogeneity. An urban area is something more than a large dense
aggregation of people, buildings, and non-agricultural occupations and is
not merely an area characterized by complex, impersonal social relations. It
may be viewed as an internally organized community with spatial and
social aspects. Spatially, an urban area contains several kinds of sub-
areas: a central shopping district, secondary commercial areas of different
sizes, wholesale areas, areas of light and heavy industry, and a
considerable variety of residential areas. Each of these sub-areas has
important relations with each other and is connected with others by lines of
transportation and communications. Socially, the urban area includes a
variety of segmentations of personal life, become organized bodies into an
inclusive social unit and into a number of distinctive little social worlds.
Generally, the institutions formed within an urban area become functionally
integrated in such a manner that most residents obtain locally the
59 Chung, Soon and Fang Zhoo (2004), Spatio – Temporal relationship between land
use and transportation, http://www.gir.t.org/yr 2004/girt2004 sessions/3.3.3pdf se arch.
60 Sehgal, R. L. (2000), Encyclopedia dictionary of urban terms, Book Well, New Delhi.

Impact of Accessibility on Urban Structure of Amritsar City 2012
Page | 73
satisfaction of their basic needs.
2.4.a. Concept and Definition of Urban Structure
The word “structure” comes from Latin word “struere”, which means to
build, to arrange, and contains the notion of an organized thing.61 Spatial
structures exist, because geographical space is not constituted by a set of
unique places, occupying random locations. A spatial structure is
completely described only if, beyond the form taken by the arrangement of
objects, it is possible to figure out the inter-dependencies among the latter.
While defining urban structure Reif [1973]62 states that it is “the outcome of
a process which allocates population activities to sites”. Thus, it explains
spatial distribution of activities that population of an urban area enjoys or
uses. Loosely defining, at times, it is equated with the word spatial structure
of an urban area.
Chapin, Jr. [1975, pp. 144-163]63 stated that urban spatial structure is
concerned with the order and relationship among the key physical elements
of urban areas as they evolve and pass through transformations in time
and space. In other words, it is concerned with activities of people and their
institutional entities and the interactions these activities create.
Implied is a causal relationship between two pairs of concepts. One pair
focuses on human behaviour: (1) place-related patterns of interactions
(activities), and (2) patterns of interaction among different place activities
(movements or, more broadly, communications). The other pair focuses on
physical structure or form: (1) space adopted for activity use, and (2)
channels developed for movements and other forms of communication.
61 http://www.hypergeo.eu/spip.php?article210
62 Reif, Benjamin (1973), Models in urban and regional planning, Leonard Hill Books, Aylesbury, Bucks.
63 Chapin, F. Stuart. Jr. (1975), Toward a theory of urban growth and development, in M.C. Branch (Ed.), Urban Planning Theory, Stroudsburg, Hutchinson, PP. 144-163.

Impact of Accessibility on Urban Structure of Amritsar City 2012
Page | 74
Thus, the physical and spatial manifestation of development in all its
related and inter-related angles is the settlement structure. In other words,
by structure is meant the mutual relations of the constituent parts or
elements of a whole as determining the particular nature or character.
Various mutually related and dependent components are the social,
economic, geographic, administrative and political forces which have
played their vital role in molding and shaping the physical form of the
settlements for satisfying particular functions of life [Salim, 1967].64
In the words of Moral [1980]65, "Structuring is the manner in which the
component parts of a complex whole are arranged and inter-related to
make an entity."
Storriee as cited by Moral [1980]66
states, “The term structure is used to
mean the social, economic and physical system of an area and includes
such matters as distribution and the relationship between them. Patterns of
land use and development together with communications and the system of
utility services."
Spatial structure should not be interpreted only in a geometric or
morphologic sense. A spatial structure is completely described only if it is
possible to figure out the inter-dependencies among the latter. If
geographical space is considered as a set of interacting elements, spatial
structure must be understood as the principle of organization of the
geographical entity under study, which is materialized under a form.
Bunge as cited by Moral [1980]67 proposed a theoretical geography
predicated on a dualism between „social process‟ and „spatial structure‟,
64 Salim, A. M. (1967), Towards a settlement structure for Kerala, Vol. 1,
Unpublished Thesis, School of Planning and Architecture, New Delhi, India.
65 Moral, P. C. (1980), Physical structure of a town in Assam - Tejpur, Unpublished Thesis, School of Planning and Architecture, New Delhi, India.
66 Ibid
67 Ibid

Impact of Accessibility on Urban Structure of Amritsar City 2012
Page | 75
that is to say, between „movements over the earth‟s surface„ and „the
resulting arrangement of phenomena on the earth‟s surface‟. In doing so,
Bunge strongly agreed with Schaefer that spatial structure could be defined
„most sharply by interpreting “structure” as “geographical”, from which it
followed, so he said, that „the science of space [geography] a sharp tool‟.
Later, explanations of spatial structure were typically sought within the
primarily spatial human and social sciences, most commonly psychology,
cultural anthropology, political economy and sociology.68
In physical planning this is used to explain the spatial structure of the
settlement. Urban structure is the underlying basic skeletal system around
which different parts of an urban area are bonded together. This system
comprises of physical, functional, social, economic and perceptional
components that are instrumental in determining the nature of character of
the area. In general, city structure means the size and shape of the city and
the spatial distribution of homes, jobs, and other land use activities within
its geographical area.
Johnston et al [1981]69 defined spatial structure as “the mode in which
SPACE is organized by and implicated in the operation and outcome of
social and/ or natural processes”.
Lohani [1986]70 commented, “Urban structure refers to location,
arrangement and inter-relationship between social, economic and physical
elements in the urban space displaying a degree of internal organization.
This inter-relationship is most frequently described by regularities in land
use pattern which summarizes the distribution of urban activities. Urban
activities refer to people, their activities, pattern in space. The activity
68 Ibid
69 Johnston, R. J. et al (1981), The dictionary of human geography, Blackwell, U.K., 3
rd Edition, P. 581.
70 Lohani, K. P. (1986), Development activities and urban structure in Bhaktapur, Nepal, Unpublished Thesis, School of Planning and Architecture, New Delhi, India, PP.35-36.

Impact of Accessibility on Urban Structure of Amritsar City 2012
Page | 76
pattern depends upon the characteristics of people, their level of income,
health, educational level, and above all their culture and historical
evolution.” In a way, urban structure refers to the detailed description of all
the areas of an urban settlement.
Barry and Kasarda as cited by Aggarwal [1991]71 say about the urban
structure that....
The economic base of urban centres tends to act independently of
other structural features and to the extent that there is geographic
specialization based on locational factors other than market
orientation. Each broad economic function will lead to its own
distinctive economic town types.
In every society the principal dimensions of socio-economic
differentiation are those of social status age structure or stages in
life cycle and to a large extent the urban structure of a town/city
depends upon its relative accessibility to nearest metropolis.
A culturally heterogeneous society will be characterized by separate
ethnic or racial dimensions if the cultural groups are clustered in
particular pockets and if the groups occupy different status lives and
have different family structures, the cultural differences may override
other socio-economic dimensions.
According to Aggarwal [1991],72 the form and structure of a town/ city is the
result of numerous economic, social and cultural factors operating through
long time. Some of the most significant of these include rapid and massive
growth, a heterogeneous population and the changing form of urban
transportation.
71 Aggarwal, Meena (1991), Changing structure of a small town: case study
Gangaghat (U.P.), Unpublished Thesis, School of Planning and Architecture, New Delhi, India.
72 Ibid

Impact of Accessibility on Urban Structure of Amritsar City 2012
Page | 77
U.N. Publication [1992]73 defines urban structure “as the arrangement and
relations of all elements forming the framework of the urban
agglomeration."
According to Balchin and Kieve as cited by Sehgal [2000]74 ”The spatial
structure of a city is a product of centripetal forces of attraction and
congestion, centrifugal forces of decongestion, and forces of areal
differentiation.”
Rodridge [2006]75 has defined urban structure as the set of relationships
related to the urban form and its interactions of people, freight and
information. According to him, even if the geographical setting of cities
varies considerably, the urban form and its spatial structure relationships
are articulated by two structural elements viz.,
Nodes, which express the centrality of urban activities. This centrality
can be related to the spatial accumulation of economic activities or to
the accessibility to elements of the transport system.
Linkages, which refer to the infrastructures supporting flows from, to
and between nodes.
Thus, it may be concluded that urban structure can be defined in terms of
extent and shape of built-up area, distribution of various landuses/
functional zones, physio-socio-economic aspects of different functional
zones. Hence, urban structure is composed of three components viz.,
activity, intensity, and network (transportation). The relationships and
combinations of these components provide form and structure to an urban
73 UN Habitat (1992), Multilingual glossary of human settlement terms, United Nations Centre for Human Settlements (HABITAT), PO BOX 30030, Nairobi, Kenya.
74 Sehgal, R. L. (2000), Encyclopedia dictionary of urban terms, Book Well, New Delhi.
75 Rodrigue, Jean-Paul, C. Comtois and B. Slack (2006), The geography of transport systems, Routledge, New York.
Impact of Accessibility on Urban Structure of Amritsar City 2012
Page | 78
settlement.
2.4.b. Parameters and Indicators of Urban Structure
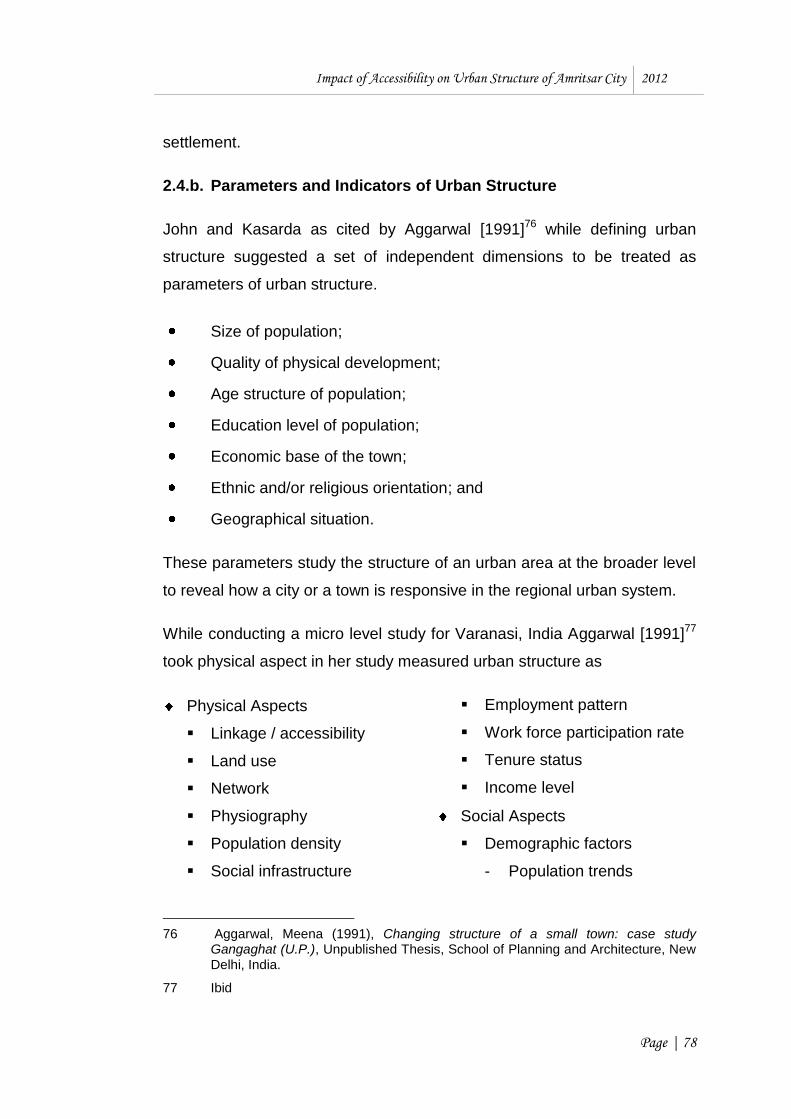
John and Kasarda as cited by Aggarwal [1991]76 while defining urban
structure suggested a set of independent dimensions to be treated as
parameters of urban structure.
Size of population;
Quality of physical development;
Age structure of population;
Education level of population;
Economic base of the town;
Ethnic and/or religious orientation; and
Geographical situation.
These parameters study the structure of an urban area at the broader level
to reveal how a city or a town is responsive in the regional urban system.
While conducting a micro level study for Varanasi, India Aggarwal [1991]77
took physical aspect in her study measured urban structure as
Physical Aspects
Linkage / accessibility
Land use
Network
Physiography
Population density
Social infrastructure
Employment pattern
Work force participation rate
Tenure status
Income level
Social Aspects
Demographic factors
- Population trends
76 Aggarwal, Meena (1991), Changing structure of a small town: case study
Gangaghat (U.P.), Unpublished Thesis, School of Planning and Architecture, New Delhi, India.
77 Ibid
Impact of Accessibility on Urban Structure of Amritsar City 2012
Page | 79
Urban form
Economic Aspects
Land value
Economic base
- Sex ratio
- Migration pattern
Social stratification
Floating population
Recognizing the role played by accessibility to urban structure Rodrigue
[2006],78 states that all locations are relative to one another. However,
locations are not constant as transportation developments change levels
of accessibility, and thus the relations between locations. The following
factors are particularly important in shaping the spatial structure:
• Costs - The spatial distribution of activities is related to factors of
distance, namely its friction. Locational decisions are taken in an
attempt to minimize costs, often related to transportation.
• Accessibility - All locations have a level of accessibility, but some
are more accessible than others. Thus, because of transportation,
some locations are perceived as more valuable than others.
• Agglomeration - There is a tendency for activities to agglomerate
to take advantage of the value of specific locations. The more
valuable a location, the more likely agglomeration will take place.
• Physical Attributes: Natural conditions can be modified and
adapted to suit human uses, but they are a very difficult constraint
to escape, notably for land transportation.
• Historical Considerations - New infrastructures generally
reinforce historical patterns of exchange, notably at the regional
level. At the urban level, the pattern of streets is often inherited
from an older pattern, which itself may have been influenced by
the pre-existing rural structure (lot pattern and rural roads).
78 Rodrigue, Jean-Paul, C. Comtois and B. Slack (2006), The geography of transport
systems, Routledge, New York.

Impact of Accessibility on Urban Structure of Amritsar City 2012
Page | 80
A common myth tends to relate transportation solely as a force of
dispersion, favoring the spread of activities in space. This is not always
the case. In numerous instances, transportation is a force of
concentration, notably for business activities. Automobile has favoured
the concentration of several activities at specific places and in large
volumes. Shopping centers are a relevant example of this process where
central locations emerge in a dispersed setting.
According to him, accessibility is a good indicator of the underlying
spatial structure since it takes into consideration location as well as the
inequality conferred by distance. Since accessibility is dominantly the
outcome of transportation activities, namely the capacity of
infrastructures to support mobility, it presents the most significant
influence of transportation on location. Hence, it appears that location
(accessibility) and economic activities are intimately linked.
2.5. URBAN STRUCTURE APPROACHES AND MODELS
Although accessibility is an element inherent in all the physical
organizations of space and movement systems, some models or
approaches give more central role to it in building a theory. Much of the
recent work on accessibility concepts has been primarily focused on
transportation [Chapin Jr., 1964].79
2.5.a. Guttenberg’s Approach
Guttenberg [1960]80,81 has developed a theoretical approach to urban
structure and city growth which utilizes accessibility as an organizing
concept what he calls "a community effort to overcome distance". He
79 Chapin, F. Stuart. Jr. (1964), Selected theories of urban growth and structure,
Journal of American Institute of Planners, February, 30, PP. 51-58.
80 Guttenberg Albert Z. (1960), Urban structure and urban growth, Journal of the American Institute of Planners, XXVI, May, PP. 104-110.
81 Chapin, F. Stuart. Jr. (1964), Selected theories of urban growth and structure, Journal of American Institute of Planners, February, 30, PP. 51-58.

Impact of Accessibility on Urban Structure of Amritsar City 2012
Page | 81
identifies three components. He subdivides the first into "distributed
facilities" and "undistributed facilities", with these being a function of the
third component, "transportation". The rationale states that if transportation
is poor, the workplaces, trade centres, and community services will tend to
assume a pattern of distributed facilities. If it is good, these activities will
assume more concentrated patterns in the form of undistributed facilities.
Thus, Guttenberg maintains that urban spatial structure is intimately tied up
with the aggregate effort in the community to overcome distance.
He sees the spatial gradation of density outward from distributed and
undistributed facilities as a function of access. He points out that his
distributed centres of activity acquire a value in accordance with the
substitutability of that place for the chief place, with the physical density
gradient outward from these centres corresponding closely with, but not
necessarily directly coincident with, the economic density gradient. In the
context of his framework, therefore, the slope of the economic density
gradient is closely related to transport efficiency as it enables outlying
locations to substitute for more central locations.
In examining the implications of growth for his concept of urban structure,
he points out that the transportation system holds the key to the way in
which growth proceeds. The transportation decisions made from one year
to another will result in a constantly changing urban structure, with the
emphasis shifting along the continuum between the situation with highly
distributed centres to the situation with one major undistributed facility. He
implies that there is some limit in the ability of the undistributed facility
continuing indefinitely to function as the only major center as compared to
the capacity that distributed centres have for absorbing growth. As growth
occurs, structural adjustments to overcome distance can take the form of
either new centres or improved transportation facilities. Commonly both
occur, with the enlarged scale and resulting changed relationships among
home, work and various activity centres, population movements ensue.

Impact of Accessibility on Urban Structure of Amritsar City 2012
Page | 82
With these shifts the areas which do offer the accessibility that people seek
develop, and those which do not, decline in a social and an economic
sense. With growth, the enlarged scale alters the density gradient. If
transport efficiency is improved, favoring the substitution of outlying for
central locations (as has been the case in Los Angeles), the slope of the
density gradient is flattened, the region spreads out, and, depending upon
the amount of population influx in relation to the area added, the density
may go down.
How may such a view of urban structure and urban growth be used in
anticipating urban form in the future? Guttenberg acknowledges that
transport efficiency is not the sole variable. He notes that activities may
choose a location in relation to a central place for reasons other than time-
distance. For example, a change of economic composition in the region
may produce new location patterns. However, assuming such other things
are constant (similar economic conditions, terrain, tastes, and so on), he
maintains that accessibility in term of time distance serves to sort activities
spatially. If the additional assumption is introduced that the transportation
system remains similar over time, he points out that there will be
comparability in accessibility and therefore, we may anticipate similar
patterns in the distribution of activities in the region. He does not discuss
the complexities of prediction involved when constraints are relaxed and
one by one the elements held constant are allowed to vary, but it is clear
that by introducing differing combinations of assumptions the interplay of
these elements quickly becomes exceedingly complex.
In the present age of development, this conceptual framework centres
mainly on the physical aspects of a theoretical system of urban structure
and growth. Its distinctive feature is emphasized. It gives interplay between
the location of urban activities and transport efficiency. In the sense that
activity concentrations and transportation are continuously interacting and
that accessibility provides an organizing rationale for urban structure and a

Impact of Accessibility on Urban Structure of Amritsar City 2012
Page | 83
regulating concept for urban growth, the framework is a dynamic one,
supplying and evolutionary basis for explaining the urban form. While it has
a well developed logical context and a direct relation to reality,
Guttenberg's statement gives no indication as to how this framework is to
be translated into an analytical system and given empirical form.
2.5.b. Wingo’s Approach
Lowdon Wingo Jr. as cited by Chapin Jr., 1964]82 provides a systematic
and rigorous statement of urban spatial structure in the framework of
equilibrium theory to propose in economics. Traditionally, economists have
dealt with location as a constant, and there has been a disinterest or an
unwillingness to examine location as a variable. In his work, Wingo lifts this
constraint. He seeks to give explicit recognition to the way in which policy
affects the market and how in turn these effects are reflected in urban
spatial structure. In this sense, he is seeking to relate theory to real-world
situations. However, in addition he seeks to bring developments in spatial
models into closer harmony with general economic theory and to relate
theoretical work on location to the broader concepts of the urban economy.
Directing his attention mainly to residential development, Wingo develops
first a concept of transportation demand, considering the spatial
relationship between home and work. With the journey to work viewed as
"the technological link between the labor force and the production process",
he defines demand for movement as the total employment of an urban area
multiplied by the frequency of work – in other words, the number of trips
required to support the production process. Wingo recognizes the
propensity for urban society to substitute communications for transportation
and stresses the necessity for taking into account technological
developments in this respect. The supply aspect is expressed in terms of
the capability of a movement system – a measure of its ability to
82 Chapin, F. Stuart. Jr. (1964), Selected theories of urban growth and structure,
Journal of American Institute of Planners, February, 30, PP. 51-58.
Impact of Accessibility on Urban Structure of Amritsar City 2012
Page | 84
accommodate movements between home and work. Drawing on a
somewhat similar concept of accessibility as that discussed above, he uses
as a unit of measurement the cost of transportation based on the time
spent in movement between points and the out-of-pocket costs for these
movements, expressed in money equivalents for distance and number of
trips.
The central problem of this kind of economic model is to achieve an
equilibrium distribution of households of particular rent-paying abilities to
sites with a particular structure of rents. Wingo achieves this location
equilibrium by substituting transportation costs for space costs. Thus, on
the supply side, he utilizes transport costs to establish the distribution of
household sites at varying position rents. He defines position rent as "the
annual savings in transportation costs compared to the highest cost
location in use." On the demand side, if prices for other goods competing
for the household dollar are held constant, the rents households are willing
to pay are based on the marginal utility concept, which holds that the
greater the unit rent, the fewer the units of space consumed. Clearly, this
view of space use immediately involves density, and the smaller the
quantity of space consumed in the more accessible locations, the higher
the density. The spatial distribution of these densities in the urban area
involves the density gradient concept with the slope falling off from the
center of the city to the outskirts. To get at the characteristics of demand in
the spatial context, Wingo constructs a demand schedule and utilizes
appropriate position rents from this schedule to determine the point at
which prices and densities are in equilibrium.
The economic model that Wingo advances functions under the usual
behavioral axiom that those who control residential space and households
who seek space will each behave to maximize their returns. He specifies as
given: the locations of employment centres, a particular transportation
technology, a set of urban households, the marginal value the worker
Impact of Accessibility on Urban Structure of Amritsar City 2012
Page | 85
places on leisure and the marginal value households place on residential
space. Wingo then uses his model to determine the spatial distribution of
densities and rents, and the spatial distribution, value, and extent of land
required for residential use.
2.5.c. Bid Rent Approach
The bid rent theory is based on microeconomic theory and was mainly
developed in the context of urban land uses and urban land values (Alonso,
1964 or Mills, 1972, Muth, 1969 and Hamilton, 1994) as cited bt [Chapin
Jr., 1975].83 Alonso modelled bid rent theory for urban land uses in 1964 as
an extension to Von Thunen‟s model, which was applicable to rural uses.
His model suggests land use, rent, intensity of land use, population and
employment as a function of distance to the central business district of the
city as a solution of equilibrium for the market for space. The bid rent
function explains the relation between urban land uses and urban land
values. In a very simplified view, households and companies make a trade-
off between the land price, transportation costs and the amount of land they
use. This results in a convex land price curve with the highest land prices
near the city centre.
Alonso uses the market mechanism in a somewhat different manner to
distribute space users to urban land. Instead of developing a demand
function, he uses "bid price curves," which in interaction with the price
structure of land are used as a basis for distributing agricultural, business,
and residential users to sites. Beginning at the center of the city, land is
"put up for bid" and on the basis of these curves the bid for the most central
site is compared to the next preferred alternative, with this preferred
alternative being the marginal combination of price and location for that
particular use. On the basis of the steepest bid price curve, the highest
83 Chapin, F. Stuart. Jr. (1975), Toward a theory of urban growth and development,
in M.C. Branch (Ed.), Urban planning theory, Stroudsburg, Hutchinson, PP. 144-163.

Impact of Accessibility on Urban Structure of Amritsar City 2012
Page | 86
bidder takes the most central site; the next highest bidder corresponding to
the second steepest curve takes the next most central site still available;
and so on (refer figure 2.4).
Figure 2.4: Bid Rent Curve
For the first space user the price paid at the bid location is determined by
the price at the marginal location, but for the next user what was a marginal
location for the first user becomes the equilibrium location for him, with his
bid price determined by the price at the marginal location for this site, and
so on down the chain.
2.5.d. Monocentric Approach
Alonso‟s model as cited in [Anas, Arnott and Small, 1998]84 depicts
monocentric structure of a city, in which the city a envisaged as a circular
residential area surrounding a central business district (CBD) in which all
the jobs are located. Monocentric city structure is a closed city model with
fixed population residing in it and is constrained by distance from CBD,
measured as commuting cost to the CBD. Land use in the simple
84 Anas, Alex, Richard Arnott and Kenneth A. Small (1998), Urban spatial structure,
Journal of Economic Literature, 36, 3, September, PP. 1426-1464.
Impact of Accessibility on Urban Structure of Amritsar City 2012
Page | 87
monocentric model is efficient i.e. the equilibrium density pattern is Pareto
optimal. This is because there are no externalities and land use decisions
are based entirely on tradeoffs between desire of space and commuting
costs. The monocentric city model is criticized on the account that it
implicitly assumes that businesses have steeper bid rent function than
residents, so that all jobs are centrally located. This assumption does not
hold true in practice as employment is distributed in a circular manner and
commuters choose to move radially inward to work. A more fundamental
limitation is that it is a static model.
2.5.e. Polycentric Approach85
Theoretical models of urban structure are based on the assumption that all
jobs are located in the central business district (CBD). Although this
assumption was never literally true, it is a useful approximation for a
traditional city in which the CBD holds the only large concentration of jobs.
As metropolitan areas have become increasingly decentralized, traditional
CBDs have come to account for a much smaller proportion of jobs than in
the past. Large employment districts have arisen outside of central cities
that rival the traditional city center as places of work. When these districts
are large enough to have significant effects on urban spatial structure, they
are referred to in the urban economics literature as “employment sub-
centers.”
The distinction between a metropolitan area with multiple sub-centers (or a
polycentric urban structure) and one with much more dispersed suburban
employment has important policy implications. Public transportation can be
designed to serve sub-centers. Buses can help alleviate severe
congestion, and commuter rail lines may be able to serve large sub-
85 McMillen, Danial (2001), Polycentric urban structure: the case of Milwaukee, Economic Perspectives, 2Q, Federal Reserve Bank of Chicago.

Impact of Accessibility on Urban Structure of Amritsar City 2012
Page | 88
centers. Large sub-centers may have enough jobs to warrant designing
public transportation that brings central city workers to suburban job
locations, which can help alleviate problems of a “spatial mismatch”
between jobs and central city workers. The term “urban sprawl” appears to
be used to describe an urban area whose residents have moved farther
and farther from the central city, while driving past pockets of farmland and
open space to get to their suburban jobs. Sprawl is likely to be less of a
problem in an urban area whose suburban jobs are concentrated in sub-
centers. If jobs are confined to a relatively small number of suburban sites,
workers will attempt to reduce their commuting costs by living nearby. This
tendency toward suburban centralization is reinforced when transportation
facilities are designed to serve the sub-centers.
Empirical researchers have long recognized that cities are not truly
monocentric. Variables representing distance from various employment
sites other than the CBD are frequently included as explanatory variables
in empirical studies of housing prices, employment density, and population
density. Although the monocentric employment density function implies that
gradients do not vary across the urban area, multiple sub-centers or
distinctive topographical features may lead to variations in gradients.
2.5.f. Other Urban Spatial Structure Models86
In early 20th century different researchers gave spatial structure models for
urban areas. The important amongst those are as under.
2.5.f.i. Concentric Zone Theory
Burgess [1924] as cited by Torrens [2000] developed the concentric zone
theory of urban land use. The concentric zone theory of urban land use is
86 Torrens, Paul M. (2000), How land use- transportation models work, Working Paper-20, Centre for Advanced Spatial Analysis, London, April.
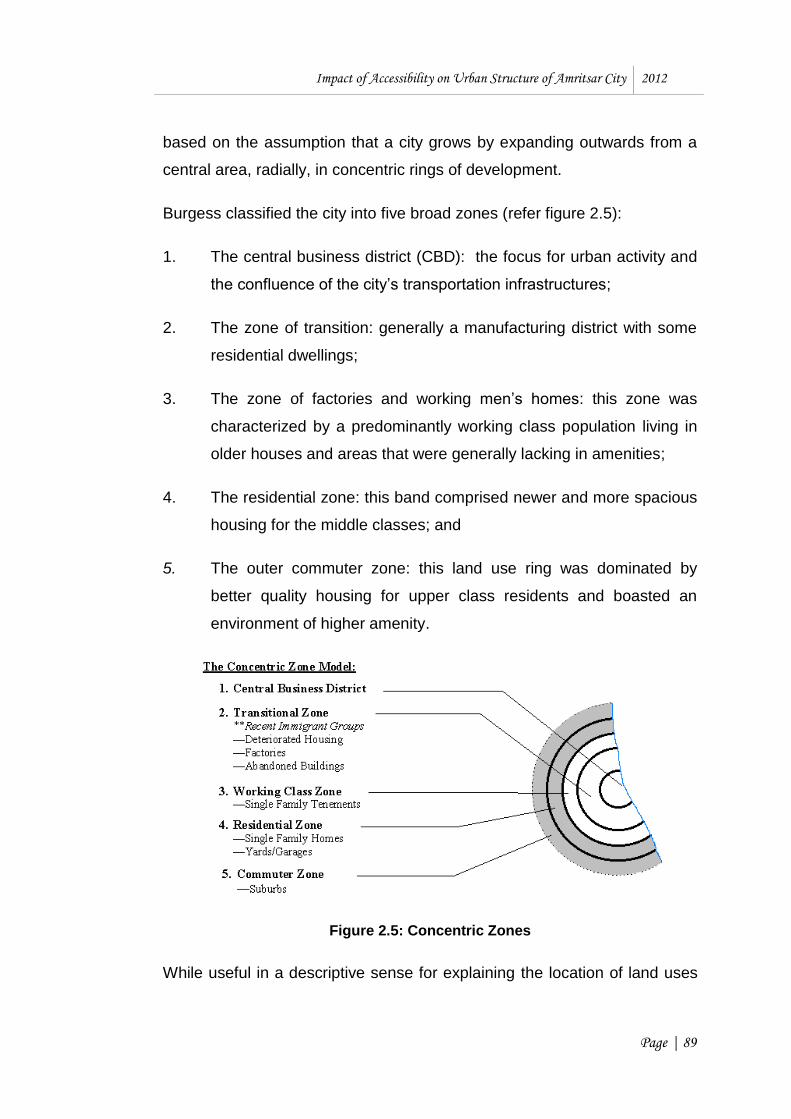
Impact of Accessibility on Urban Structure of Amritsar City 2012
Page | 89
based on the assumption that a city grows by expanding outwards from a
central area, radially, in concentric rings of development.
Burgess classified the city into five broad zones (refer figure 2.5):
1. The central business district (CBD): the focus for urban activity and
the confluence of the city‟s transportation infrastructures;
2. The zone of transition: generally a manufacturing district with some
residential dwellings;
3. The zone of factories and working men‟s homes: this zone was
characterized by a predominantly working class population living in
older houses and areas that were generally lacking in amenities;
4. The residential zone: this band comprised newer and more spacious
housing for the middle classes; and
5. The outer commuter zone: this land use ring was dominated by
better quality housing for upper class residents and boasted an
environment of higher amenity.
Figure 2.5: Concentric Zones
While useful in a descriptive sense for explaining the location of land uses

Impact of Accessibility on Urban Structure of Amritsar City 2012
Page | 90
in a monocentric city not surprisingly come under heavy criticism. Amongst
the complaints leveled have been accusations that the models are too rigid
to ever accurately represent actual land patterns (the monocentric city
assumption is perhaps the largest flaw). Burgess has also been accused of
overlooking the important influence of topography and transport systems on
urban spatial structure and have been criticized for failing to accommodate
the notion of special accessibility and ignoring the dynamic nature of the
urban land use pattern.
2.5.f.ii. Sector Theory
Development of the wedge or radial sector theory of urban land use is
generally attributed to the work of Hoyt (1939). Hoyt‟s model concerns itself
primarily with the location of residential uses across urban areas; it refers to
business location only in an indirect fashion. The model seeks to explain
the tendency for various socio-economic groups to segregate in terms of
their residential location decisions. In appearance, Hoyt‟s model owes a
great deal to Burgess‟s concentric zone model. Hoyt presents wedge-like
sectors of dominant urban land use, within which he identifies concentric
zones of differential rent. The model suggests that, over time, high quality
housing tends to expand outward from an urban centre along the fastest
travel routes. In this way, Hoyt transforms Burgess‟s concentric zones into
radial or sectoral wedges of land use (refer figure 2.6).
Figure 2.6: Hoyt’s Sector Model
1 Central Business District
2. Wholesale and Light Manufacturing
3. Low Class Residential
4. Middle Class Residential
5. High Class Residential
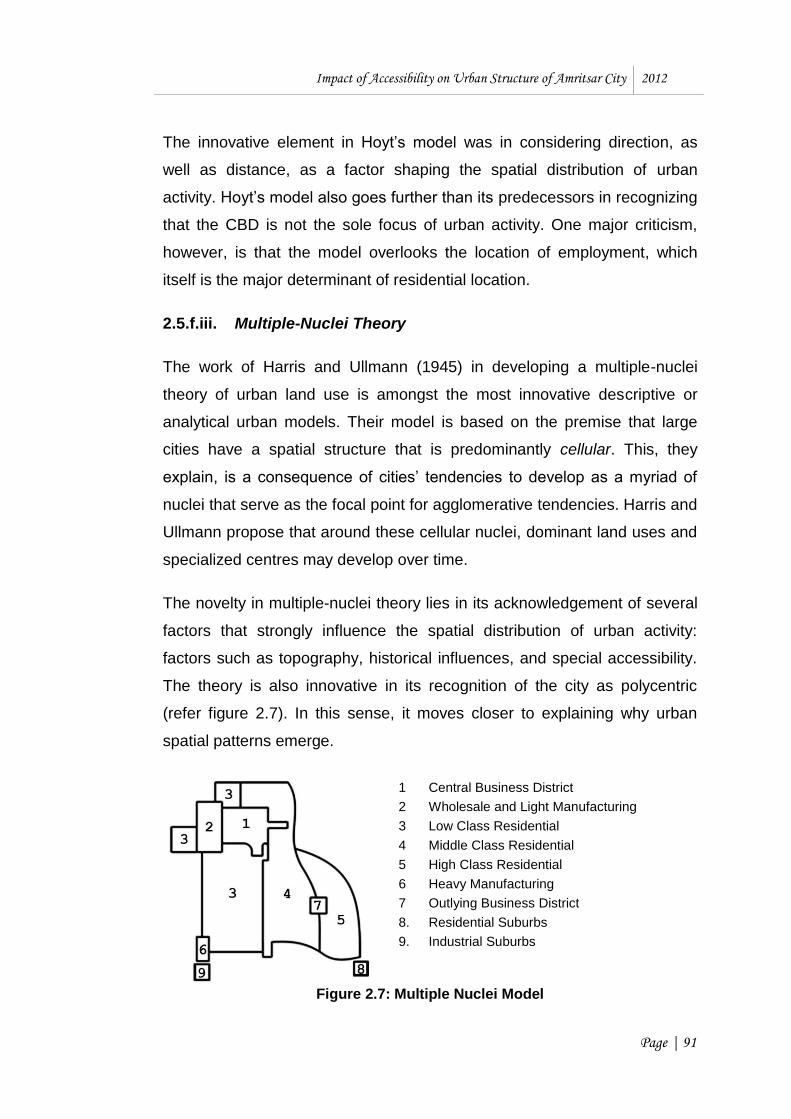
Impact of Accessibility on Urban Structure of Amritsar City 2012
Page | 91
The innovative element in Hoyt‟s model was in considering direction, as
well as distance, as a factor shaping the spatial distribution of urban
activity. Hoyt‟s model also goes further than its predecessors in recognizing
that the CBD is not the sole focus of urban activity. One major criticism,
however, is that the model overlooks the location of employment, which
itself is the major determinant of residential location.
2.5.f.iii. Multiple-Nuclei Theory
The work of Harris and Ullmann (1945) in developing a multiple-nuclei
theory of urban land use is amongst the most innovative descriptive or
analytical urban models. Their model is based on the premise that large
cities have a spatial structure that is predominantly cellular. This, they
explain, is a consequence of cities‟ tendencies to develop as a myriad of
nuclei that serve as the focal point for agglomerative tendencies. Harris and
Ullmann propose that around these cellular nuclei, dominant land uses and
specialized centres may develop over time.
The novelty in multiple-nuclei theory lies in its acknowledgement of several
factors that strongly influence the spatial distribution of urban activity:
factors such as topography, historical influences, and special accessibility.
The theory is also innovative in its recognition of the city as polycentric
(refer figure 2.7). In this sense, it moves closer to explaining why urban
spatial patterns emerge.
Figure 2.7: Multiple Nuclei Model
1 Central Business District
2 Wholesale and Light Manufacturing
3 Low Class Residential
4 Middle Class Residential
5 High Class Residential
6 Heavy Manufacturing
7 Outlying Business District
8. Residential Suburbs
9. Industrial Suburbs
Impact of Accessibility on Urban Structure of Amritsar City 2012
Page | 92
2.6. ACCESSIBILITY - URBAN STRUCTURE RELATIONSHIPS
Urban transportation system is a basic component of an urban area‟s
social, economic and physical structure. Not only that, the design and
performance of transportation system provide opportunities for mobility, but
also over a long run it influences patterns of growth and levels of economic
activity through the accessibility it provides to the land. Recognizing the
importance of accessibility, World Bank‟s Development Report [2009]87,
„also states that accessibility is today recognized as an important factor in
the development of territories, regions and cities. It is seen as a central
agglomeration benefit and driver in the economic and social development
of places‟.
Transportation is a measure of relations between areas. The relations and
connections between areas are frequently reflected in the character of the
transportation facilities and in the flow of traffic, involving such basic
concepts as spatial interaction and areal association. The overcoming of
distance is so basic to geography that spatial differentiation cannot develop
without movement. The character of transportation as a whole and in detail
at any particular time and through its history is altogether determined by its
inter-relations with physical & social forces and conditions [Hurst, 1974].88
Ullman and Crowe saw movement as an indicator of the degree of
connection between areas on the earth‟s surface and as underlying all
patterns of inter-change.
Thus, accessibility is an element inherent in the physical organization of
space and movement systems. Much of the recent work on accessibility
87 World Bank (2009), Reshaping economic geography, World Bank Development Report, Washington DC, USA.
88 Hurst, M. E. Eliot (1974), The geographic study of transportation: its definition, growth and scope, in M. E. Eliot Hurst (Ed.), Transportation geography: comments and readings, McGrawhill Book Company, New York, PP 1-15.

Impact of Accessibility on Urban Structure of Amritsar City 2012
Page | 93
concepts have been primarily focused on transportation. Although this work
has had a very considerable impact on research in urban spatial structure.
Hansen [1959]89 in his work on developing a model for residential land use
for Washington D.C. based his research to the examination of relationships
between residential development and accessibility to commercial, industrial
and residential locations. He calculated the different between vacant
developable area, which he termed as probable development, and
developed area and assumed that the variance between the two is related
to accessibility. Development ratio (actual development divided by probable
development) was calculated and it was inferred that it has high correlation
with accessibility to employment and population.
In the opinion of Ingram [1971]90 accessibility is a frequently used term in
human geography in explanations of the spatial variation of phenomena. In
urban geography, it is used in explanations of the growth of the towns; the
location of facilities and functions; and the juxtaposition of land uses.
Variations in the degree of accessibility are related to variations in
population densities and land values.
Nelson [1973]91 in his study states that in choosing residential location
consumers judge accessibility by considering monetary expenditure
required for necessary household facilities and the amount of time required
to get from that location to other locations in the city that they expect to
visit. The locations for which the consumer would be willing to pay the
highest rents would be those that are most accessible for the consumption
of the largest number of goods which, up to every higher prices, will be
consumed at a higher level. The extent to which the rents at those
89 Hansen, W. G. (1959), How accessibility shapes land use, Journal of American
Institute of Town Planners, May, 25, 2, PP.73-76.
90 Ingram, D. R. (1971), The concept of accessibility: a search for an operational form, Regional Studies, 5. PP. 101-107.
91 Nelson, R. H. (1973), Accessibility and rent: applying becker’s ‘time price’ concept to the theory of residential location, Urban Studies, 10. PP. 83-86.
Impact of Accessibility on Urban Structure of Amritsar City 2012
Page | 94
advantageous locations exceed rents at less accessible locations depends
on the extent to which the consumer can substitute other items of
consumption as accessibility is reduced or rearranged consumption cannot
be found, the consumer will obviously be willing to pay a high rent for
accessibility in order to avoid great loss in utility as accessibility declines.
Kan [1976]92 in his study on „interaction of transportation and land use‟
attempted to isolate the impact on employment and household density of
changing transportation cost as measured by accessibility. It attempted to
develop a theoretical model of spatial development as a result of reduction
in transportation costs. The structure changes in the said parameters were
predicted for 159 counties of Georgia to account for improved and
deteriorated transportation situations. Population density, household
density, employment density, percentage of single family dwellings, and
mean income are taken as dependent variables to determine the structural
relationships. Most of the relationships obtained had direct and positive
relationships with varying goodness of fit to reveal the impact.
Dalvi and Martin [1976]93 while comparing patterns of accessibility
measured in terms of total employment, retail employment, households and
population reveal that there are considerable variations with respect to total
employment and retail employment reflecting high concentration of
employment in the central area. Whereas lesser variations are recorded
with respect to households and population. The degree of correlation
between total employment and retail employment index is found to be quite
high (+ 0.922), so is the case for household and population indexes (+
0.968). The lowest correlation coefficient is found between total
employment and population (+ 0.14). The study reveals that maximum
92 Kan, James B. (1976), The interaction of transportation and Land Use, in Paul F. Wendt (Ed.), Forecasting Transportation Impacts upon Land Uses, Kluwer Academic Publisher, Netherlands.
93 Dalvi, M. Q and K. M. Martin (1976), The measurement of accessibility: some preliminary results, Transportation, 5, PP. 17- 42.
Impact of Accessibility on Urban Structure of Amritsar City 2012
Page | 95
accessibility jobs is not at the centre of the city but in the ring approximately
5 minutes away from the centre in spite of the fact that large number of jobs
are available in the centre. Similar pattern is seen for the retail employment
with the difference that its peak value is lesser compared to total
employment.
Black and Conray [1977]94 in their study for Sydney, Australia to identify
areas having relatively poor accessibility to jobs with a view to suggest
alternative models to improve the same identified that very few
opportunities could be reached within 30 minutes for the study area. It
takes about three-quarters of an hour to reach half the jobs of Sydney by
car but it takes 80 minutes to 2 hours to reach the same proportion of jobs
by public transport. Also, all outer suburbs have low accessibility
irrespective of the socio-economic status of the area.
While evaluating the impact of alternative spatial structures it was revealed
that the proposed relocation of jobs into public transport corridors had only
small effect on accessibility for workers in the outer suburbs. While
proposed dispersal of employment throughout the urban area (equal
number of job allocated to each zone) far greater impact on altering
resident‟s accessibility. Improvements in public transport increased male
accessibility slightly but female accessibility increased considerably.
Dallal [1980]95 while mapping household accessibility to public transport,
and proposing public transport plan for Borough, London revealed that high
income people of the Borough have the tendency to live in high
accessibility areas while converse is true for low income people. However,
in the outer metropolitan areas high income population tend to live in low
accessibility areas.
94 Black, J. and M. Conroy (1977), Accessibility measures and the social evaluation
of urban structure, Environment and Planning A, 9, PP.1013-1031.
95 Dallal, E. A. (1980), Public transport accessibility measurement, Traffic Engineering and Control, October, 21, 10, PP.494-495.

Impact of Accessibility on Urban Structure of Amritsar City 2012
Page | 96
In an effort to study accessibility to employment in Delhi Suryanarayna,
Sarna and Malhotra [1986]96 used normalized version of Hansen‟s
accessibility measure and one way work trips from home to work for
government service and other employment were considered for the
purpose. The study revealed that accessibility to government employment
is better than to total employment in case of all the zones for various
modes. All the opportunities can be approached by car in 50 minutes by car
in case of government jobs and 60 minutes in case of total employment.
Recognizing the role of transport in urban development Banister and
Lichfielf [1995]97 mentioned that transport has a major impact on the spatial
and economic development of cities and regions. The attractiveness of a
particular location depends in part on relative accessibility, and this in turn
depends on the quality and quantity of transport infrastructure. They also
pointed that changes in accessibility give an area a new competitive
advantage over the other areas, which in turn results in greater levels of
efficiency and higher productivity.
Study conducted by Misra [1995]98 for assessing the impact of accessibility
on the structure of metropolitan region (National Capital Region) reveals
most of the accessibility measures adopted in the study showed
consistency with the parameters of urban structure. Model share plays a
very important role in determining accessibility for identical system
characteristics.
96 Suryanarayana, Y., A. C. Sarna & S. K. Malhotra (1986), Accessibility to
employment in Delhi - a case study, Road Research Papers, No. 215, Central Road Research Institute, New Delhi, India.
97 Banister, David and N. Lichfield (1995), The key issues of transport and urban development, in David Banister (Ed.), Transport and urban development, E & FN SPON, London, First Edition, PP. 1-16.
98 Misra, R., (1995), Critical evaluation of metropolitan region structure and accessibility; case study national capital region (Delhi), Unpublished Thesis, School of Planning and Architecture, New Delhi, India.

Impact of Accessibility on Urban Structure of Amritsar City 2012
Page | 97
Manglik and Gupta [2000]99 while highlighting the importance and utility of
accessibility in land use planning decisions concluded that travel distance
based accessibility impacts land uses more significantly than time based
accessibility. Thus, travel distance based accessibility is a better
explanatory variable for assessing impacts on residential and commercial
development.
Sarwal [2001]100 in her study on landuse and accessibility relationship for
Chandigarh has assessed the public transport accessibility to major
administrative, educational and workplaces of the city. Identified that there
are large variations in accessibility levels between the areas close to the
selected zones and the ones that are studied at comparatively more
distances. The selected top ten most inaccessible areas have shown
remarkable improvements in their accessibility levels after proposed
increase the frequency of bus transport service. Thus, improvements in
accessibility levels are expected to improve the land utilization rate
significantly in these areas.
While addressing the role of transportation on urban spatial structure
Bertaud [2002]101 concluded that transport has to be adapted to urban
structures not the other way around and urban spatial structures are path
dependent, some structures are irreversible. More rigorously, he points that
urban structures are dependent on the interaction of the land market with
regulations, but ignoring the land market to rely entirely on regulations to
“optimize” land use has serious side effects. Dominantly monocentric cities
99 Manglik, Shipra and Sanjay Gupta (2000), Accessibility and land use relationship
in a medium-sized town of Uttar Pradesh: case study- Bulandshahr, Spatio-Economic Development Record, May-June, Vol.7, No.3, and PP.29-35.
100 Sarwal, Raveena (2001), Landuse and accessibility- a case study of Chandigarh,
Unpublished Thesis, School of Planning, Centre for Environment Planning and Technology, Ahmedabad, January.
101 Bertaud, Alain (2002), Note on urban transportation and urban spatial structure, http://alain-bertaud.com/images/AB_Transportation_and_Urban_Spatial_ Structure_revised2.pdf

Impact of Accessibility on Urban Structure of Amritsar City 2012
Page | 98
and high density cities are more favorable to transit than dominantly
polycentric and low density cities. He suggested that whenever a city is
dominantly monocentric and has a high or medium density is it legitimate to
try to maintain this spatial structure through an enabling regulation and
appropriate infrastructure investments. This will probably contribute to
maintain a high level of public transport use. On the other hand, when a
city‟s current spatial structure is dominantly polycentric and low density,
appropriate measure of transport has to be found to decrease pollution and
congestion. A shift toward a higher use of transit is probably not among the
feasible solutions.
In their study on evaluation of urban structure through accessibility criteria
Reddy and Moorthy [2004]102 suggested that urban form with central CBD
with square shape gives maximum spatial separation and maximum
employment opportunities to the given residential zone. Whereas the urban
form with eccentric CBD as well as the linear shape gives maximum spatial
separation and minimum availability of jobs to the given residential location.
In a study conducted by Du and Mulley [2007]103 for examining the impact
of transport accessibility on land values in Tyne and Wear region of UK it is
reveals that the relationship between transport accessibility and land value
varies over space giving clues to the interaction between transport
infrastructure and land use, which have long been a key subject in the
transport planning. The study suggests that a land value capture policy
must take into account this lack of homogeneity and that the application of
a uniform „tax‟ would be inappropriate.
102 Reddy, N. Srinivasa and N. V. Rama Moorthy (2004), Evaluation of urban
structure through accessibility criteria, Proceedings of International Conference on Transportation systems planning and operation, IIT Madras, Chennai, India, February.
103 Du, Hongbo and Corinne Mulley (2007), Transport accessibility and land value: a case study of Tyne and WearI, RICS Research Paper Series, 7, 3, June.
Impact of Accessibility on Urban Structure of Amritsar City 2012
Page | 99
2.7. SUMMARY
Thus, there is no consensus on the concept and definition of accessibility
and urban structure till date. The primary reason for the same is that
changed conditions change the suitability of the parameter to measure
accessibility. But even then distance, time and costs have remained in the
base of every dimension of accessibility measurement. However,
parameters of urban structure have been quite varying. But density and
land values have been tested in most of the studies. Literature review also
makes it clear that the concept of accessibility has wide application in
urban & regional and transportation planning disciplines.
*********************


