
6-1
CHAPTER 6 PRELIMINARY DESIGN
6.1 ENGINEERING SURVEYS UNDERTAKEN
6.1.1 General This section of the report highlights the engineering surveys undertaken for the proposed. Following two (2) engineering survey was conducted; (1) Topographical Suvey (2) Soils and Geo-technical Investigation
6.1.2 Topographical Survey
Table 6.1.2-1 shows summary of survey work conducted.
TABLE 6.1.2-1 SUMMARY OF TOPOGRAPHICAL SURVEY No Item Value Remark 1 Coordinate. grid PRS-92 2 Methodology Conformed to DAO*
DENR regulation
3 Reference for Horizontal NAMRIA NEJ-44 1st Order NAMRIA NEJ-58 3rd Order
4 Reference for Vertical NAMRIA TA-254 1st Order NAMRIA TA-262 3rd Order
5 Quantity of levering 30.480 km For profile 6 Quantity of topographic survey 4,876,865.44 sqm For Main alignment 7 Quantity of topographic survey 2,191,500 sqm For IC 8 Quantity of topographic survey 160,000 sqm For bridge, 200m both upper
stream and down stream 9 Cross Sectional Survey 608 cross section Every 50m interval 80m both
sides from center line *DAO-Department Administrative Order. DENR-Department of Environment and Natural Resources
6.1.3 Soils and Geo-Technical Investigation
The geological survey conducted in the previous feasibility study was referred for the study. The following Soils Investigation along road alignment has been conducted especially where alignment has been changed. Including some important description of the past feasibility study, geotechnical feature is described as below;

6-2
(1) General Geology
1) Topography
Nueva Ecija The terrain of Nueva Ecija begins with the southwest marshes near the Pampanga border. It levels off and then gradually increases in the elevation to rolling hills as it approaches the mountains of Sierra Madre in the east, and the Caraballo and Cordillera ranges in the north.
It is dominated by a broad expanse of alluvial plain covering more than one-half of the whole provinces. The only areas of high relief are the northern and eastern boundaries where the Sierra Madre, Cordillera and the Caraballo Mountains occur. The Sierra Madre constitutes one continuous topographic unit that forms an almost north-south trending block bordering the eastern boundary of the provinces of Quezon. The alluvial plain is gently undulating towards the east and rises abruptly to the Sierra Madre Cordillera.
Tarlac The Tarlac province is situated in the Central Plain of Luzon and is bounded by Pangasinan Province on the north, Nueva Ecija Province on the east, Pampanga Province on the south, and the Zambales Province on the west. Its exact position is between 120010’ to 120047’ longitudes and 15010’ to 15055’ north latitude. The location of this province in Central Luzon is nearer to the Gulf of Lingayen than to Manila Bay. Tarlac, the provincial capital, is 131.3 kilometers from Manila.
There are two distinct geographical areas in the province. The northern and eastern parts consist of an extensive level plain of recent alluvial deposits of sand, silt and small amount of clay. The western and northwestern parts consist of hills and mountains comprising the eastern sides of the Zambales mountain range. There are three prominent mountains in this range, namely, Dome Park (1,389 meters high), Iba Mountain (1,605 meters high) and Sawtooth Mountain (1,806 meters high). These mountains and the areas surrounding them consist of volcanic rocks of basalts and andesites. The andesites are mostly porphyritic.
2) General Geology
Geologically, the plain of the provinces consists of recent alluvial deposits of various materials. The depths of these deposits vary in many places according to the elevation of the area. The absence of gravel, cobble-stones, and pebble in the substratum shows that these deposits were made by slow-moving streams. The mountains in the northern part consist of Tertiary undifferentiated rocks, while those on the eastern sides consist of Tertiary and later effusive rocks of rhyolites, dacites, and basalts. The foothills on the western flank of Sierra Madre Range consist of narrow strips of volcanic tuff material, sandstone, shales and limestones.
The rock formation in the province is represented by time units ranging in the age from Pre-Cretaceous to Quarternary. Below is the Geology of Nueva Ecija presented in tabulated form. This is adopted from the Geology and Mineral Resources of Nueva Ecija by Leonardo R. Antonio.
3) Regional Tectonic and Seismic Setting
The major structural element recognized in the area of Nueva Ecija is the Dingalan-Dingalan-Gabaldon Rift; a segment of Philippine Fault. The fault appears to be the major factor that influences the formation of Gabaldon Valley. It trends N 400W and branches out into numerous secondary faults of minor magnitude that the northeastern part, cutting the Cretaceous-Paleogene rock series. These secondary faults appear to have sliced the rocks into a

6-3
series of parallel fault blocks. The orientation of these faults, together with the schistocity and fold axes appears to be closely related to the major northwest structure.
Gabaldon lies along the boundary between the northerly trending Southern Sierra Madre Mountains and the northeasterly trending Northern Sierra Madre Mountains. The Sierra Madre Mountain Ranges represent the uplifted magnetic arc form during the westward subduction of the Philippine Sea Plate beneath the Eurasian Plate. Offshore, to the east of Sierra Madre Mountains, the surface extension of the subduction zone is represented by the East Luzon Trough, a north-northeasterly trending ocean trench that extends from northeast of Luzon to east of Gabaldon. Offshore to the west of Luzon to Mindoro. Folding of Tertiary deposits, strike-slip and thrust faulting of the Sierra Madre Mountains, and uplift and unroofing of the East Luzon Trough and the Manila Trench (Ringenbach, 1992).
The Philippine Fault Zone is a major left-lateral strike-slip fault zone that has a mapped length of 1,200 km from the eastern part of Mindanao to Northern Luzon. Slip on the Philippine Fault Zone accommodates a significant portion of oblique convergence between the Philippine Sea and Eurasian Plates (Acharya, 1980; Acharya and Aggarwal, 1980). The Philippine Fault Zone trends northwest from Dingalan Bay just east of Gabaldon to the southern end of the Central Cordillera; this reach of the fault is referred to as the Philippine Fault. Northwest of Gabaldon the Philippine Fault splays into the Digdig Fault and the San Jose Fault are considered to be active, on those, are potential sources of future earthquakes.
FIGURE 6.1.3-1 DISTRIBUTION OF EARTHQUAKE GENERATORS
IN THE PHILIPPINES
6-4
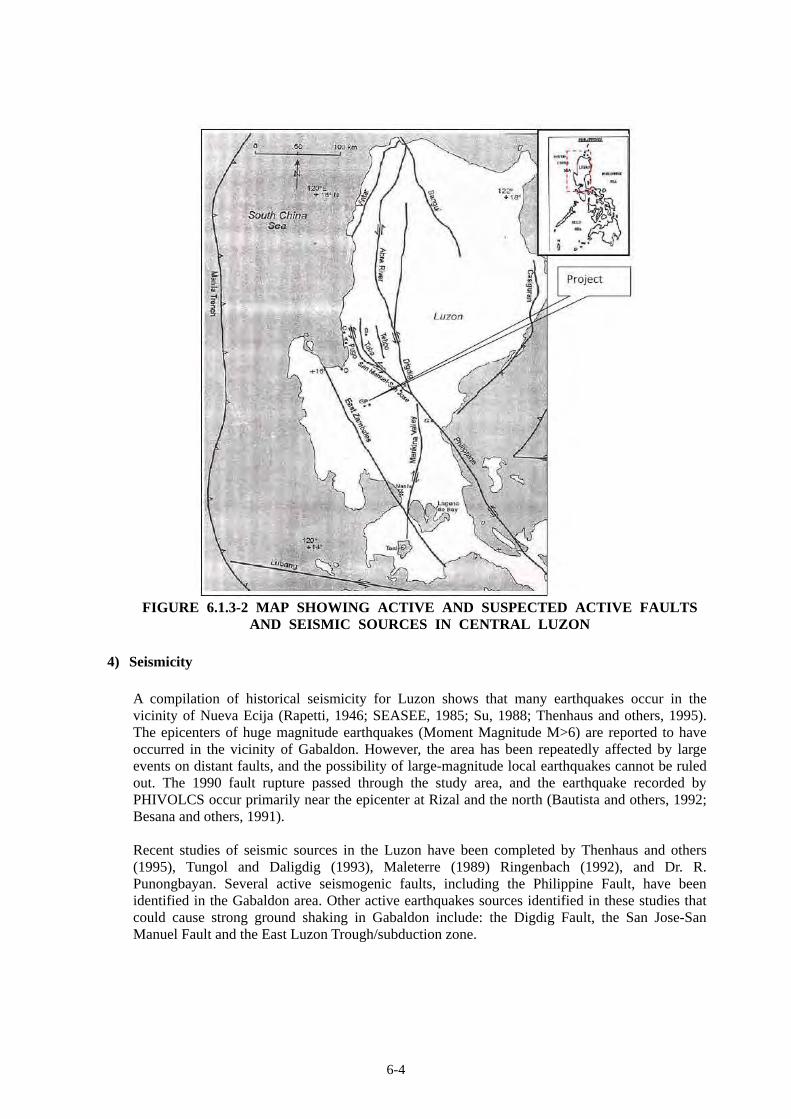
FIGURE 6.1.3-2 MAP SHOWING ACTIVE AND SUSPECTED ACTIVE FAULTS
AND SEISMIC SOURCES IN CENTRAL LUZON
4) Seismicity A compilation of historical seismicity for Luzon shows that many earthquakes occur in the vicinity of Nueva Ecija (Rapetti, 1946; SEASEE, 1985; Su, 1988; Thenhaus and others, 1995). The epicenters of huge magnitude earthquakes (Moment Magnitude M>6) are reported to have occurred in the vicinity of Gabaldon. However, the area has been repeatedly affected by large events on distant faults, and the possibility of large-magnitude local earthquakes cannot be ruled out. The 1990 fault rupture passed through the study area, and the earthquake recorded by PHIVOLCS occur primarily near the epicenter at Rizal and the north (Bautista and others, 1992; Besana and others, 1991). Recent studies of seismic sources in the Luzon have been completed by Thenhaus and others (1995), Tungol and Daligdig (1993), Maleterre (1989) Ringenbach (1992), and Dr. R. Punongbayan. Several active seismogenic faults, including the Philippine Fault, have been identified in the Gabaldon area. Other active earthquakes sources identified in these studies that could cause strong ground shaking in Gabaldon include: the Digdig Fault, the San Jose-San Manuel Fault and the East Luzon Trough/subduction zone.
6-5
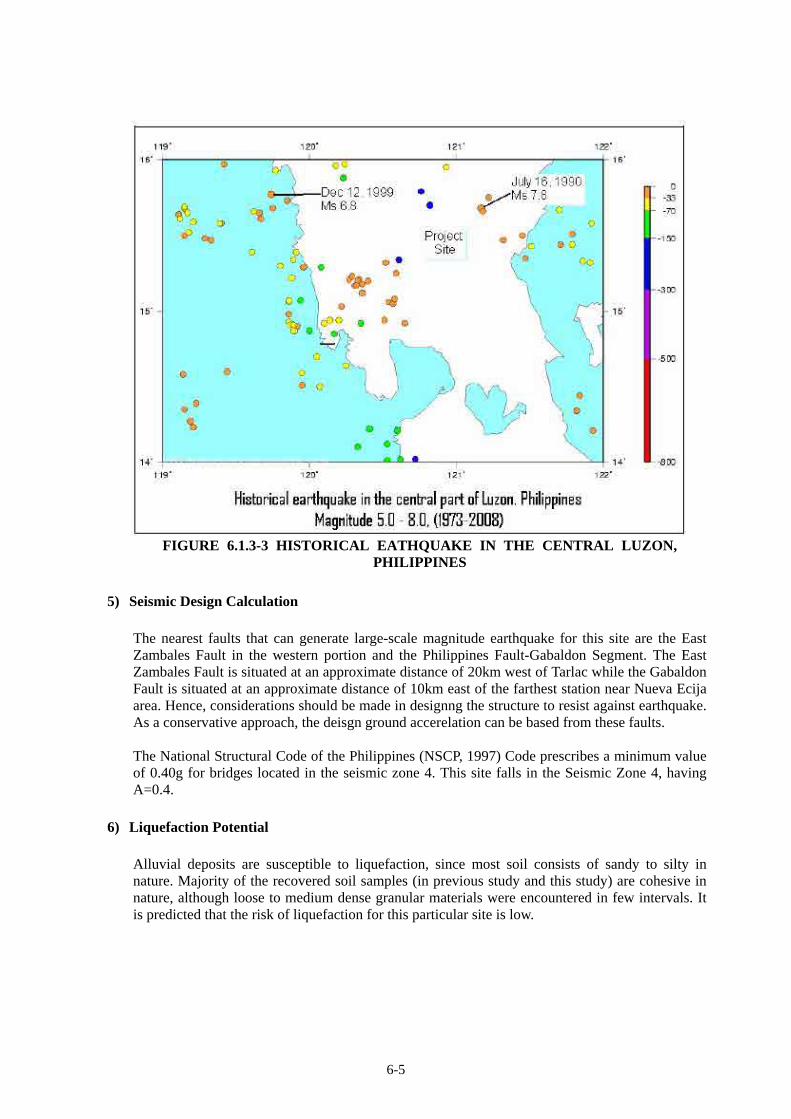
FIGURE 6.1.3-3 HISTORICAL EATHQUAKE IN THE CENTRAL LUZON,
PHILIPPINES
5) Seismic Design Calculation The nearest faults that can generate large-scale magnitude earthquake for this site are the East Zambales Fault in the western portion and the Philippines Fault-Gabaldon Segment. The East Zambales Fault is situated at an approximate distance of 20km west of Tarlac while the Gabaldon Fault is situated at an approximate distance of 10km east of the farthest station near Nueva Ecija area. Hence, considerations should be made in designng the structure to resist against earthquake. As a conservative approach, the deisgn ground accerelation can be based from these faults. The National Structural Code of the Philippines (NSCP, 1997) Code prescribes a minimum value of 0.40g for bridges located in the seismic zone 4. This site falls in the Seismic Zone 4, having A=0.4.
6) Liquefaction Potential Alluvial deposits are susceptible to liquefaction, since most soil consists of sandy to silty in nature. Majority of the recovered soil samples (in previous study and this study) are cohesive in nature, although loose to medium dense granular materials were encountered in few intervals. It is predicted that the risk of liquefaction for this particular site is low.

6-6
(2) Geotechnical Investigation and Analysis
1) List of the geotechnical test conducted Table 6.1.3-1 shows number of geotechnical survey conducted. Figure 6.1.3-4 shows location of geotechnical survey.
TABLE 6.1.3-1 LIST OF GEOTECHNICAL TEST No. Test Number
1 Drilling of boreholes 9 2 Test Pit 7 3 Augrer Hole 5 4 Cone Penetration Test (CPT) 58 5 Dynamic Cone Penetration Test (DCPT) 58 6 Material Sources 2

6-7
FIGURE 6.1.3-4 GEOTECHNICAL TEST LOCATION MAP
6-8
(3) Summary of Result and Findings
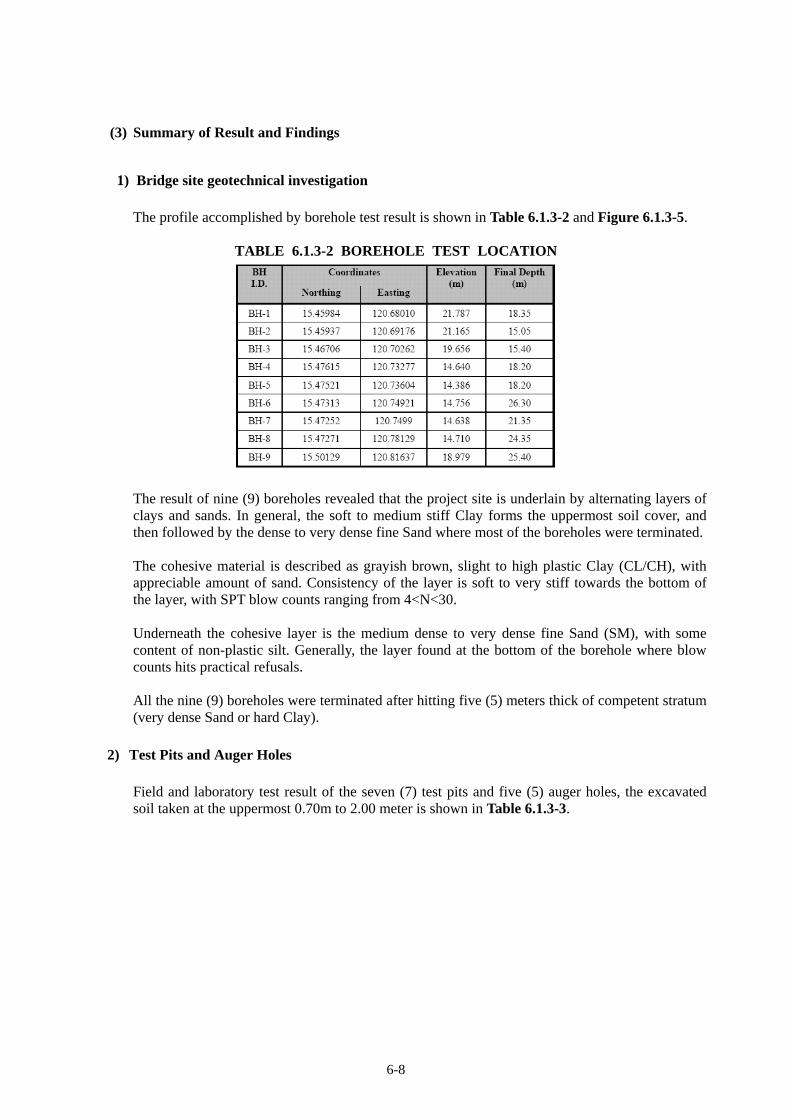
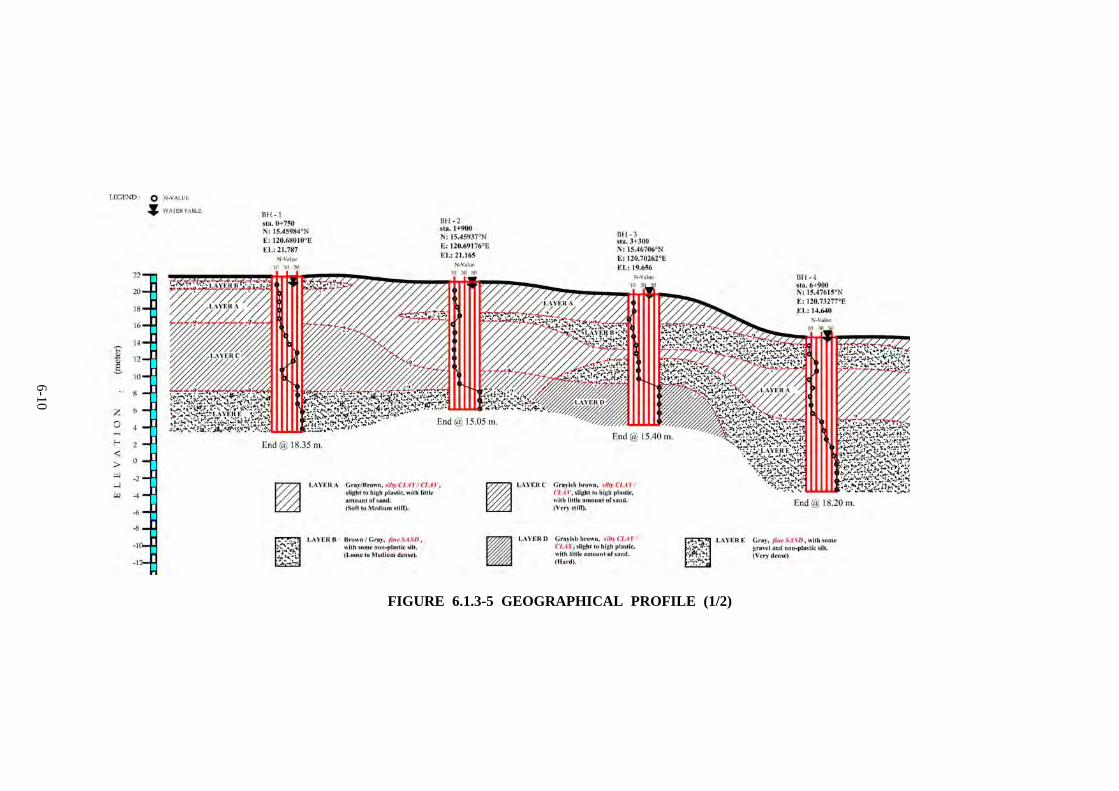
1) Bridge site geotechnical investigation The profile accomplished by borehole test result is shown in Table 6.1.3-2 and Figure 6.1.3-5.
TABLE 6.1.3-2 BOREHOLE TEST LOCATION
The result of nine (9) boreholes revealed that the project site is underlain by alternating layers of clays and sands. In general, the soft to medium stiff Clay forms the uppermost soil cover, and then followed by the dense to very dense fine Sand where most of the boreholes were terminated. The cohesive material is described as grayish brown, slight to high plastic Clay (CL/CH), with appreciable amount of sand. Consistency of the layer is soft to very stiff towards the bottom of the layer, with SPT blow counts ranging from 4<N<30. Underneath the cohesive layer is the medium dense to very dense fine Sand (SM), with some content of non-plastic silt. Generally, the layer found at the bottom of the borehole where blow counts hits practical refusals. All the nine (9) boreholes were terminated after hitting five (5) meters thick of competent stratum (very dense Sand or hard Clay).
2) Test Pits and Auger Holes Field and laboratory test result of the seven (7) test pits and five (5) auger holes, the excavated soil taken at the uppermost 0.70m to 2.00 meter is shown in Table 6.1.3-3.

6-9
TABLE 6.1.3-3 TEST RESULT OF TEST PITS AND AUGER HOLES
* Modified compaction: ASTM D1557/AASHTO T180, California Bearing Ratio: ASTM D1883/AASHTO T193
It is to note that uppermost 0.10 to 0.20 meters thick of soil cover is unsuitable materials, described as odorous, very soft organic Clay, with decayed roots and grasses.
3) Cone Penetration Test (CPT)
With respect to the Cone Penetometer Tests (CPT), the uppermost 0.20 to 0.40 meters were generally having zero reading (indicating very little resistance), and would suggest the thickness of the unsuitable materials. The seven (7) test pits locations with CPT would confirm very well that the unsuitable materials (zero CPT readings) correspond to the odorous, spongy, and slight to highly plastic, very soft organic Clay, with decayed roots and grasses described in the boring logs. Thereafter, the CPT reading would progressively increase with increasing depth going thru the subsequent soil layers. Final depth of CPT ranged from 1.0m to 2.5m.
4) Dynamic Cone Penetrometer Tests (DCPT)
Generally, the uppermost 0.2-0.9 meters depth has a very low in-situ CBR values, about 1.2%, with marked increase in the calculated in-situ CBR with increasing depth.
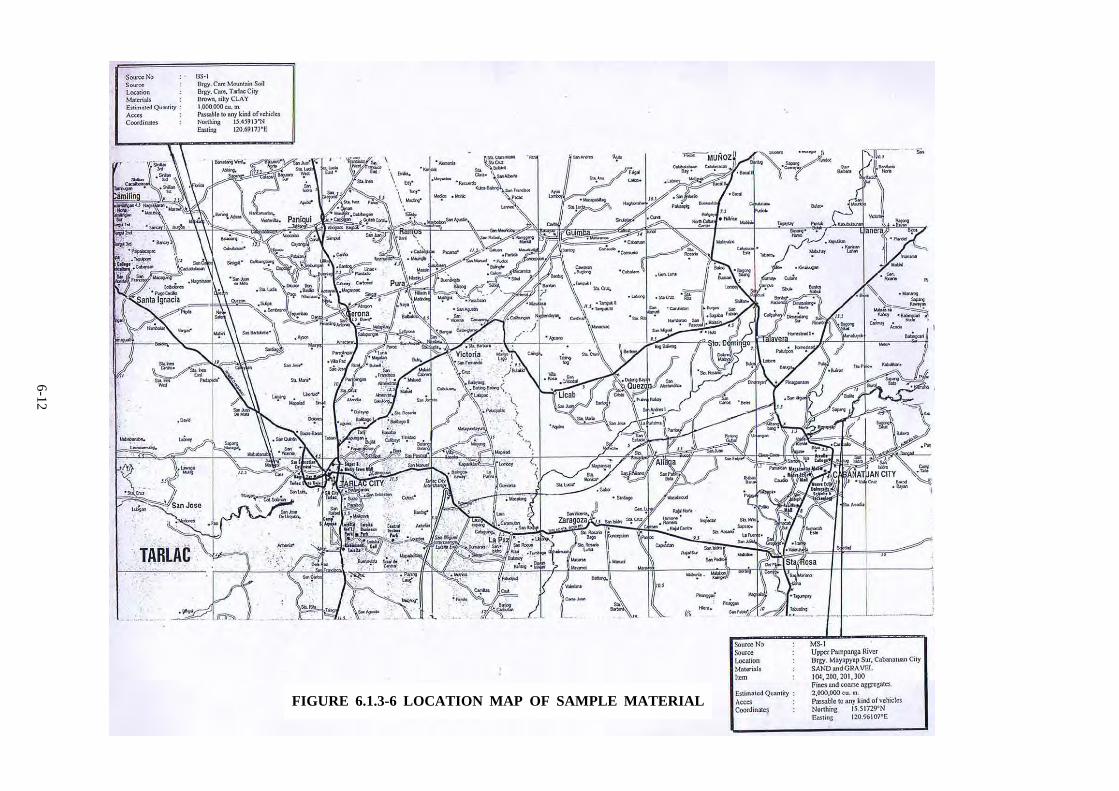
5) Material Source Investigation
The following two (2) potential souses are identified and surveyed; Location of the material source is shown in Figure 6.1.3-6. a. MS-1, Upper Pampanga River
Location: Brgy. Mayapyap Sur, Cabanatuan City Type of materials: Sand and Gravel Approx. Quantity: 2,000,000 cu.m
b. BS-1, BRGY. Care Mountain Soil Location: Brgy. Care, Tarlac City Type of Materials Silty Clay Approx. Quantity: 1,000,000 cu.m
Laboratory test result is shown in Table 6.1.3-4.
6-10
FIGURE 6.1.3-5 GEOGRAPHICAL PROFILE (1/2)

6-11
FIGURE 6.1.3-5 GEOGRAPHICAL PROFILE (2/2)
6-12
CLLEX
FIGURE 6.1.3-6 LOCATION MAP OF SAMPLE MATERIAL

6-13
TABLE 6.1.3-4 LABORATORY TEST RESULT OF MATERIAL SOURCE INVESTIGATION
6-14
6.2 DESIGN STANDARD
6.2.1 Design Concept
The design concept is to provide a high speed toll road that allows safe and efficient movement of traffic as an expressway with fully controlled access, especially to improve the access from Tarlac (connection to Subic Clark Trlac Expressway) to Cabanatuan (Pan Philippines Highway) in the total length of 30.73km. The scope of work of the study is to review the past study and to consider stage construction in accordance with traffic demand forecast.
6.2.2 Design Standard The following standard is mainly used as reference in Central Luzon Link Expressway (Phase I) design.
A Policy on Geometric Design of Highways and Streets, AASHTO 2004
Highway Safety Design Standards Part 1 Road Safety Design Manual, May 2004,
DPWH
Japan Road Association, Road Structure Ordinance,2004
Highway design manual, Metropolitan Expressway Co., Ltd., Japan
Highway design manual, NEXCO, Japan
6.2.3 Design Speed
(1) Main Alignment Recommended design speed by the previous feasibility study was 100kmh. In accordance with Road Safety Design Manual (DPWH,2004) as well as considering to the moderate topographic condition and safety of the traffic of staging construction, the design speed is recommended 100kph for the express highway.
(2) Interchange Ramps The interchange ramp design speed was employed as 40kph which is 40% of the highway design speed and described minimum design speed in AASHTO 2004.
6.2.4 Design Vehicle
A WB-15 is considered as design vehicle of the main alignment and ramp.
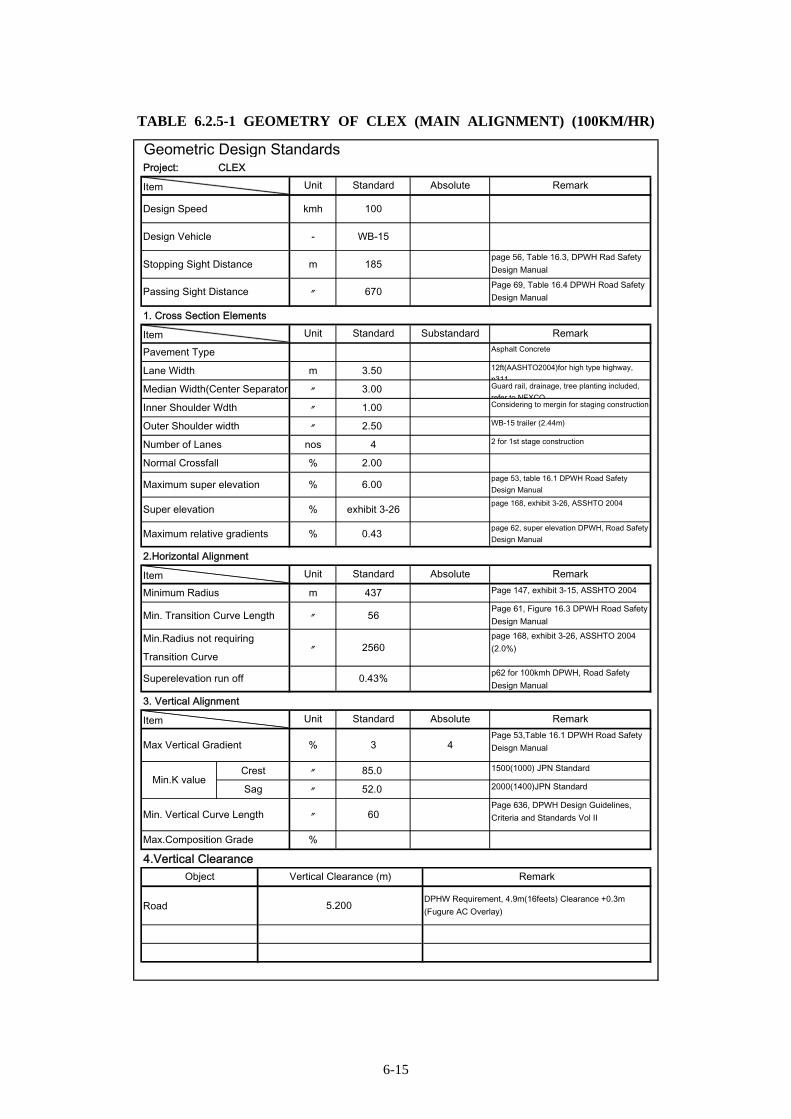
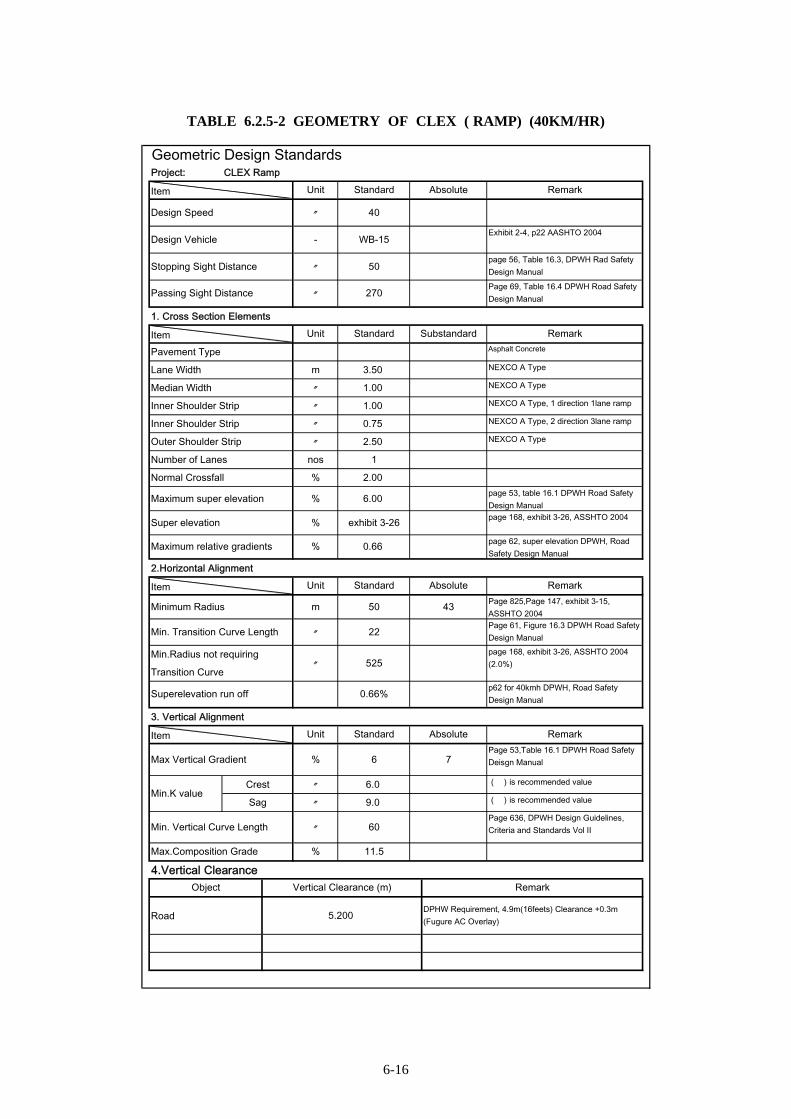
6.2.5 Summary of Express Highway Geometry
Geometry applied to the design of main alignment and ramp is summarized in Table
6.2.5-1 and Table 6.2.5-2.
6-15
TABLE 6.2.5-1 GEOMETRY OF CLEX (MAIN ALIGNMENT) (100KM/HR)
Geometric Design StandardsProject: CLEX
1. Cross Section Elements
2.Horizontal Alignment
3. Vertical Alignment
4.Vertical Clearance
Road
Design Vehicle - WB-15
Page 147, exhibit 3-15, ASSHTO 2004
Item Unit Standard
100
Maximum relative gradients % 0.43
Maximum super elevation %
Super elevation
Remark
Design Speed kmh
Item Unit Standard Absolute
page 62, super elevation DPWH, Road SafetyDesign Manual
page 168, exhibit 3-26, ASSHTO 2004
Considering to mergin for staging construction
Remark
DPHW Requirement, 4.9m(16feets) Clearance +0.3m(Fugure AC Overlay)
Remark
1500(1000) JPN Standard
Page 636, DPWH Design Guidelines,Criteria and Standards Vol II
2000(1400)JPN Standard
% exhibit 3-26
6.00
WB-15 trailer (2.44m)
2 for 1st stage construction
page 53, table 16.1 DPWH Road SafetyDesign Manual
Normal Crossfall % 2.00
Outer Shoulder width 〃 2.50
Unit Standard Substandard
1.00Inner Shoulder Wdth 〃
12ft(AASHTO2004)for high type highway,p311
Median Width(Center Separator) 〃 3.00 Guard rail, drainage, tree planting included,refer to NEXCO
Item
Number of Lanes nos 4
m 3.50
Pavement Type
Lane Width
Page 69, Table 16.4 DPWH Road SafetyDesign Manual
Asphalt Concrete
Passing Sight Distance 〃 670
Min.K value〃
〃
2560
%
Item Unit
page 168, exhibit 3-26, ASSHTO 2004(2.0%)
56
85.0
Remark
Page 61, Figure 16.3 DPWH Road SafetyDesign Manual
185page 56, Table 16.3, DPWH Rad SafetyDesign Manual
437
Absolute
〃
0.43% p62 for 100kmh DPWH, Road SafetyDesign Manual
3 4Page 53,Table 16.1 DPWH Road SafetyDeisgn Manual
Remark
Standard Absolute
〃
m
〃
52.0
60
Crest
Sag
Min. Vertical Curve Length
Stopping Sight Distance
Max.Composition Grade
m
%
Max Vertical Gradient
Minimum Radius
Min. Transition Curve Length
5.200
Min.Radius not requiring
Transition Curve
Superelevation run off
Object Vertical Clearance (m)
6-16
TABLE 6.2.5-2 GEOMETRY OF CLEX ( RAMP) (40KM/HR)
Geometric Design StandardsProject: CLEX Ramp
1. Cross Section Elements
2.Horizontal Alignment
3. Vertical Alignment
4.Vertical Clearance
Road
NEXCO A Type, 2 direction 3lane rampInner Shoulder Strip 〃 0.75
5.200
Object Vertical Clearance (m)
Min. Vertical Curve Length
11.5
Stopping Sight Distance
Max.Composition Grade
〃
%
Max Vertical Gradient
Min.K valueCrest
Sag
〃
22
525
Item Unit Standard Absolute
m
〃
p62 for 40kmh DPWH, Road SafetyDesign Manual
page 168, exhibit 3-26, ASSHTO 2004(2.0%)
Page 636, DPWH Design Guidelines,Criteria and Standards Vol II
Design Vehicle - WB-15Exhibit 2-4, p22 AASHTO 2004
6 7
( )is recommended value
Page 61, Figure 16.3 DPWH Road SafetyDesign Manual
Page 69, Table 16.4 DPWH Road SafetyDesign Manual
Asphalt Concrete
Remark
NEXCO A Type
NEXCO A Type
page 56, Table 16.3, DPWH Rad SafetyDesign Manual
Page 53,Table 16.1 DPWH Road SafetyDeisgn Manual
1
1.00
Standard
50
60
270
〃 9.0
%
〃
〃
Minimum Radius
Min. Transition Curve Length
Min.Radius not requiring
Transition Curve
Superelevation run off
Passing Sight Distance 〃
Pavement Type
Median Width 〃
Lane Width
Unit
〃 1.00
Item
Inner Shoulder Strip
m 3.50
Maximum super elevation %
Normal Crossfall %
Number of Lanes nos
NEXCO A Type, 1 direction 1lane ramp
Outer Shoulder Strip 〃 2.50 NEXCO A Type
page 168, exhibit 3-26, ASSHTO 2004
page 53, table 16.1 DPWH Road SafetyDesign Manual
Super elevation % exhibit 3-26
Maximum relative gradients % 0.66
( )is recommended value
6.00
Remark
6.0
0.66%
Page 825,Page 147, exhibit 3-15,ASSHTO 2004
page 62, super elevation DPWH, RoadSafety Design Manual
Standard Absolute
50 43
Substandard
2.00
Design Speed 〃 40
Remark
DPHW Requirement, 4.9m(16feets) Clearance +0.3m(Fugure AC Overlay)
Remark
Remark
Item Unit Standard Absolute
Item Unit

6-17
6.2.6 Vertical Clearance The vertical clearance of the highway and crossing road shall be 4.0m to 5.2m (4.9m (16 feet) + 0.3m (overlay)).
6.2.7 Number of Lanes
Number of lane is set as below in accordance with traffic demand forecast;
1) Ultimate Stage: 4 lanes
2) Interim Stage: 2 lanes
6.2.8 Carriageway, Shoulder and Median Width
The cross sectional configuration is reviewed and recommended as below;
(1) Main alignment The carriage way of the main alignment is 3.5m in accordance with Road Safety Manual (DPWH 2004). Likewise the inner shoulder is designed as 1.0m. This allows the construction of the 2nd stage cross without conflict from the section for the 1st stage construction. The outer shoulder is designed as 2.5m. This permit semi trailer class (w=2.44m) emergent stops. The width of median is designed as 3.0m with guard rail post and plantation of low height trees.
24,000
2,500
3,5003,500
1,000
3,000
1,000
3,5003,500
2,500
FIGURE 6.2.8-1 CROSS SECTIONAL CONFIGURATION (4 LANES)
(2) Ramp The carriage way of the ramp is recommended same width as main alignment, namely 3.5m. Widening of 1.0m is added to this carriage way. The inner shoulder is designed as 1.0m and outer shoulder 2.5m with provision for passing a stalled vehicle of predominantly P vehicles but consideration for WB-15 trailers.

6-18
8,000
2,5004,5001,000
Ramp 1 laneS=1: 200
FIGURE 6.2.8-2 CROSS SECTIONAL CONFIGURATION (1 LANE RAMP)
17,500
2,500
4,500
1,000
1,500
1,000
4,500
2,500
2 Direction 2 LanesS=1: 200
FIGURE 6.2.8-3 CROSS SECTIONAL CONFIGURATION (2 DIRECTION 2 LANE RAMP)
22,500
2,500
3,5003,500
1,000
1,500
1,000
3,5003,500
2,500
2 direction 4 laneS=1: 200
FIGURE 6.2.8-4 CROSS SECTIONAL CONFIGURATION (2 DIRECTION 4 LANE)
6-19
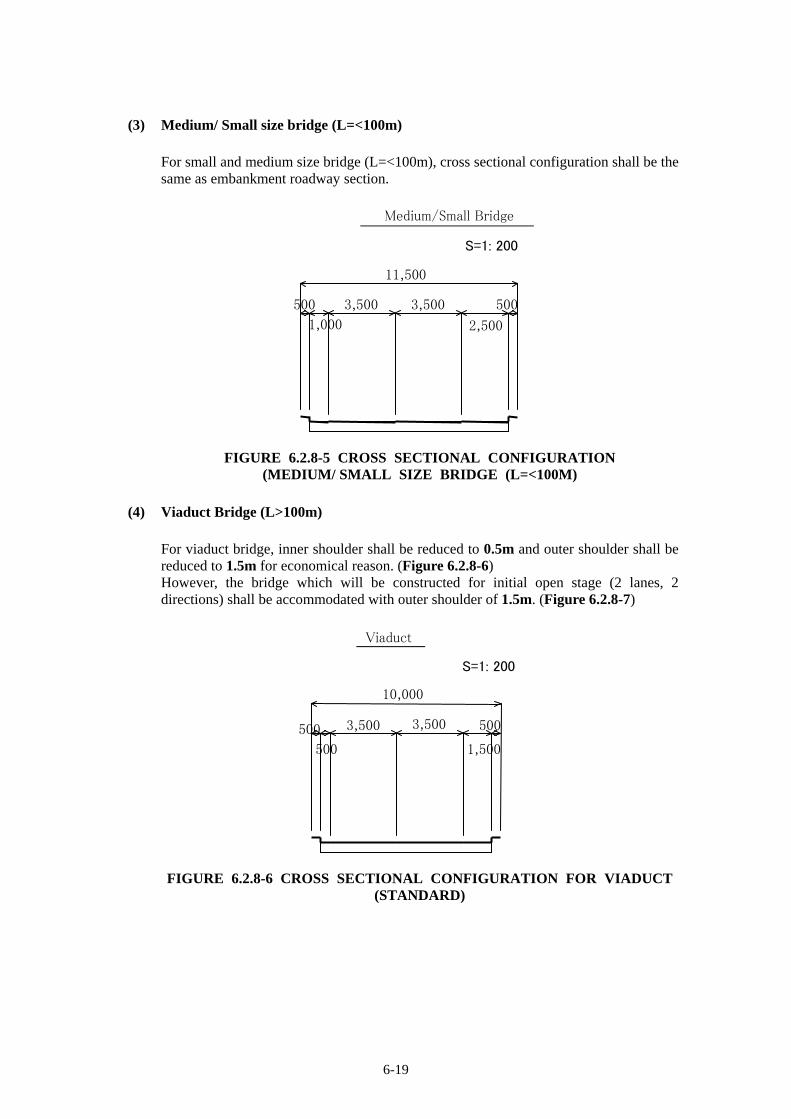
(3) Medium/ Small size bridge (L=<100m) For small and medium size bridge (L=<100m), cross sectional configuration shall be the same as embankment roadway section.
FIGURE 6.2.8-5 CROSS SECTIONAL CONFIGURATION (MEDIUM/ SMALL SIZE BRIDGE (L=<100M)
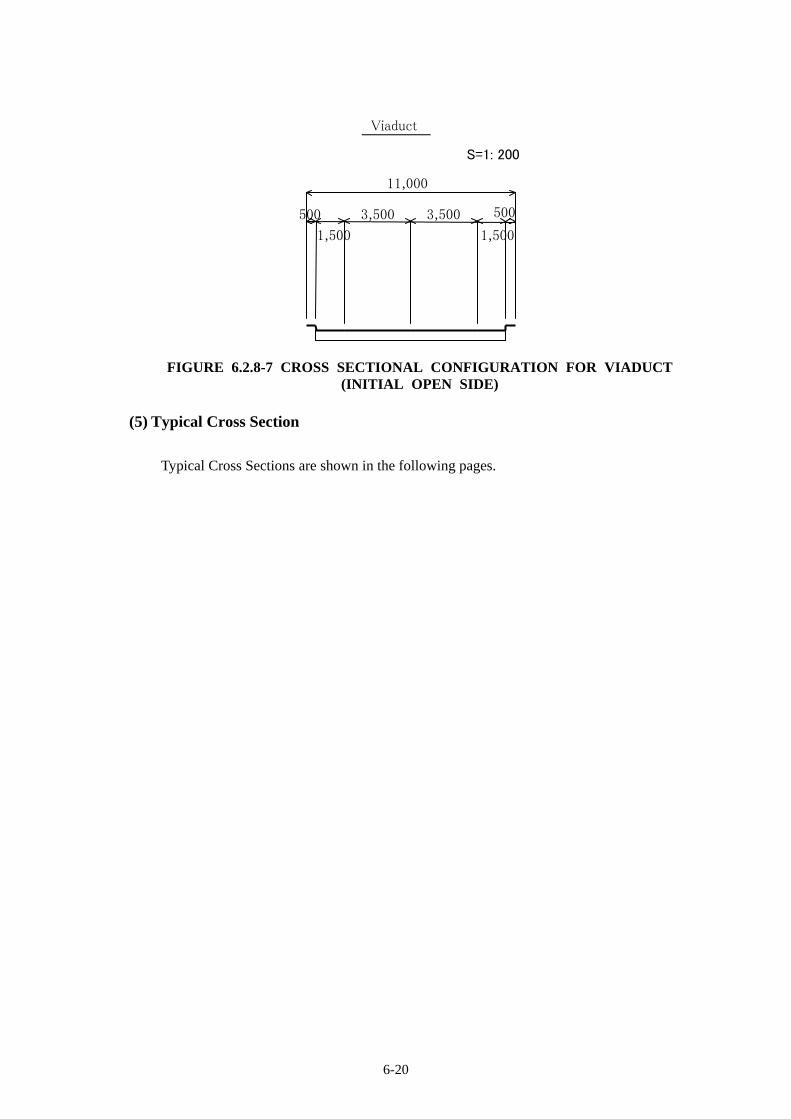
(4) Viaduct Bridge (L>100m) For viaduct bridge, inner shoulder shall be reduced to 0.5m and outer shoulder shall be reduced to 1.5m for economical reason. (Figure 6.2.8-6) However, the bridge which will be constructed for initial open stage (2 lanes, 2 directions) shall be accommodated with outer shoulder of 1.5m. (Figure 6.2.8-7)
FIGURE 6.2.8-6 CROSS SECTIONAL CONFIGURATION FOR VIADUCT (STANDARD)
11,500
500
2,500
3,5003,500
1,000
500
S=1: 200
10,000
500
1,500
3,5003,500
500
500
Viaduct
S=1: 200
Medium/Small Bridge
6-20
FIGURE 6.2.8-7 CROSS SECTIONAL CONFIGURATION FOR VIADUCT (INITIAL OPEN SIDE)
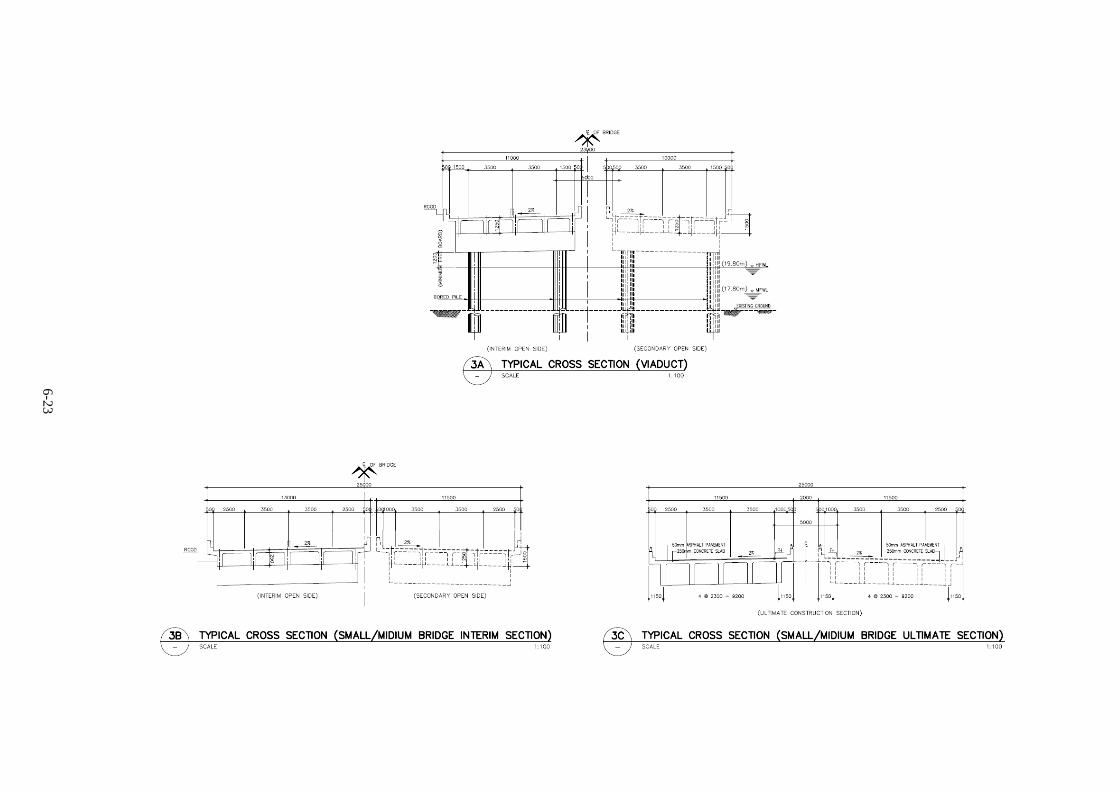
(5) Typical Cross Section
Typical Cross Sections are shown in the following pages.
11,000
500
1,500
3,5003,500
1,500
500
Viaduct
S=1: 200

6-21

6-22
6-23
6-24

6-25
6-26
6.2.9 Stopping Distance
According to Road Safety Design Manual (2004, DPWH); Stopping distance for design speed of 100kph is 185m. Stopping distance for design speed of 40kph is 50m.
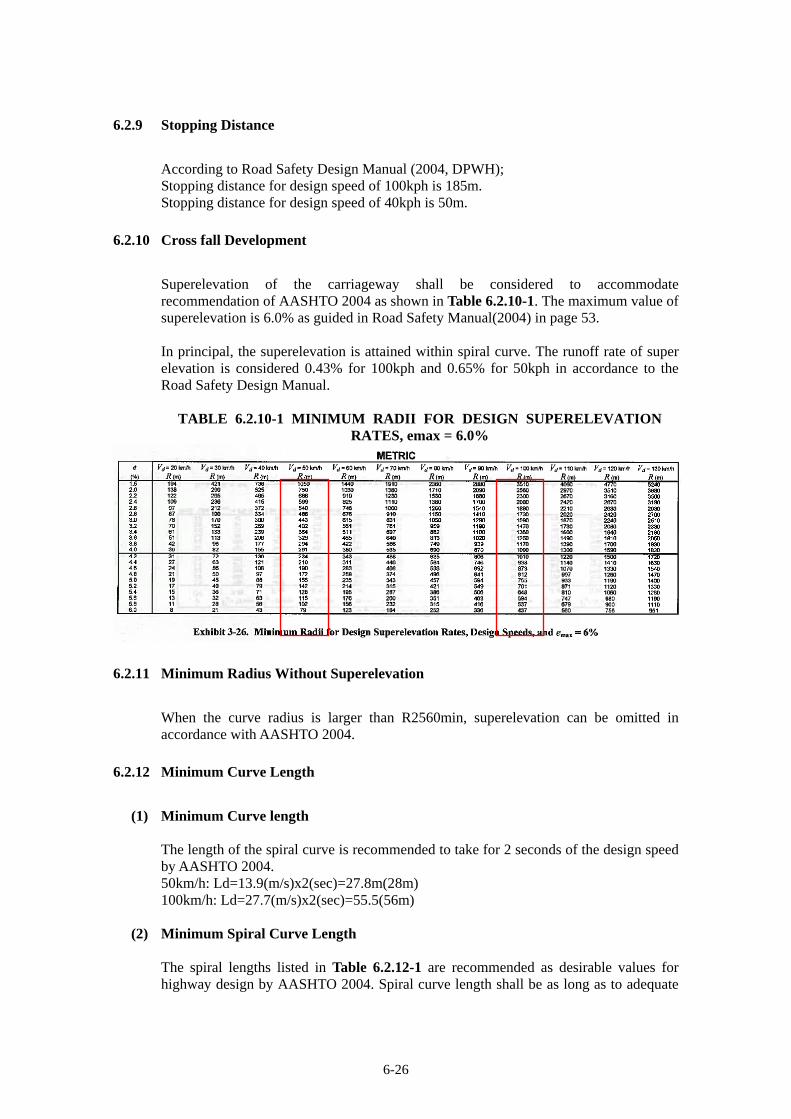
6.2.10 Cross fall Development
Superelevation of the carriageway shall be considered to accommodate recommendation of AASHTO 2004 as shown in Table 6.2.10-1. The maximum value of superelevation is 6.0% as guided in Road Safety Manual(2004) in page 53. In principal, the superelevation is attained within spiral curve. The runoff rate of super elevation is considered 0.43% for 100kph and 0.65% for 50kph in accordance to the Road Safety Design Manual.
TABLE 6.2.10-1 MINIMUM RADII FOR DESIGN SUPERELEVATION
RATES, emax = 6.0%
6.2.11 Minimum Radius Without Superelevation
When the curve radius is larger than R2560min, superelevation can be omitted in accordance with AASHTO 2004.
6.2.12 Minimum Curve Length
(1) Minimum Curve length The length of the spiral curve is recommended to take for 2 seconds of the design speed by AASHTO 2004. 50km/h: Ld=13.9(m/s)x2(sec)=27.8m(28m) 100km/h: Ld=27.7(m/s)x2(sec)=55.5(56m)
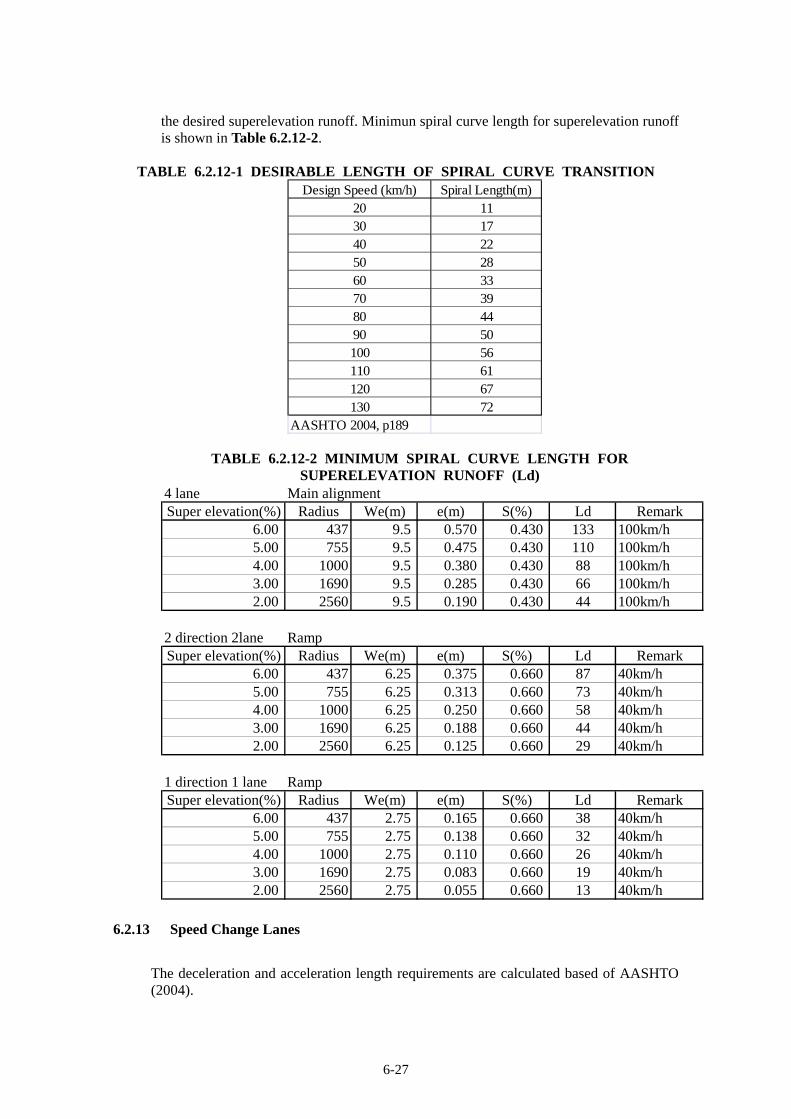
(2) Minimum Spiral Curve Length The spiral lengths listed in Table 6.2.12-1 are recommended as desirable values for highway design by AASHTO 2004. Spiral curve length shall be as long as to adequate
6-27
the desired superelevation runoff. Minimun spiral curve length for superelevation runoff is shown in Table 6.2.12-2.
TABLE 6.2.12-1 DESIRABLE LENGTH OF SPIRAL CURVE TRANSITION Design Speed (km/h) Spiral Length(m)
20 1130 1740 2250 2860 3370 3980 4490 50100 56110 61120 67130 72
AASHTO 2004, p189
TABLE 6.2.12-2 MINIMUM SPIRAL CURVE LENGTH FOR SUPERELEVATION RUNOFF (Ld)
4 lane Main alignmentSuper elevation(%) Radius We(m) e(m) S(%) Ld Remark
6.00 437 9.5 0.570 0.430 133 100km/h5.00 755 9.5 0.475 0.430 110 100km/h4.00 1000 9.5 0.380 0.430 88 100km/h3.00 1690 9.5 0.285 0.430 66 100km/h2.00 2560 9.5 0.190 0.430 44 100km/h
2 direction 2lane RampSuper elevation(%) Radius We(m) e(m) S(%) Ld Remark
6.00 437 6.25 0.375 0.660 87 40km/h5.00 755 6.25 0.313 0.660 73 40km/h4.00 1000 6.25 0.250 0.660 58 40km/h3.00 1690 6.25 0.188 0.660 44 40km/h2.00 2560 6.25 0.125 0.660 29 40km/h
1 direction 1 lane RampSuper elevation(%) Radius We(m) e(m) S(%) Ld Remark
6.00 437 2.75 0.165 0.660 38 40km/h5.00 755 2.75 0.138 0.660 32 40km/h4.00 1000 2.75 0.110 0.660 26 40km/h3.00 1690 2.75 0.083 0.660 19 40km/h2.00 2560 2.75 0.055 0.660 13 40km/h
6.2.13 Speed Change Lanes
The deceleration and acceleration length requirements are calculated based of AASHTO (2004).
6-28
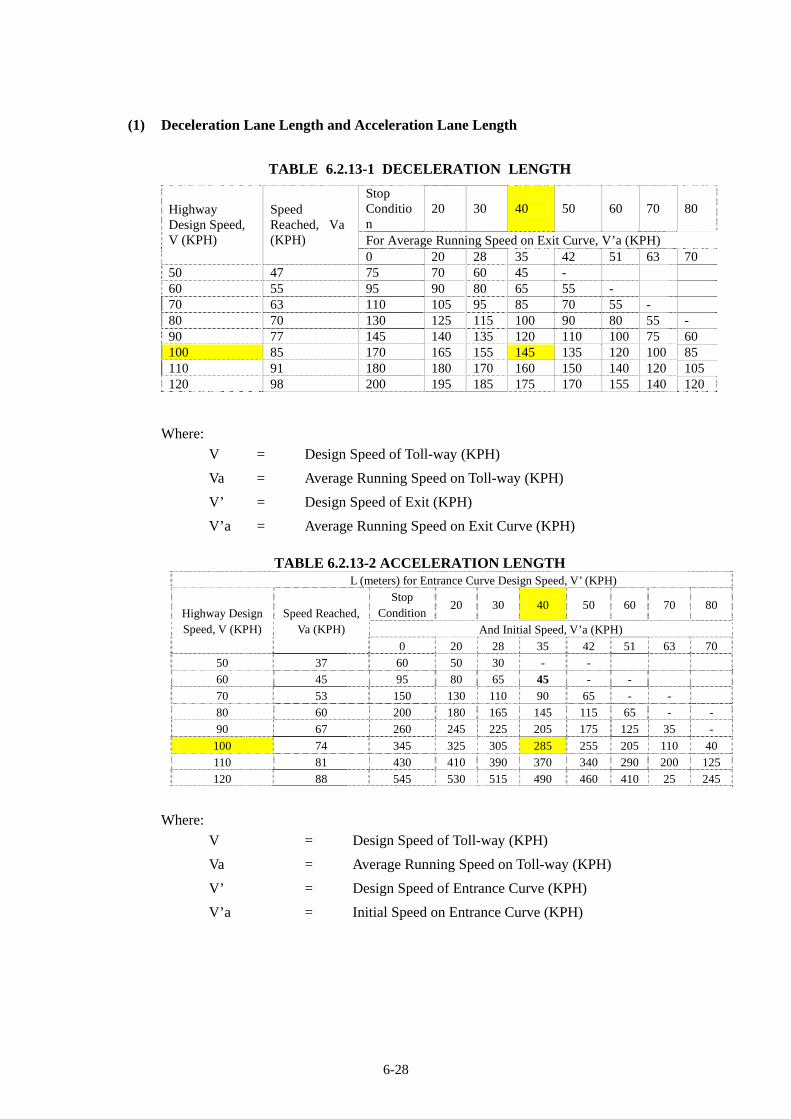
(1) Deceleration Lane Length and Acceleration Lane Length
TABLE 6.2.13-1 DECELERATION LENGTH
Stop Condition
20 30 40 50 60 70 80
For Average Running Speed on Exit Curve, V’a (KPH)
Highway Design Speed, V (KPH)
Speed Reached, Va (KPH)
0 20 28 35 42 51 63 70 50 47 75 70 60 45 - 60 55 95 90 80 65 55 - 70 63 110 105 95 85 70 55 - 80 70 130 125 115 100 90 80 55 - 90 77 145 140 135 120 110 100 75 60 100 85 170 165 155 145 135 120 100 85 110 91 180 180 170 160 150 140 120 105 120 98 200 195 185 175 170 155 140 120
Where:
V = Design Speed of Toll-way (KPH)
Va = Average Running Speed on Toll-way (KPH)
V’ = Design Speed of Exit (KPH)
V’a = Average Running Speed on Exit Curve (KPH)
TABLE 6.2.13-2 ACCELERATION LENGTH
L (meters) for Entrance Curve Design Speed, V’ (KPH) Stop
Condition20 30 40 50 60 70 80
And Initial Speed, V’a (KPH) Highway Design Speed, V (KPH)
Speed Reached, Va (KPH)
0 20 28 35 42 51 63 70
50 37 60 50 30 - - 60 45 95 80 65 45 - -
70 53 150 130 110 90 65 - - 80 60 200 180 165 145 115 65 - -
90 67 260 245 225 205 175 125 35 -
100 74 345 325 305 285 255 205 110 40 110 81 430 410 390 370 340 290 200 125
120 88 545 530 515 490 460 410 25 245
Where:
V = Design Speed of Toll-way (KPH)
Va = Average Running Speed on Toll-way (KPH)
V’ = Design Speed of Entrance Curve (KPH)
V’a = Initial Speed on Entrance Curve (KPH)

6-29
TABLE 6.2.13-3 SPEED CHANGE LANE ADJUSTMENT FACTORS AS A FUNCTION OF GRADE
Highway Design Speed, V (KPH)
Ratio of Length on Grade to Length on Level for Design Speed of Turning Curve (Km/h)
All Speeds 3 to 4% Upgrade
0 90
3 to 4% Downgrade
1 2
All Speeds 5 to 6% Upgrade
0.80
5 to 6 % Downgrade
1.35
TABLE 6.2.13-4 SPEED CHANGE LANE ADJUSTMENT FACTORS AS A FUNCTION OF GRADE
Highway Design Speed, V (KPH)
Ratio of Length on Grade to Length on Level for Design Speed of Turning Curve (Km/h)
40 50 60 70 80 All Speeds
3 to 4 % Upgrade 3 to 4 %
Downgrade
60 1.3 1.4 1.4 0.70 70 1.3 1.4 1.4 1.5 0.65 80 1.4 1.5 1.5 1.5 1.6 0.65 90 1.4 1.5 1.5 1.5 1.6 0.6
100 1.5 1.6 1.7 1.7 1.8 0.6 110 1.5 1.6 1.7 1.7 1.8 0.6 120 1.5 1.6 1.7 1.7 1.8 0.6
5 to 6 % Upgrade 5 to 6 %
Downgrade
60 1.5 1.5 0.6 70 1.5 1.6 1.7 0.6 80 1.5 1.7 1.9 1.8 0.55 90 1.6 1.8 2.0 2.1 2.2 0.55
100 1.7 1.9 2.2 2.4 2.5 0.5 110 2.0 2.2 2.6 2.8 3.0 0.5 120 2.3 2.5 3.0 3.2 3.5 0.5
(2) Diverging Taper
*Vertical Gradient less than 3.0%
Design Speed Lane width
3.5m
100km/h (27.78m/s) 97m
DivergeTaper
- 1.0m/s for acceleration lane merge

6-30
(3) Merging Taper
Design Speed Lane width
3.5m
100km/h (27.78m/s) 97m
6.2.14 Maximum Gradient
For the main alignment with design speed of 100kph, the maximum vertical gradient could be applied is 4% by referring to Road Safety Manual (2004 DPWH) while desirable max gradient is 3%.
For interchange On and Off Ramp with design speed of 50kph, the maximum gradient recommended to apply is 6.0% while absolute grade is 7.0%.
6.3 EXPRESSWAY DESIGN
6.3.1 General This section of the report highlights the engineering studies undertaken for the proposed project following the AASHTO and DPWH technical guidelines and procedures. This section contains following technical studies; (1) Hydrological analysis (2) Crossing Road and River Design (3) Vertical Control (4) Rio Chico River Flood Prone Area Design (5) Interchange Design (6) Interim 2 Lanes Design
6.3.2 Hydrological Analysis
(1) Technical Approach This study was carried out in the following steps; 1) Data collection 2) Hydrologic study 3) Hydraulic analysis 4) Drainage Design
(2) Data collection
Merging Taper
- 1.0m/s for acceleration lane merge
6-31
Topographic maps from the National Mapping and Resource Information Authority (NAMRIA) were acquired. For the rainfall data, the same data from the existing Feasibility Study was obtained from the Philippine Atmospheric, Geophysical Astronomical Services Administration (PAGASA) was used. 1) Topographic Maps
NAMIRA is the government agency responsible for the preparation of topographic maps of the Philippines. For the project location, 1:50,000 maps were available.
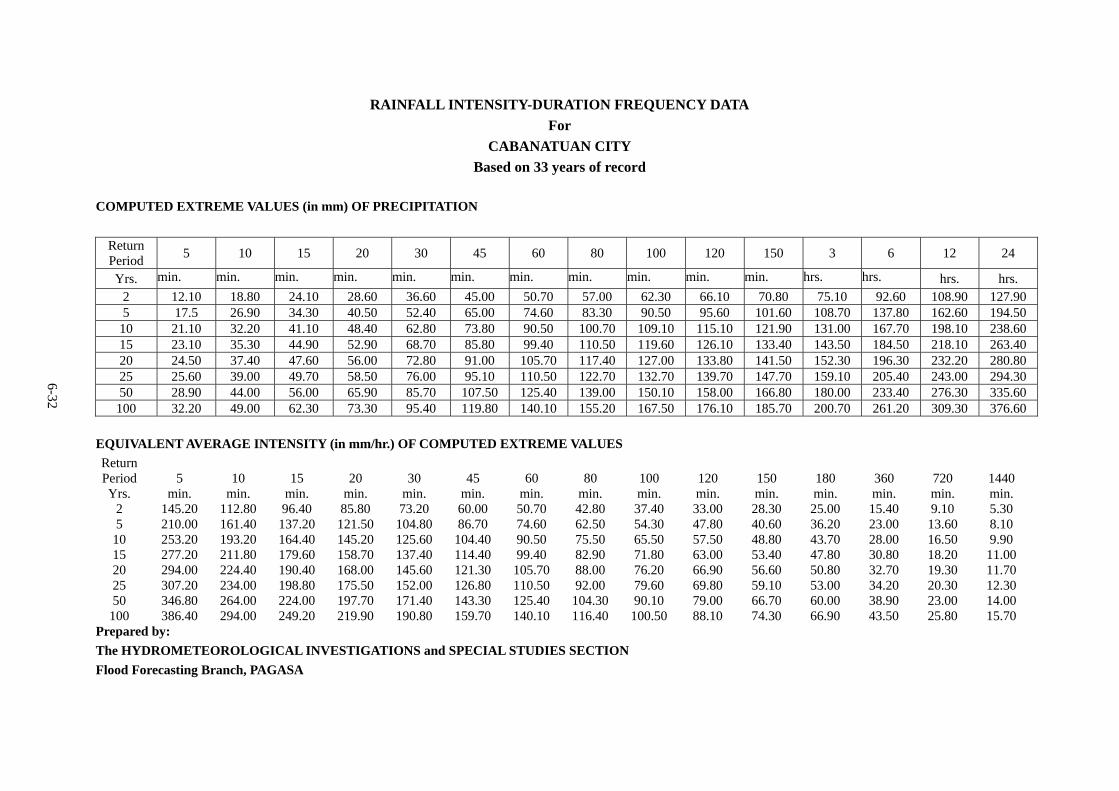
2) Rainfall Data For the purpose of this study, the same rainfall data used in the existing Feasibility Study is utilized. The available data are from the Cabanatuan City (based on 33 years of record), Munoz, Nueva Ecija (based on 21 years of record) and Pantabangan (based on 19 years of record.)
6-32
RAINFALL INTENSITY-DURATION FREQUENCY DATA
For
CABANATUAN CITY
Based on 33 years of record
COMPUTED EXTREME VALUES (in mm) OF PRECIPITATION
Return Period
5 10 15 20 30 45 60 80 100 120 150 3 6 12 24
Yrs. min. min. min. min. min. min. min. min. min. min. min. hrs. hrs. hrs. hrs. 2 12.10 18.80 24.10 28.60 36.60 45.00 50.70 57.00 62.30 66.10 70.80 75.10 92.60 108.90 127.90 5 17.5 26.90 34.30 40.50 52.40 65.00 74.60 83.30 90.50 95.60 101.60 108.70 137.80 162.60 194.50
10 21.10 32.20 41.10 48.40 62.80 73.80 90.50 100.70 109.10 115.10 121.90 131.00 167.70 198.10 238.60 15 23.10 35.30 44.90 52.90 68.70 85.80 99.40 110.50 119.60 126.10 133.40 143.50 184.50 218.10 263.40 20 24.50 37.40 47.60 56.00 72.80 91.00 105.70 117.40 127.00 133.80 141.50 152.30 196.30 232.20 280.80 25 25.60 39.00 49.70 58.50 76.00 95.10 110.50 122.70 132.70 139.70 147.70 159.10 205.40 243.00 294.30 50 28.90 44.00 56.00 65.90 85.70 107.50 125.40 139.00 150.10 158.00 166.80 180.00 233.40 276.30 335.60 100 32.20 49.00 62.30 73.30 95.40 119.80 140.10 155.20 167.50 176.10 185.70 200.70 261.20 309.30 376.60
EQUIVALENT AVERAGE INTENSITY (in mm/hr.) OF COMPUTED EXTREME VALUES
Return Period 5 10 15 20 30 45 60 80 100 120 150 180 360 720 1440 Yrs. min. min. min. min. min. min. min. min. min. min. min. min. min. min. min.
2 145.20 112.80 96.40 85.80 73.20 60.00 50.70 42.80 37.40 33.00 28.30 25.00 15.40 9.10 5.30 5 210.00 161.40 137.20 121.50 104.80 86.70 74.60 62.50 54.30 47.80 40.60 36.20 23.00 13.60 8.10
10 253.20 193.20 164.40 145.20 125.60 104.40 90.50 75.50 65.50 57.50 48.80 43.70 28.00 16.50 9.90 15 277.20 211.80 179.60 158.70 137.40 114.40 99.40 82.90 71.80 63.00 53.40 47.80 30.80 18.20 11.00 20 294.00 224.40 190.40 168.00 145.60 121.30 105.70 88.00 76.20 66.90 56.60 50.80 32.70 19.30 11.70 25 307.20 234.00 198.80 175.50 152.00 126.80 110.50 92.00 79.60 69.80 59.10 53.00 34.20 20.30 12.30 50 346.80 264.00 224.00 197.70 171.40 143.30 125.40 104.30 90.10 79.00 66.70 60.00 38.90 23.00 14.00
100 386.40 294.00 249.20 219.90 190.80 159.70 140.10 116.40 100.50 88.10 74.30 66.90 43.50 25.80 15.70 Prepared by:
The HYDROMETEOROLOGICAL INVESTIGATIONS and SPECIAL STUDIES SECTION
Flood Forecasting Branch, PAGASA
6-33
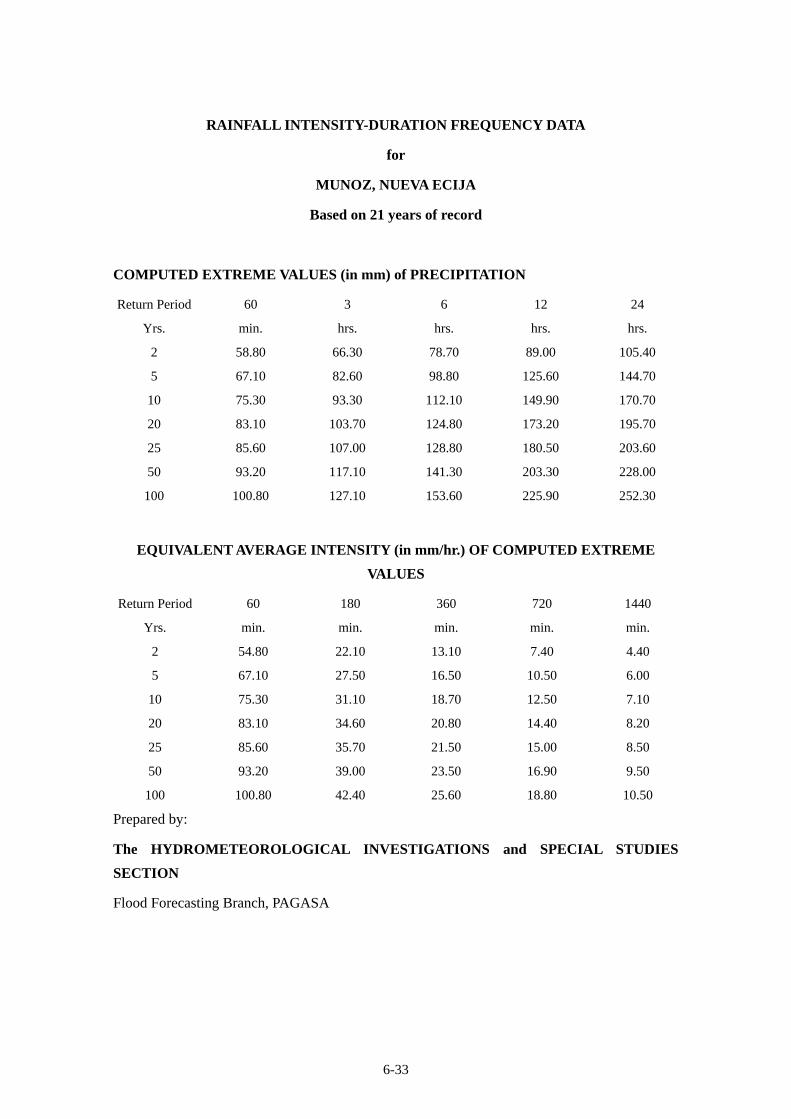
RAINFALL INTENSITY-DURATION FREQUENCY DATA
for
MUNOZ, NUEVA ECIJA
Based on 21 years of record
COMPUTED EXTREME VALUES (in mm) of PRECIPITATION
Return Period 60 3 6 12 24
Yrs. min. hrs. hrs. hrs. hrs.
2 58.80 66.30 78.70 89.00 105.40
5 67.10 82.60 98.80 125.60 144.70
10 75.30 93.30 112.10 149.90 170.70
20 83.10 103.70 124.80 173.20 195.70
25 85.60 107.00 128.80 180.50 203.60
50 93.20 117.10 141.30 203.30 228.00
100 100.80 127.10 153.60 225.90 252.30
EQUIVALENT AVERAGE INTENSITY (in mm/hr.) OF COMPUTED EXTREME
VALUES
Return Period 60 180 360 720 1440
Yrs. min. min. min. min. min.
2 54.80 22.10 13.10 7.40 4.40
5 67.10 27.50 16.50 10.50 6.00
10 75.30 31.10 18.70 12.50 7.10
20 83.10 34.60 20.80 14.40 8.20
25 85.60 35.70 21.50 15.00 8.50
50 93.20 39.00 23.50 16.90 9.50
100 100.80 42.40 25.60 18.80 10.50
Prepared by:
The HYDROMETEOROLOGICAL INVESTIGATIONS and SPECIAL STUDIES
SECTION
Flood Forecasting Branch, PAGASA
6-34
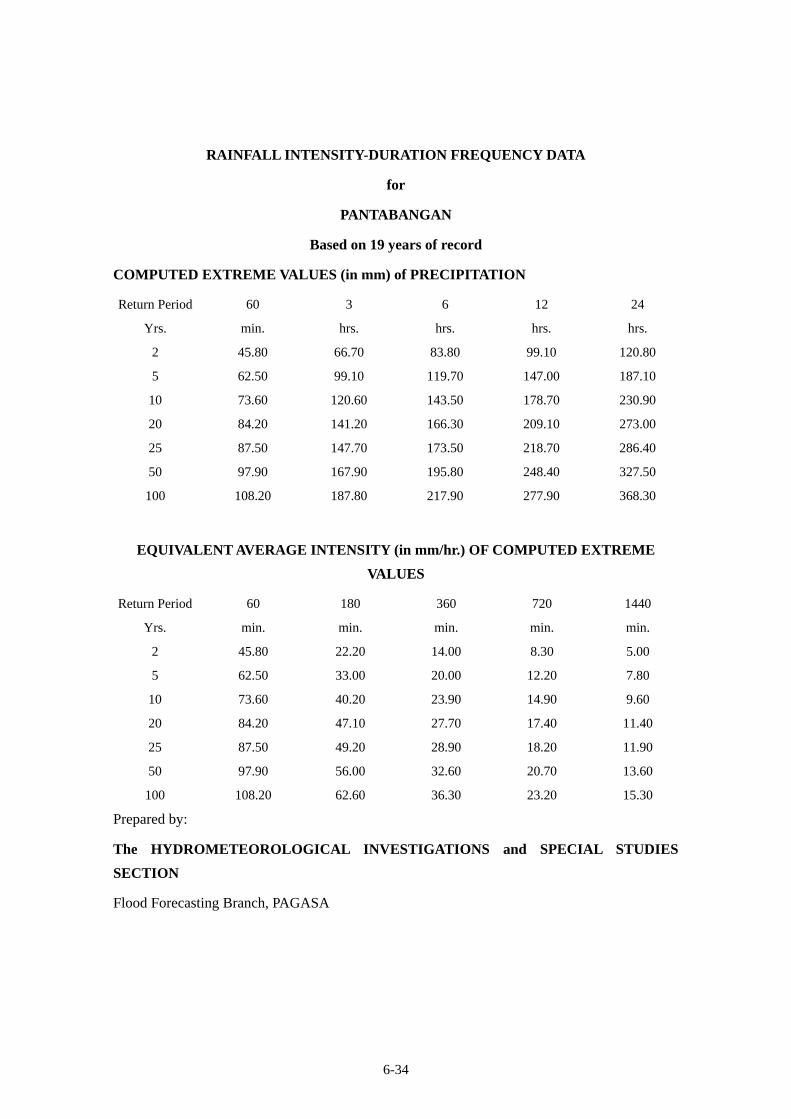
RAINFALL INTENSITY-DURATION FREQUENCY DATA
for
PANTABANGAN
Based on 19 years of record
COMPUTED EXTREME VALUES (in mm) of PRECIPITATION
Return Period 60 3 6 12 24
Yrs. min. hrs. hrs. hrs. hrs.
2 45.80 66.70 83.80 99.10 120.80
5 62.50 99.10 119.70 147.00 187.10
10 73.60 120.60 143.50 178.70 230.90
20 84.20 141.20 166.30 209.10 273.00
25 87.50 147.70 173.50 218.70 286.40
50 97.90 167.90 195.80 248.40 327.50
100 108.20 187.80 217.90 277.90 368.30
EQUIVALENT AVERAGE INTENSITY (in mm/hr.) OF COMPUTED EXTREME
VALUES
Return Period 60 180 360 720 1440
Yrs. min. min. min. min. min.
2 45.80 22.20 14.00 8.30 5.00
5 62.50 33.00 20.00 12.20 7.80
10 73.60 40.20 23.90 14.90 9.60
20 84.20 47.10 27.70 17.40 11.40
25 87.50 49.20 28.90 18.20 11.90
50 97.90 56.00 32.60 20.70 13.60
100 108.20 62.60 36.30 23.20 15.30
Prepared by:
The HYDROMETEOROLOGICAL INVESTIGATIONS and SPECIAL STUDIES
SECTION
Flood Forecasting Branch, PAGASA

6-35
(3) Hydrologic Study
1) Design Criteria The method used in computing the discharge was selected based on the size of the catchment area. The following criteria were used; Catchment area Method 0 – 20 km2 Rational Fomula > 20 km2 JICA Study 1982 (Rio Chico River and Talavera River)
2) Rational Formula The Rainfall Formula is the simplest method in estimation maximum discharge. This is widely applied when the catchment are is less than 20km2. The formula is;
Q = 0.278 CIA (in m3/sec) Where
Q = discharge in cubic meters per second C = coefficient of runoff which depends on the topographical character of the
drainage area I = Rainfall intensity in mm/hr for a duration equal to the time of concentration A = Drainage are in Km2
3) Catchment or Drainage Areas The preferred alignment was plotted on the topographic maps. Eighteen (18) natural waterways were identified along the alignment. The catchment areas for each water way was delineated. A catchment area is defined as the limits of the topographic divide which is the line that separates water flow between basins. Other hydrologic parameters such as length of waterway and difference of elevation are identified. Figure ** shows the delineated catchment areas.

6-36
FIGURE 6.3.2-1 CATCHMENT AREA (1/2)

6-37
FIGURE 6.3.2-1 CATCHMENT AREA (2/2)

6-38
4) Rainfall Analysis
The rainfall data from PAGASA was converted into a simple equation in the form:
Where:
I = Rainfall Intensity, mm/hr t = duration of rain in hours or minutes A,B and c are constants determined from the curves
Converting the data into formula form makes it easier to compute the corresponding rainfall value for different values of the time of concentration. The result of the analysis are as follows;
Station Return Period A b c 2 977.38 0.7168 9.3 5 1275.6 0.6951 8.4 10 1477.9 0.6878 8.0 15 1605.0 0.6847 8.0 20 1868.5 0.6970 9.2 25 1945.6 0.6957 9.2 50 1963.7 0.6793 7.8
Cabanatuan
100 2176.8 0.6777 7.8 2 1178.1 0.7691 -6.0 5 1156.7 0.7241 -9.0 10 1219.3 0.7082 -9.0 20 1238.6 0.6906 -10.0 25 1266.5 0.6887 -10.0 50 1337.5 0.6809 -10.0
Munoz, Nueva Ecija
100 1410.5 0.6745 -10.0 2 1151.9 0.7469 15 5 1475.7 0.7195 21 10 1880.2 0.7238 28 20 1986.6 0.7078 27 25 2091.6 0.7089 28 50 2353.9 0.7067 30
Pantabangan
100 2628.6 0.7055 32
5) Time of concentration
The time of concentration, Tc, is the required time for the stream under consideration to reach its peak discharge and could be computed using the formula developed by Kirpich as shown below;
L 1.15
51H 0.38
Where: Tc = Time of concentration in minutes L = Length of longest water course in the watershed in meter H = Difference in elevation between the highest point of the watershed and the
point under consideration in meters
Tc =
6-39
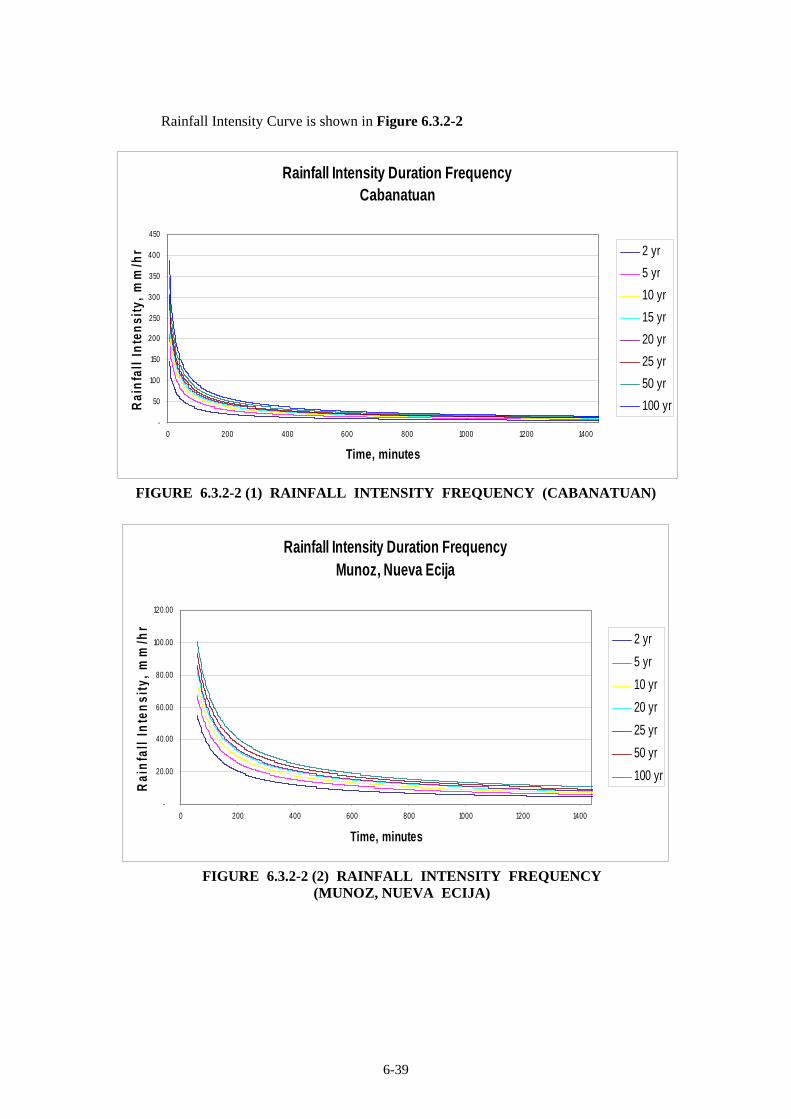
Rainfall Intensity Curve is shown in Figure 6.3.2-2
Rainfall Intensity Duration FrequencyCabanatuan
-
50
100
150
200
250
300
350
400
450
0 200 400 600 800 1000 1200 1400
Time, minutes
Rai
nfa
ll I
nte
nsi
ty,
mm
/hr 2 yr
5 yr
10 yr
15 yr
20 yr
25 yr
50 yr
100 yr
FIGURE 6.3.2-2 (1) RAINFALL INTENSITY FREQUENCY (CABANATUAN)
Rainfall Intensity Duration FrequencyMunoz, Nueva Ecija
-
20.00
40.00
60.00
80.00
100.00
120.00
0 200 400 600 800 1000 1200 1400
Time, minutes
Rai
nfa
ll I
nte
nsi
ty,
mm
/hr
2 yr
5 yr
10 yr
20 yr
25 yr
50 yr
100 yr
FIGURE 6.3.2-2 (2) RAINFALL INTENSITY FREQUENCY
(MUNOZ, NUEVA ECIJA)

6-40
Rainfall Intensity Duration FrequencyPantabangan
-
20
40
60
80
100
120
0 200 400 600 800 1000 1200 1400
Time, minutes
Rai
nfa
ll I
nte
nsi
ty,
mm
/hr
2 yr
5 yr
10 yr
20 yr
25 yr
50 yr
100 yr
FIGURE 6.3.2-2 (3) RAINFALL INTENSITY FREQUENCY (PANTABANGAN)
6) Runoff Coefficient The coefficient of runoff “C” is expressed as a percentage to which the peak runoff is reduced due to transitory storage. It varies according to the surface condition, slope, soil nature and rainfall duration in the drainage area. (Table 6.3.2-1) TABLE 6.3.2-1 VALUES OF “C” FOR USE IN THE RATIONAL FORMULA
DPWH Vol. II
Surface Value Proposed
Concrete or Asphalt Pavement * 0.9-1.0
Bituminous Macadam and Double Bituminous
Surface Treatment (Sandy to Clay) 0.7-0.9
Gravel Surface Road and Shoulder 0.3-0.6
Residential Area - City 0.3-0.6
Residential Area – Town and Village 0.2-0.5
Rocky Surface 0.7-0.9
Bare Clay Surface (faces of slips, etc.) 0.7-0.9
Forested Land (Sandy to Clay) 0.3-0.5
Flattish Cultivated Area (not flooded) 0.3-0.5
Steep or Rolling Grassed Areas 0.5-0.7
Flooded or Wet Paddies 0.7-0.8
Adopted from BOD Guidelines, Table 4.11

6-41
7) Synthetic Unit Hydrograph
The Unit Hydrograph for each catchment area in the project was derived using the fifty (50) years rainfall intensity of Nueva Ecija as the design storm rainfall and the US Soil Conservation Service (USCS) Dimensionless Unit Hydrograph shown in Figure. A.2.
Each Unit Hydrograph was developed following the procedures below:
(a) Determine Elements of the unit Hydrograph by Snyder’s Modified Lag Equation
shown below:
1. The lag time (Lg), in hours based on Snyder’s Modified Lag Equations are:
Lg = 0.6865 (Ct) L x Lca 0.38
eS
Where: Lg = lag time, in hours Ct = lag time coefficient
L = Length of watercourse from the drainage divide line to the point of interest, in km.
Lca = Length of watercourse perpendicular to the watershed centroid to the point of interest, in km.
S = Average basin slope.
2. Compute the rainfall duration (D or tr), in hours, which should be equal to one
fourth (1/4) or less of lag time
D = tr = Lg in hours
5.5
3. Time to peak in Hours, tp
tp = Lg + ½ (tr)
4. Unit Peak Discharge in m3/s, qp
qp = 0.278 Cp (D.A.)
tp
5. Derivation of Unit Hydrograph for subject rivers using US SCS Dimensionless Graph
6. Tabulate ratios of T/Tp and Q/Qp of the US SCS Dimensionless Unit Hydrograph as shown on Figure
6-42
7. With computed tp and qp, determine T and Q for the subject rivers
8. Construct unit hydrograph for subject basins
9. Read unit hydrograph ordinates at every time interval, tr.
(b) Derivation of Net Rainfall
1. At every tr (or D) interval, tabulate depth of rainfall from the 50-year rainfall of Nueva Ecija station.
2. Tabulate rainfall increment for each time tr determined as the rainfall difference in succeeding time tr.
3. Rearrange rainfall increment so that the peak or maximum value will be located approximately within the middle third or the two third of the base of the hydrograph reckoned from the origin and plot the hyetograph.
4. Determine rainfall losses at every time tr.
5. Tabulate rainfall excess (net rainfall) for every time tr.
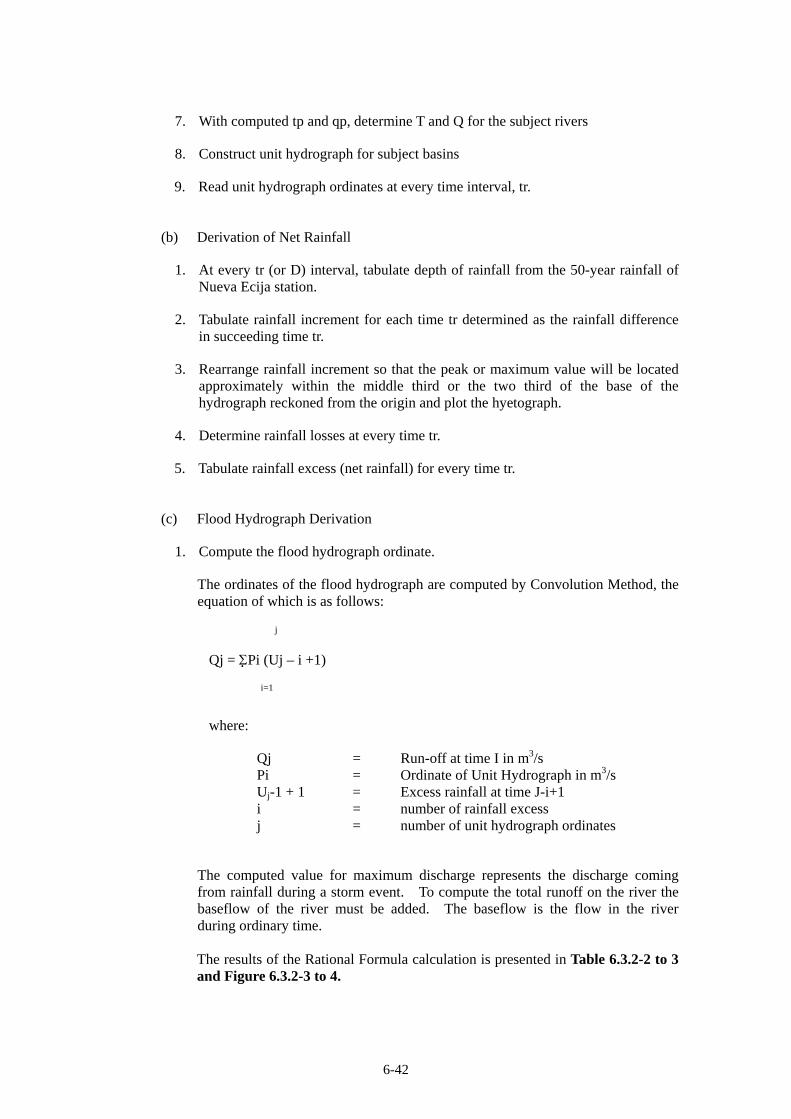
(c) Flood Hydrograph Derivation
1. Compute the flood hydrograph ordinate.
The ordinates of the flood hydrograph are computed by Convolution Method, the equation of which is as follows:
j
Qj = Pi (Uj – i +1)
i=1
where:
Qj = Run-off at time I in m3/s Pi = Ordinate of Unit Hydrograph in m3/s Uj-1 + 1 = Excess rainfall at time J-i+1 i = number of rainfall excess j = number of unit hydrograph ordinates
The computed value for maximum discharge represents the discharge coming from rainfall during a storm event. To compute the total runoff on the river the baseflow of the river must be added. The baseflow is the flow in the river during ordinary time.
The results of the Rational Formula calculation is presented in Table 6.3.2-2 to 3 and Figure 6.3.2-3 to 4.

6-43
TABLE 6.3.2-2 RESULT OF THE RATIONAL FORMULA CALCULATION (BASIN NO.1)
D E S I G N S H E E T
Project : CENTRAL LUZON EXPRESSWAY
Location: Basin No. 1
Item : DERIVATION OF FLOOD HYDROGRAPH
Date :
tr U.H.O. Net Rainfall Q50
1 1.50 0.018 0.0 0.017
2 3.00 0.091 0.0 0.114
3 4.50 0.193 0.0 0.574
4 6.00 0.339 0.0 2.205
5 7.50 0.521 0.0 7.773
6 9.00 0.725 0.0 22.164
7 10.50 0.932 0.0 43.474
8 12.00 1.078 0.9 72.363
9 13.50 1.176 1.6 107.638
10 15.00 1.213 13.5 146.190
11 16.50 1.190 19.2 183.766
12 18.00 1.118 130.8 211.753
13 19.50 1.021 27.5 229.648
14 21.00 0.913 4.3 236.134
15 22.50 0.804 0.0 231.593
16 24.00 0.683 0.0 218.110
17 25.50 0.597 0.0 199.565
18 27.00 0.513 0.0 178.482
19 28.50 0.451 0.0 157.122
20 30.00 0.390 0.0 134.870
21 31.50 0.342 0.0 117.233
22 33.00 0.293 0.0 101.181
23 34.50 0.256 0.0 88.509
24 36.00 0.220 0.0 76.831
25 37.50 0.189 0.0 66.998
26 39.00 0.159 0.0 57.787
27 40.50 0.139 0.0 50.241
28 42.00 0.120 0.0 43.210
29 43.50 0.106 0.0 37.167
30 45.00 0.092 0.0 31.534
Baseflow: 23.61 m3/s
Peak Discharge: 236.134
Maximum Q: 259.747 m3/s

6-44
TABLE 6.3.2-3 RESULT OF THE RATIONAL FORMULA CALCULATION (BASIN NO.18)
D E S I G N S H E E T
Project : CENTRAL LUZON EXPRESSWAY
Location: Basin No. 18 Item : DERIVATION OF FLOOD HYDROGRAPH
Date :
PRELIMINARY CALCULATIONS
tr U.H.O. Net Rainfall Q50
1 1.50 0.019 0.0 0.017
2 3.00 0.075 0.0 0.100
3 4.50 0.158 0.0 0.521
4 6.00 0.273 0.0 1.880
5 7.50 0.409 0.0 6.842
6 9.00 0.535 0.0 18.171
7 10.50 0.617 0.0 35.075
8 12.00 0.656 0.9 57.123
9 13.50 0.647 1.6 81.959
10 15.00 0.595 13.5 104.711
11 16.50 0.527 19.2 119.989
12 18.00 0.455 130.8 126.799
13 19.50 0.376 27.5 124.923
14 21.00 0.318 4.3 115.651
15 22.50 0.266 0.0 102.737
16 24.00 0.225 0.0 88.751
17 25.50 0.190 0.0 74.234
18 27.00 0.158 0.0 62.492
19 28.50 0.134 0.0 52.434
20 30.00 0.111 0.0 44.297
21 31.50 0.091 0.0 37.358
22 33.00 0.076 0.0 31.184
23 34.50 0.064 0.0 26.242
24 36.00 0.054 0.0 21.855
25 37.50 0.047 0.0 18.008
26 39.00 0.040 0.0 15.030
27 40.50 0.034 0.0 12.595
28 42.00 0.028 0.0 10.722
29 43.50 0.023 0.0 9.162
30 45.00 0.020 0.0 7.865
Baseflow: 12.68 m3/s
Peak Discharge: 126.799
Maximum Q: 139.479 m3/s

6-45
Basin No. 1 Hydrograph
0
50
100
150
200
250
0 5 10 15 20 25 30 35 40 45
Time, hours
Q,
m3/
s
FIGURE 6.3.2-3 RESULT OF THE RATIONAL FORMULA CALCULATION
(BASIN NO.1)
Basin No. 18 Hydrograph
0
20
40
60
80
100
120
140
0 5 10 15 20 25 30 35 40 45
Time, hours
Q,
m3/
s
FIGURE 6.3.2-4 RESULT OF THE RATIONAL FORMULA CALCULATION
(BASIN NO.18)
6-46
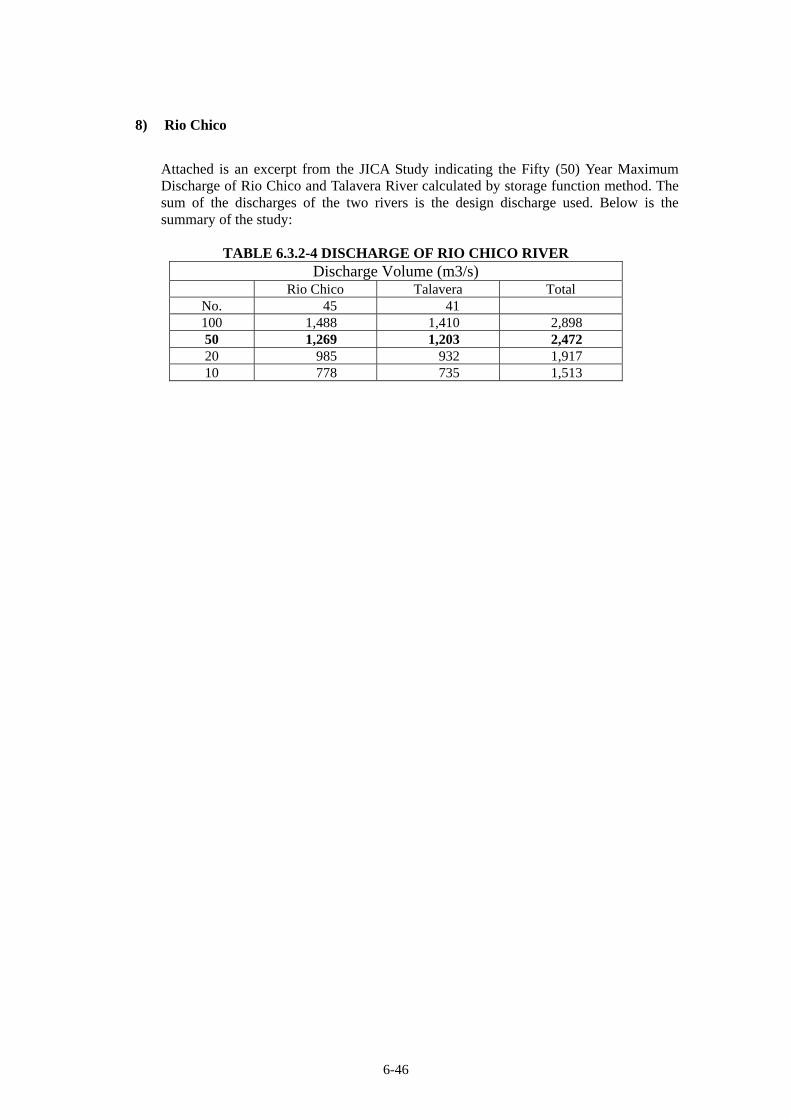
8) Rio Chico
Attached is an excerpt from the JICA Study indicating the Fifty (50) Year Maximum Discharge of Rio Chico and Talavera River calculated by storage function method. The sum of the discharges of the two rivers is the design discharge used. Below is the summary of the study:
TABLE 6.3.2-4 DISCHARGE OF RIO CHICO RIVER Discharge Volume (m3/s)
Rio Chico Talavera Total No. 45 41 100 1,488 1,410 2,898 50 1,269 1,203 2,472 20 985 932 1,917 10 778 735 1,513
6-47
6-48
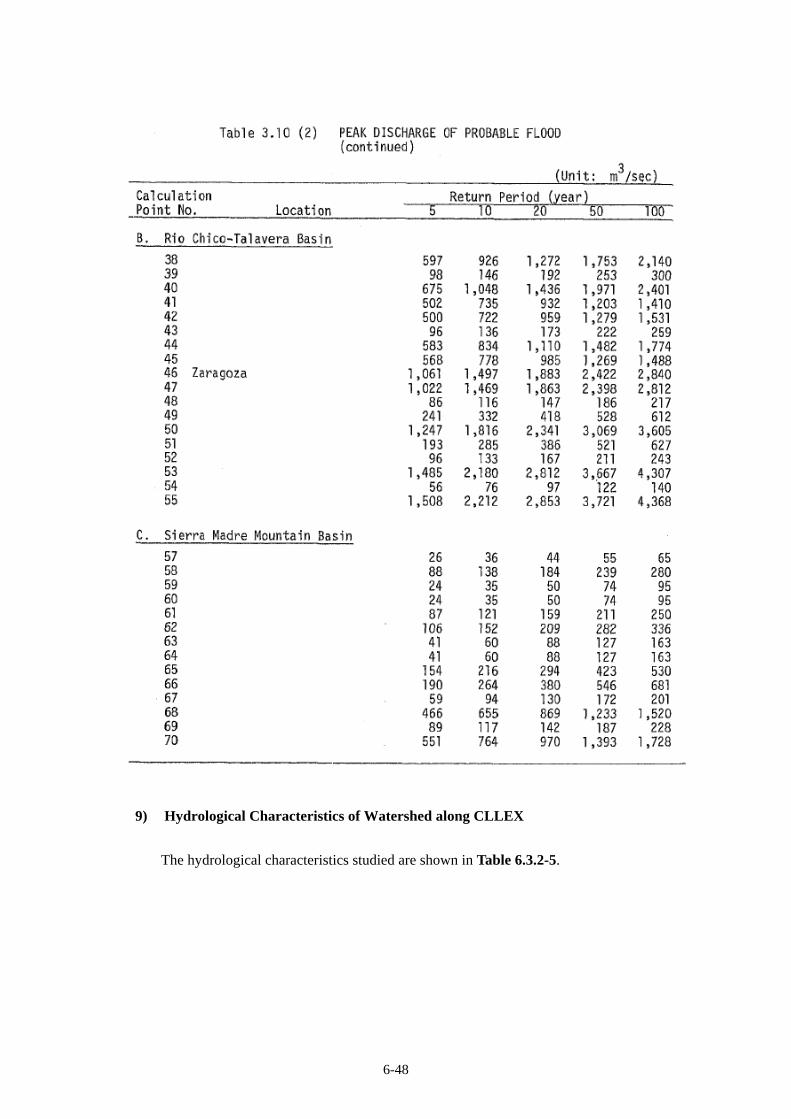
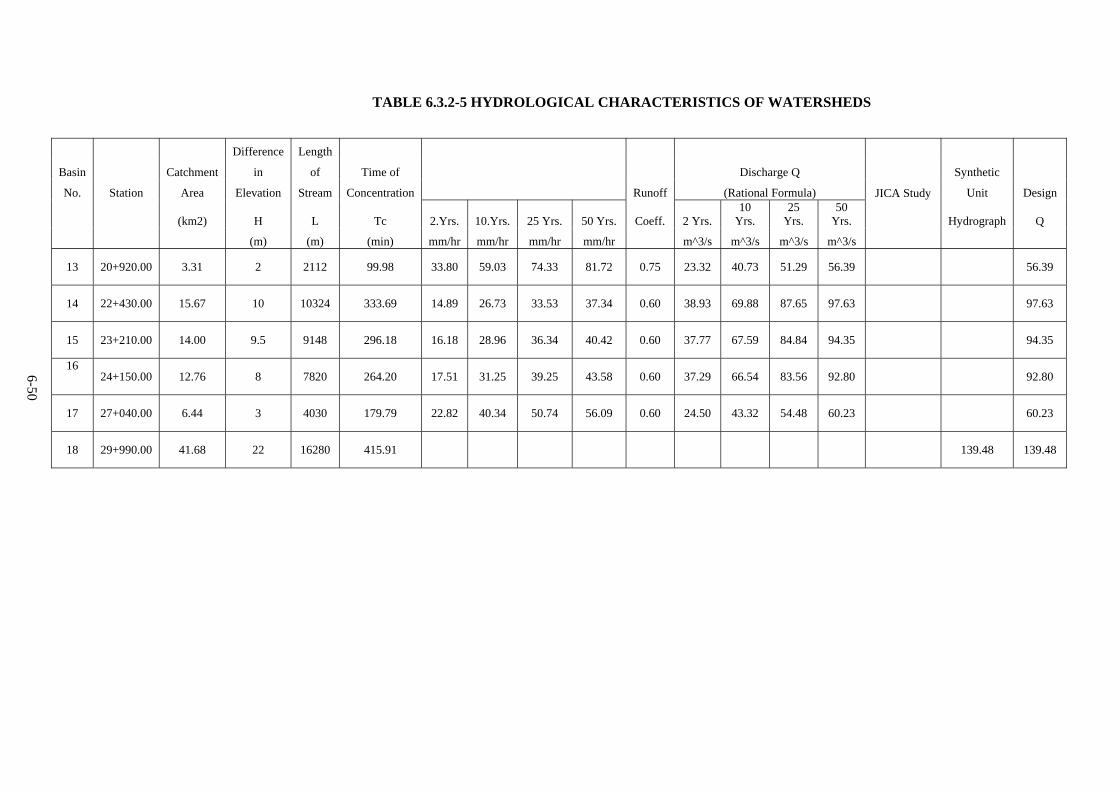
9) Hydrological Characteristics of Watershed along CLLEX
The hydrological characteristics studied are shown in Table 6.3.2-5.

6-49
TABLE 6.3.2-5 HYDROLOGICAL CHARACTERISTICS OF WATERSHEDS
Difference Length
Basin Catchment in of Time of Discharge Q Synthetic
No. Station Area Elevation Stream Concentration Runoff (Rational Formula) Unit Design
(km2) H L Tc 2.Yrs. 10.Yrs. 25 Yrs. 50 Yrs. Coeff. 2 Yrs.10
Yrs. 25
Yrs. 50
Yrs. Hydrograph Q
(m) (m) (min) mm/hr mm/hr mm/hr mm/hr m^3/s m^3/s m^3/s m^3/s
JICA Study
1 3+380.00 93.70 37 21599 471.26 259.75 259.75
2 4+220.00 3.88 1 1686 100.78 33.62 58.73 73.95 81.32 0.75 27.22 47.56 59.88 65.84 65.84
3 RIO CHICO 2472 2472.00
4 1+140.00 16.01 5 10020 421.04 12.65 22.86 28.63 31.99 0.75 42.25 76.31 95.59 106.81 106.81
5 11+970.00 2.71 5 8876 366.24 13.95 25.11 31.48 35.10 0.75 7.90 14.21 17.82 19.87 19.87
6 13+000.00 2.36 4 7708 339.31 14.72 26.43 33.15 36.93 0.75 7.24 13.00 16.31 18.17 18.17
7 13+660.00 3.81 4 6344 271.26 17.20 30.71 38.56 42.83 0.75 13.67 24.42 30.66 34.06 34.06
8 16+050.00 6.46 5 7658 309.08 15.71 28.14 35.31 39.29 0.75 21.16 37.90 47.56 52.92 52.92
9 16+930.00 1.73 1 2160 133.95 27.84 48.91 61.56 67.85 0.75 10.04 17.63 22.19 24.46 24.46
10 17+050.00 0.20 5 2628 90.33 36.12 62.96 79.27 87.10 0.75 1.47 2.56 3.23 3.54 3.54
11 17+860.00 1.20 5 1570 49.95 52.42 90.57 113.85 124.83 0.75 13.10 22.63 28.44 31.19 31.19
12 18+020.00 0.90 5 1059 31.76 68.17 117.36 147.01 161.37 0.75 12.81 22.05 27.62 30.32 30.32
6-50
TABLE 6.3.2-5 HYDROLOGICAL CHARACTERISTICS OF WATERSHEDS
Difference Length
Basin Catchment in of Time of Discharge Q Synthetic
No. Station Area Elevation Stream Concentration Runoff (Rational Formula) Unit Design
(km2) H L Tc 2.Yrs. 10.Yrs. 25 Yrs. 50 Yrs. Coeff. 2 Yrs.10
Yrs. 25
Yrs. 50
Yrs. Hydrograph Q
(m) (m) (min) mm/hr mm/hr mm/hr mm/hr m^3/s m^3/s m^3/s m^3/s
JICA Study
13 20+920.00 3.31 2 2112 99.98 33.80 59.03 74.33 81.72 0.75 23.32 40.73 51.29 56.39 56.39
14 22+430.00 15.67 10 10324 333.69 14.89 26.73 33.53 37.34 0.60 38.93 69.88 87.65 97.63 97.63
15 23+210.00 14.00 9.5 9148 296.18 16.18 28.96 36.34 40.42 0.60 37.77 67.59 84.84 94.35 94.35
16 24+150.00 12.76 8 7820 264.20 17.51 31.25 39.25 43.58 0.60 37.29 66.54 83.56 92.80 92.80
17 27+040.00 6.44 3 4030 179.79 22.82 40.34 50.74 56.09 0.60 24.50 43.32 54.48 60.23 60.23
18 29+990.00 41.68 22 16280 415.91 139.48 139.48

6-51
(4) Hydraulic Analysis
1) Manning’s Formula
For open channel, the calculation of Discharge, Q is based on the river properties such as cross-sectional area, perimeter and slope. Manning’s Formula is of the form:
V = R2/3 S1/2
n
Q = AV
Where:
V = velocity in m/s
Q = discharge in m3/s
A = cross-sectional area of water in m2
R = hydraulic radius in m.
= A 1
P
P = wetted perimeter in m.
S = slope
n = coefficient of roughness tabulated below

6-52
2) Values of Manning’s Roughness Coefficient “n”
Range
Surface / Description Minimum Maximum
1. Natural stream channels (top flood width less than 30 m. 0.030 0.035
i. Fairly regular section:
a. Some grass and weeds, little or no brush 0.035 0.050
b. Dense growth of weeds, depth of flow materially greater than weed height
0.035 0.050
c. Some weeds, light brush on banks 0.050 0.530
d. Some weeds, heavy brush on banks 0.050 0.070
e. Some weeds, dense trees 0.050 0.070
f. For trees within channel, with branches submerged at high flood increase all above values by
0.010 0.020
ii. Irregular sections, with pools, slight channel meander; increase values given above about
0.01 0.02
iii. Mountain streams, no vegetation in channel banks usually steep, trees and brush along banks submerged at high flood:
a. Bottom of gravel, cobbles, and few boulders 0.040 0.050
b. Bottom of cobbles, with large boulders 0.050 0.070
2. Larger stream channels (top flood width greater than 30 m.)
Reduce smaller coefficient by 0.010
3. Flood plain (adjacent to stream beds)
Pasture, short grass, no brush 0.030 0.035
Pasture, tall grass, no brush 0.035 0.050
Cultivated land – no crop 0.030 0.040
Cultivated land – nature field crops 0.045 0.055
Scrub and scattered bush 0.050 0.070
Wooded 0.120 0.160
4. Man-made channels and ditches
Earth, straight and uniform 0.017 0.025
Grass covered 0.035 0.050
Dredged 0.025 0.033
Stone lined and rock cuts, smooth & uniform 0.025 0.033
Stone lined and rock cuts, rough and irregular 0.035 0.045
Lined – metal corrugated 0.021 0.024
Lined – smooth concrete 0.012 0.018
Lined – grouted riprap 0.017 0.030
5. Pipes
Cast Iron 0.011 0.015
Wrought Iron 0.012 0.017
Corrugated Steel 0.021 0.035
Concrete 0.010 0.017
6-53
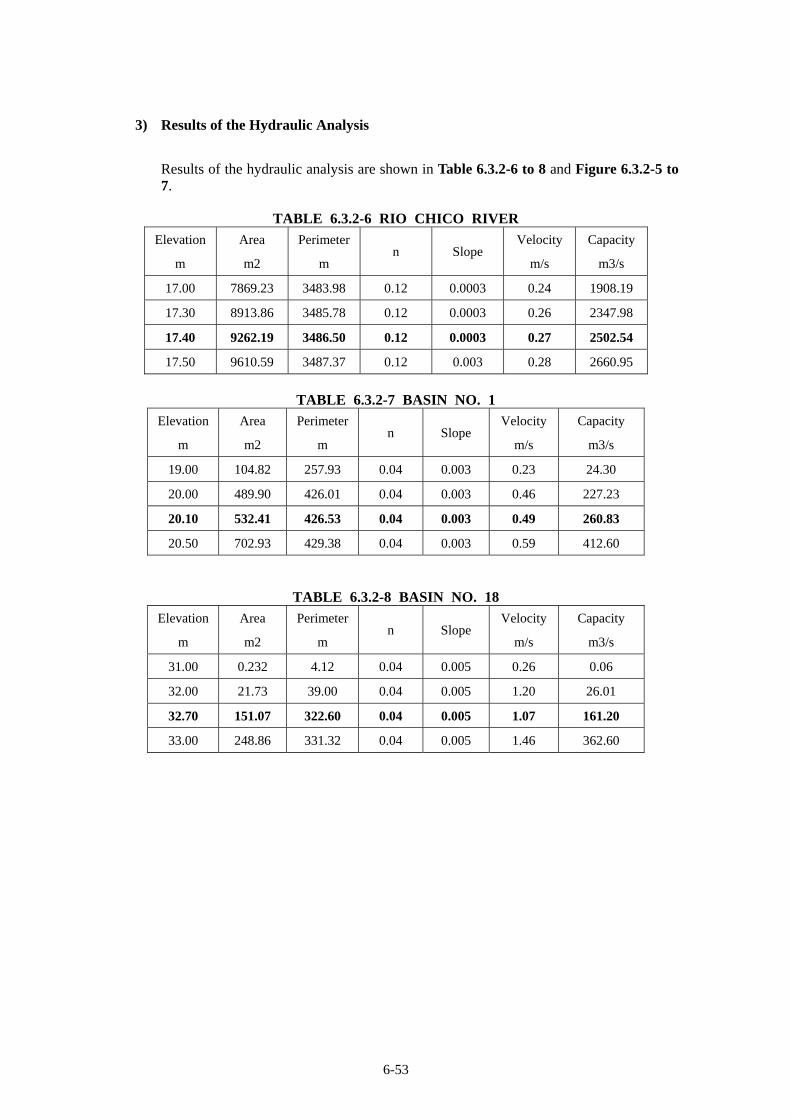
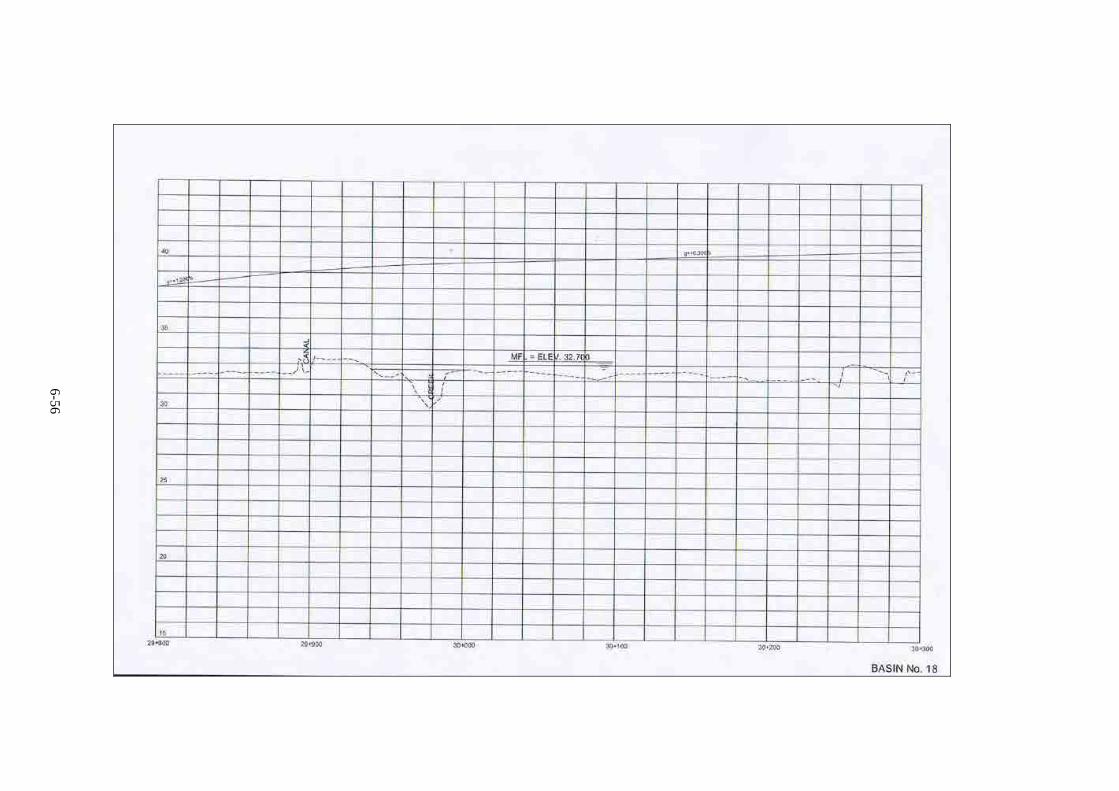
3) Results of the Hydraulic Analysis
Results of the hydraulic analysis are shown in Table 6.3.2-6 to 8 and Figure 6.3.2-5 to 7.
TABLE 6.3.2-6 RIO CHICO RIVER
Elevation
m
Area
m2
Perimeter
m n Slope
Velocity
m/s
Capacity
m3/s
17.00 7869.23 3483.98 0.12 0.0003 0.24 1908.19
17.30 8913.86 3485.78 0.12 0.0003 0.26 2347.98
17.40 9262.19 3486.50 0.12 0.0003 0.27 2502.54
17.50 9610.59 3487.37 0.12 0.003 0.28 2660.95
TABLE 6.3.2-7 BASIN NO. 1
Elevation
m
Area
m2
Perimeter
m n Slope
Velocity
m/s
Capacity
m3/s
19.00 104.82 257.93 0.04 0.003 0.23 24.30
20.00 489.90 426.01 0.04 0.003 0.46 227.23
20.10 532.41 426.53 0.04 0.003 0.49 260.83
20.50 702.93 429.38 0.04 0.003 0.59 412.60
TABLE 6.3.2-8 BASIN NO. 18
Elevation
m
Area
m2
Perimeter
m n Slope
Velocity
m/s
Capacity
m3/s
31.00 0.232 4.12 0.04 0.005 0.26 0.06
32.00 21.73 39.00 0.04 0.005 1.20 26.01
32.70 151.07 322.60 0.04 0.005 1.07 161.20
33.00 248.86 331.32 0.04 0.005 1.46 362.60

6-54

6-55
6-56

6-57
(5) Drainage Design Frequency
The design storm frequency adopted for this project is shown in Table 6.3.2-9 by recommendation in DPWH Design Guidelines Criteria and Standards Volume II (p697).
TABLE 6.3.2-9 DESIGN FREQUENCY BY ROAD STRUCTURE
Structure Return Period (year) Bridge 1/50 Box Culvert 1/25 Earth Embankment 1/10 Pipe Culvert 1/10 Road Structure Drainage 1/2 Road side drainage 1/2
Source: DPWH
(6) Design Flood Level
The area between SCTEX and Aliaga is known as flood prone area (more detail is described in Section 6.3.5). Water from Rio Chico River overflows and causes flood frequently. In the profile design of this section, two (2) design flood level was considered to determine the finished grade, namely 1) Medium Flood Water Level (MFWL) and 2) HWL (High Water Level).
6.3.3 Crossing Road and Water Way Design
(1) Technical Approach
In order to maintain the present accessibility after the construction of the highway, crossing road (under the highway or overpass the highway) and service road are designed.
Technical approach of the design is described as below; (1) To provide crossing road to maintain present accessibility after the construction (2) To provide enough road width considering future widening if any. (3) To provide enough vertical clearance in accordance with road category
(2) Typical Condition of Crossing Road
Cross sectional configuration of the crossing road and vertical clearance is designed According to present condition of the road, as shown in Table 6.3.3-1.

6-58
TABLE 6.3.3-1 CROSS SECTIONAL CONFIGURATION OF CROSSING ROAD
No Road Category Road width (m) Cross Sectional Configuration Vertical Clearance (m) Remark 1 National Road/
Municipality Road to be widened
18.0m 18,000
1,500
500
3,5003,5003,5003,500
500
1,500
5.2m
Vertical clearance (4.9m)
+ overlay(0.3m)=5.2m
Pan Philippine
Highway
Sta.Roas-Tarlac RD
Cabanatuan BP
2 National Road / Provincial Road not to be widened
10.0m 11,000
1,500
500
3,5003,500
500
1,500
5.2m
Vertical clearance (4.9m)
+ overlay(0.3m)=5.2m
La Paz- Victoria RD
Gumba-Aliaga RD
3 Municipality Road 10.0m 10,000
1,500
500
3,0003,000
500
1,500
4.0 m
Vertical clearance (3.8m)
+Over ray(0.2m) =4.0m
4 Farm road /
BRGY Road
(1lane)
5.0m 5,000
500
500
3,000
500
500
4.0 m
Vertical clearance (3.8m)
+Over ray(0.2m) =4.0m
5 Farm road /
BRGY Road
(2 lane)
8.0m 8,000
500
500
3,0003,000
500
500
4.0 m
Vertical clearance (3.8m)
+Over ray(0.2m) =4.0m

6-59
(3) Typical Condition of Crossing Water Way
Table 6.3.3-2 shows Typical condition of crossing water way.
TABLE 6.3.3-2 TYPICAL CONDITION OF CROSSING WATER WAY Category of water way Crossing Condition Structure
Discharge Volume (50years) <80m3/s RCBC with free board Discharge Volume(50 years)>80m3/s Bridge with free board
River
Existing Water Way Width >10m Bridge with free board Irrigation Canal Keep the same or more cross section
of existing canal Varies with free board
Table 6.3.3-3 shows Freeboard allowance of water way.
TABLE 6.3.3-3 FREEBOARD ALLOWANCE
No Design Discharge Q (m3/s) Free board (m) 1 Less than 200 0.6m 2 200 to less than 500 0.8m 3 500 to less than 2,000 1.0m 4 2000 to less than 5,000 1.2m 5 5000 to less than 10,000 1.5m 6 More than 10,000 2.0m
(4) List of crossing road and water way
List of crossing road and water way is shown in Table 6.3.3-4 to Table 6.3.3-7.

6-60
TABLE 6.3.3-4 LIST OF BRIDGE
Package No.Length
(m)No. of
Span(s)Span
ArrangementAngle
(degrees)Bridge Type Remarks
1 -0 + 024.4 - 0 + 035.6 60.0 2 30+30 80.00 AASHTO Girder V Road SCTEX Junction (Ramp Bridge)
2 1 + 875.0 - 1 + 899.0 24.0 1 24 115.00 RCDG Road (National Road) Sta. Rosa - Tarlac Road
3 3 + 358.0 - 3 + 393.0 35.0 1 35 115.00 AASHTO Girder V River Tin Tin River
4 7 + 528.0 - 9 + 033.0 1,505.0 43 43@35 90.00 AASHTO Girder V River Rio Chico River
5 11 + 107.0 - 11 + 179.0 72.0 3 3@24 115.00 RCDG River Natural creek
6 29 + 971.0 - 30 + 006.0 35.0 1 35 105.00 AASHTO Girder V River Natural creek
30 + 255.0 - 30 + 325.0 70.0 2 35+35 90.00 AASHTO Girder V West Bound
30 + 245.0 - 30 + 330.0 85.0 3 30+25+30 90.00 AASHTO Girder V East Bound
8 23 + 108.0 60.0 2 30+30 100.00 AASHTO Girder V Road CLLEX main expressway
9 25 + 840.0 60.0 2 30+30 90.00 AASHTO Girder V RoadCLLEX main expressway (CabanatuanHalf IC Ramp Bridge)
Road(Local Road) Cabanatuan Bypass(National Road) Pan-Philippines Highway
Package 2
Package 1
Package 2
Main Carriageway Bridge
Crossover Bridge for Main Carriageway
Station Crossing Object
7
6-61
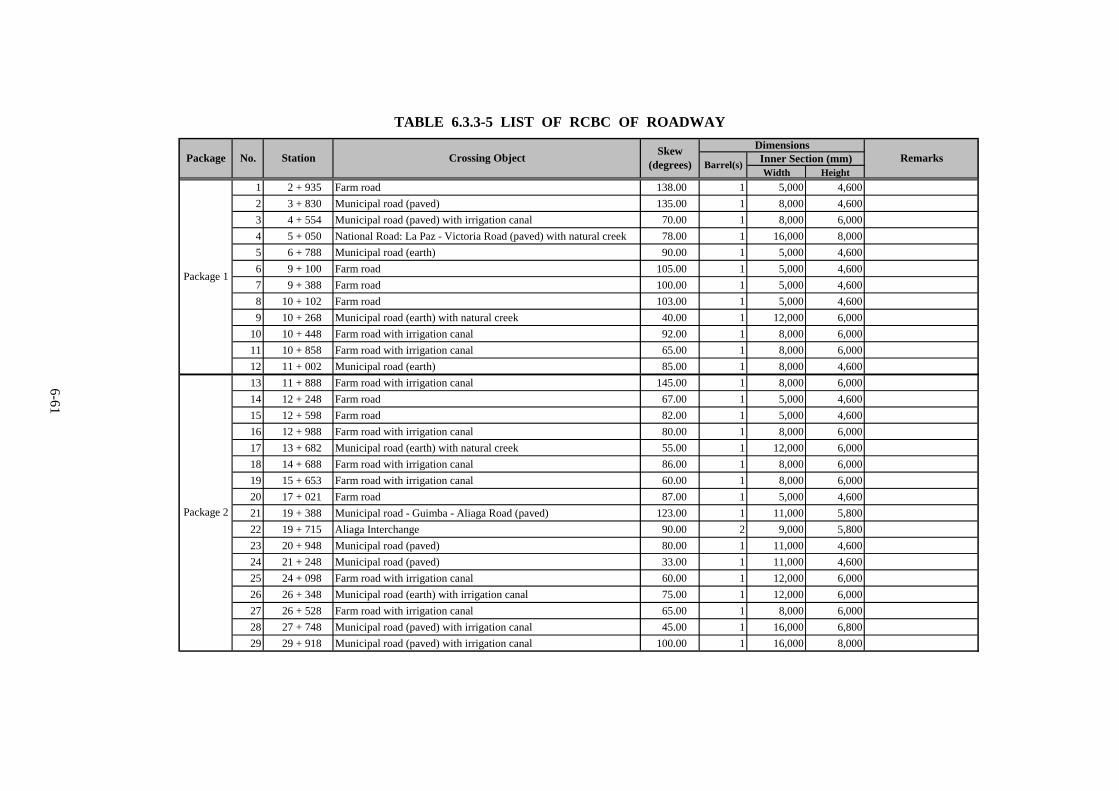
TABLE 6.3.3-5 LIST OF RCBC OF ROADWAY
Width Height
1 2 + 935 Farm road 138.00 1 5,000 4,600
2 3 + 830 Municipal road (paved) 135.00 1 8,000 4,600
3 4 + 554 Municipal road (paved) with irrigation canal 70.00 1 8,000 6,000
4 5 + 050 National Road: La Paz - Victoria Road (paved) with natural creek 78.00 1 16,000 8,000
5 6 + 788 Municipal road (earth) 90.00 1 5,000 4,600
6 9 + 100 Farm road 105.00 1 5,000 4,600
7 9 + 388 Farm road 100.00 1 5,000 4,600
8 10 + 102 Farm road 103.00 1 5,000 4,600
9 10 + 268 Municipal road (earth) with natural creek 40.00 1 12,000 6,000
10 10 + 448 Farm road with irrigation canal 92.00 1 8,000 6,000
11 10 + 858 Farm road with irrigation canal 65.00 1 8,000 6,000
12 11 + 002 Municipal road (earth) 85.00 1 8,000 4,600
13 11 + 888 Farm road with irrigation canal 145.00 1 8,000 6,000
14 12 + 248 Farm road 67.00 1 5,000 4,600
15 12 + 598 Farm road 82.00 1 5,000 4,600
16 12 + 988 Farm road with irrigation canal 80.00 1 8,000 6,000
17 13 + 682 Municipal road (earth) with natural creek 55.00 1 12,000 6,000
18 14 + 688 Farm road with irrigation canal 86.00 1 8,000 6,000
19 15 + 653 Farm road with irrigation canal 60.00 1 8,000 6,000
20 17 + 021 Farm road 87.00 1 5,000 4,600
21 19 + 388 Municipal road - Guimba - Aliaga Road (paved) 123.00 1 11,000 5,800
22 19 + 715 Aliaga Interchange 90.00 2 9,000 5,800
23 20 + 948 Municipal road (paved) 80.00 1 11,000 4,600
24 21 + 248 Municipal road (paved) 33.00 1 11,000 4,600
25 24 + 098 Farm road with irrigation canal 60.00 1 12,000 6,000
26 26 + 348 Municipal road (earth) with irrigation canal 75.00 1 12,000 6,000
27 26 + 528 Farm road with irrigation canal 65.00 1 8,000 6,000
28 27 + 748 Municipal road (paved) with irrigation canal 45.00 1 16,000 6,800
29 29 + 918 Municipal road (paved) with irrigation canal 100.00 1 16,000 8,000
Dimensions
Package 1
Station Crossing ObjectSkew
(degrees)
Package 2
Barrel(s)Inner Section (mm)No.Package Remarks
6-62
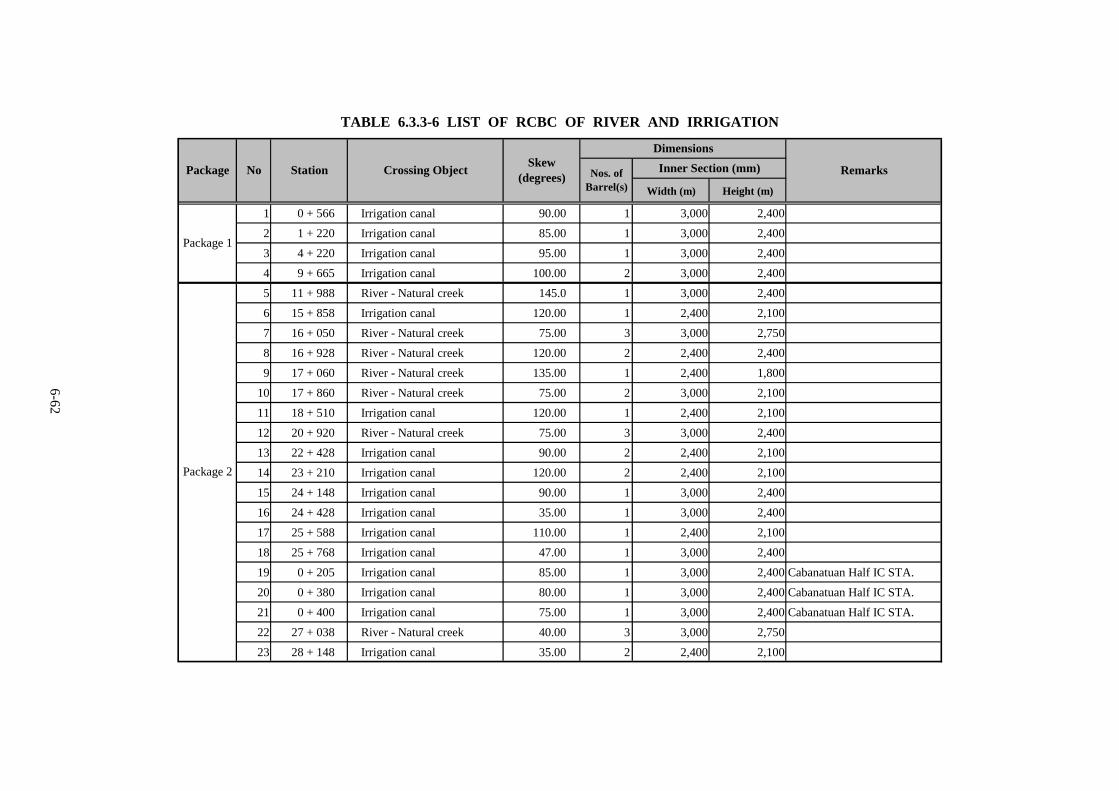
TABLE 6.3.3-6 LIST OF RCBC OF RIVER AND IRRIGATION
Width (m) Height (m)
1 0 + 566 Irrigation canal 90.00 1 3,000 2,400
2 1 + 220 Irrigation canal 85.00 1 3,000 2,400
3 4 + 220 Irrigation canal 95.00 1 3,000 2,400
4 9 + 665 Irrigation canal 100.00 2 3,000 2,400
5 11 + 988 River - Natural creek 145.0 1 3,000 2,400
6 15 + 858 Irrigation canal 120.00 1 2,400 2,100
7 16 + 050 River - Natural creek 75.00 3 3,000 2,750
8 16 + 928 River - Natural creek 120.00 2 2,400 2,400
9 17 + 060 River - Natural creek 135.00 1 2,400 1,800
10 17 + 860 River - Natural creek 75.00 2 3,000 2,100
11 18 + 510 Irrigation canal 120.00 1 2,400 2,100
12 20 + 920 River - Natural creek 75.00 3 3,000 2,400
13 22 + 428 Irrigation canal 90.00 2 2,400 2,100
14 23 + 210 Irrigation canal 120.00 2 2,400 2,100
15 24 + 148 Irrigation canal 90.00 1 3,000 2,400
16 24 + 428 Irrigation canal 35.00 1 3,000 2,400
17 25 + 588 Irrigation canal 110.00 1 2,400 2,100
18 25 + 768 Irrigation canal 47.00 1 3,000 2,400
19 0 + 205 Irrigation canal 85.00 1 3,000 2,400 Cabanatuan Half IC STA.
20 0 + 380 Irrigation canal 80.00 1 3,000 2,400 Cabanatuan Half IC STA.
21 0 + 400 Irrigation canal 75.00 1 3,000 2,400 Cabanatuan Half IC STA.
22 27 + 038 River - Natural creek 40.00 3 3,000 2,750
23 28 + 148 Irrigation canal 35.00 2 2,400 2,100
Package 1
Dimensions
RemarksNos. ofBarrel(s)
Inner Section (mm)
Package 2
No Station Crossing ObjectSkew
(degrees)Package
6-63
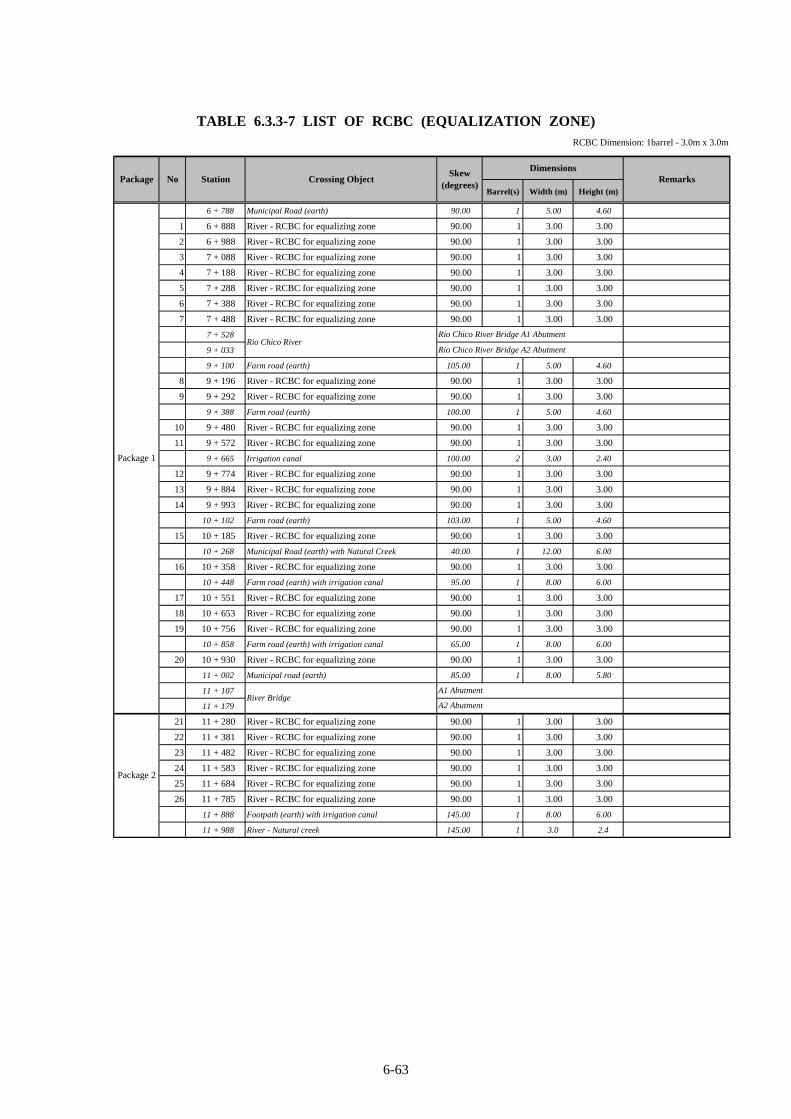
TABLE 6.3.3-7 LIST OF RCBC (EQUALIZATION ZONE)
Barrel(s) Width (m) Height (m)
6 + 788 Municipal Road (earth) 90.00 1 5.00 4.60
1 6 + 888 River - RCBC for equalizing zone 90.00 1 3.00 3.00
2 6 + 988 River - RCBC for equalizing zone 90.00 1 3.00 3.00
3 7 + 088 River - RCBC for equalizing zone 90.00 1 3.00 3.00
4 7 + 188 River - RCBC for equalizing zone 90.00 1 3.00 3.00
5 7 + 288 River - RCBC for equalizing zone 90.00 1 3.00 3.00
6 7 + 388 River - RCBC for equalizing zone 90.00 1 3.00 3.00
7 7 + 488 River - RCBC for equalizing zone 90.00 1 3.00 3.00
7 + 528
9 + 033
9 + 100 Farm road (earth) 105.00 1 5.00 4.60
8 9 + 196 River - RCBC for equalizing zone 90.00 1 3.00 3.00
9 9 + 292 River - RCBC for equalizing zone 90.00 1 3.00 3.00
9 + 388 Farm road (earth) 100.00 1 5.00 4.60
10 9 + 480 River - RCBC for equalizing zone 90.00 1 3.00 3.00
11 9 + 572 River - RCBC for equalizing zone 90.00 1 3.00 3.00
9 + 665 Irrigation canal 100.00 2 3.00 2.40
12 9 + 774 River - RCBC for equalizing zone 90.00 1 3.00 3.00
13 9 + 884 River - RCBC for equalizing zone 90.00 1 3.00 3.00
14 9 + 993 River - RCBC for equalizing zone 90.00 1 3.00 3.00
10 + 102 Farm road (earth) 103.00 1 5.00 4.60
15 10 + 185 River - RCBC for equalizing zone 90.00 1 3.00 3.00
10 + 268 Municipal Road (earth) with Natural Creek 40.00 1 12.00 6.00
16 10 + 358 River - RCBC for equalizing zone 90.00 1 3.00 3.00
10 + 448 Farm road (earth) with irrigation canal 95.00 1 8.00 6.00
17 10 + 551 River - RCBC for equalizing zone 90.00 1 3.00 3.00
18 10 + 653 River - RCBC for equalizing zone 90.00 1 3.00 3.00
19 10 + 756 River - RCBC for equalizing zone 90.00 1 3.00 3.00
10 + 858 Farm road (earth) with irrigation canal 65.00 1 8.00 6.00
20 10 + 930 River - RCBC for equalizing zone 90.00 1 3.00 3.00
11 + 002 Municipal road (earth) 85.00 1 8.00 5.80
11 + 107
11 + 179
21 11 + 280 River - RCBC for equalizing zone 90.00 1 3.00 3.00
22 11 + 381 River - RCBC for equalizing zone 90.00 1 3.00 3.00
23 11 + 482 River - RCBC for equalizing zone 90.00 1 3.00 3.00
24 11 + 583 River - RCBC for equalizing zone 90.00 1 3.00 3.00
25 11 + 684 River - RCBC for equalizing zone 90.00 1 3.00 3.00
26 11 + 785 River - RCBC for equalizing zone 90.00 1 3.00 3.00
11 + 888 Footpath (earth) with irrigation canal 145.00 1 8.00 6.00
11 + 988 River - Natural creek 145.00 1 3.0 2.4
Remarks
Package 1
River BridgeA2 Abutment
A1 Abutment
No Station Crossing ObjectSkew
(degrees)
Package 2
RCBC Dimension: 1barrel - 3.0m x 3.0m
Rio Chico RiverRio Chico River Bridge A1 Abutment
Rio Chico River Bridge A2 Abutment
PackageDimensions

6-64
6.3.4 Vertical Control
(1) Technical Approach
The Express highway is situated in the very flat plane land. The profile was studied in accordance with following orientations; 1) To Minimize Construction Cost: The embankment height shall be minimum while
providing sufficient clearance at road and water way crossing points.
2) To Secure from Flood: The minimum finished grade shall be determined in accordance with present and past flood in order to be secured from flood.
3) To Secure smoothness of drive: The minimum distance between PI point of vertical profile shall be 500m in order to secure smoothness of drive.
4) To accommodate surface drainage: It is also important to accommodate surface drainage to secure drivers safety during rain. The minimum vertical gradient is set as 0.3% for this reason.
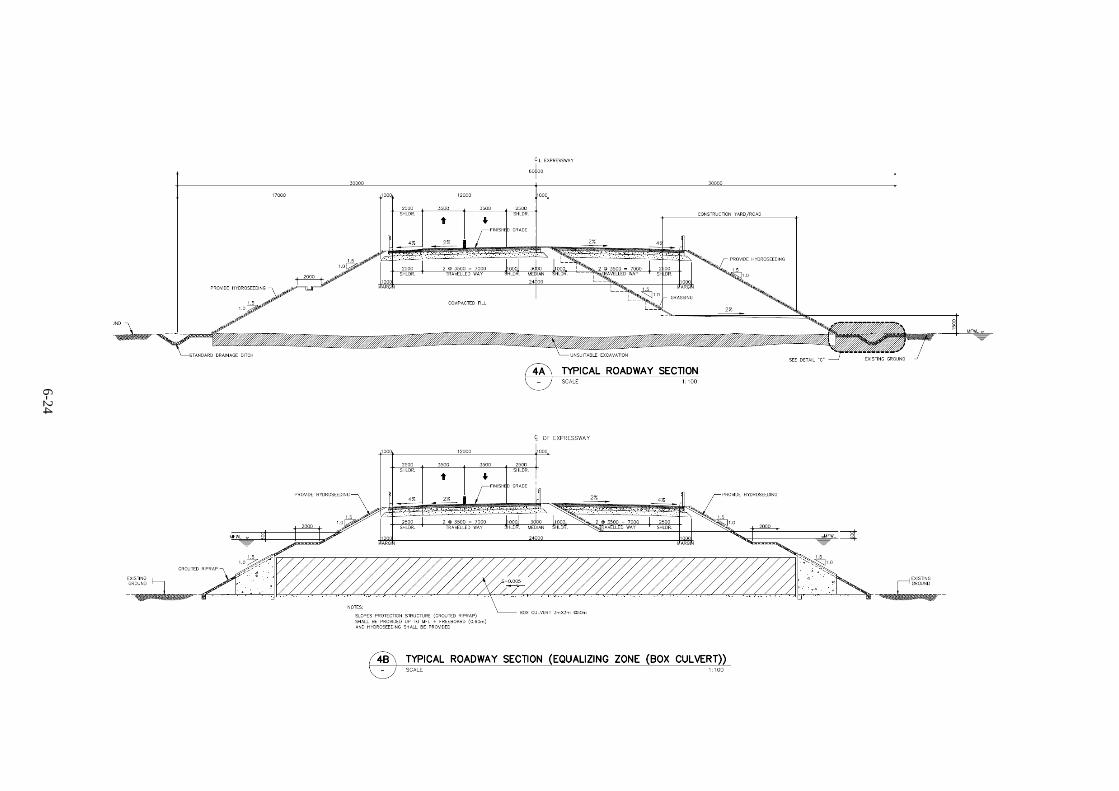
(2) Minimum Embankment Height
The most parts of the present surface of the land is paddy filed. The minimum embankment height is set as 1.5m. This is to secure stability of embankment from water and to provide sufficient clearance for small size pipe culverts for drainage.
(3) Vertical Control and Clearance List Vertical Control List is shown in Table 6.3.4-1.

6-65
TABLE 6.3.4-1 VERTICAL CONTROL POINT LIST (1/2) Profile Control Point List ( CLLEX 1 )
Control Elevation (A)No Station Control name Crossing Type No Type of Existing Super elevation
Crossing structure GL Vertical CL Girder Top Slab Pave % width Height Others TotalBr
1 0 + 5.000 SCTEX Under pass 1 W=25.00 L=35.00 25.600 5.200 2.0 0.080 2.0 % 9.500 0.190 33.070Br
2 1 + 887.000 Sta Rosa-Tarlac RD Under pass 1 W=25.00 L=35.00 22.200 5.200 2.0 0.080 2.0 % 9.500 0.190 29.670RCBC
3 2 + 940.000 Farm Road Under pass 2 W=4.00 H=4.60 4.000 0.500 2.0 % 9.500 0.190 4.690Br
4 3 + 375.000 Tin Tin River Under pass 1 W=25.00 L=35.00 18.800 4.000 2.0 0.080 2.0 % 9.500 0.190 25.070RCBC
5 3 + 830.000 Municipal Road Under pass 2 W=8.00 H=5.80 18.200 4.000 0.500 0.500 2.0 % 9.500 0.190 23.390Br
6 4 + 363.600 Natural Creek Under pass 1 W=25.00 L=35.00 18.100 4.000 2.0 0.080 2.0 % 9.500 0.190 24.370RCBC
7 4 + 550.000 Municipal Road Under pass 2 W=8.00 H=6.00 17.100 4.000 0.500 0.500 2.0 % 9.500 0.190 22.290RCBC
8 5 + 50.000 La Paz-Victoria Rd Under pass 2 W=16.00 H=8.00 17.400 5.200 1.200 0.500 2.0 % 9.500 0.190 24.490Br HWL
9 7 + 528.100 Rio Chico(W) Under pass 1 W=25.00 L=35.00 19.200 3.200 0.080 2.0 % 9.500 0.190 22.670Br HWL
10 9 + 33.000 Rio Chico(E) Under pass 1 W=25.00 L=35.00 19.200 3.200 0.080 2.0 % 9.500 0.190 22.670RCBC
11 9 + 388.000 Farm Road Under pass 2 W=5.00 L=4.60 14.400 4.000 0.400 0.500 2.0 % 9.500 0.190 19.490RCBC
12 10 + 108.000 Farm Road Under pass 2 W=5.00 L=4.60 14.500 4.000 0.400 0.500 2.0 % 9.500 0.190 19.590RCBC
13 10 + 268.000 Municipal Road Under pass 2 W=12.00 L=6.00 15.100 4.000 0.600 0.500 2.0 % 9.500 0.190 20.390RCBC
14 10 + 448.000 Farm Road Under pass 2 W=8.00 L=6.00 14.600 4.000 0.500 0.500 2.0 % 9.500 0.190 19.790RCBC
15 10 + 858.000 Farm Road Under pass 2 W=8.00 L=6.00 15.400 4.000 0.500 0.500 2.0 % 9.500 0.190 20.590RCBC
16 11 + 8.000 Municipal Road Under pass 2 W=8.00 L=5.80 15.500 4.000 0.500 0.500 2.0 % 9.500 0.190 20.690Br
17 11 + 103.100 Natural Creek Under pass 1 W=25.00 L=25.00 14.600 4.700 2.0 0.080 2.0 % 9.500 0.190 21.570RCBC
18 11 + 888.000 Farm Road Under pass 2 W=8.00 H=6.00 14.800 4.000 0.500 0.500 2.0 % 9.500 0.190 19.990RCBC
19 12 + 248.000 Farm Road Under pass 2 W=5.00 H=4.60 14.800 4.000 0.400 0.500 2.0 % 9.500 0.190 19.890RCBC
20 12 + 598.000 Farm Road Under pass 2 W=5.00 H=4.60 15.500 4.000 0.400 0.500 2.0 % 9.500 0.190 20.590RCBC
21 12 + 988.000 Farm Road Under pass 2 W=8.00 H=6.00 15.300 4.000 0.500 0.500 2.0 % 9.500 0.190 20.490RCBC
22 13 + 668.000 Municipal Road Under pass 2 W=12.00 H=6.00 15.800 4.000 0.600 0.500 2.0 % 9.500 0.190 21.090RCBC
23 14 + 688.000 Farm Road Under pass 2 W=12.00 L=6.00 15.800 4.000 0.500 0.500 2.0 % 9.500 0.190 20.990
6-66
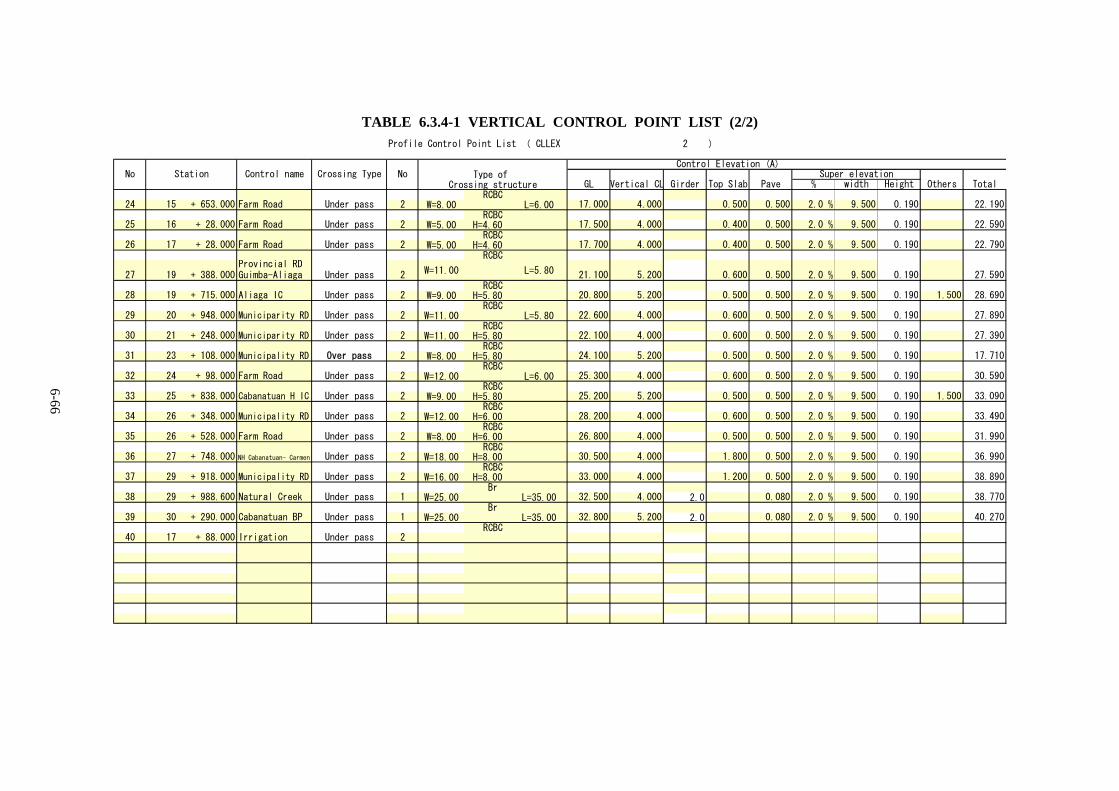
TABLE 6.3.4-1 VERTICAL CONTROL POINT LIST (2/2)
Profile Control Point List ( CLLEX 2 )
Control Elevation (A)No Station Control name Crossing Type No Type of Super elevation
Crossing structure GL Vertical CL Girder Top Slab Pave % width Height Others TotalRCBC
24 15 + 653.000 Farm Road Under pass 2 W=8.00 L=6.00 17.000 4.000 0.500 0.500 2.0 % 9.500 0.190 22.190RCBC
25 16 + 28.000 Farm Road Under pass 2 W=5.00 H=4.60 17.500 4.000 0.400 0.500 2.0 % 9.500 0.190 22.590RCBC
26 17 + 28.000 Farm Road Under pass 2 W=5.00 H=4.60 17.700 4.000 0.400 0.500 2.0 % 9.500 0.190 22.790RCBC
27 19 + 388.000Provincial RDGuimba-Aliaga Under pass 2 W=11.00 L=5.80 21.100 5.200 0.600 0.500 2.0 % 9.500 0.190 27.590
RCBC28 19 + 715.000 Aliaga IC Under pass 2 W=9.00 H=5.80 20.800 5.200 0.500 0.500 2.0 % 9.500 0.190 1.500 28.690
RCBC29 20 + 948.000 Municiparity RD Under pass 2 W=11.00 L=5.80 22.600 4.000 0.600 0.500 2.0 % 9.500 0.190 27.890
RCBC30 21 + 248.000 Municiparity RD Under pass 2 W=11.00 H=5.80 22.100 4.000 0.600 0.500 2.0 % 9.500 0.190 27.390
RCBC31 23 + 108.000 Municipality RD Over pass 2 W=8.00 H=5.80 24.100 5.200 0.500 0.500 2.0 % 9.500 0.190 17.710
RCBC32 24 + 98.000 Farm Road Under pass 2 W=12.00 L=6.00 25.300 4.000 0.600 0.500 2.0 % 9.500 0.190 30.590
RCBC33 25 + 838.000 Cabanatuan H IC Under pass 2 W=9.00 H=5.80 25.200 5.200 0.500 0.500 2.0 % 9.500 0.190 1.500 33.090
RCBC34 26 + 348.000 Municipality RD Under pass 2 W=12.00 H=6.00 28.200 4.000 0.600 0.500 2.0 % 9.500 0.190 33.490
RCBC35 26 + 528.000 Farm Road Under pass 2 W=8.00 H=6.00 26.800 4.000 0.500 0.500 2.0 % 9.500 0.190 31.990
RCBC36 27 + 748.000 NH Cabanatuan- Carmen Under pass 2 W=18.00 H=8.00 30.500 4.000 1.800 0.500 2.0 % 9.500 0.190 36.990
RCBC37 29 + 918.000 Municipality RD Under pass 2 W=16.00 H=8.00 33.000 4.000 1.200 0.500 2.0 % 9.500 0.190 38.890
Br38 29 + 988.600 Natural Creek Under pass 1 W=25.00 L=35.00 32.500 4.000 2.0 0.080 2.0 % 9.500 0.190 38.770
Br39 30 + 290.000 Cabanatuan BP Under pass 1 W=25.00 L=35.00 32.800 5.200 2.0 0.080 2.0 % 9.500 0.190 40.270
RCBC40 17 + 88.000 Irrigation Under pass 2
6-67
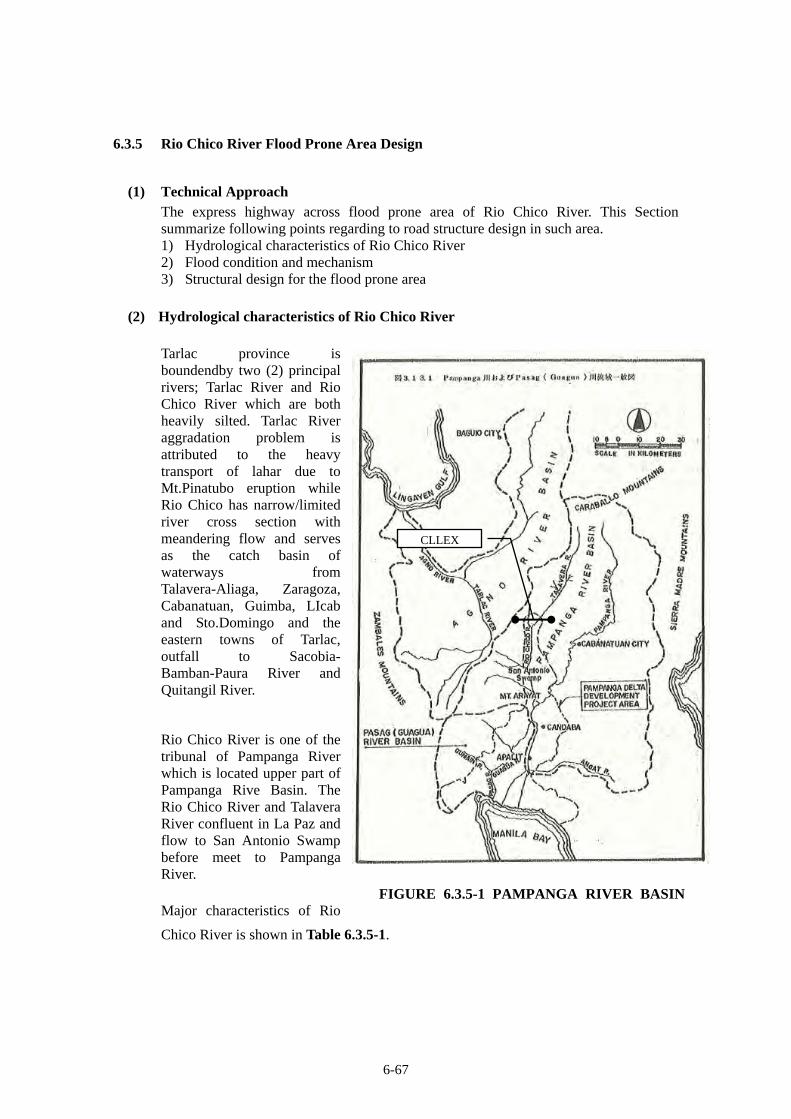
6.3.5 Rio Chico River Flood Prone Area Design
(1) Technical Approach The express highway across flood prone area of Rio Chico River. This Section summarize following points regarding to road structure design in such area. 1) Hydrological characteristics of Rio Chico River 2) Flood condition and mechanism 3) Structural design for the flood prone area
(2) Hydrological characteristics of Rio Chico River Tarlac province is boundendby two (2) principal rivers; Tarlac River and Rio Chico River which are both heavily silted. Tarlac River aggradation problem is attributed to the heavy transport of lahar due to Mt.Pinatubo eruption while Rio Chico has narrow/limited river cross section with meandering flow and serves as the catch basin of waterways from Talavera-Aliaga, Zaragoza, Cabanatuan, Guimba, LIcab and Sto.Domingo and the eastern towns of Tarlac, outfall to Sacobia- Bamban-Paura River and Quitangil River.
Rio Chico River is one of the tribunal of Pampanga River which is located upper part of Pampanga Rive Basin. The Rio Chico River and Talavera River confluent in La Paz and flow to San Antonio Swamp before meet to Pampanga River.
Major characteristics of Rio
Chico River is shown in Table 6.3.5-1.
CLLEX
FIGURE 6.3.5-1 PAMPANGA RIVER BASIN

6-68
TABLE 6.3.5-1 CHARACTERISTICS OF RIO CHICO AND PAMPANGA RIVER
Rio Chico River Pampanga River Catchment Area 1700km2 7700km2 River Slope 1/3,500 1/10,000 – 1/8,000 Discharge (50years) 2,400 (at Zaragoza)
3,700(at San Antonio) 4,350 (at Cabiao)
Discharge (100 years) 2,800(at Zaragoza) 4,400(at San Antonio)
4,900 (at Cabiao)
Source: JICA 1982
(3) Flood Condition
1) Flood Prone Area The maximum inundated area by 2004 is shown in Figure 6.3.5-2. The inundated area by Typhoon Pepeng in 2009, which caused the most flood disaster in this region, is assumed almost the same according to interview survey by the study team. This figure illustrates that major parts of the road stretch is within inundated area. Table 6.3.5-2 shows average inundated depth and days of related municipalities. La Paz has the most serious flood condition among all.
Source: JICA 2010
FIGURE 6.3.5-2 INUNDATED AREA ALONG STUDY ROUTE (MAXIMUM FLOOD BY 2004)
6-69
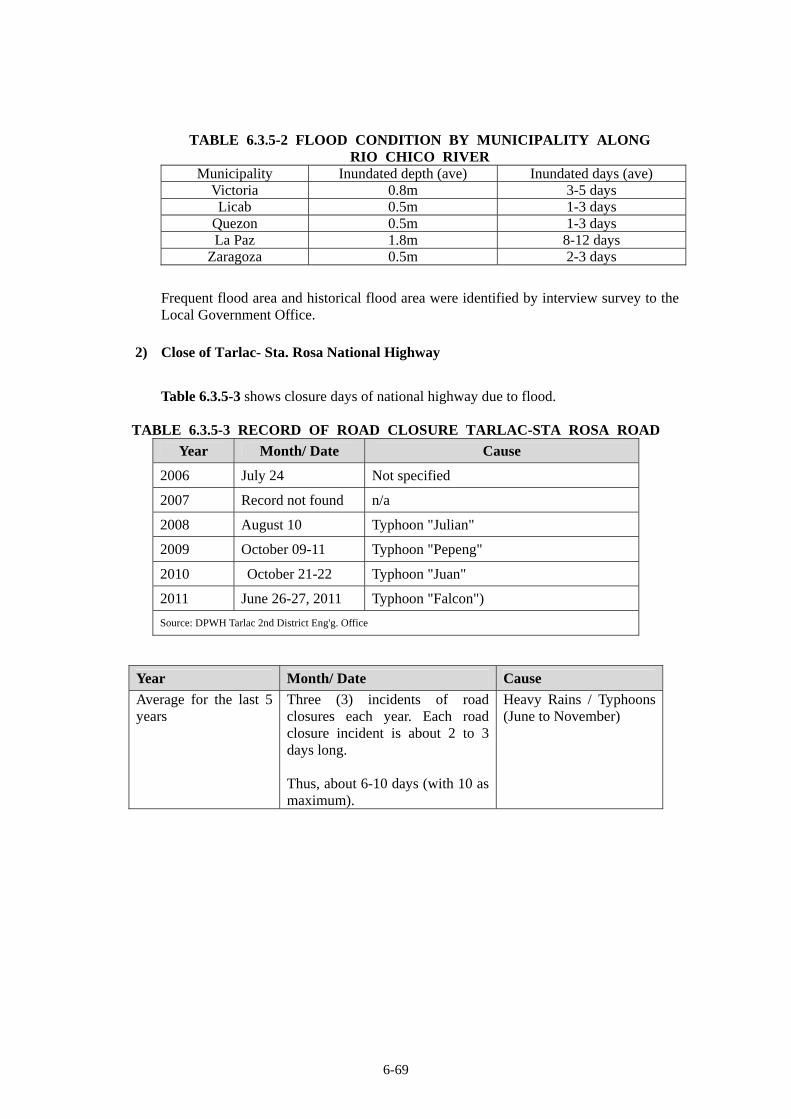
TABLE 6.3.5-2 FLOOD CONDITION BY MUNICIPALITY ALONG RIO CHICO RIVER
Municipality Inundated depth (ave) Inundated days (ave) Victoria 0.8m 3-5 days Licab 0.5m 1-3 days
Quezon 0.5m 1-3 days La Paz 1.8m 8-12 days
Zaragoza 0.5m 2-3 days
Frequent flood area and historical flood area were identified by interview survey to the Local Government Office.
2) Close of Tarlac- Sta. Rosa National Highway
Table 6.3.5-3 shows closure days of national highway due to flood.
TABLE 6.3.5-3 RECORD OF ROAD CLOSURE TARLAC-STA ROSA ROAD
Year Month/ Date Cause
2006 July 24 Not specified
2007 Record not found n/a
2008 August 10 Typhoon "Julian"
2009 October 09-11 Typhoon "Pepeng"
2010 October 21-22 Typhoon "Juan"
2011 June 26-27, 2011 Typhoon "Falcon") Source: DPWH Tarlac 2nd District Eng'g. Office
Year Month/ Date Cause Average for the last 5 years
Three (3) incidents of road closures each year. Each road closure incident is about 2 to 3 days long. Thus, about 6-10 days (with 10 as maximum).
Heavy Rains / Typhoons (June to November)

6-70
(4) Flood Mechanism
Flood mechanism in this area is summarized as Table 6.3.5-4 and Figure 6.3.5-3.
TABLE 6.3.5-4 SUMMARY OF FLOOD MECHANISM AT RIO CHICO RIVER No Location Reason Flood 1 Confluence of Rio Chico
River and Labong River Low land Ground elevation is 16 to 18m while other
is approx.20m River water gathers at low land.
2 Confluence of Rio Chico Rive and Talavera River
Confluence of two major river
Both rive has approx 1,200m3/s (50years). There is only low earth dike at the confluence point which is easily flow over.
3 National Road Crossing Point at Rio Chico River
Narrow river channel There is equalizer constructed in 2009 and a bridge of 250m passes over Rio Chico River. Flood frequently occurs at this point due to insufficient capacity of present river corridor. This causes back flow to the upper stream.
4 Rio Chico River and Talavera River
Collaption of existing dike
Existing dike is mostly earth bank which is already collapsed due to lack of maintenance. River water easily over flow from such portion.
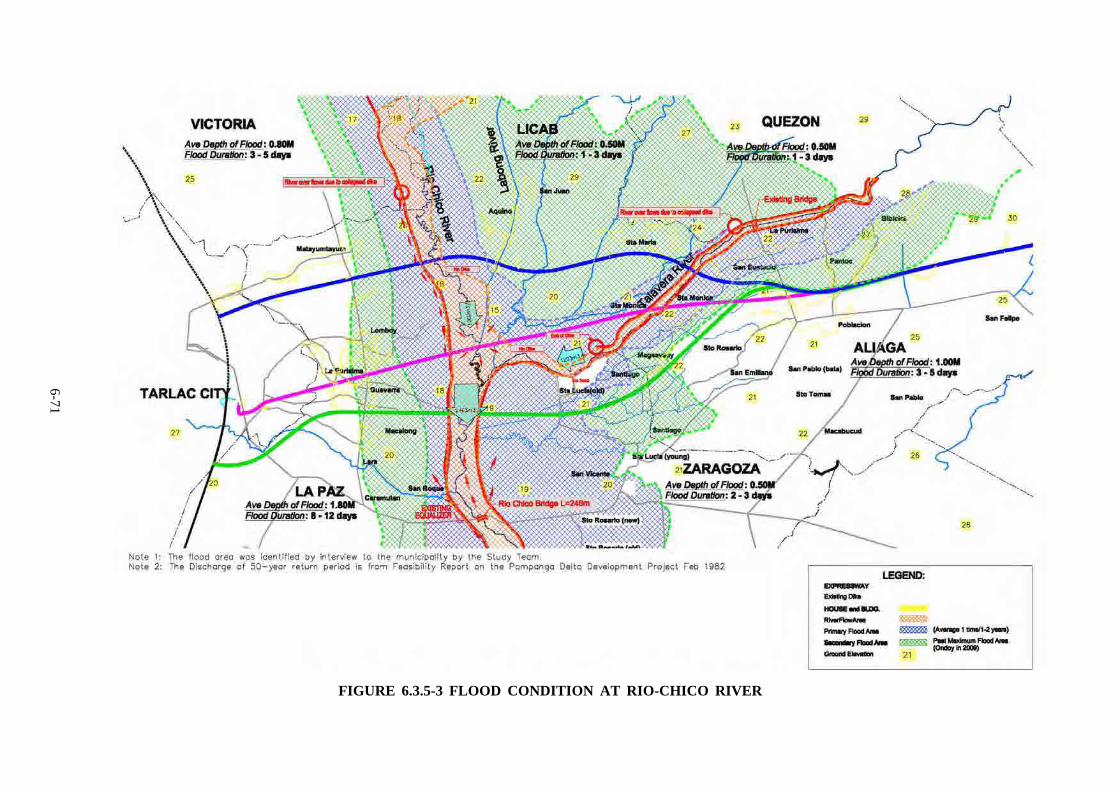
6-71
FIGURE 6.3.5-3 FLOOD CONDITION AT RIO-CHICO RIVER

6-72
(5) Rehabilitation Plan Of Rio Chico River
The JICA study conducted in 2007, THE STUDY ON THE NATIONWIDE FLOOD RISK ASSESSMENT AND THE FLOOD MITIGATION PLAN FOR THE SELECTED AREAS IN THE REPUBLIC OF THE PHILIPPINES, is proposing the rehabilitation of Rio Chico River as 20th priority among all river in the Philippines.
(6) Design High Water Level of Rio Chico River Flood Prone Area Historical flood level is shown in Table 6.3.5-5 and comparison from analyzed value is shown in Table 6.3.5-6. Design flood level is determined as shown in Table 6.3.5-7 by following reasons;
a. The actual high water level at crossing point is calculated as 19.2m from past record which can be assumed corresponding to 50 years return period.
b. Analyzed water level is 17.4m for 50 years discharge. It is -1.8m of record level.
c. The existing equalizer elevation at Tarlac-Sta Rosa NH is approximately 17.8m verified by topographic survey.
d. It is observed that flood water is blocked at equalizer and causing backflow to the upper stream. This explains recorded water level is higher than calculated level.
e. For such reason the Design Water Level is set as 19.2m for Bridge Design (50years) and 17.8m for Embankment Design.
TABLE 6.3.5-5 HISTORICAL FLOOD LEVEL Location Water level Remark Source
1.Along C route (FS2010)
19.75m Ondoy 2009, 5.1km from recommended alignment
FS2010 DPWH
2.Tarlac-Sta.Rosa NH 18.4m Ondoy 2009, 3.2km from recommended alignment
FS2010 DPWH
3. Tarlac-Sta Rosa NH
17.8m Average flood area DPWH Tarlac
Tarlac –Sta Rosa NH +1.0m from road surface at Equalizer
According to interview to LGU, Ondoy 2009
Tarlac – Sta.Rosa NH Surface elevation 17.5m – 18.0m
Topo survey conducted July 2011
Assumed water level at CLLEX crossing
19.2m Calculated from 1 and 2
TABLE 6.3.5-6 COMPARISON OF RECORD AND ANALYZED VALUE
Water level Remark (1) Recorded water level (historical) 19.2m Table 6.3.5-5 (2) Calculated water level (50years) 17.4m Table 6.3.2-6

6-73
TABLE 6.3.5-7 DESIGN FLOOD LEVEL Design
Water Level Corresponding Return Period
(assumed)
Water Level
Design Control Structure
MFWL (Medium Flood Water Level)
10 years 17.8m* 19.2m Minimum elevation = MFWL +0.6m(Freeboard) +0.8 (Pavement) =17.8+0.6+0.8=19.2m
Embankment
HWL (High Water Level)
50 years 19.2m** 22.4m Minimum elevation = HWL+1.2m(Freeboard)+2.0m(Bridge girder and slab) = 19.2+1.2+2.0=22.4m
Rio Chico Bridge
* Assumed from flood at Tarlac – Sta.Rosa National Road ** Assumed from past maximum flood level
FIGURE 6.3.5-4 ASSUMPTION OF MFWL AND HWL
(7) Vertical Control at Rio Chico River Bridge
Considering the flood condition, vertical control of Rio Chico River bridge is set as below; (Figure 6.3.5-5) Minimum Vertical Clearance is 19.2m(HWL) + Freeboard 1.2m (corresponding to 2,500m3/s for 50 years return period.)

6-74
FIGURE 6.3.5-5 SCHEMATIC IMAGE OF VERTICAL CONTROL POINT OF RIO CHICO RIVER
6-75
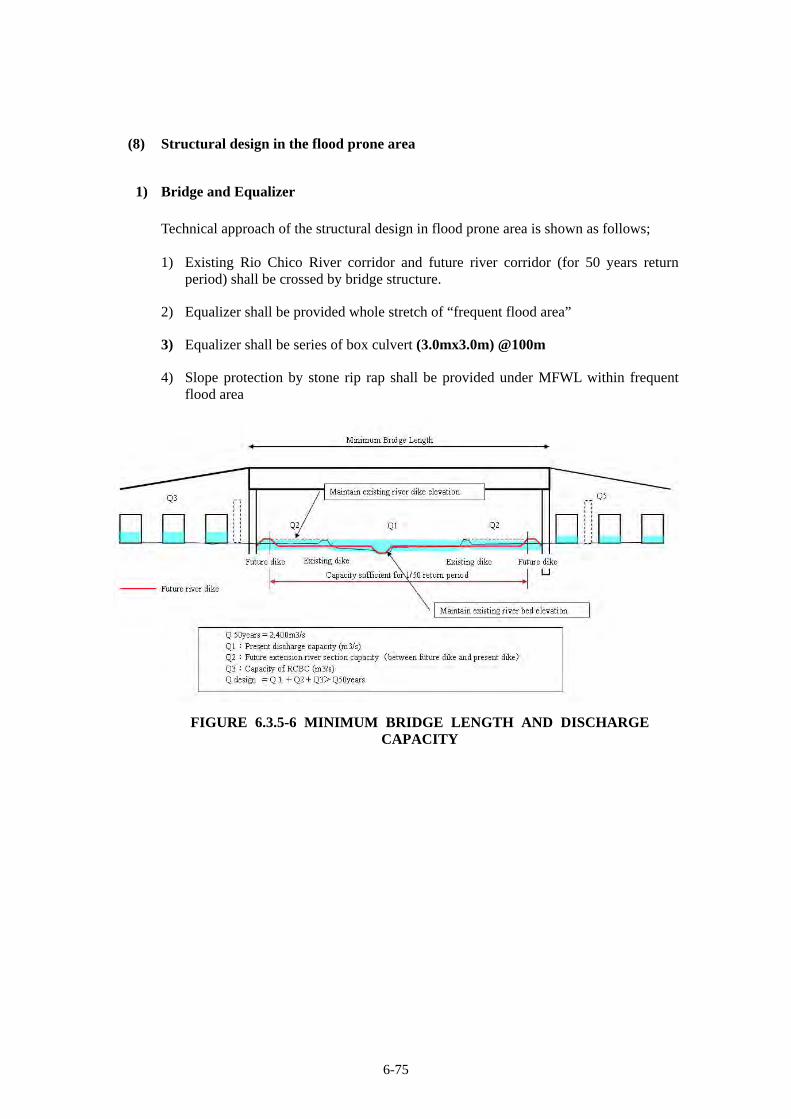
(8) Structural design in the flood prone area
1) Bridge and Equalizer Technical approach of the structural design in flood prone area is shown as follows; 1) Existing Rio Chico River corridor and future river corridor (for 50 years return
period) shall be crossed by bridge structure.
2) Equalizer shall be provided whole stretch of “frequent flood area”
3) Equalizer shall be series of box culvert (3.0mx3.0m) @100m
4) Slope protection by stone rip rap shall be provided under MFWL within frequent flood area
FIGURE 6.3.5-6 MINIMUM BRIDGE LENGTH AND DISCHARGE CAPACITY
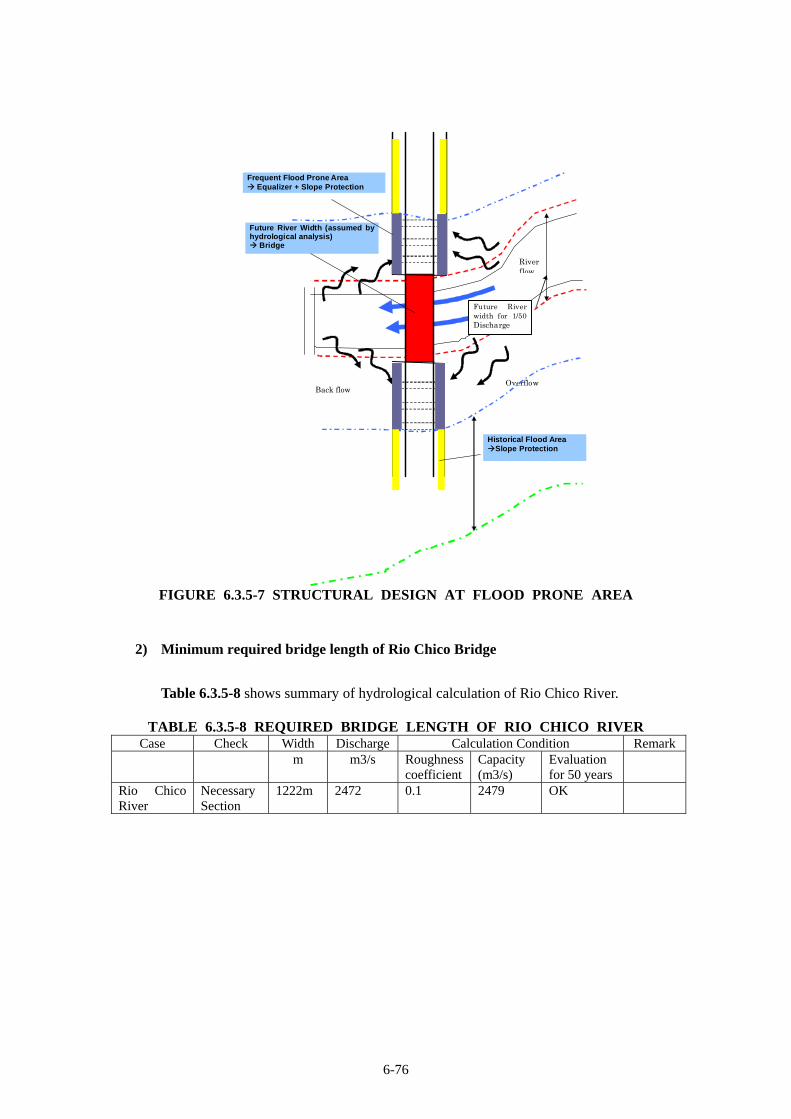
6-76
Future River width for 1/50 Discharge
Future River Width (assumed by hydrological analysis) Bridge
River flow
Back flow Overflow
Frequent Flood Prone Area Equalizer + Slope Protection
Historical Flood Area Slope Protection
FIGURE 6.3.5-7 STRUCTURAL DESIGN AT FLOOD PRONE AREA
2) Minimum required bridge length of Rio Chico Bridge
Table 6.3.5-8 shows summary of hydrological calculation of Rio Chico River.
TABLE 6.3.5-8 REQUIRED BRIDGE LENGTH OF RIO CHICO RIVER
Case Check Width Discharge Calculation Condition Remark m m3/s Roughness
coefficientCapacity (m3/s)
Evaluation for 50 years
Rio Chico River
Necessary Section
1222m 2472 0.1 2479 OK
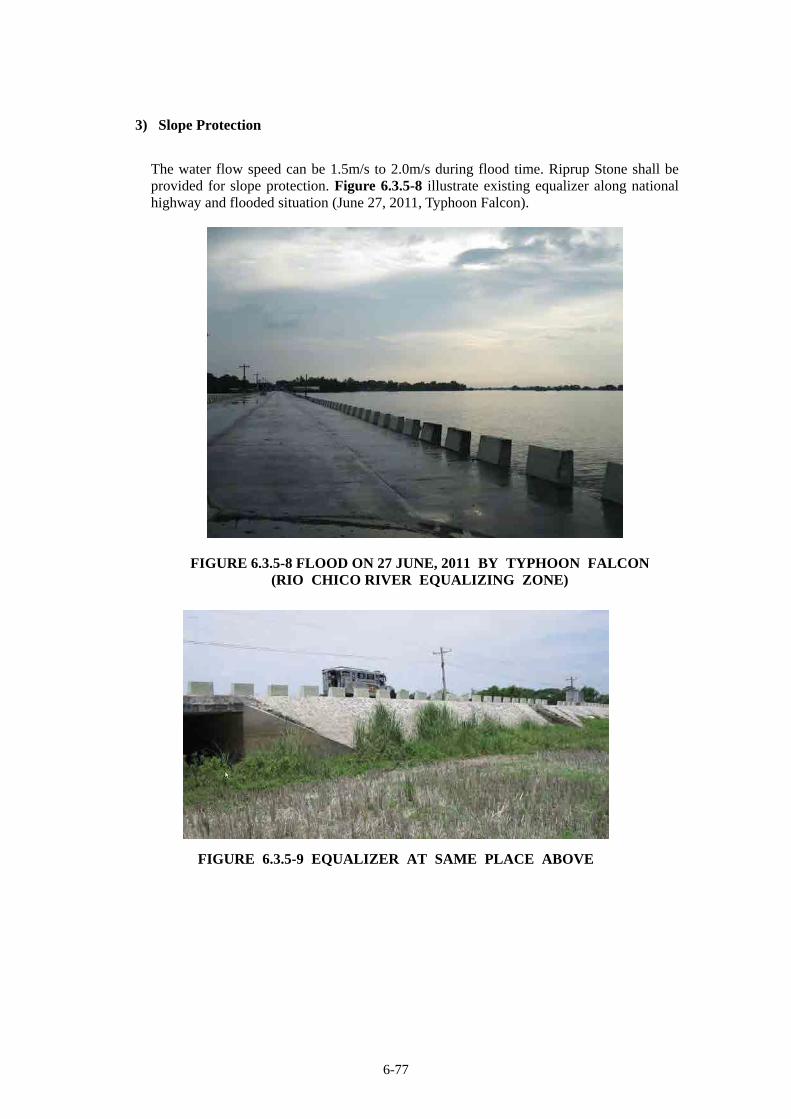
6-77
3) Slope Protection
The water flow speed can be 1.5m/s to 2.0m/s during flood time. Riprup Stone shall be provided for slope protection. Figure 6.3.5-8 illustrate existing equalizer along national highway and flooded situation (June 27, 2011, Typhoon Falcon).
FIGURE 6.3.5-8 FLOOD ON 27 JUNE, 2011 BY TYPHOON FALCON (RIO CHICO RIVER EQUALIZING ZONE)
FIGURE 6.3.5-9 EQUALIZER AT SAME PLACE ABOVE
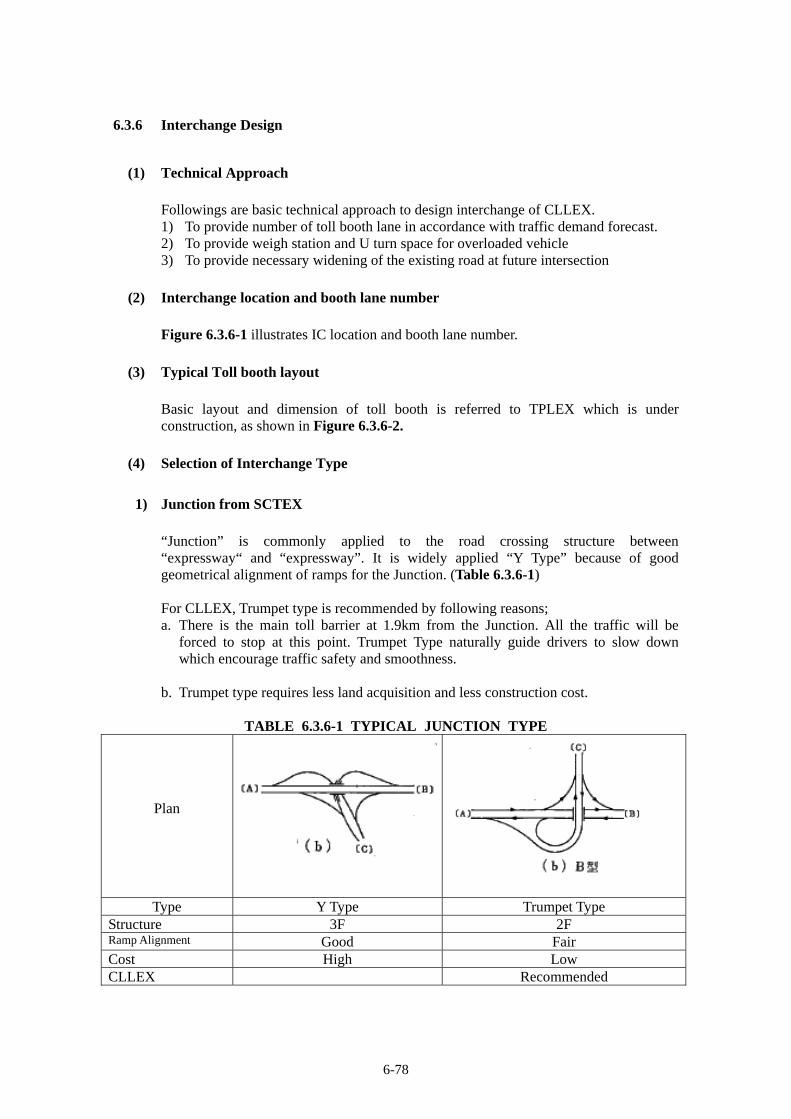
6-78
6.3.6 Interchange Design
(1) Technical Approach Followings are basic technical approach to design interchange of CLLEX. 1) To provide number of toll booth lane in accordance with traffic demand forecast. 2) To provide weigh station and U turn space for overloaded vehicle 3) To provide necessary widening of the existing road at future intersection
(2) Interchange location and booth lane number Figure 6.3.6-1 illustrates IC location and booth lane number.
(3) Typical Toll booth layout Basic layout and dimension of toll booth is referred to TPLEX which is under construction, as shown in Figure 6.3.6-2.
(4) Selection of Interchange Type
1) Junction from SCTEX “Junction” is commonly applied to the road crossing structure between “expressway“ and “expressway”. It is widely applied “Y Type” because of good geometrical alignment of ramps for the Junction. (Table 6.3.6-1) For CLLEX, Trumpet type is recommended by following reasons; a. There is the main toll barrier at 1.9km from the Junction. All the traffic will be
forced to stop at this point. Trumpet Type naturally guide drivers to slow down which encourage traffic safety and smoothness.
b. Trumpet type requires less land acquisition and less construction cost.
TABLE 6.3.6-1 TYPICAL JUNCTION TYPE
Plan
Type Y Type Trumpet Type Structure 3F 2F Ramp Alignment Good Fair Cost High Low CLLEX Recommended
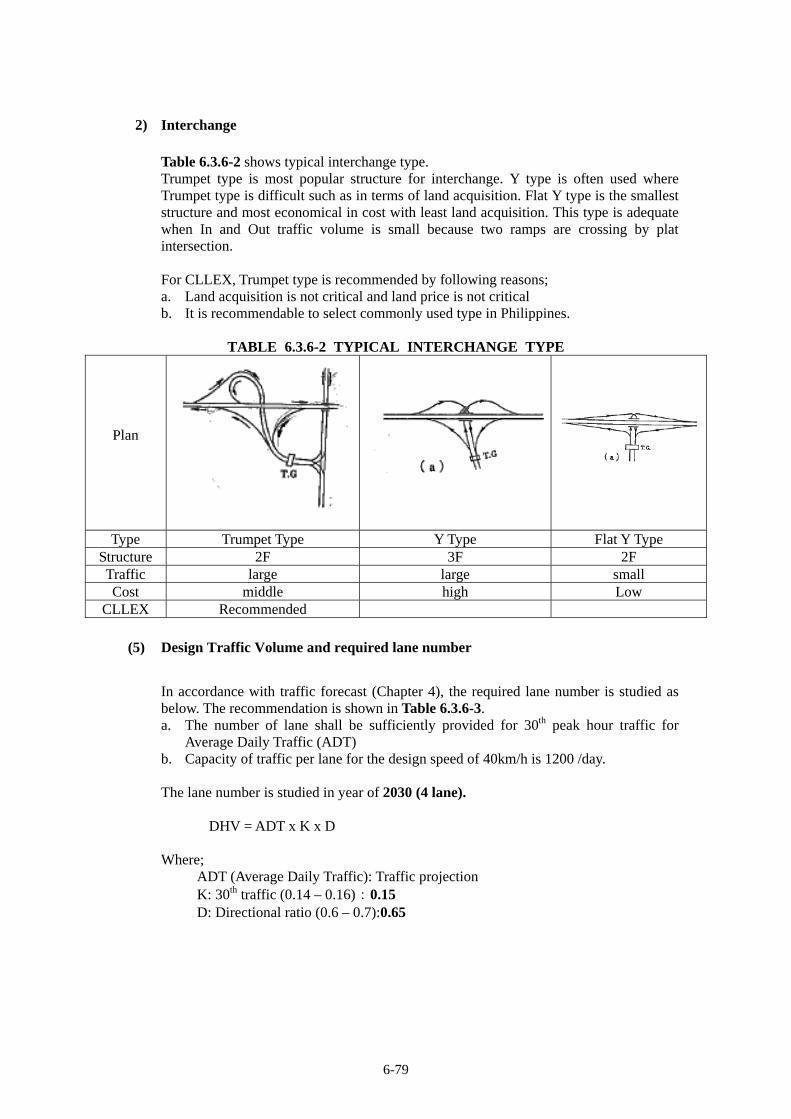
6-79
2) Interchange Table 6.3.6-2 shows typical interchange type. Trumpet type is most popular structure for interchange. Y type is often used where Trumpet type is difficult such as in terms of land acquisition. Flat Y type is the smallest structure and most economical in cost with least land acquisition. This type is adequate when In and Out traffic volume is small because two ramps are crossing by plat intersection. For CLLEX, Trumpet type is recommended by following reasons; a. Land acquisition is not critical and land price is not critical b. It is recommendable to select commonly used type in Philippines.
TABLE 6.3.6-2 TYPICAL INTERCHANGE TYPE
Plan
Type Trumpet Type Y Type Flat Y Type Structure 2F 3F 2F Traffic large large small Cost middle high Low
CLLEX Recommended
(5) Design Traffic Volume and required lane number
In accordance with traffic forecast (Chapter 4), the required lane number is studied as below. The recommendation is shown in Table 6.3.6-3. a. The number of lane shall be sufficiently provided for 30th peak hour traffic for
Average Daily Traffic (ADT) b. Capacity of traffic per lane for the design speed of 40km/h is 1200 /day.
The lane number is studied in year of 2030 (4 lane). DHV = ADT x K x D Where;
ADT (Average Daily Traffic): Traffic projection K: 30th traffic (0.14 – 0.16):0.15 D: Directional ratio (0.6 – 0.7):0.65
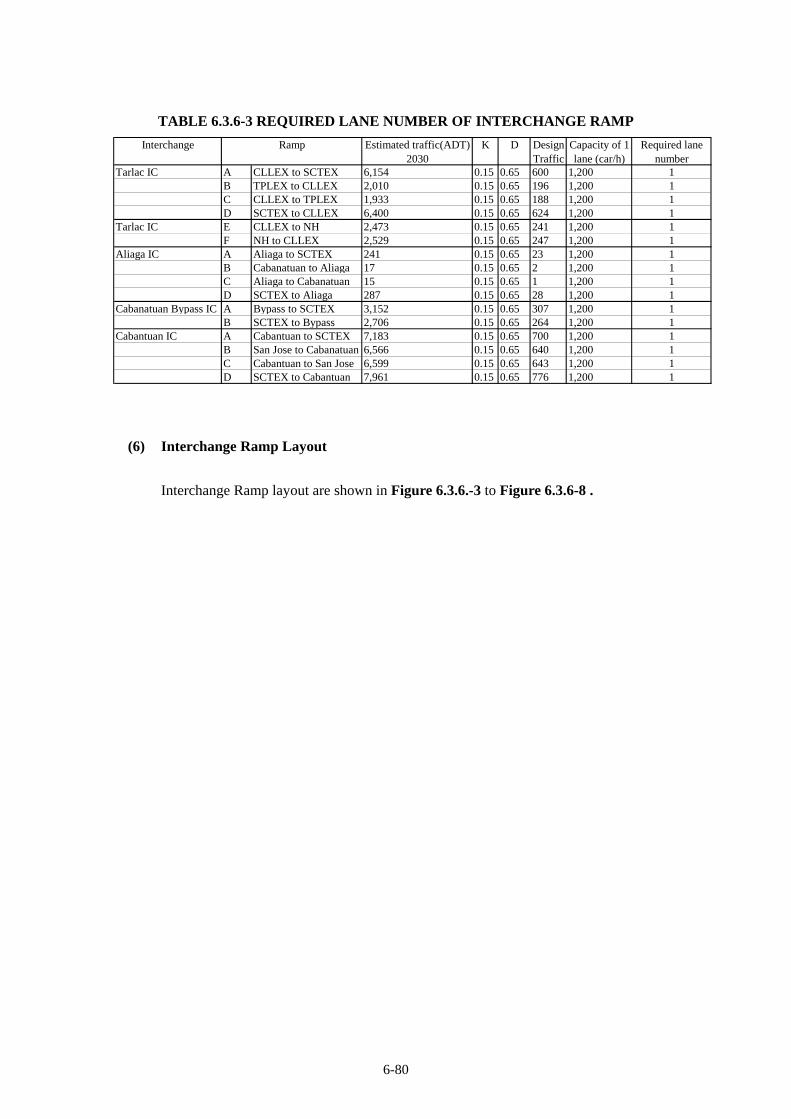
6-80
TABLE 6.3.6-3 REQUIRED LANE NUMBER OF INTERCHANGE RAMP
Interchange Estimated traffic(ADT)2030
K D DesignTraffic
Capacity of 1lane (car/h)
Required lanenumber
Tarlac IC A CLLEX to SCTEX 6,154 0.15 0.65 600 1,200 1B TPLEX to CLLEX 2,010 0.15 0.65 196 1,200 1C CLLEX to TPLEX 1,933 0.15 0.65 188 1,200 1D SCTEX to CLLEX 6,400 0.15 0.65 624 1,200 1
Tarlac IC E CLLEX to NH 2,473 0.15 0.65 241 1,200 1F NH to CLLEX 2,529 0.15 0.65 247 1,200 1
Aliaga IC A Aliaga to SCTEX 241 0.15 0.65 23 1,200 1B Cabanatuan to Aliaga 17 0.15 0.65 2 1,200 1C Aliaga to Cabanatuan 15 0.15 0.65 1 1,200 1D SCTEX to Aliaga 287 0.15 0.65 28 1,200 1
Cabanatuan Bypass IC A Bypass to SCTEX 3,152 0.15 0.65 307 1,200 1B SCTEX to Bypass 2,706 0.15 0.65 264 1,200 1
Cabantuan IC A Cabantuan to SCTEX 7,183 0.15 0.65 700 1,200 1B San Jose to Cabanatuan 6,566 0.15 0.65 640 1,200 1C Cabantuan to San Jose 6,599 0.15 0.65 643 1,200 1D SCTEX to Cabantuan 7,961 0.15 0.65 776 1,200 1
Ramp
(6) Interchange Ramp Layout
Interchange Ramp layout are shown in Figure 6.3.6.-3 to Figure 6.3.6-8 .
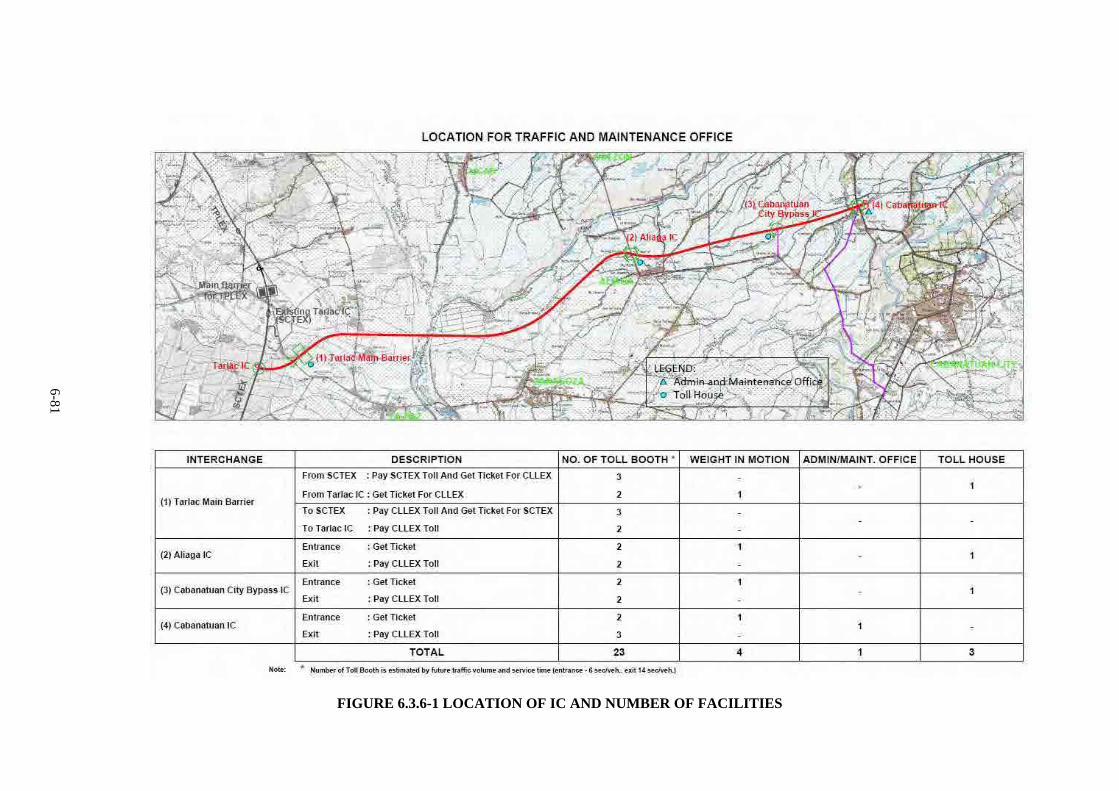
6-81
FIGURE 6.3.6-1 LOCATION OF IC AND NUMBER OF FACILITIES
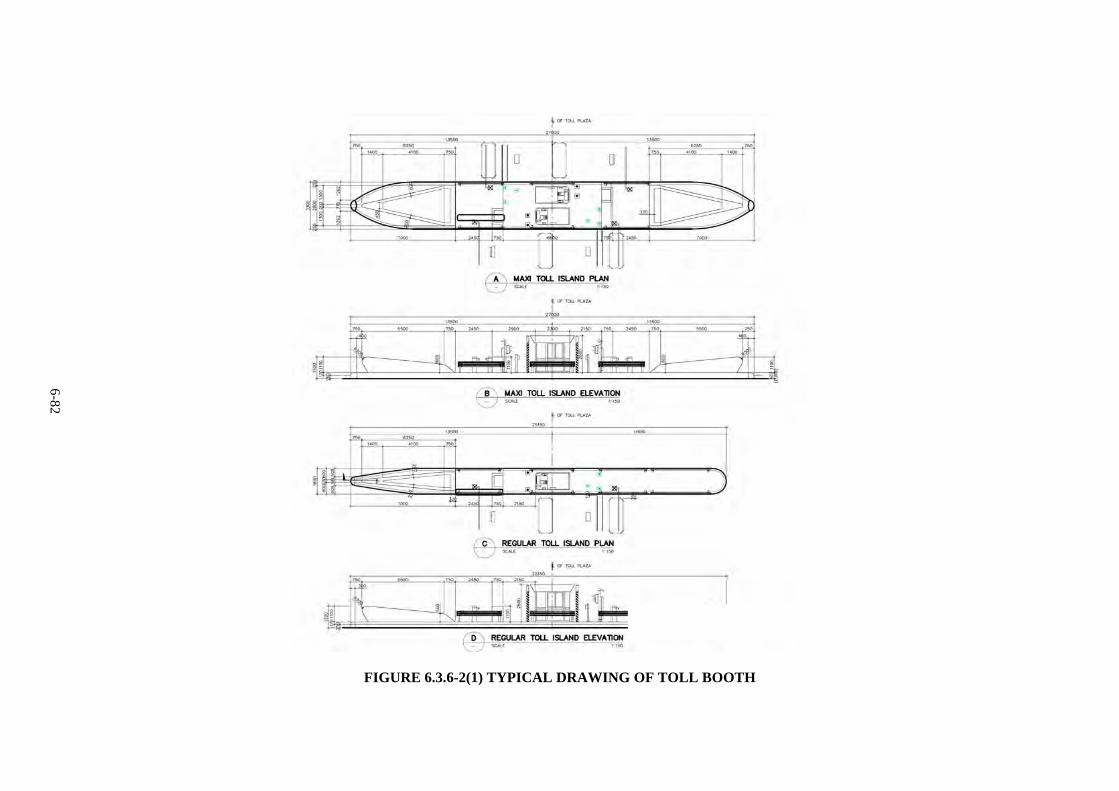
6-82
FIGURE 6.3.6-2(1) TYPICAL DRAWING OF TOLL BOOTH
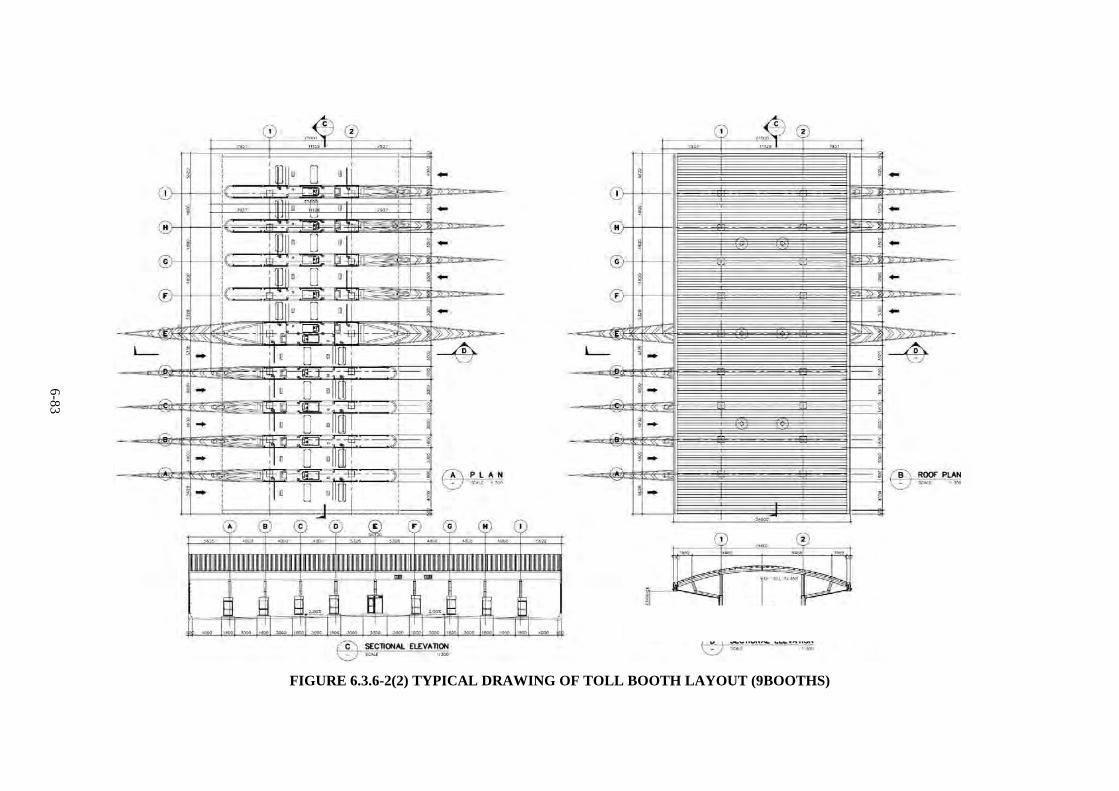
6-83
FIGURE 6.3.6-2(2) TYPICAL DRAWING OF TOLL BOOTH LAYOUT (9BOOTHS)

6-84
FIGURE 6.3.6-2(3) TYPICAL DRAWING OF TOLL BOOTH LAYOUT (3BOOTHS)
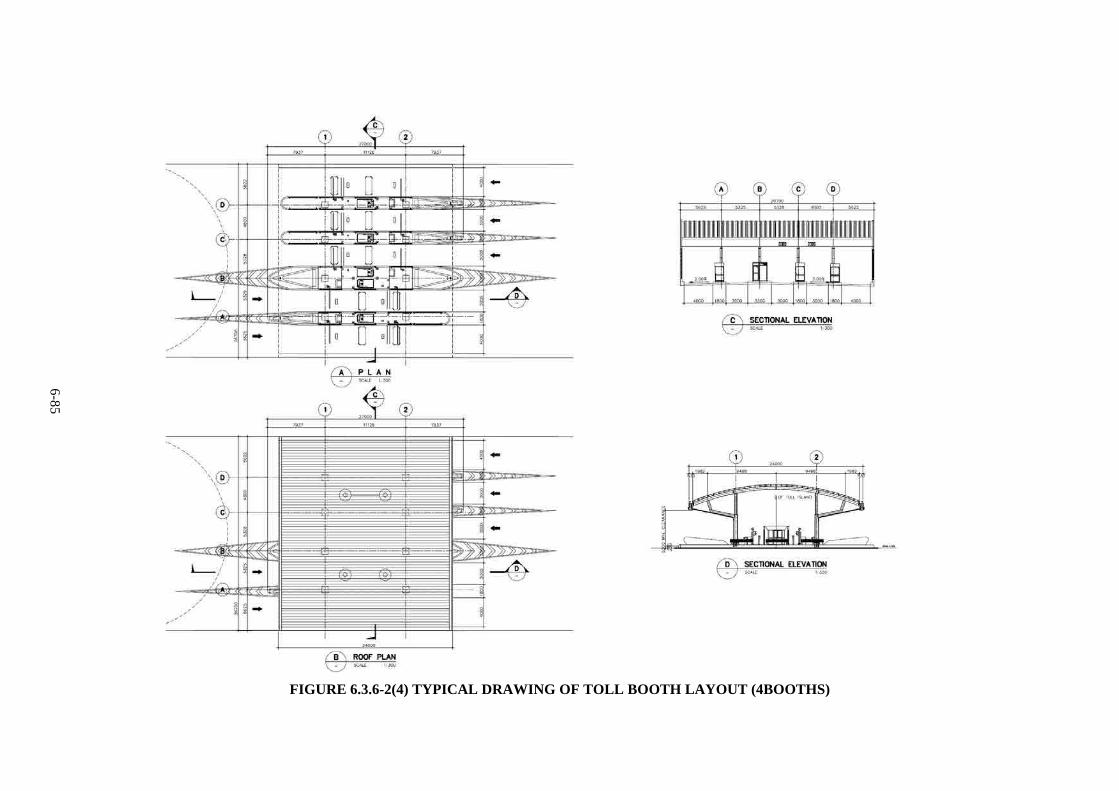
6-85
FIGURE 6.3.6-2(4) TYPICAL DRAWING OF TOLL BOOTH LAYOUT (4BOOTHS)

6-86
SCTEX
MA
TC
H L
INE
"A
"
M AT CH LINE "A"
M AT CH LINE "B"
MA
TC
H L
INE
"B
"
FIGURE 6.3.6-3 TARLAC JUNCTION

6-87
Ramp E
R amp F
∞
∞
∞
∞
∞
∞
∞ ∞
FIGURE 6.3.6-4 TARLAC INTERCHANGE AND TOLL BARRIER

6-88 ∞
∞
∞
∞
∞
∞
∞
∞
∞
∞
∞
Ramp A
Ra
mp
B
Ram
p D
Ram
p C
Mai
n R
amp
Quezon R
oad
FIGURE 6.3.6-5 ALIAGA INTERCHANGE

6-89
Ram
p A
Ram
p B
Main Ramp
CL
EX
∞ ∞
∞
∞
∞
∞
∞
FIGURE6.3.6-6 CABANATUAN BYPASS INTERCHANGE (1/2)

6-90
∞
∞
FIGURE 6.3.6-7 CABANATUAN BYPASS INTERCHANGE (2/2)

6-91
Ram
p A
Ra
mp B
Ma
in R
amp
Ramp DRamp C
(Phase II)
∞
∞
∞
∞
∞
∞
∞
∞
∞
∞
∞
∞
FIGURE 6.3.6-8 CABANATUAN INTERCHANGE

6-92
6.3.7 Interim 2 Lanes Design
(1) Design speed 100km/h ( same as 4 lane design)
(2) Cross sectional configuration Figure 6.3.7-1 illustrates the comparison of cross sectional configuration between 1st and 2nd stage. Bridge width for the 1st stage shall be 12m while 10.5m for the 2nd stage in order to take outer shoulder width of 2.5m.
12,000
2,500
3,5003,500
2,500
1st Stage(2 lanes)S=1: 200
FIGURE 6.3.7-1 CROSS SECTIONAL CONFIGURATION (1ST STAGE: 2 LANES)
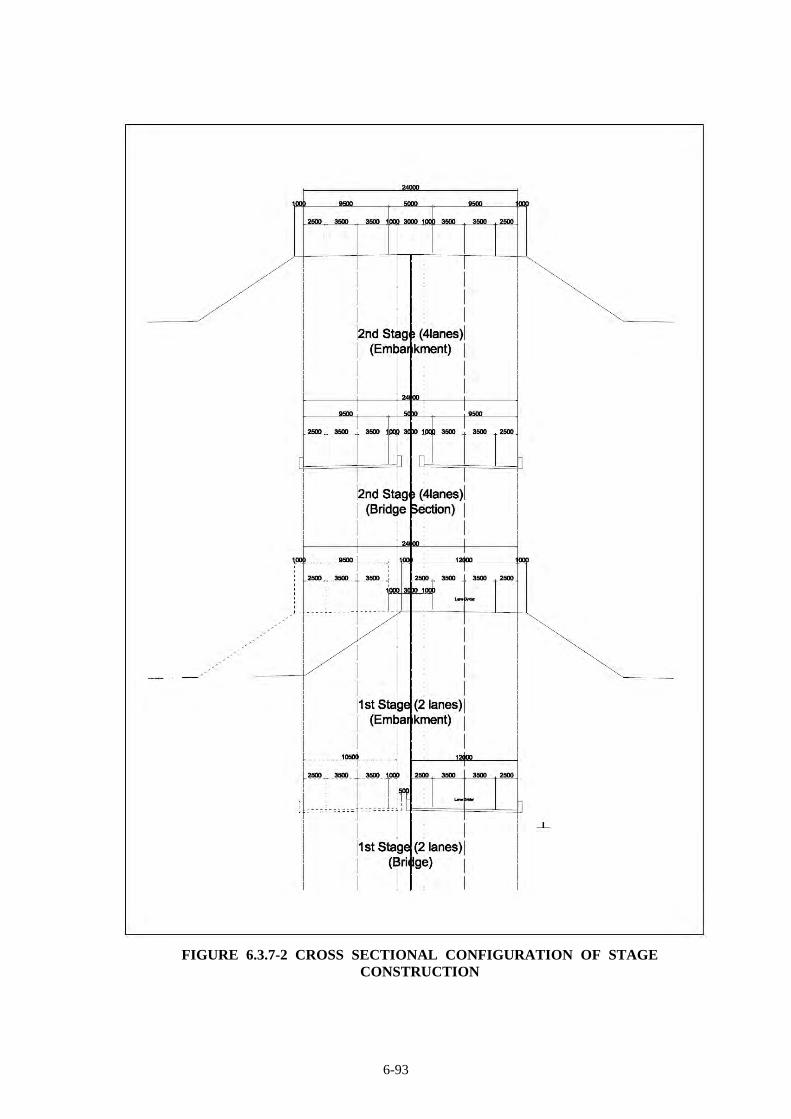
6-93
FIGURE 6.3.7-2 CROSS SECTIONAL CONFIGURATION OF STAGE CONSTRUCTION

6-94
(3) Lane divider for Initial Opening Section
In order to maintain safe and smooth traffic, it is recommended to install equipment to clarify the center line to the driver as shown in Figure 6.3.7-3.
FIGURE 6.3.7-3 SAMPLE OF LANE DIVIDER
(4) Additional Lane design criteria
1) Type of Additional Lane Provision In order to facilitate the traffic and maintain traffic safety in the interim 2 lane highway, it is essential to provide additional lane to accommodate with fast and slow vehicles. There would be two different types of way to provide additional lane, namely, climbing lane type or taking over lane type as shown in Figure 6.3.7-4. Taking over lane type is applied to the desing.
Climbing Lane Type
2lane Ad lane 2lane

6-95
Taking Over Lane Type
FIGURE 6.3.7-4 TYPE OF ADDITIONAL LANE PROVISION
2) Length of Additional Lane The effect of additional lane to facilitate the traffic is not seen if the length is less than 1 km according to experiment by NEXCO. The length in Table 6.3.7-1 is recommended in accordance with traffic volume.
Considering the traffic volume forecasted for CELEX, 1,000m of additional lane shall be adequate.
TABLE 6.3.7-1 ADEQUATE LENGTH OF ADDITIONAL LANE
Vertical gradient Traffic Volume(V/day)
Less than 2.5% 2.5% to 3.5% More than 3.5%
7,500 800 1,000 1,000 7500 to 12,500 1,000 1,000 1,200 12,500 to 17,500 1,000 1,000 1,200 17,500 to 22,500 1,000 1,200 1,500
3) Interval Distance of Additional Lane
It is recommended to provide additional lane of 15% to 30% (average 20%) of total stretch according to NEXCO design guide line. Considering also easiness for the drivers to recognize the traffic condition, Figure 6.3.7-5 is recommended for the additional lane provision. The design shall consider location of road facilities such as viaduct, interchange, bridges, and design additional lane layout.
FIGURE 6.3.7-5 RECOMMENDED ADDITIONAL LANE LAYOUT
Additional Lane
2lane 2laneAdditional Lane
Taper Taper

6-96
4) Taper Layout of Additional Lane
Taper length
Taper [email protected]/s lateral shift
Design speed 100km/h =27.78m/s
Shift width 3.5m
T=3.5/0.6=5.8s
L=27.78 x 5.8=161m → 180m
Shifting Length of Main Lane
Taper [email protected]/s lateral shift
Design speed 100km/h =27.78m/s
Shift width 12m
T=12/0.6=20s
L=27.78 x 20=555.6m → 560m
FIGURE 6.3.7-6 TAPER LAYOUT OF ADDITIONAL LANE
(5) Additional Lane Layout
Interim 2 lane layout is shown in Figure 6.3.7-7. Table 6.3.7-2 to 3 shows breakdown of sectional configuration.
TABLE 6.3.7-2 SUMMARY OF INTERIM 2 LANE DESIGN SECTIONAL CONFIGURATION
Embankment Section Type 2 lane 4 lane
Total Length Remark
2 lane interim section
19.1km 5.5km 24.5km (80%) Include lane shift section
4 lane ultimate section
6.2km 6.2km (20%) 20%
Total 19.1km 11.7km 30.7km
Lane shift 4 to 2 lanes Taper
2 lanes 4 lanes
560m 180m

6-97
TABLE 6.3.7-3 INTERIM 2 LANE DESIGN SECTIONAL CONFIGURATION
Remarks
Length No. of lanes Embankment0+0000+180 180.000 4 Ultimate IC
0+1800+280 100.000 4 Ultimate
0+860 580.000 2 Ultimate Lane Shift
1+540 680.000 2 Interim
2+100 560.000 2 Ultimate Lane Shift
2+190 90.000 4 Ultimate
2+293 103.000 4 Ultimate Toll Plaza
2+343 50.000 4 Ultimate Toll Plaza
2+500 157.000 4 Ultimate Toll Plaza
3+500 1,000.000 4 Ultimate
3+680 180.000 4 Ultimate Taper
3+6804+240 560.000 2 Ultimate Lane Shift
7+530 3,290.000 2 Interim
9+040 1,510.000 2 Interim Viaduct
9+600 560.000 2 Interim Lane Shift
9+6009+780 180.000 2 Ultimate Taper
11+280 1,500.000 4 Ultimate
11+460 180.000 4 Ultimate Taper
12+020 560.000 2 Ultimate Lane Shift
12+095 75.000 2 Interim
18+120 6,025.000 2 Interim
18+700 580.000 2 Ultimate Lane Shift
18+70018+880 160.000 2 Ultimate Taper
19+700 820.000 4 Ultimate Aliaga Interchange
20+520 820.000 4 Ultimate
20+700 180.000 2 Ultimate Taper
21+280 580.000 2 Ultimate Lane Shift
21+28024+490 3,210.000 2 Interim
25+070 580.000 2 Ultimate Lane Shift
25+07025+250 180.000 2 Ultimate Taper
26+250 1,000.000 4 Ultimate Cabanatuan Half IC
26+430 180.000 2 Ultimate
26+43027+010 580.000 2 Ultimate
30+330 3,320.000 2 Interim End of Main(Interim)
30+725 395.000 2 InterimCabantuan IC MainRamp
Station Section Type

6-98
FIGURE 6.3.7-7 SCHEMATIC DIAGRAM FOR INTERIM 2 LANE DESIGN

6-99
6.4 STRUCTURE DESIGN
6.4.1 Structure Design Standard
(1) General
The Structure Design Standard shall be in accordance with the following codes and guidelines: AASHTO Standard Specifications for Highway Bridges 17th edition 2002,
DESIGN Guidelines Criteria and Standard for Department of Public Works And Highways,
Basic Specifications – DPWH Standard Specifications 2004, Highways, Bridges and Airports
Alternatively, Japanese Standards also will be adopted as the structure design standards.
(2) Loading Specifications
Structure shall be designed to carry the following loads and forces: 1) Dead Load
2) Live Load
Live Load shall be MS18 (HS-20-44)
3) Impact Load
I = 15.24/(L+38)
4) Sidewalk Live Load
4.07 KPa of sidewalk area
5) Earthquake Load
A = 0.4g, SPC D
6) Earth Pressure
Coulomb’s Formula
7) Wind Load
For the Superstructure design, 2,394Pa of wind load shall be applied horizontally at right angle
to the longitudinal axis of girders and beams.
8) Thermal Forces
The range of temperature shall be as follows:
17.8 °C to 48.9 °C
16.7 °C temperature rise
22.2 °C temperature fall
(3) Seismic Design
Seismic Design shall be in accordance with AASHTO Standard Specifications Division I-A. Acceleration coefficient of 0.4g shall be adopted to consider importance classification and past/recent experience in the Philippines.
6-100
(4) Superstructure
1) Bridge Type The following bridge types shall be adopted depending on the span length, economy, and sight conditions: a) Simple span pre-stressed concrete AASHTO I-Girders with continuous concrete deck
slab every three or four spans. b) Simple/multi span reinforced concrete deck girder. Deck discontinuity such as expansion joints shall be kept to minimum in accordance to the DPWH Design Advisory.
2) Expansion Joint The following types of expansion joints shall be adopted depending on the bridge type and movement. a) Hot poured joint sealer with angles type, b) Closed cell elastomeric sealer made of Neoprene type.
3) Bridge Drainage Catch basins shall be made of cast iron and PVC drainpipes shall be used for bridge surface drainage system.
4) Bearings Shoe Elastomeric bearing pad shall be used for pre-stressed concrete girder supports.
5) Bridge Pavement Asphalt concrete pavement with 5 cm thickness shall be laid on concrete deck slab.
6) Construction Force and Effect Forces and Effects developed during construction shall be considered in design.
(5) Substructure and Foundation
1) The following type of pier shall be adopted in accordance to the site conditions and restrictions. a) Reinforced concrete column with pier-head type pier, b) Reinforced concrete hammerhead type pier. Pile bent-type shall be allowed for ramps and multi column type pier.
2) Depth of Footing Footings shall be embedded into the ground at least 1.0 meter from ground surface to the top of footing, and at least 2.0 meters from the river bed in the river. The effect of buoyancy on the structure shall be verified.
3) Foundation Type In accordance to the result of the sub-surface soil investigation, constraints factors during construction and others if any, the following types of foundation shall be selected;
a) Spread footing type,
b) Cast in place concrete pile (1.2m to 2.0m diameter of piles will be adopted).
(6) Materials
All materials to be used in the project shall be conformed to DPWH Standard Specifications (2004), and AASHTO Code. 1) Concrete
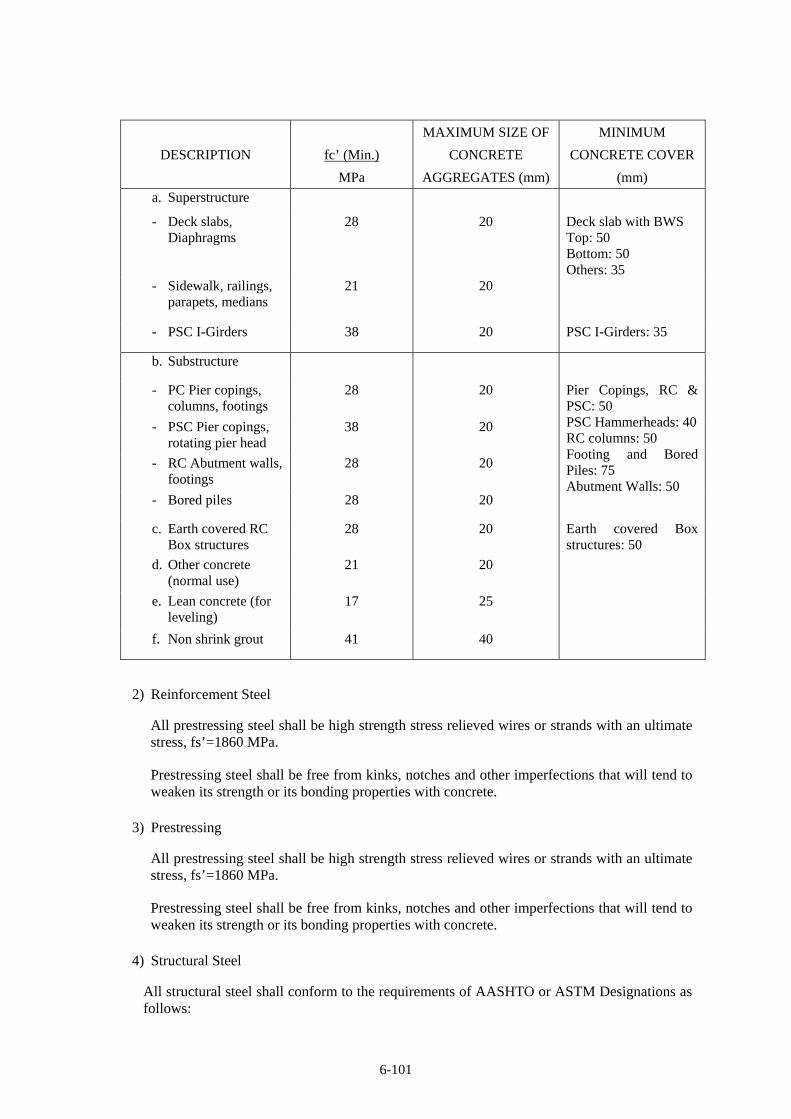
6-101
DESCRIPTION
fc’ (Min.)
MPa
MAXIMUM SIZE OF
CONCRETE
AGGREGATES (mm)
MINIMUM
CONCRETE COVER
(mm)
a. Superstructure
- Deck slabs, Diaphragms
28 20 Deck slab with BWS Top: 50 Bottom: 50 Others: 35
- Sidewalk, railings, parapets, medians
21 20
- PSC I-Girders 38 20 PSC I-Girders: 35
b. Substructure
- PC Pier copings, columns, footings
28 20
- PSC Pier copings, rotating pier head
38 20
- RC Abutment walls, footings
28 20
- Bored piles 28 20
Pier Copings, RC & PSC: 50 PSC Hammerheads: 40RC columns: 50 Footing and Bored Piles: 75 Abutment Walls: 50
c. Earth covered RC Box structures
28 20 Earth covered Box structures: 50
d. Other concrete (normal use)
21 20
e. Lean concrete (for leveling)
17 25
f. Non shrink grout 41 40
2) Reinforcement Steel
All prestressing steel shall be high strength stress relieved wires or strands with an ultimate stress, fs’=1860 MPa.
Prestressing steel shall be free from kinks, notches and other imperfections that will tend to weaken its strength or its bonding properties with concrete.
3) Prestressing
All prestressing steel shall be high strength stress relieved wires or strands with an ultimate stress, fs’=1860 MPa.
Prestressing steel shall be free from kinks, notches and other imperfections that will tend to weaken its strength or its bonding properties with concrete.
4) Structural Steel
All structural steel shall conform to the requirements of AASHTO or ASTM Designations as follows:
6-102
a) Structural Steel Shapes - AASHTO M 270 (ASTM A 36) Gr 36 and (ASTM A572) Gr 50.
b) Steel Sheet Pile - AASHTO M 202 (ASTM A 328)
c) Bridge Bearing - AASHTO M 270 (ASTM A 36) AASHTO M 106 (ASTM B 100)
AASHTO M 103 (ASTM A 27) (Copper Alloy Bearing Expansion Plates Grade 70 – 36 of
Steel and Sheets)
d) Deck Drain - AASHTO M 105 (ASTM A 46) Class No. 30 (Gray Iron Casting)
e) Bridge Railing - Sch. 40 Galvanized Steel Pipe
5) Elastomeric Bearing Pads
Elastomeric bearing pads shall be 100% virgin chloroprene (neoprene) pads with durometer hardness 60. Unless otherwise specified in the plans, bearing pads shall be laminated type bearing pads consisting of layer of elastomer, restrained at their interfaces by bonded laminations are required on the plans, laminated plate shall be non-corrosive mild steel sheet.
6) Joint Filler
Joint filler, hot poured elastic type, used for expansion joint shall conform to AASHTO M 213.
7) Bituminous Wearing Course
Bituminous wearing course to be used as surface overlay shall conform to the requirements of DPWH Standard Item 307 with minimum dry compressive strength of 1.4 MPa (200 pal). The wearing course may be used to adjust elevations on the vertical grade by varying the thickness from 50mm (min.) to 75mm (max).
6.4.2 Structure Type Study
Structure Location Map in CLLEX is shown in FIGURE 6.4.2-1. Nine (9) bridges and seventy eight (78) reinforced concrete box culverts (RCBC) were proposed along or crossing to the main expressway.
In bridge structure, seven (7) expressway bridges including a long bridge – Rio Chico River crossing bridge with 1,505m length and two (2) bridges crossover to the main expressway are studied.
RCBC structure was planned as the crossing under the main expressway, based on the following three (3) purposes;
a. Road crossing – for IC ramp, national road, provincial road, municipality road, farm road,
b. River and Irrigation crossing – for small discharged natural creek and irrigation canal, and,
c. Equalizing – for Rio Chico River flooding control.
(1) General
The general features of bridges are described as follows;
6-103
1) AASHTO Girder
AASHTO Girder, prestressed concrete I-section girder, is selected because it is the most economical and widely used in the Philippines. Erection of the girder during construction will not affect to the at-greade traffic.
The bridge span ranged between 25 and 35 m in length are applied in the design.
2) DPWH Standard Bridge – RCDG
DPWH standardized Reinforced Concrete Deck Girder, RCDG is adopted the bridge span raged up to 24m in length.
3) Single/Multi Column type Pier
Single or multi column with pier-head type pier is applied. The column section is adopted cylindrical or circular shape, especially in the river area to minimize the streaming inhibition. This shape can also provide well environmentally harminalzing perspective view of the bridge.
4) Reversed T-shape Abutment
The abutment height ranges between 10 to 12m. “the reversed T shape type” is applied which is most common type in the height range. This type for the height could be stable and minimizes the construciton cost.
5) Bored Pile Foundation
Bored pile foundation was designed because the hard stratum (assumed bearing strata) exists deeper than 8m (deepest is more than 24m) in the Project area based on the soil survey results. The pile diameter was adopted ranges between 1.2m and 2.0m.
6) RCBC
DPWH Standard RCBC was adopted for the most of the crossing structure. Japanese Standard was also reffered for the size which is not corresponding to DPWH standard.
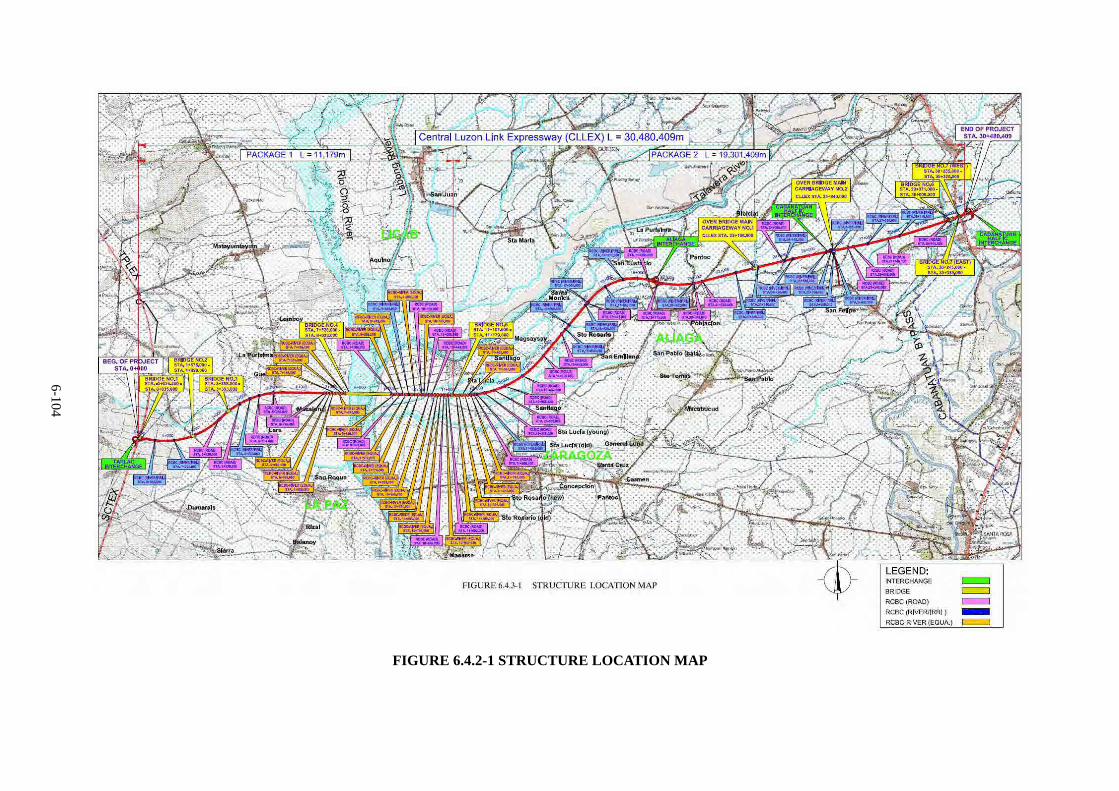
6-104
FIGURE 6.4.2-1 STRUCTURE LOCATION MAP
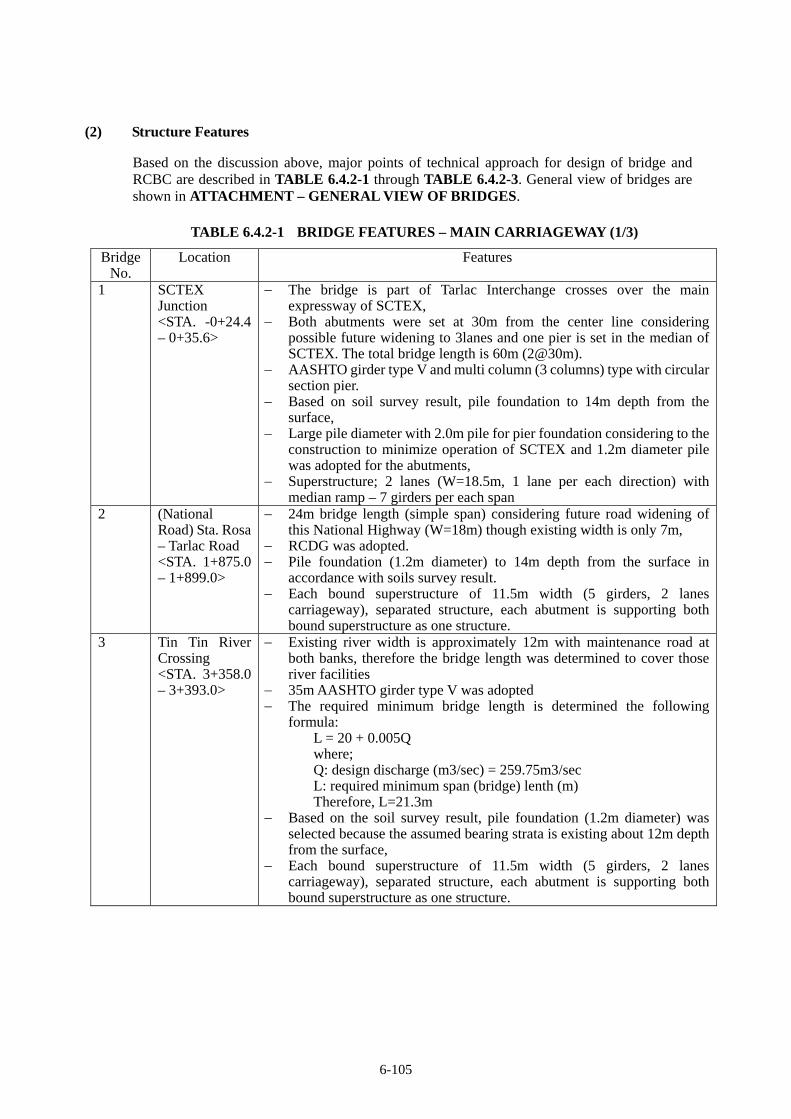
6-105
(2) Structure Features
Based on the discussion above, major points of technical approach for design of bridge and RCBC are described in TABLE 6.4.2-1 through TABLE 6.4.2-3. General view of bridges are shown in ATTACHMENT – GENERAL VIEW OF BRIDGES.
TABLE 6.4.2-1 BRIDGE FEATURES – MAIN CARRIAGEWAY (1/3)
Bridge No.
Location Features
1 SCTEX Junction <STA. -0+24.4 – 0+35.6>
The bridge is part of Tarlac Interchange crosses over the main expressway of SCTEX,
Both abutments were set at 30m from the center line considering possible future widening to 3lanes and one pier is set in the median of SCTEX. The total bridge length is 60m (2@30m).
AASHTO girder type V and multi column (3 columns) type with circular section pier.
Based on soil survey result, pile foundation to 14m depth from the surface,
Large pile diameter with 2.0m pile for pier foundation considering to the construction to minimize operation of SCTEX and 1.2m diameter pile was adopted for the abutments,
Superstructure; 2 lanes (W=18.5m, 1 lane per each direction) with median ramp – 7 girders per each span
2 (National Road) Sta. Rosa – Tarlac Road <STA. 1+875.0 – 1+899.0>
24m bridge length (simple span) considering future road widening of this National Highway (W=18m) though existing width is only 7m,
RCDG was adopted. Pile foundation (1.2m diameter) to 14m depth from the surface in
accordance with soils survey result. Each bound superstructure of 11.5m width (5 girders, 2 lanes
carriageway), separated structure, each abutment is supporting both bound superstructure as one structure.
3 Tin Tin River Crossing <STA. 3+358.0 – 3+393.0>
Existing river width is approximately 12m with maintenance road at both banks, therefore the bridge length was determined to cover those river facilities
35m AASHTO girder type V was adopted The required minimum bridge length is determined the following
formula: L = 20 + 0.005Q where; Q: design discharge (m3/sec) = 259.75m3/sec L: required minimum span (bridge) lenth (m) Therefore, L=21.3m Based on the soil survey result, pile foundation (1.2m diameter) was
selected because the assumed bearing strata is existing about 12m depth from the surface,
Each bound superstructure of 11.5m width (5 girders, 2 lanes carriageway), separated structure, each abutment is supporting both bound superstructure as one structure.
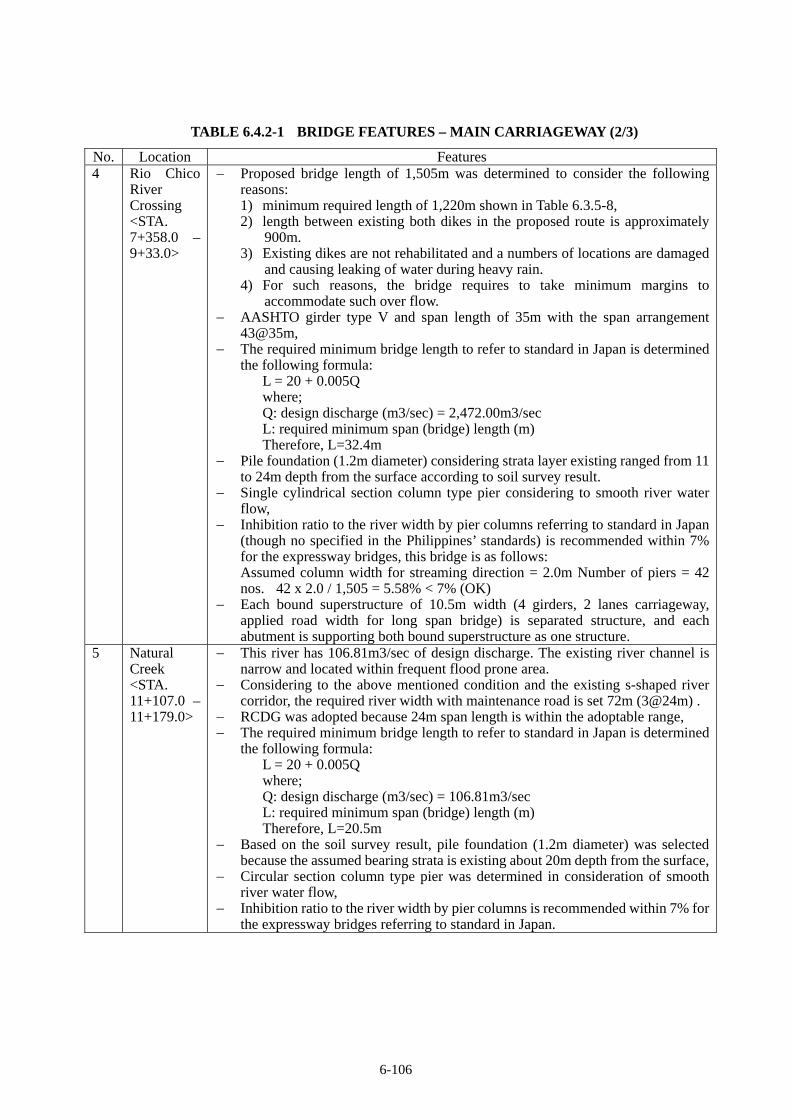
6-106
TABLE 6.4.2-1 BRIDGE FEATURES – MAIN CARRIAGEWAY (2/3)
No. Location Features 4 Rio Chico
River Crossing <STA. 7+358.0 – 9+33.0>
Proposed bridge length of 1,505m was determined to consider the following reasons: 1) minimum required length of 1,220m shown in Table 6.3.5-8, 2) length between existing both dikes in the proposed route is approximately
900m. 3) Existing dikes are not rehabilitated and a numbers of locations are damaged
and causing leaking of water during heavy rain. 4) For such reasons, the bridge requires to take minimum margins to
accommodate such over flow. AASHTO girder type V and span length of 35m with the span arrangement
43@35m, The required minimum bridge length to refer to standard in Japan is determined
the following formula: L = 20 + 0.005Q where; Q: design discharge (m3/sec) = 2,472.00m3/sec L: required minimum span (bridge) length (m) Therefore, L=32.4m Pile foundation (1.2m diameter) considering strata layer existing ranged from 11
to 24m depth from the surface according to soil survey result. Single cylindrical section column type pier considering to smooth river water
flow, Inhibition ratio to the river width by pier columns referring to standard in Japan
(though no specified in the Philippines’ standards) is recommended within 7% for the expressway bridges, this bridge is as follows: Assumed column width for streaming direction = 2.0m Number of piers = 42 nos. 42 x 2.0 / 1,505 = 5.58% < 7% (OK)
Each bound superstructure of 10.5m width (4 girders, 2 lanes carriageway, applied road width for long span bridge) is separated structure, and each abutment is supporting both bound superstructure as one structure.
5 Natural Creek <STA. 11+107.0 – 11+179.0>
This river has 106.81m3/sec of design discharge. The existing river channel is narrow and located within frequent flood prone area.
Considering to the above mentioned condition and the existing s-shaped river corridor, the required river width with maintenance road is set 72m (3@24m) .
RCDG was adopted because 24m span length is within the adoptable range, The required minimum bridge length to refer to standard in Japan is determined
the following formula: L = 20 + 0.005Q where; Q: design discharge (m3/sec) = 106.81m3/sec L: required minimum span (bridge) length (m) Therefore, L=20.5m Based on the soil survey result, pile foundation (1.2m diameter) was selected
because the assumed bearing strata is existing about 20m depth from the surface, Circular section column type pier was determined in consideration of smooth
river water flow, Inhibition ratio to the river width by pier columns is recommended within 7% for
the expressway bridges referring to standard in Japan.

6-107
TABLE 6.4.2-1 BRIDGE FEATURES – MAIN CARRIAGEWAY (3/3)
No. Location Features 5 Natural
Creek <STA. 11+107.0 – 11+179.0>
The verification result for this bridge is as follows: Assumed column width for streaming direction = 1.8m Number of piers = 2 nos. x 1.8 / 72 = 5.0% < 7% (OK)
Each bound superstructure of 11.5m width (5 girders, 2 lanes carriageway) is separated structure, and each abutment is supporting both bound superstructure as one structure.
6 Natural Creek <STA. 29+971.0 – 30+6.0>
River width is only 10 to 12m with maintenance road at both banks, therefore the bridge length was determined to cover those river facilities – 35m AASHTO girder type V was adopted,
The required minimum bridge length to refer to standard in Japan is determined the following formula:
L = 20 + 0.005Q where; Q: design discharge (m3/sec) = 139.48m3/sec L: required minimum span (bridge) length (m) Therefore, L=20.7m Based on the soil survey result, pile foundation (1.2m diameter) was selected
because the assumed bearing strata is existing about 8m depth from the surface, Each bound superstructure of 11.5m width (5 girders, 2 lanes carriageway) is
separated structure, and each abutment is supporting both bound superstructure as one structure.
7 (Local Road) Cabanatuan Bypass and (National Road) Pan Philippines Highway
This bridge is located above the two roads – the Cabanatuan Bypass and the Pan Philippines Highway at intersection with sharp angle. Due to these aspects, east and west bound bridge length and the span arrangement are designed separately.
85m bridge length (span:30+25+30m) for east bound and 70m length (span:35+35m) for west bound, AASHTO girder type V were planned,
Based on the soil survey result, pile foundation (1.2m diameter) was selected because the assumed bearing strata is existing about 8m depth from the surface,
East bound superstructure of 11.5m width (5 girders, 2 lanes carriageway) and west bound of 15.0m width (6 girders, 3 lanes carriageway) are separated structure, and the each abutment is also individually planned.
TABLE 6.4.2-2 BRIDGE FEATURES – CROSSOVER BRIDGE FOR MAIN EXPRESSWAY No. Location Features 8 CLLEX
<STA. 23+108.0>
- Municipality road is crossing over to the CLLEX, the road width is 8m (2 lanes), - Both abutments were set at the CLLEX ROW limit and a pier was set in the median, therefore total bridge length of 60m (2@30m) was proposed, - AASHTO girder type V (3 nos. per each span) and single column type with circular section pier was determined, - Based on soil survey result, pile foundation was selected because the assumed bearing strata is existing about 12m depth from the surface,
9 CLLEX <STA. 25+840.0>
- Ramp A of Cabanatuan half IC is crossing over to the CLLEX, the road width is 9m (widened 1 lane), - Both abutments were set at the CLLEX ROW limit and a pier was set in the median, therefore total bridge length of 60m (2@30m) was proposed, - AASHTO girder type V (4 nos. per each span) and multi column (2 columns) type with circular section pier was determined, - Based on soil survey result, pile foundation was selected because the assumed bearing strata is existing about 12m depth from the surface,

6-108
TABLE 6.4.2-3 RCBC FEATURES No. Crossing Object Features 1 Road or Road
with Irrigation/ River
RCBC for road is considered the following points and proposed 10 types. Typical cross section is shown on FIGURE 6.4.2-2: o Crossing road categories – inner dimension is in accordance with the
crossing road type; CLLEX Ramp, National Road, Provincial Road, Municipality Road, Farm Road, Barangay Road,
o 2) With River/Irrigation – RCBC are provided to all major irrigation canals . Some minor canals are integrated into one.
2 River or Irrigation
DPWH Standard type of RCBC was referred and 10 types were proposed. Typical cross section is shown on FIGURE 6.4.2-3,
Only minor river and all irrigation canal were applied by RCBC. 3 Equalizing Zone
for Rio Chico River
As mentioned Chapter 6.3.5, inner dimension of (3m x 3m) RCBC and every 100m was proposed in the flood prone area of the Rio Chico River,
27 locations provided, This could be utilized as the farm road.
RCBC for Road Type
FIGURE 6.4.2-2 RCBC FOR ROAD FIGURE 6.4.2-3 RCBC FOR RIVER AND IRRIGATION
RCBC for Road with River/Irrigation Type

6-109
ATTACHMENT – GENERAL VIEW OF BRIDGES
No. Bridge Name Station Drawing No.
1 Ramp Bridge – SCTEX Junction 0+000.0 H-01
2 Sta. Rosa – Tarlac Road Crossing Bridge 1+887.0 H-02
3 Tin Tin River Crossing Bridge 3+375.5 H-03
4 Rio Chico River Crossing Bridge 8+280.5 H-04 – H-09
5 River (Natural River) Crossing Bridge 11+143.0 H-16
6 River (Natural River) Crossing Bridge 29+988.5 H-17
7 Cabanatuan Bypass, Pan-Philippine Highway Crossing Bridge 30+289.0 H-19, H-20
8 Crossover Bridge to CLLEX Main Carriageway 23+108.0 H-22
9 Crossover Bridge to CLLEX Main Carriageway 25+840.0 H-23

6-110

6-111

6-112
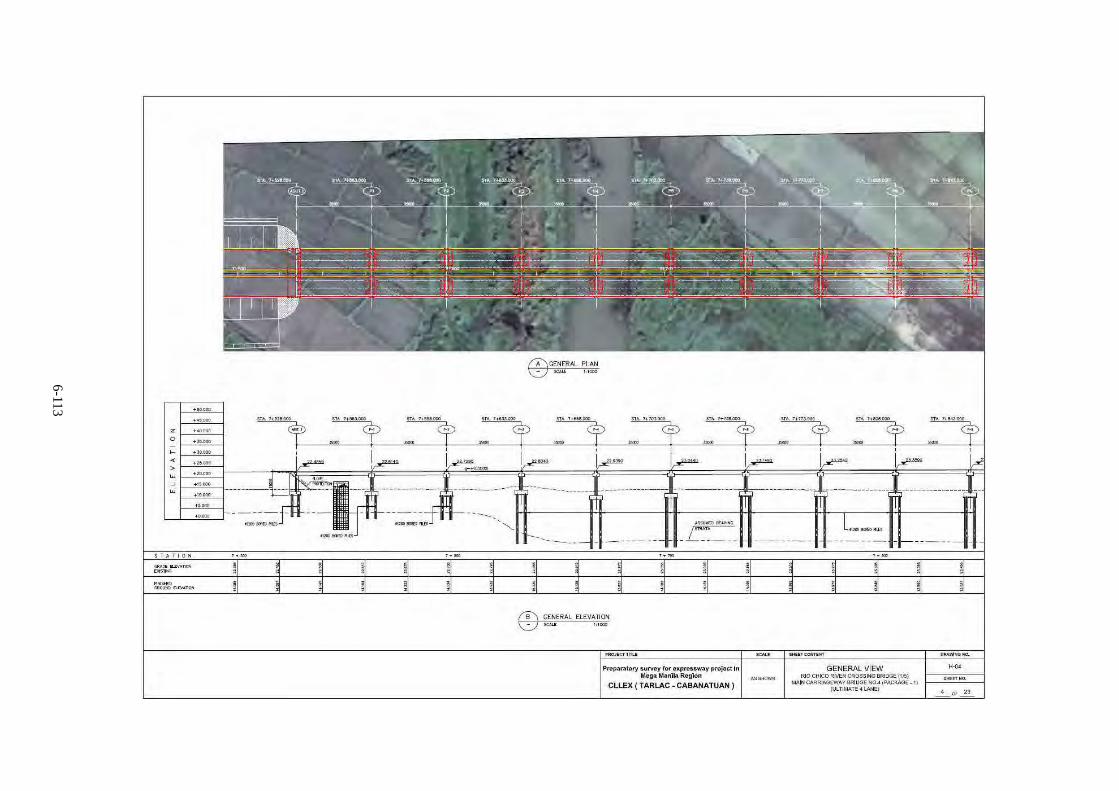
6-113
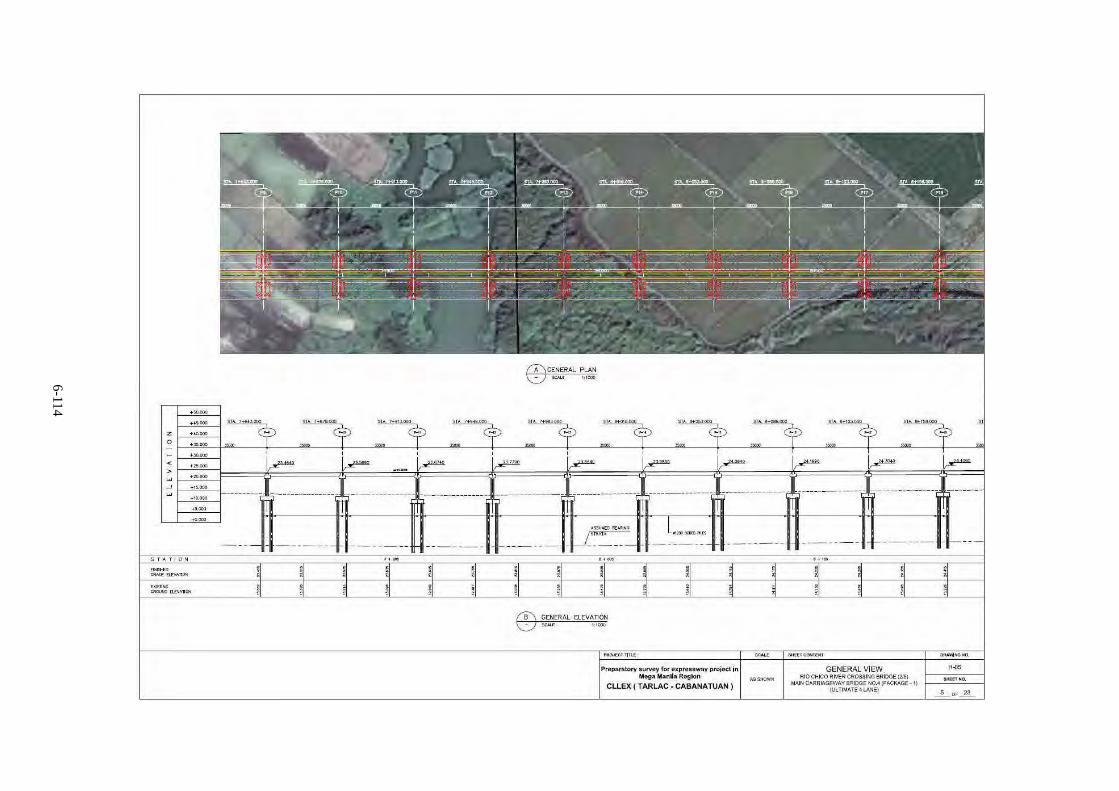
6-114
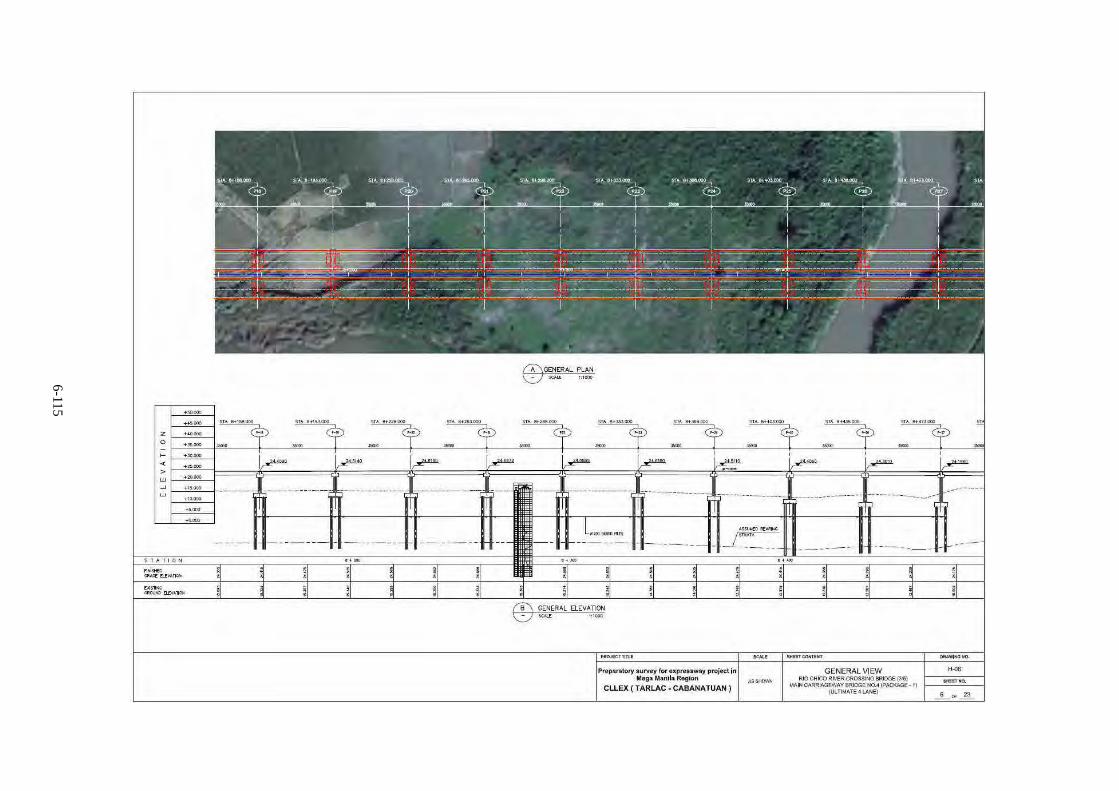
6-115

6-116

6-117
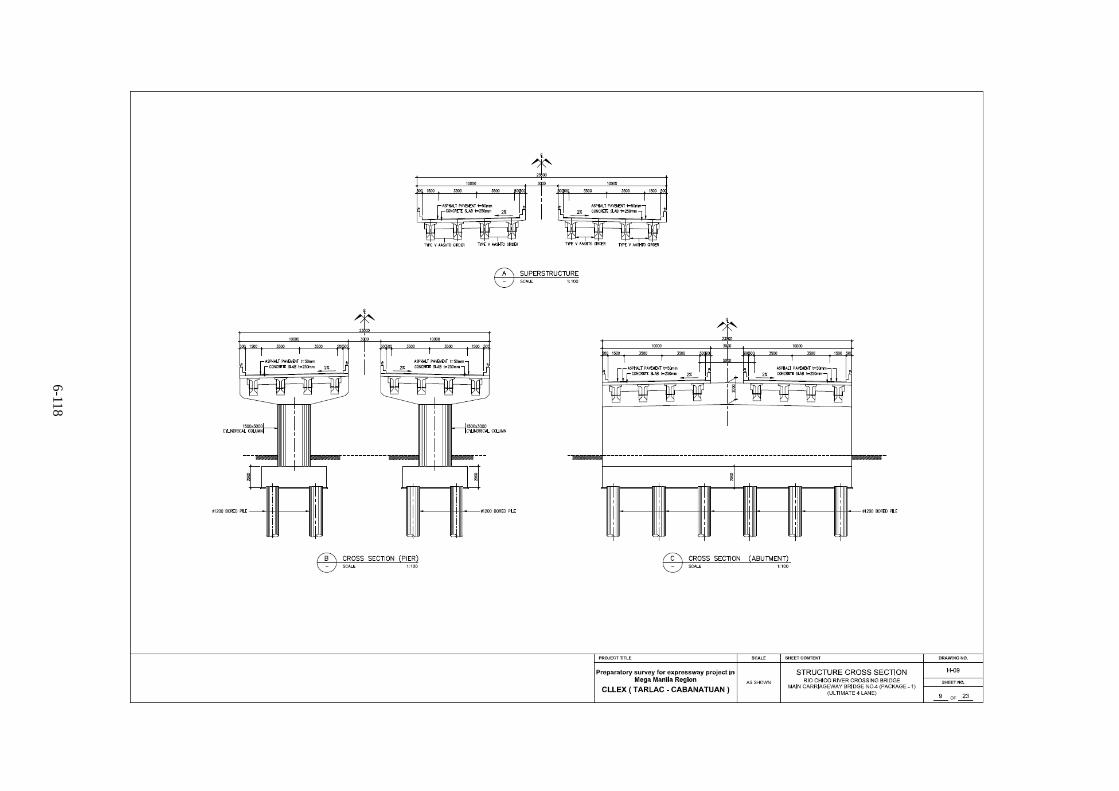
6-118
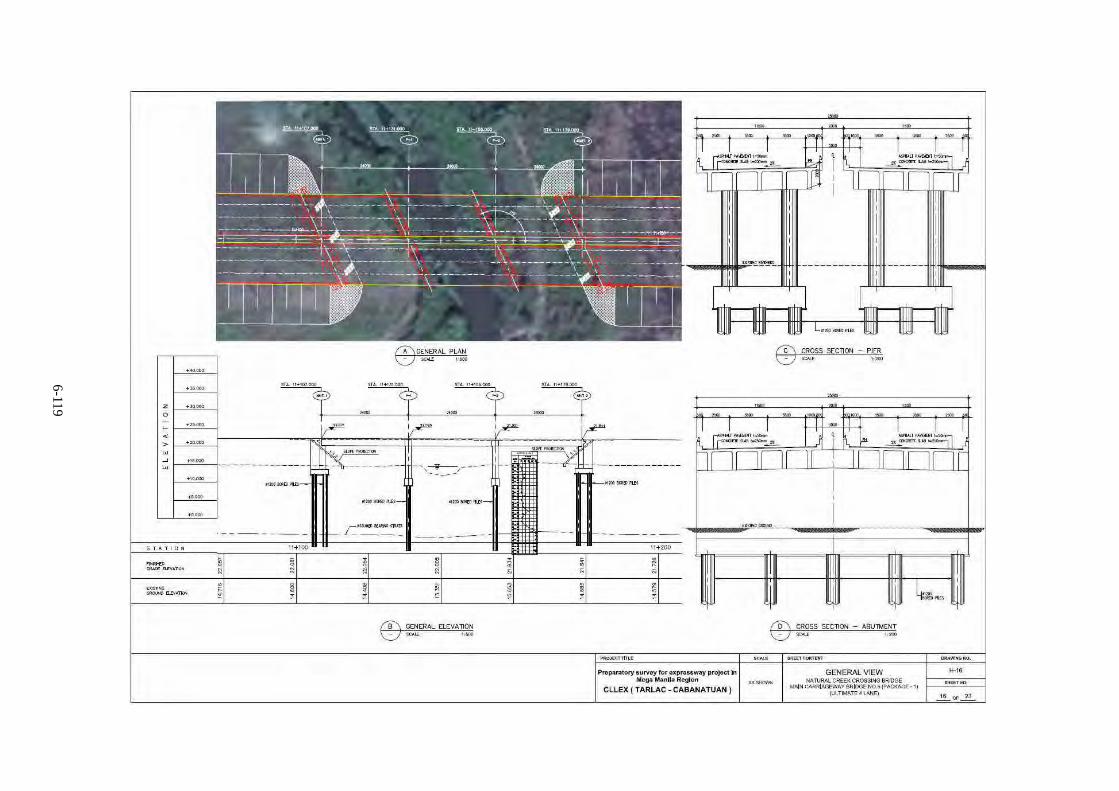
6-119

6-120

6-121
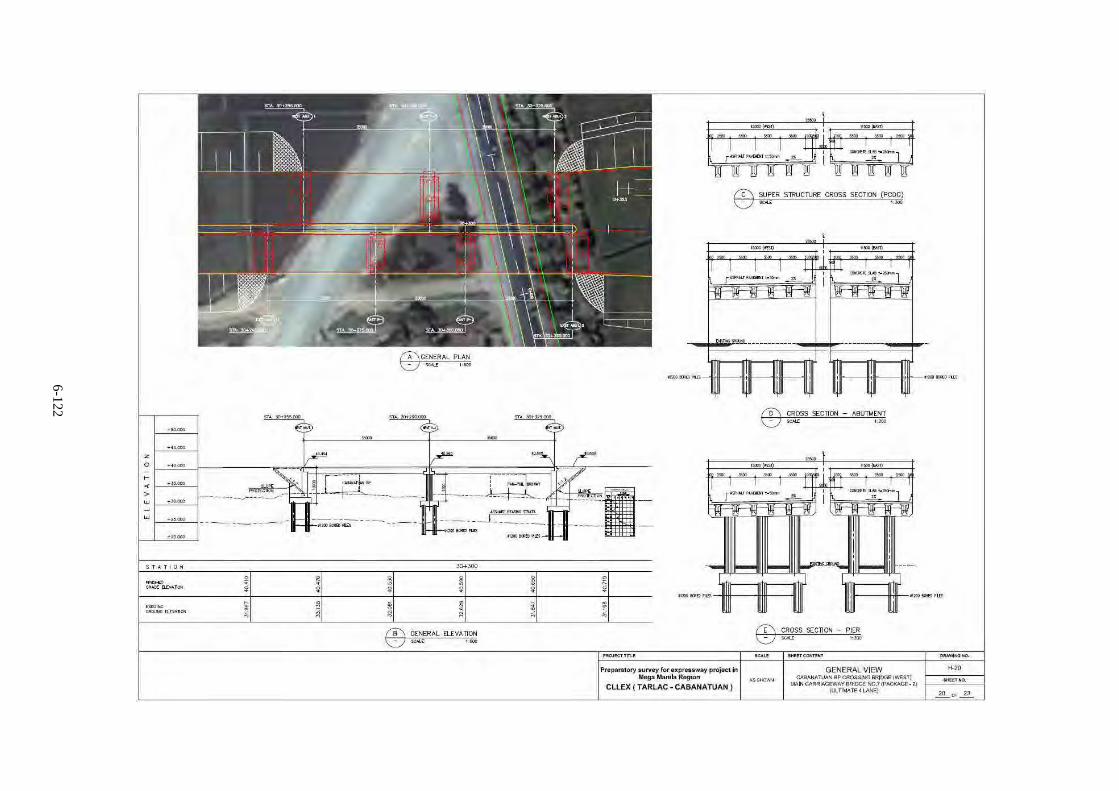
6-122

6-123

6-124
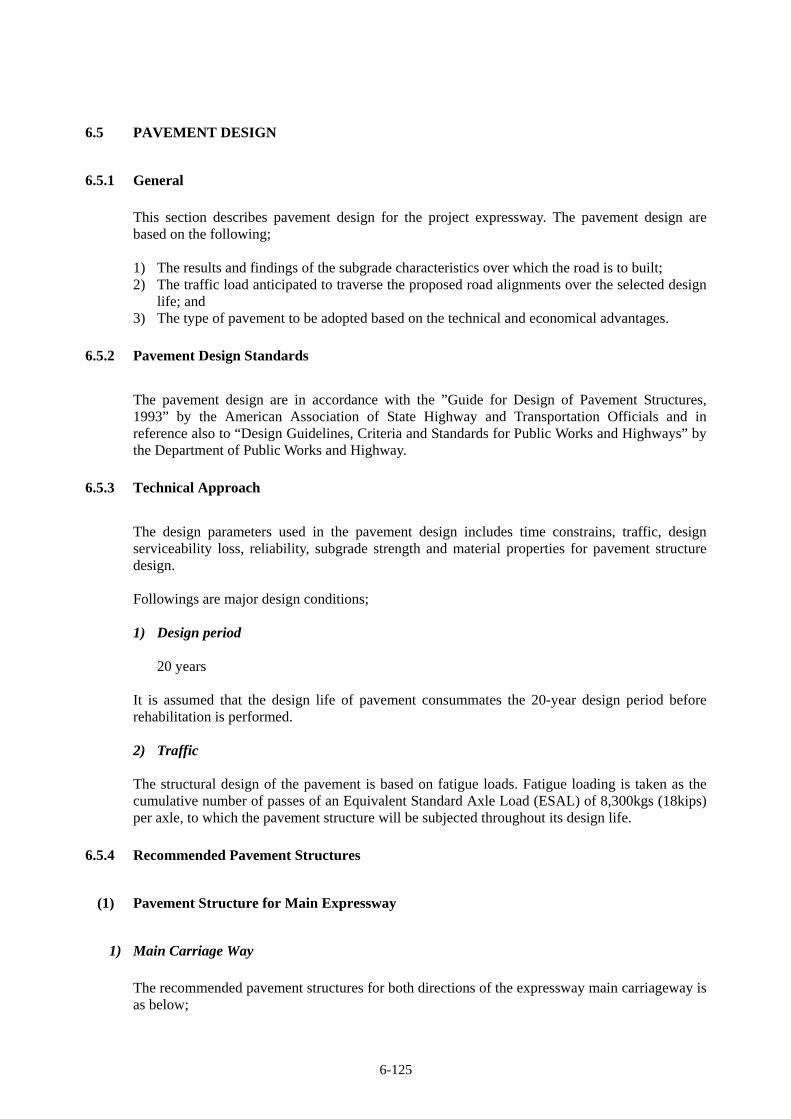
6-125
6.5 PAVEMENT DESIGN
6.5.1 General
This section describes pavement design for the project expressway. The pavement design are based on the following;
1) The results and findings of the subgrade characteristics over which the road is to built; 2) The traffic load anticipated to traverse the proposed road alignments over the selected design
life; and 3) The type of pavement to be adopted based on the technical and economical advantages.
6.5.2 Pavement Design Standards
The pavement design are in accordance with the ”Guide for Design of Pavement Structures, 1993” by the American Association of State Highway and Transportation Officials and in reference also to “Design Guidelines, Criteria and Standards for Public Works and Highways” by the Department of Public Works and Highway.
6.5.3 Technical Approach
The design parameters used in the pavement design includes time constrains, traffic, design serviceability loss, reliability, subgrade strength and material properties for pavement structure design.
Followings are major design conditions;
1) Design period
20 years
It is assumed that the design life of pavement consummates the 20-year design period before rehabilitation is performed.
2) Traffic
The structural design of the pavement is based on fatigue loads. Fatigue loading is taken as the cumulative number of passes of an Equivalent Standard Axle Load (ESAL) of 8,300kgs (18kips) per axle, to which the pavement structure will be subjected throughout its design life.
6.5.4 Recommended Pavement Structures
(1) Pavement Structure for Main Expressway
1) Main Carriage Way
The recommended pavement structures for both directions of the expressway main carriageway is as below;

6-126
No. Thickness Pavement Structure 1 50 mm Asphalt Concrete Surface Course 2 50 mm Asphalt Concrete Binder Course 3 150 mm Cement Treated Base Course 4 250 mm Crushed Aggregate Base Course 5 350 mm Crushed Sub-Base Course
FIGURE 6.5.4-1 PAVEMENT STRUCTURE OF MAIN CARRIAGEWAY
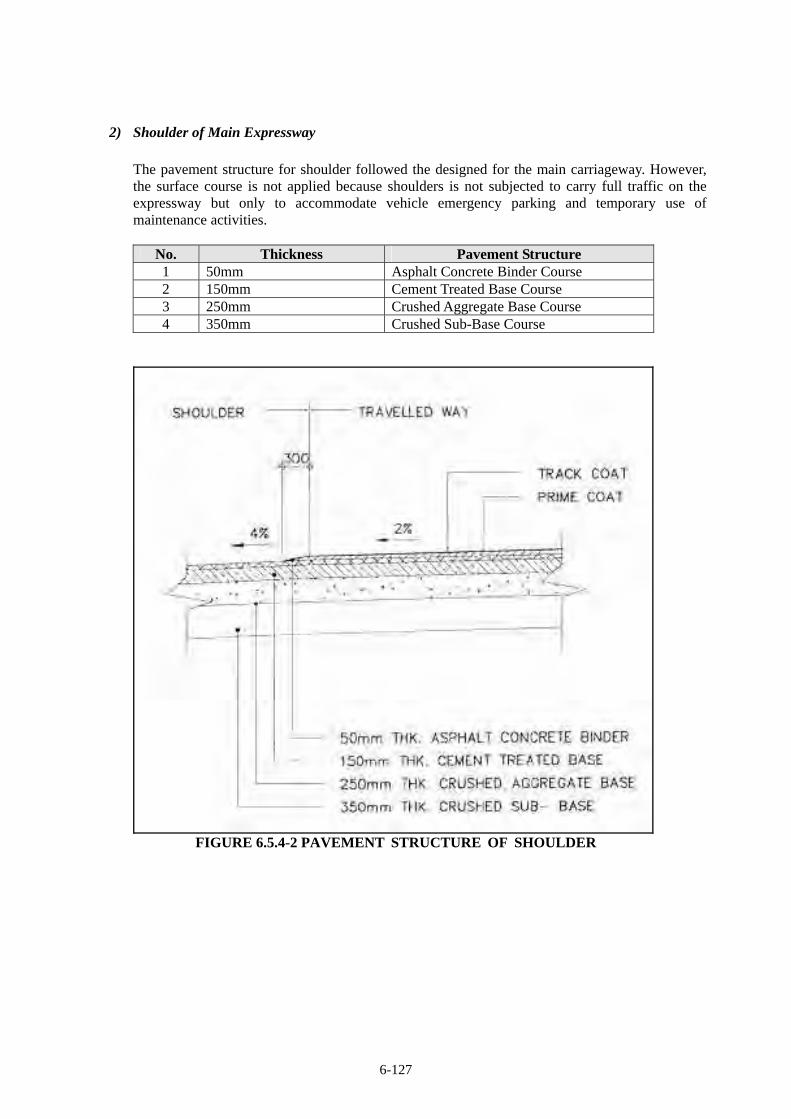
6-127
2) Shoulder of Main Expressway
The pavement structure for shoulder followed the designed for the main carriageway. However, the surface course is not applied because shoulders is not subjected to carry full traffic on the expressway but only to accommodate vehicle emergency parking and temporary use of maintenance activities.
No. Thickness Pavement Structure 1 50mm Asphalt Concrete Binder Course 2 150mm Cement Treated Base Course 3 250mm Crushed Aggregate Base Course 4 350mm Crushed Sub-Base Course
FIGURE 6.5.4-2 PAVEMENT STRUCTURE OF SHOULDER
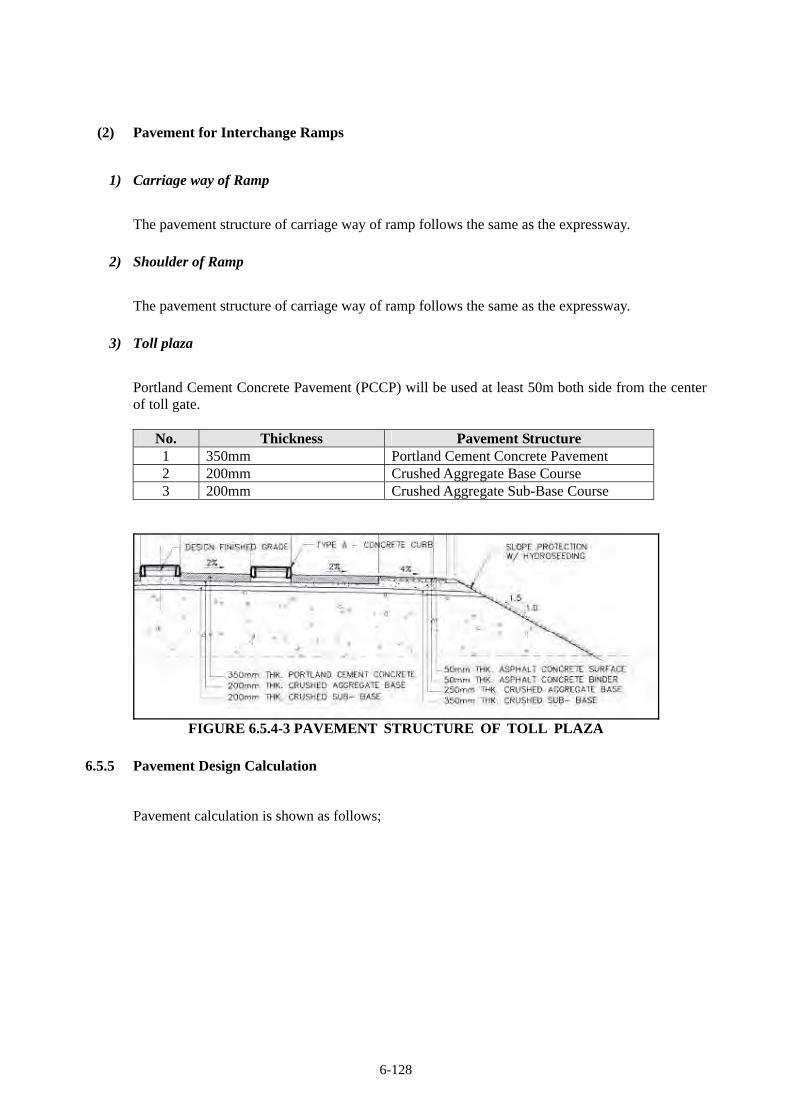
6-128
(2) Pavement for Interchange Ramps
1) Carriage way of Ramp
The pavement structure of carriage way of ramp follows the same as the expressway.
2) Shoulder of Ramp
The pavement structure of carriage way of ramp follows the same as the expressway.
3) Toll plaza
Portland Cement Concrete Pavement (PCCP) will be used at least 50m both side from the center of toll gate.
No. Thickness Pavement Structure 1 350mm Portland Cement Concrete Pavement 2 200mm Crushed Aggregate Base Course 3 200mm Crushed Aggregate Sub-Base Course
FIGURE 6.5.4-3 PAVEMENT STRUCTURE OF TOLL PLAZA
6.5.5 Pavement Design Calculation
Pavement calculation is shown as follows;
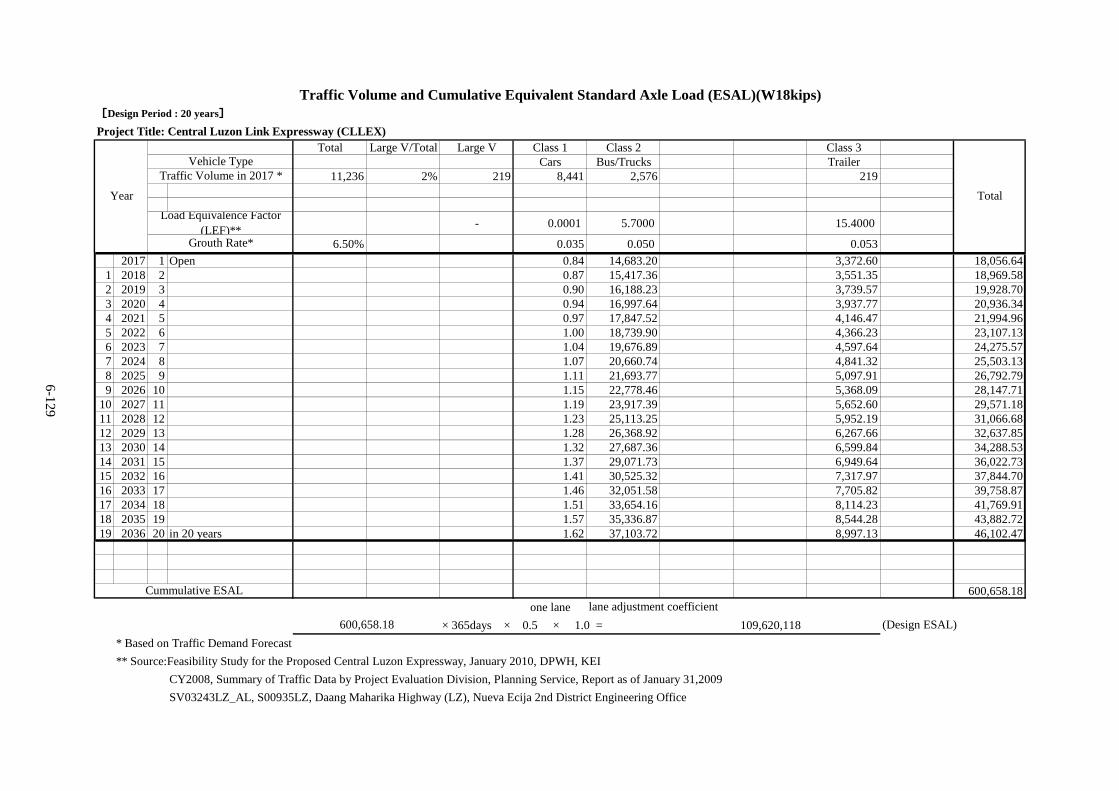
6-129
[Design Period : 20 years]
Project Title: Central Luzon Link Expressway (CLLEX)Total Large V/Total Large V Class 1 Class 2 Class 3
Cars Bus/Trucks Trailer11,236 2% 219 8,441 2,576 219
- 0.0001 5.7000 15.4000
6.50% 0.035 0.050 0.053
2017 1 Open 0.84 14,683.20 3,372.60 18,056.641 2018 2 0.87 15,417.36 3,551.35 18,969.582 2019 3 0.90 16,188.23 3,739.57 19,928.703 2020 4 0.94 16,997.64 3,937.77 20,936.344 2021 5 0.97 17,847.52 4,146.47 21,994.965 2022 6 1.00 18,739.90 4,366.23 23,107.136 2023 7 1.04 19,676.89 4,597.64 24,275.577 2024 8 1.07 20,660.74 4,841.32 25,503.138 2025 9 1.11 21,693.77 5,097.91 26,792.799 2026 10 1.15 22,778.46 5,368.09 28,147.71
10 2027 11 1.19 23,917.39 5,652.60 29,571.1811 2028 12 1.23 25,113.25 5,952.19 31,066.6812 2029 13 1.28 26,368.92 6,267.66 32,637.8513 2030 14 1.32 27,687.36 6,599.84 34,288.5314 2031 15 1.37 29,071.73 6,949.64 36,022.7315 2032 16 1.41 30,525.32 7,317.97 37,844.7016 2033 17 1.46 32,051.58 7,705.82 39,758.8717 2034 18 1.51 33,654.16 8,114.23 41,769.9118 2035 19 1.57 35,336.87 8,544.28 43,882.7219 2036 20 in 20 years 1.62 37,103.72 8,997.13 46,102.47
600,658.18one lane
× 365days × 0.5 × 1.0 = 109,620,118
* Based on Traffic Demand Forecast
** Source:Feasibility Study for the Proposed Central Luzon Expressway, January 2010, DPWH, KEI
CY2008, Summary of Traffic Data by Project Evaluation Division, Planning Service, Report as of January 31,2009
SV03243LZ_AL, S00935LZ, Daang Maharika Highway (LZ), Nueva Ecija 2nd District Engineering Office
Vehicle TypeTraffic Volume in 2017 *
Traffic Volume and Cumulative Equivalent Standard Axle Load (ESAL)(W18kips)
Total
Load Equivalence Factor(LEF)**
Grouth Rate*
(Design ESAL)
Cummulative ESALlane adjustment coefficient
600,658.18
Year

6-130
Design Standard: Guide for Design of Pavement Structures, 1993, American Association of State Highway and Transportation OffcialsDesign Case: 2017 to 2036 (20 years)Project Title: CLLEX
1. Calcuation of Structural Number
(1) Basic FomulaThe fomula shown below is applied for flexible pavement design in accordance with AASHTO design guideline.Design Condition is shown in Table 1.Structural Number is computed to accommodate the basic fomula.
log10 〔△PSI/(4.2-1.5)〕
log10(W18) = ZR×S0+9.36×log10(SN+1)-0.20+ +2.32×log10(MR)-8.07
Index Grounds Remarks2017 ~2036 (20 Years) Design life of pavement of initial pavement structure
1. Traffic W18
2. Level of Reliability R(%) Interstate and other Freeways (AASHTO)The possibility to satisfy road user during design period. Strongerpavement structure is required in accordance with Value.
ZR Value corresponding to R=85% Corresponding to ROverall Standard Deviation S0 Average of Flexible Pavement Variation of reliabiity according to regoinal traffic difference
3. Serviceabiity P0 Standard of AASHTO5: Perfect0: Inperfect
P1 Standard of AASHTO Serviceability expected at the end of design periodPresent Serviceability Index ΔPSI PSI = P0- Pt
4. Pavement Support Layer CBR FS2010MR MR=1,500×CBR Soil Subgrade Strength
(3)Computation of SN1.Left side of Basic Fomula log10(W18)2.Value of Righ side of Basi Fomula3.SN Value required SN
2.Pavement Structure1(inch)=2.540(cm)
Pavement StructureLayer
CoefficienThickness Thickness Drainage Structural Number
(a) D (cm) d (inch) Coeffient SN=a×m×D1 Remarks(m)
Asphalt Concrete Surface new 0.390 5.00 1.969 - 0.768Asphalt Concrete Binder new 0.390 5.00 1.969 - 0.768Cement Treated Base new 0.230 15.00 5.906 1.0 1.358 Cement treated base courseCrushed Aggregate Base new 0.140 25.00 9.843 1.0 1.378 Crushed aggregate,CBR>20Crushed sub-base new 0.110 35.00 13.780 1.0 1.516 Crushed aggregate
Evaluation Required SN 5.737 < 5.787 OK
W18 : Predicted number of 18-kip equivalent single axle load applicationsZR : Standard normal deviateS0 : Combined standard error of the traffic prediction and performance prediction)MR : Resilient modulus (psi)D : Layer thickness(inches)m : Layer drainage coeficientSN is equal to the structural number indicative of the total pavement thickness required:
SN = a1D1 + a2D2m2 + a3D3m3
Value20
Design Condition
(2)Design Condition
Design Period
85
109,620,118
-1.0370.45
CBR(%)Resilient Modulus
Reliability
Standard Normal Deviate
Initial Serviceability Index
Terminal Serviceability Index
Flexible Pavement Design
5.737
2.51.7
8.040
8
Design ESAL
12,000
8.040
4.2


