
2-1
Chapter 2 Social Economic Conditions 2.1 Population Population is one of the main indicators used to formulate socio-economic conditions. In this section, the population trend is reviewed on the basis of currently available projection. 2.1.1 National Population The population of the Philippines in 2000 is about 76.5 million (see Table 2.1.1). The annual population growth rate was over 2.3% in the 1990s. According to the forecast by the NSO (1997) the population growth rate will decrease although the population will exceed 100 million in 2020 under the medium case (see Table 2.1.1 and Figure 2.1.1). Since the medium case of population (76,320,126) projected in 1996 was close to the actual census population (76,503,333: see note of the table) in 2000, the projected population in the medium case is adopted for the Study. The population in 2009 (90,270 thousand) and 2024 (110,252 thousand) can be estimated through interpolation (see Table 2.1.1 and Figure 2.1.2).
Table 2.1.1 Population Census and Projection
Note : According to final account of population census 2000, population in 2000 is 76,503,333.
Source: NSCB, 2002 Philippine Statistical Yearbook,
NSO, 1995 Census-based national regional and provincial population projections, Volume I
Projection (1995 basis)
Low CaseMedium
CaseHigh Case
1903 7,635,4261918 10,314,3101939 16,000,3031948 19,234,1821960 27,087,6851975 42,070,6601980 48,098,4601990 60,703,2161995 68,616,5362000 76,498,735 75,505,061 76,320,126 76,755,9142005 82,079,348 84,214,747 85,386,2612009 90,270,4792010 87,940,171 91,851,266 94,058,3742015 93,440,274 99,007,576 102,551,9482020 98,864,348 105,503,141 110,715,1792024 110,252,2702025 103,871,822 111,472,586 118,383,9582030 108,198,831 117,060,336 125,381,4732035 111,660,461 122,016,457 131,677,0902040 114,270,527 126,173,513 132,879,556
Year Census

2-2
Source: NSO, 1995 Census-based national regional and provincial population projections, Volume I
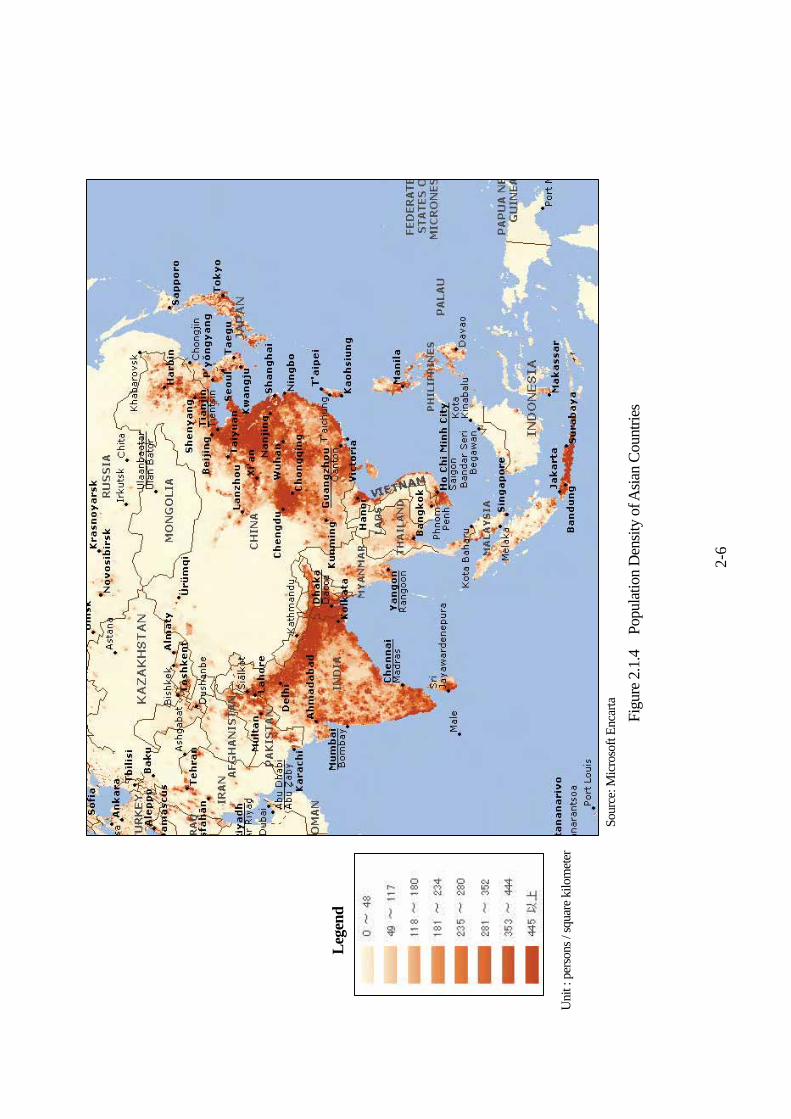
Figure 2.1.1 Population Projection Figure 2.1.2 and Figure 2.1.3 illustrate the increase of the population (*) and its concentration; it is especially notable in the surrounding provinces of Manila, Iloilo, Negros Occidental, Cebu, Northern and Southern Mindanao. This tendency is also seen in the neighboring cities as shown in Figure 2.1.5 through 2.1.7. The city population in 2009 and 2020 has been estimated with regional population growth rates obtained from NSO projection. Major cities whose population is 300 thousand and over are listed in Table 2.1.2 in descendent order. Population of four cities is over one million while 21 cities have populations of 300 thousand and over. Eight of these cities do not belong to NCR. The number of cities around the above mentioned areas with a population over 300,000 will increase from eight in 2000 to twenty-one in 2020, and four will have a population of over a million. Such concentration is commonly seen in other Asian countries (see Figure 2.1.4), and this suggests that the Philippines will face the same social and environmental problems as the other countries experienced.
(*)
For details, see NSO, 1995 Census-based national regional and provincial population projections, Volume II
Population Projection
0
20 ,000 ,000
40 ,000 ,000
60 ,000 ,000
80 ,000 ,000
100 ,000 ,000
120 ,000 ,000
140 ,000 ,000
1890
1900
1910
1920
1930
1940
1950
1960
1970
1980
1990
2000
2010
2020
2030
2040
2050
Medium Case
Low Case
High Case
Census
90,270,479(2009)
110,252,270(2024)

2-3
Table 2.1.2 Major cities (300 thousand population and over in 2000)
Source: JICA Study Team based on NSCB, 2000 Philippine Statistical Yearbook
No Region City
Census
Population
(2000)
Annual Growth
Rate
(1990-2000)
1 NCR Quezon City 2,173,831 2.7%
2 NCR Manila 1,581,082 -0.1%
3 NCR Kalookan 1,177,604 4.4%
4 Region XI Davao 1,147,116 3.0%
5 Region VII Cebu 718,821 1.6%
6 Region IX Zamboanga 601,794 3.1%
7 NCR Pasig 505,058 2.4%
8 NCR Valenzuela 485,433 3.6%
9 NCR Las Piñas 472,780 4.8%
10 Region IV Antipolo 470,866 8.4%
11 NCR Taguig 467,375 5.8%
12 Region X Cagayan de Oro 461,877 3.1%
13 NCR Parañaque 449,811 3.9%
14 NCR Makati 444,867 -0.2%
15 Region VI Bacolod 429,076 1.7%
16 Region XI General Santos 411,822 5.1%
17 NCR Marikina 391,170 2.3%
18 NCR Muntinlupa 379,310 3.1%
19 Region VI Iloilo 365,820 1.7%
20 NCR Pasay 354,908 -0.4%
21 NCR Malabon 338,855 1.9%

2-
4
2000
Cen
sus
2
010
Proj
ectio
n
202
0 Pr
ojec
tion
Sour
ce: D
atos
/ N
SO (1
999)
, 199
5 C
ensu
s-ba
sed
natio
nal r
egio
nal a
nd p
rovi
ncia
l pop
ulat
ion
proj
ectio
ns, V
olum
e II
Figu
re 2
.1.2
Po
pula
tion
Proj
ectio
n by
Pro
vinc
e

2-
5
2000
Cen
sus
2
010
Proj
ectio
n
202
0 Pr
ojec
tion
Sour
ce: D
atos
/ N
SO (1
999)
, 199
5 C
ensu
s-ba
sed
natio
nal r
egio
nal a
nd p
rovi
ncia
l pop
ulat
ion
proj
ectio
ns, V
olum
e II
Uni
t : p
erso
ns /
squa
re k
ilom
eter
Figu
re 2
.1.3
Po
pula
tion
Den
sity
Pro
ject
ion
by P
rovi
nce
2-
6
Sour
ce: M
icro
soft
Enca
rta
Figu
re 2
.1.4
Po
pula
tion
Den
sity
of A
sian
Cou
ntrie
s
Leg
end
Uni
t : p
erso
ns /
squa
re k
ilom
eter


2-10
2.1.2 Regional Population (1) Population Projection NCR, Region III and IV have large populations accounting for 38.5% of the total population in 2000, and that share is predicted to rise slightly to 39.1% in 2020. This is mainly caused by the high growth rate in Region IV (Table 2.1.2). All regions can be divided into three groups (Large, Medium and Small Population) according to the magnitude of present and projected population (see Figure 2.1.8).
Table 2.1.2 Population Projection by Region (Medium Case)
Data Source: NSCB, 2002 Philippine Statistical Yearbook,
NSO, 1995 Census-based national regional and provincial population projections, Volume II
(The projected population is slightly different from one in Volume I.)
(2) Population Movement The difference between the crude birth rate and the crude death rate can be taken as the crude rate
of natural increase (CRNI). The estimated migration rates are set out in Figure 2.1.9 and Figure 2.1.10 with CRNI by the regional groups and sex. The following observations can be made:
a) The natural increase mainly contributes to the growth in medium and small population group
consisting of less developed provinces, while net immigration plays a significant factor in the large population group consisting of more developed provinces.
b) The natural increase (CRNI) will slow down in all regions.
1980 Share 2000 Share 2010 Share 2020 Share48,098,460 100.0% 76,498,735 100.0% 91,868,309 100.0% 105,507,209 100.0%
NCR National Capital Region 5,925,884 12.3% 9,932,560 13.0% 11,926,942 13.0% 12,810,734 12.1%CAR Cordillera Administrative 914,432 1.9% 1,365,220 1.8% 1,716,384 1.9% 1,996,020 1.9%
1 Ilocos Region 2,922,892 6.1% 4,200,478 5.5% 4,814,663 5.2% 5,347,307 5.1%2 Cagayan Valley 1,919,091 4.0% 2,813,159 3.7% 3,338,158 3.6% 3,727,834 3.5%3 Central Luzon 4,802,793 10.0% 8,030,945 10.5% 9,132,884 9.9% 10,244,139 9.7%4 Southern Tagalog 6,118,620 12.7% 11,793,655 15.4% 14,524,674 15.8% 18,225,345 17.3%5 Bicol Region 3,476,982 7.2% 4,674,855 6.1% 5,551,343 6.0% 6,207,492 5.9%6 Western Visayas 4,525,615 9.4% 6,208,733 8.1% 7,428,323 8.1% 8,337,559 7.9%7 Central Visayas 3,787,374 7.9% 5,701,064 7.5% 6,578,025 7.2% 7,431,317 7.0%8 Eastern Visayas 2,799,534 5.8% 3,610,355 4.7% 4,528,908 4.9% 5,253,779 5.0%9 Western Mindanao 1,973,267 4.1% 3,091,208 4.0% 3,889,273 4.2% 4,529,072 4.3%10 Northern Mindanao 1,765,120 3.7% 2,747,585 3.6% 3,355,592 3.7% 3,833,394 3.6%11 Southern Mindanao 2,969,156 6.2% 5,189,335 6.8% 6,562,492 7.1% 7,757,576 7.4%12 Central Mindanao 1,467,115 3.1% 2,598,210 3.4% 3,268,112 3.6% 3,757,764 3.6%
ARMM Autonomous Region in Muslim Mindanao 1,359,073 2.8% 2,412,159 3.2% 2,538,718 2.8% 2,822,017 2.7%13 Caraga 1,371,512 2.9% 2,095,367 2.7% 2,713,856 3.0% 3,225,889 3.1%
Luson (NCR,CAR,1-5) 26,080,694 54.2% 42,810,872 56.0% 51,005,048 55.5% 58,558,871 55.5%Visayas (6-9) 11,112,523 23.1% 15,520,152 20.3% 18,535,256 20.2% 21,022,655 19.9%
Mindanao (9-13, ARMM) 10,905,243 22.7% 18,133,864 23.7% 22,328,043 24.3% 25,925,712 24.6%
Projection (NSO)
Philippines
Census

2-11
c) Female migration rate in most regions is larger than male migration. According to the viewpoint by NSO, there could be the female selectivity of migration into the large population group.
d) The net negative immigration rate in medium and small regions will not change very much, while positive immigration rate in large population group will vary.
e) This suggests that the population of Region IV will expand by the immigration from medium or small population groups where the population grows due to higher natural increase than that in large population group.
Source: NSO, 1995 Census-based national regional and provincial population projections, Volume II
Figure 2.1.8 Population Projection by Regional Group
Large Population
Group
Medium Population Group
Small Population Group
Population Projection 2000/2020by Regional Group (medium case)
0
2,000,000
4,000,000
6,000,000
8,000,000
10,000,000
12,000,000
14,000,000
16,000,000
18,000,000
20,000,000
NC
R
Reg
ion
3
Reg
ion
4
Reg
ion
1
Reg
ion
5
Reg
ion
6
Reg
ion
7
Reg
ion
8
Reg
ion
10
Reg
ion
11
CA
R
Reg
ion
2
Reg
ion
9
Reg
ion
12
ARM
M
Projection 2000 Projection 2020

2-12
Source: NSO, 1995 Census-based national regional and provincial population projections, Volume II
Figure 2.1.9 CRNI and Migration Rate (2015-2020)
Source: NSO, 1995 Census-based national regional and provincial population projections, Volume II
Figure 2.1.10 CRNI and Migration Rate (1995-2000)
CRNI and Migration Rate by Region(2015-2020)
-4.0%
-2.0%
0.0%
2.0%
4.0%
6.0%
8.0%N
CR
Reg
ion
3
Reg
ion
4
Reg
ion
1
Reg
ion
5
Reg
ion
6
Reg
ion
7
Reg
ion
8
Reg
ion
10
Reg
ion
11
CA
R
Reg
ion
2
Reg
ion
9
Reg
ion
12
ARM
M
An
nua
l Gro
wth
Ra
te
Migration(male)
Migration(female)
CRNI
CRNI and Migration Rate by Region(1995-2000)
-6.0%
-4.0%
-2.0%
0.0%
2.0%
4.0%
6.0%
8.0%
NC
R
Reg
ion
3
Reg
ion
4
Reg
ion
1
Reg
ion
5
Reg
ion
6
Reg
ion
7
Reg
ion
8
Reg
ion
10
Reg
ion
11
CA
R
Reg
ion
2
Reg
ion
9
Reg
ion
12
ARM
M
An
nu
al G
row
th R
ate
Migration(male)
Migration(female)
CRNI

2-13
2.2 Economic Activities In this section outlook of the economic activities is presented in the viewpoints of GDP, industry, and trade so that the cargo forecast and port strategic planning can be carried out under the assumption of those activities. 2.2.1 GDP (1) Past Trend GDP grew moderately over the last 20 years (Figure 2.2.1), although there have been some stagnant periods (1984-85/1991-92/1998, see Figure 2.2.2). Compared with other Asian countries, the Philippines achieved the lowest level of GDP growth. This is largely due to insufficient industrialization and infrastructure as the result of the remaining debts incurred by the Marcos administration, and to the pressure of a growing population.
Data Source: NSCB, Philippine Statistical Year Book 2002
Figure 2.2.1 GDP by Industrial Sector (2) Growth Rates used for Projection The simple arithmetic and 20 years moving averages of the annual GDP growth rate for the past 30 years can be obtained as 4.3% and 4.1% (Table 2.2.1). The extreme low growth rates in 1984 and 1985 which were registered during the period of the Marcos administration were omitted from the
GDP (current prices 1987-2001)
0
500,000
1,000,000
1,500,000
2,000,000
2,500,000
3,000,000
3,500,000
4,000,000
1987
1988
1989
1990
1991
1992
1993
1994
1995
1996
1997
1998
1999
2000
2001
GD
P (m
illio
n pe
sos)
SERVICE SECTOR
INDUSTRY SECTOR
AGRI., FISHERY & FORESTRY

2-14
above calculation. On the basis of these figures, 4.5% is adopted in the Study as the medium case. The growth rate in the high case(*) is determined through discussion with NEDA National Planning and Policy Staff (NPPS). The low cases with an allowance of –1.0% is also taken into account (Figure 2.2.2). To catch up with the other Asian countries such as Thailand or Malaysia, a growth rate of at least 4.5% is required.
Data Source: IMF Web site
Figure 2.2.2 GDP Annual Growth Rate in the Past 30 years
Data Source: IMF Web site
Figure 2.2.3 GDP per Capita vs. GDP Growth Rate in Asian Countries (*) According to NEDA, it is expected to achieve the economic structural change including zero fiscal deficit by 2010, more competitive IT sector, or deeper capital market, etc. Taking into account of that, an averaged growth rate becomes 5.73% (2003-2024) under a series of growth rate forecast; 4.5% (2003), 5.2% (2004), 5.5% (2005), 6.0% (2006), 5.8% (2007), 6.3% (2008) and 6.5% (after 2009 up to 2024).
GDP Per Capita VS GDP Growth Rates (20 year average)
0.0
1.0
2.0
3.0
4.0
5.0
6.0
7.0
8.0
9.0
100 1,000 10,000 100,000
GDP per Capita (USD current prices)
GD
P G
row
th R
ate
s (%
)
CHINA,P.R.:HONGKONGKOREA
SINGAPORE
TAIWAN PROV.OFCHINAINDIA
INDONESIA
MALAYSIA
MYANMAR
PAKISTAN
SRI LANKA
THAILAND
VIETNAM
PHILIPPINES
GDP Growth Rate Philippines (Constant Price)
-10.0
-8.0
-6.0
-4.0
-2.0
0.0
2.0
4.0
6.0
8.0
10.0
12.0
1970
1972
1974
1976
1978
1980
1982
1984
1986
1988
1990
1992
1994
1996
1998
2000
2002G
row
th R
ate
(%
)
High Case +5.73%(Ave.)
Mid. Case +4.5%
Low Case +3.5%

2-
15
Tabl
e 2.
2.2
Com
paris
on o
f Ann
ual G
DP
Gro
wth
Rat
e in
Asi
an C
ount
ries
C
ount
ry19
7019
8019
8519
9019
9119
9219
9319
9419
9519
9619
9719
9819
9920
0020
0120
02M
AX
AV
EM
IN
10.9
1.2
3.4
5.1
6.3
6.1
5.4
3.9
4.5
5.0
-5.3
3.0
10.4
0.2
1.5
6.5
8.1
7.7
5.5
5.1
5.0
8.1
6.7
5.0
8.8
-2.1
6.5
9.0
9.2
5.4
5.5
8.3
8.9
6.8
5.0
-6.7
10.9
9.3
3.0
6.3
7.4
8.2
8.0
7.5
7.3
7.2
8.2
7.6
6.7
13.7
7.0
-1.6
9.0
7.3
6.5
12.7
11.4
8.0
7.7
8.5
-0.1
6.9
10.3
-2.0
3.6
7.8
8.1
8.0
7.6
7.1
6.9
8.4
7.7
6.9
11.3
7.3
5.0
5.4
7.6
7.5
7.0
7.1
6.4
6.1
6.7
4.6
5.4
5.9
-1.9
3.3
7.7
8.9
8.4
7.2
6.8
6.8
9.2
7.8
6.8
10.3
9.8
4.4
5.5
3.1
0.9
0.3
0.9
1.7
3.6
1.8
-1.2
0.8
2.4
-0.3
-0.5
3.5
4.6
3.9
2.8
2.6
2.4
4.9
3.6
2.4
5.8
3.6
5.3
6.0
2.1
4.2
5.0
6.8
7.6
7.5
5.0
5.8
6.7
5.4
4.1
5.0
4.8
4.4
4.9
5.7
5.6
5.6
5.7
5.1
4.4
6.5
7.9
2.5
9.0
8.9
7.2
7.3
7.5
8.2
8.0
4.5
-13.
10.
84.
83.
33.
55.
86.
66.
64.
94.
74.
96.
75.
94.
74.
97.
4-0
.99.
09.
58.
99.
99.
29.
810
.07.
3-7
.46.
18.
30.
53.
56.
77.
07.
56.
66.
36.
27.
56.
96.
21.
37.
92.
92.
8-0
.79.
75.
96.
87.
26.
45.
75.
810
.95.
54.
84.
23.
92.
83.
73.
93.
83.
74.
03.
52.
7-2
.47.
06.
55.
06.
24.
62.
74.
44.
92.
91.
83.
14.
14.
33.
64.
64.
65.
45.
65.
04.
84.
75.
95.
34.
715
.85.
45.
06.
24.
64.
36.
95.
65.
53.
86.
44.
74.
36.
0-1
.43.
74.
84.
44.
84.
84.
44.
34.
94.
74.
36.
55.
84.
611
.68.
18.
18.
39.
09.
25.
9-1
.4-1
0.5
4.4
4.6
1.8
3.5
7.4
7.4
8.0
6.3
6.1
6.0
8.0
7.6
6.0
7.8
-3.5
5.6
4.9
6.0
8.6
8.1
8.8
9.5
9.3
8.2
3.5
4.2
5.5
5.0
5.3
5.7
4.9
6.5
6.5
6.5
6.3
6.5
6.0
4.9
4.6
5.1
-7.3
3.0
-0.6
0.3
2.1
4.4
4.7
5.8
5.2
-0.6
3.4
4.4
3.2
4.6
3.6
3.9
2.9
2.4
2.3
2.4
4.0
2.9
2.3 3.6
3.5
4.3
2.2
3.0
0.6
4.1
0.5
JAPA
N
IND
IA
IND
ON
ES
IA
MA
LAYSIA
CH
INA
,P.R
.:HO
NG
KO
NG
KO
REA
SIN
GA
PO
RE
TA
IWA
N P
RO
V.O
F C
HIN
A
MYA
NM
AR
PA
KIS
TA
N
SR
I LA
NKA
TH
AIL
AN
D
Ave
rage
Sta
ndar
d D
evia
tion
VIE
TN
AM
PH
ILIP
PIN
ES
1970
-200
2
1970
-198
3,19
86-2
002
1970
-200
2
1970
-198
3,19
86-2
002
Mov
ing
Ave
rage
(20
year
s)Sta
ndar
d D
evia
tion
Mov
ing
Ave
rage
(20
year
s)Sta
ndar
d D
evia
tion
Ave
rage
Sta
ndar
d D
evia
tion
Dat
a S
ourc
e: J
ICA
Stu
dy T
eam
on
th
e ba
sis
of t
he
data
fro
m I
MF
Web
sit
e
Fig
ures
in
low
er l
ines
of
each
cou
ntry
giv
es 2
0 ye
ars
aver
aged
ann
ual
grow
th
rate
s
Phi
lipp
ine
aver
age
annu
al
grow
th
Figu
res i
n lo
wer
line
of e
ach
coun
try in
dica
te 2
0 ye
ar m
ovin
g av
erag
e.

2-16
(3) GDP Projection Regional breakdown of GDP in 2009 and 2024 are estimated with linear regression method using correlation between GDP and GRDP in the available past records. The total GRDP is adjusted to the GDP projection estimated at a medium growth rate of 4.5% (Table 2.2.3). The economy will expand close to three times its present size. However, since the population will also continue to grow, GDP per capita will only be doubled (see Table 2.2.3 and Appendix 2.2.1 (1)). In addition, consistent with trend during 1980-2001, GDP will be concentrated in NCR, Region 4 (Southern Tagalog) and 7 (Central Visayas), while the shares of Region 5 (Bicol), 8 (Eastern Visayas), 9 (Western Mindanao) and 12 (Central Mindanao) decline.
Table 2.2.3 GRDP Projection (Medium Case)
Data Source: JICA Study Team on the basis of the data from NSCB, Philippine Statistical Year Book 2002
Note: Explanation of the GRDP projection is shown in Appendix 2.2.1 (1).
1980 Share 2001 Share2009
Projection Share2024
Projection SharePhilippines 609,768 100.0% 989,259 100.0% 1,406,826 100.0% 2,722,605 100.0%
NCR National Capital Region 183,444 30.1% 305,204 30.9% 435,177 30.9% 850,514 31.2%CAR Cordillera Administrative 24,229 2.4% 39,348 2.8% 87,042 3.2%
1 Ilocos Region 24,403 4.0% 29,963 3.0% 43,686 3.1% 86,122 3.2%2 Cagayan Valley 17,356 2.8% 22,615 2.3% 31,827 2.3% 64,039 2.4%3 Central Luzon 52,831 8.7% 89,525 9.0% 125,500 8.9% 234,492 8.6%4 Southern Tagalog 86,998 14.3% 150,585 15.2% 221,150 15.7% 431,915 15.9%5 Bicol Region 18,240 3.0% 27,629 2.8% 35,824 2.5% 62,395 2.3%6 Western Visayas 45,615 7.5% 69,557 7.0% 95,468 6.8% 177,898 6.5%7 Central Visayas 37,562 6.2% 70,347 7.1% 100,542 7.1% 201,295 7.4%8 Eastern Visayas 15,155 2.5% 22,633 2.3% 29,063 2.1% 50,336 1.8%9 Western Mindanao 19,407 3.2% 26,651 2.7% 35,158 2.5% 61,821 2.3%
10 Northern Mindanao 37,059 6.1% 38,829 3.9% 56,270 4.0% 112,227 4.1%11 Southern Mindanao 48,559 8.0% 62,102 6.3% 89,588 6.4% 175,630 6.5%12 Central Mindanao 23,139 3.8% 25,906 2.6% 34,702 2.5% 62,319 2.3%
ARMM Autonomous Region in Muslim Mindanao 9,294 0.9% 13,106 0.9% 24,524 0.9%13 Caraga 14,190 1.4% 20,418 1.5% 40,038 1.5%
Luzon (NCR,CAR,1-5) 383,272 62.9% 649,750 65.7% 932,511 66.3% 1,816,518 66.7%Visayas (6-9) 98,332 16.1% 162,537 16.4% 225,073 16.0% 429,529 15.8%
Mindanao (9-13, ARMM) 128,164 21.0% 176,972 17.9% 249,241 17.7% 476,558 17.5%Population (thousand)
Philippine NationalLuzon (NCR,CAR,1-5)
Visayas (6-9)Mindanao (9-13, ARMM)
GDP Per Capita (pesos)Philippine National
Luzon (NCR,CAR,1-5)Visayas (6-9)
Mindanao (9-13, ARMM)
10,905 18,617 21,904 27,18411,112 15,916 18,240 21,85026,081 43,393 50,143 61,218
RegionGross Regional Domestic Product (million pesos at 1985 constant prices)
48,098
12,678
77,926
12,695
90,270
15,585
110,252
24,69414,695 14,974 18,597 29,6738,849 10,212 12,340 19,658
11,753 9,506 11,379 17,531


2-18
2.2.2 Industry (1) Outlook of Industrial Structure GDP by major industry groups and their share change from 1980 to 2024 are shown in Figure 2.2.5 and Table 2.2.4. The projection is obtained from adjusting the annual growth rate by sector to agree with the projected GDP (medium case) given in the previous section. The adjusted growth rates of agriculture (3%), industry (4.5%), and service (5%) are determined based on the past trends during 1980-2001. The breakdown GDP projection of industrial groups is calculated with a linear regression method using correlation of GDP during 1980-2001 between sector and group. Data Source: JICA Study Team on the basis of the data from NSCB, Philippine Statistical Year Book 2002
Figure 2.2.5 GDP Projection by Industrial Sector (Medium Case) (GDP in million pesos at 1985 constant prices)
Of these sectors, the service sector has been the largest contributor to GDP following the significant fall of the industry sector in 1984 and 1985. Under the assumed sector growth rates, the share of the service sector continues to expand (2024: 52%) while that of the industry has shrunk about to 34 % (2024: Table 2.2.4) and Appendix 2.2.1 (2). These shares, especially those of industry and service are subject to change according to progress in social economic development, but the service sector is likely to continue to be the major contributor to GDP.
GDP (1980-2001) and Forecast by Industrial Sector
0
500,000
1,000,000
1,500,000
2,000,000
2,500,000
3,000,000
1980
1983
1986
1989
1992
1995
1998
2001
2004
2007
2010
2013
2016
2019
2022
2025
GD
P (m
il pe
so a
t 198
5 co
nsta
nt p
rice
s)
SERVICE SECTOR
INDUSTRY SECTOR
AGRI.,FISHERY & FORESTRY
2-19
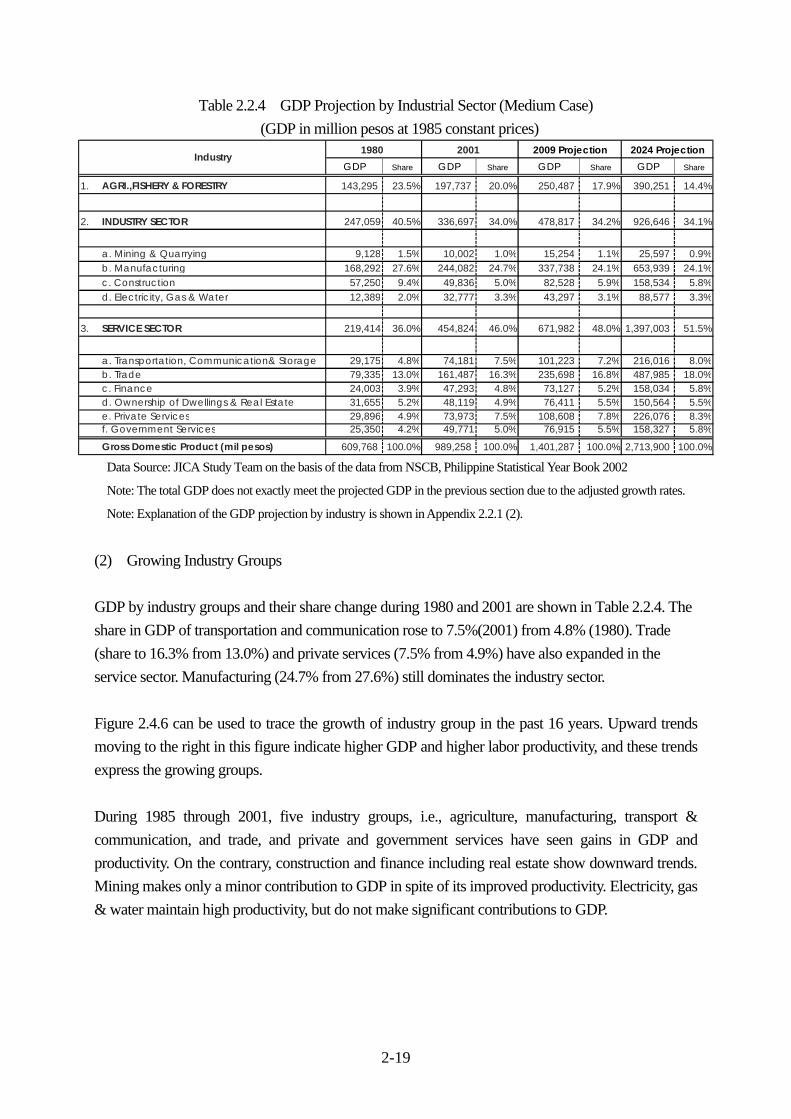
Table 2.2.4 GDP Projection by Industrial Sector (Medium Case) (GDP in million pesos at 1985 constant prices)
Data Source: JICA Study Team on the basis of the data from NSCB, Philippine Statistical Year Book 2002
Note: The total GDP does not exactly meet the projected GDP in the previous section due to the adjusted growth rates.
Note: Explanation of the GDP projection by industry is shown in Appendix 2.2.1 (2).
(2) Growing Industry Groups GDP by industry groups and their share change during 1980 and 2001 are shown in Table 2.2.4. The share in GDP of transportation and communication rose to 7.5%(2001) from 4.8% (1980). Trade (share to 16.3% from 13.0%) and private services (7.5% from 4.9%) have also expanded in the service sector. Manufacturing (24.7% from 27.6%) still dominates the industry sector. Figure 2.4.6 can be used to trace the growth of industry group in the past 16 years. Upward trends moving to the right in this figure indicate higher GDP and higher labor productivity, and these trends express the growing groups. During 1985 through 2001, five industry groups, i.e., agriculture, manufacturing, transport & communication, and trade, and private and government services have seen gains in GDP and productivity. On the contrary, construction and finance including real estate show downward trends. Mining makes only a minor contribution to GDP in spite of its improved productivity. Electricity, gas & water maintain high productivity, but do not make significant contributions to GDP.
GDP Share GDP Share GDP Share GDP Share
1. AGRI.,FISHERY & FORESTRY 143,295 23.5% 197,737 20.0% 250,487 17.9% 390,251 14.4%
2. INDUSTRY SECTOR 247,059 40.5% 336,697 34.0% 478,817 34.2% 926,646 34.1%
a. Mining & Quarrying 9,128 1.5% 10,002 1.0% 15,254 1.1% 25,597 0.9%b. Manufacturing 168,292 27.6% 244,082 24.7% 337,738 24.1% 653,939 24.1%c. Construction 57,250 9.4% 49,836 5.0% 82,528 5.9% 158,534 5.8%d. Electricity, Gas & Water 12,389 2.0% 32,777 3.3% 43,297 3.1% 88,577 3.3%
3. SERVICE SECTOR 219,414 36.0% 454,824 46.0% 671,982 48.0% 1,397,003 51.5%
a. Transportation, Communication& Storage 29,175 4.8% 74,181 7.5% 101,223 7.2% 216,016 8.0%b. Trade 79,335 13.0% 161,487 16.3% 235,698 16.8% 487,985 18.0%c. Finance 24,003 3.9% 47,293 4.8% 73,127 5.2% 158,034 5.8%d. Ownership of Dwellings & Real Estate 31,655 5.2% 48,119 4.9% 76,411 5.5% 150,564 5.5%e. Private Services 29,896 4.9% 73,973 7.5% 108,608 7.8% 226,076 8.3%f. Government Services 25,350 4.2% 49,771 5.0% 76,915 5.5% 158,327 5.8%
Gross Domestic Product (mil pesos) 609,768 100.0% 989,258 100.0% 1,401,287 100.0% 2,713,900 100.0%
Industry1980 2001 2024 Projection2009 Projection

2-20
Data Source: NSCB, Philippine Statistical Year Book 2002 / 1993
(Productivity calculated with GDP divided by employed persons)
Figure 2.2.6 GDP and Productivity by Industrial Sector According to the above, the five industry groups, (a) agriculture, (b) manufacturing, (c) transport & communication, (d) trade, and private and (e) government services can be considered as the growing industry groups. Population dependent groups, such as labor-intensive manufacturing and service sectors, are deemed to grow. The outlook of those growing groups is given in Table 2.2.4. The growth with the highest share is manufacturing (2024: share of 24.1%), followed by trade (2024: 18.0%), private service (2024: 8.3%), and transportation and communication (2024: 8.0%). Although the manufacturing group can achieve high growth owing to relatively low cost and skilled labor, industry as the whole is not likely to grow significantly. This is mostly because of dragged heavy and chemical industries that have not been sufficiently developed due to financial difficulty. The agricultural sector has been reducing its share, but the nation requires self –sufficiency foods. (3) Labor Share The agriculture sector employs about 40% of the labor force, although its share has been apparently falling (see Figure 2.2.7.). However, it is noted that the number of persons employed by the agricultural sector has not decreased (9,698,000 in 1985 as compared with 11,253,000 in 2001), because the total labor force has been increasing annually (39,354,000 in 2001 from 25,246,000 in 1991).
GDP and Productivity by Industry Group1985-2001
0
50,000
100,000
150,000
200,000
250,000
300,000
0 50 100 150 200 250 300Productivity GDP/person (1000 pesos)
GD
P(m
il pe
sos
at 1
985
cons
tant
pri
ce) Agriculture,Fishery and Forestry
Mining and QuarryingManufacturingConstructionElectricity, Gas & WaterTransport.&CommunicationTradeFinance, Real EstatePrivate and Government Services

2-21
The share change in the wholesale and retail trade (18.4% in 2001 from 13.2% in 1985); transport and communication (7.2% from 4.7%) indicate that these groups have been absorbing the labor force (see Figure 2.4.4). This suggests that the industrial sector in this country has not been able to employ a significantly large enough number of people, and this has resulted in a worsened unemployed rate (10.2% in October 2002). Data Source: NSCB, Philippine Statistical Year Book 2002 / 1993 (Employed persons represent labor force in this figure.)
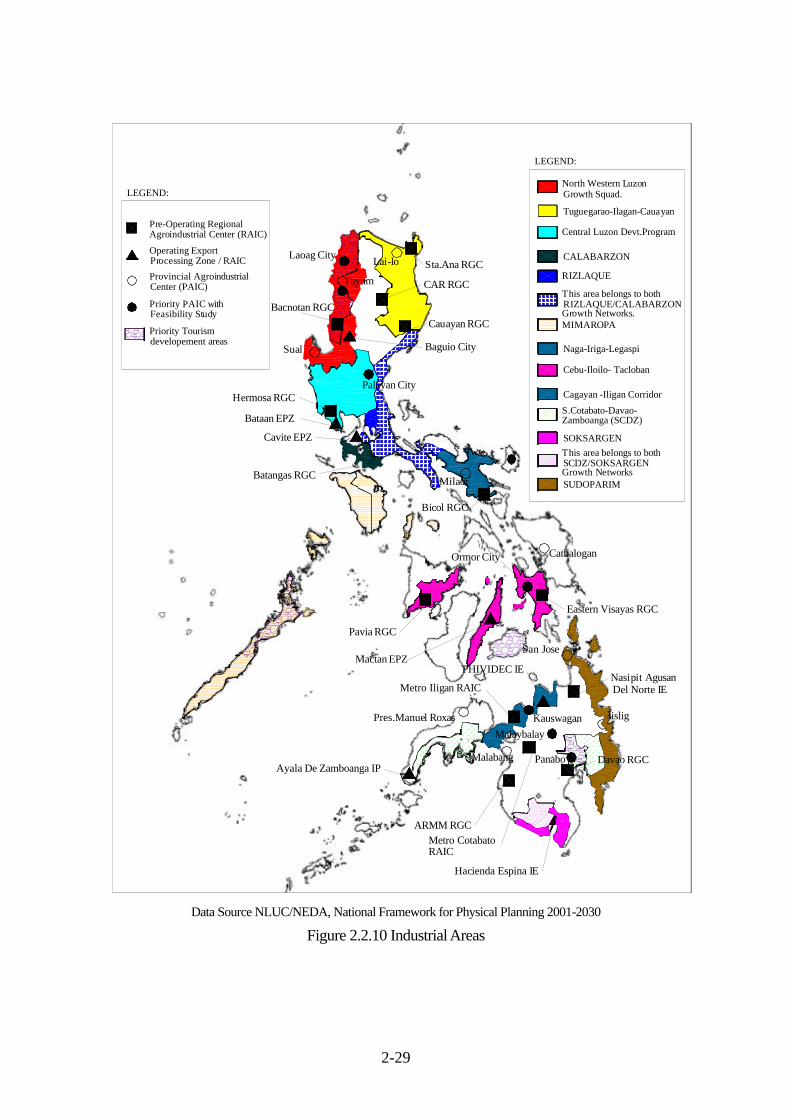
Figure 2.2.7 Labor Share by Industrial Group (4) Outlook of Industrial Development Areas Areas with development potential are illustrated in Figure 2.2.10, Figure 2.2.11 and Figure 2.2.12. 1) Agriculture The Agriculture and Fisheries Modernization Act (AFMA) or RA 8435 provided for the formation of the Strategic Agriculture and Fisheries Development Zone (SAFDZ) to ensure that lands are efficiently and sustainably utilized for food and non-food agro-industrialization. SAFDZ are intended to serve as centers where the public and private investments towards competitive production and national food security are expected (see Appendix 2.2.2). As of 2000, a total of 753,407 ha. of key SAFDZs areas and 318,556 ha. emerging SAFDZs area, around 55 SAFDZ convergence areas-cum-investment programs have been identified. (Table 2.2.5) The government has announced that it will continue to pursue three programs in an effort to energize the agricultural sector: the enhancement of markets, the promotion of new technology, and the
Labor Force Share in Industry Group
0% 20% 40% 60% 80% 100%
1985
1987
1989
1991
1993
1995
1997
1999
2001
Share
Agriculture, fishery andforestryMining and quarrying
Manufacturing
Electricity, gas and water
Construction
Wholesale and retail trade
Transportation, storage &communicationFinancing, insurance, realestateCommunity, social andpersonal services

2-22
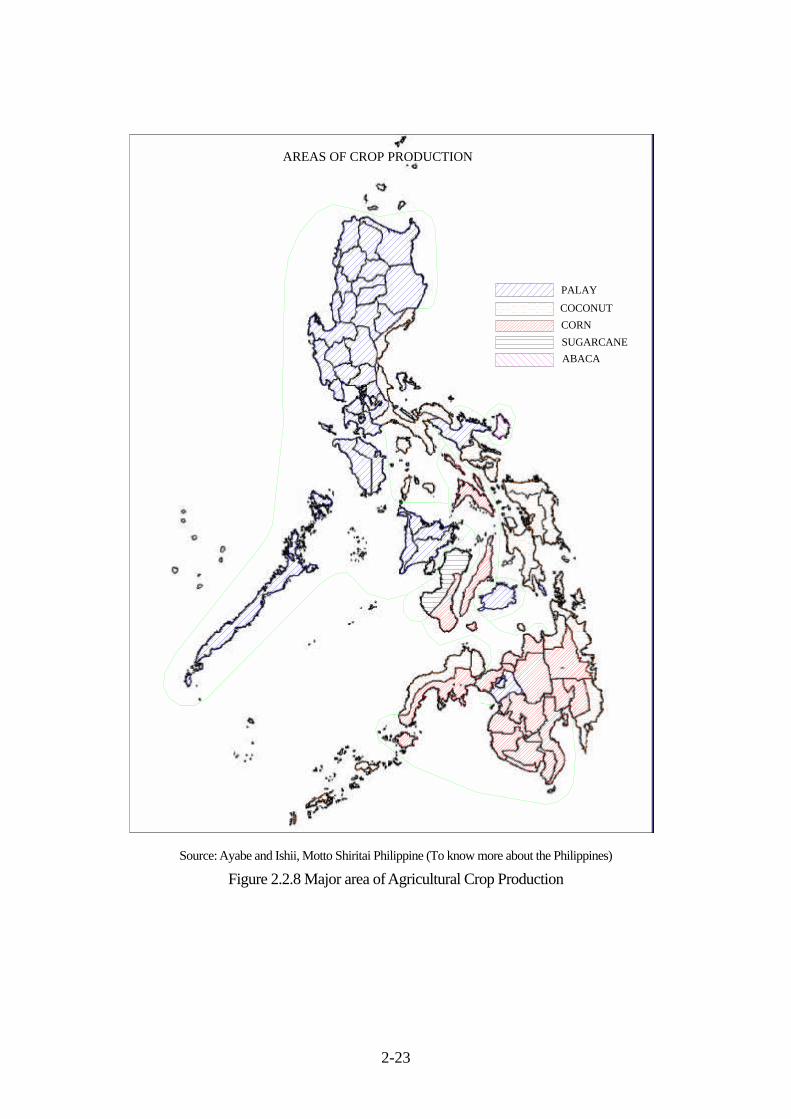
adoption of structural reforms. These include the work for increased global market shares for some 17 commodities such as hybrid rice, hybrid seed, yellow corn, coconut, coffee, cassava, oil palm, mango, bananas and seaweeds. Agricultural production is strongly related to the climatic conditions (see Figure 3.2.1), accordingly the major production areas will not change very much. From the above, the production areas of major crops are identified as follows: (also see Figure 2.2.8)
a) Palay: Most parts of Luzon, the Southern Tagalog, Mindro, Panay, and Bohol Island b) Coconut: Quezon, Vicol, Samal, Leyte, and west and north edge of Mindanao c) Corn: Masbate, Cebu, and most parts of Mindanao d) Sugarcane Negros Occidental
2) Industry
a) Regional Agroindustrial Center(*) The government has identified the Regional Agroindustrial Centers (RAICs) (sometimes called Growth Centers or formerly known as the Regional Industrial Centers) for the purpose of encouraging dispersal of industrial activities to areas outside of Metro Manila. The centers include infrastructure to ensure that firms in those centers would be competitive against those located in Metro Manila. At present, among identified 21 RAICs (Figure 2.2.10), eight are operating while the rest are under pre-operation.
b) Growth Network(*) The government also has a strategy to establish a growth network and corridors to strengthen linkage among regions or provinces to optimize the use of resources and encourage completion of local development strategies. As the primary and secondary industrial cores, NCR including Region 3 and 4; and Cebu-Cagayan de Oro area including the Davao-Cotabato-Zamboanga have been identified respectively. Other growth networks and corridors are introduced in Figure 2.2.10.
c) Provincial Agroindustrial Center(*) The Provincial Agroindustrial Centers (PAICs) are intended to complete regional industrial cores and corridors, and to provide agglomeration and scale economies in strategic provinces or area. Catering to small and medium scale industries that are largely dependent on locally available raw materials, PAICs intend to channel the benefits of industrial development to surrounding localities. There are 20 provinces identified as priority areas for PAIC development (Figure 2.2.10).
(*)Data Source NLUC/NEDA, National Framework for Physical Planning 2001-2030
2-23
Source: Ayabe and Ishii, Motto Shiritai Philippine (To know more about the Philippines)
Figure 2.2.8 Major area of Agricultural Crop Production
PALAY
COCONUT
CORN
SUGARCANE
ABACA
AREAS OF CROP PRODUCTION

2-
24
Tabl
e 2.
2.5.
SA
FDZ
conv
erge
nce
area
s cum
inve
stm
ent p
rogr
ams b
y re
gion
, as o
f Apr
il 20
00
Regi
onIn
vest
men
t Pro
gram
Regi
onIn
vest
men
t Pro
gram
CAR
27.
Ti
tay
and
Adja
cent
Mun
icipa
lities
Con
verg
ence
Zon
e1.
Tem
pera
te V
eget
able
, Roo
tcro
p, a
nd F
ruit
Crop
Dev
elop
men
t Zon
e28
.
Sal
ug V
alle
y Co
nver
genc
e Zo
ne2.
Res
ervo
ir Ag
ro-F
isher
ies
deve
lopm
ent a
nd M
anag
emen
t Zon
e29
.
DDK
RM In
dust
rial C
orrid
or &
Adj
acen
t Mun
icipa
lities
Con
verg
ence
Zon
eI
30.
SAFD
Z In
tegr
ated
Agr
o-Fi
sher
ies
Inve
stm
ent P
roje
ct3.
Ilo
cos
Gar
lic-O
nion
-Gin
ger C
onve
rgen
ce Z
one
31.
Zam
boan
ga C
ity C
onve
rgen
ce Z
one
Inte
grat
ed F
isher
ies
Inve
stm
ent P
rogr
am4.
Bee
f-Che
von-
Corn
Con
verg
ence
Zon
e32
. Ba
silan
SAF
DZ P
riorit
y In
vest
men
t5.
Met
ro S
an F
erna
ndo
Agro
-Indu
stria
l and
Tou
rism
Con
verg
ence
Zon
e33
.
5
-Yea
r SAF
DZ F
isher
ies
Inve
stm
ent a
nd D
evel
opm
ent P
rogr
am6.
Bra
ckish
Wat
er A
quac
ultu
re Ir
rigat
ion
Syst
emX
II34
.
H
ighl
and
Plat
eau
Deve
lopm
ent P
roje
ct7.
Isa
bela
Inte
grat
ed C
orn,
Live
stoc
k, P
oultr
y an
d Fi
sher
y In
vest
men
t Pro
gram
35.
SAF
DZ F
isher
y In
vest
men
t Are
asIII
XI8.
Nue
va E
cija
Rice
-Oni
on B
ased
Dev
elop
men
t Are
a (N
ERO
DA)
36.
Sea
weed
s Pr
oduc
tion
9.
P
ampa
nga-
Bata
an-B
ulac
an W
etla
nd D
evel
opm
ent C
onve
rgen
ce Z
one
37.
Dur
ian
Deve
lopm
ent P
rogr
am U
nder
the
Conv
erge
nce
Devt
of S
outh
ern
Min
dana
oIV
XII
10.
Sea
weed
s Pr
oduc
tion
and
Proc
essin
g38
.
M
odel
Far
m fo
r Aqu
acul
ture
Sys
tem
sV
39.
Mul
ti-St
orey
/Mul
tiple
Cro
ppin
g of
HVC
C in
Coc
onut
Far
ms
11.
Pili
Regi
onal
Dev
elop
men
t Pro
gram
40.
Bai
Ser
apin
ang
Mul
ti-Pu
rpos
e Co
op M
odel
Far
m D
evel
opm
ent (
Corn
-Bas
ed In
tegr
ated
Far
min
g Sy
stem
)12
. O
pera
tion
of M
aricu
lture
Pro
ject
s on
Milk
fish
and
Seaw
eed
(Euc
hem
a)41
.
F
eder
atio
n of
Sm
all F
arm
ers
Ass’n
of M
’lang
(Int
egra
ted
Rice
Pro
dn M
odel
Far
m)
VI42
.
M
idpa
pan
1 an
d 2
Farm
enrs
Ass
ocia
tion
Mod
el F
arm
Dev
elop
men
t (Ri
ce-B
ased
Far
min
g Sy
stem
s)13
. B
ucar
i Agr
icultu
ral D
evel
opm
ent P
roje
ctXI
II14
. W
este
rn V
isaya
s St
rate
gic
Agric
ultu
re D
evel
opm
ent P
rogr
am43
.
S
eawe
eds
Farm
ing
(Sur
igao
del
Nor
te)
15.
Ant
ique
Fish
erie
s an
d Aq
uacu
lture
Cen
ter
44.
CAR
AGA
Deve
lopm
ent Z
one
16.
Cap
iz W
etla
nds-
Rice
Dev
elop
men
t Con
verg
ence
Zon
eAR
MM
17.
Ban
ate
Bay
Reso
urce
man
agem
ent P
roje
ct45
.
C
attle
Fat
teni
ng18
. T
obos
o Fo
od S
ecur
ity: T
he C
oast
al R
esou
rce
Mod
erni
zatio
n Pl
an46
.
L
ivest
ock
Deve
lopm
ent (
Sulu
)VI
I47
.
L
ivest
ock
Deve
lopm
ent (
Tawi
-Taw
i)19
. R
ice-B
ased
Dev
elop
men
t Zon
e (B
ohol
)48
.
C
rabm
eat P
roce
ssin
g20
. C
eleb
osol
e G
rowt
h Zo
ne F
isher
ies
Deve
lopm
ent P
rogr
am49
.
O
ff-Sh
ore
Deve
lopm
ent P
roje
ct21
. D
airy
Pro
gram
Exp
ansio
n an
d De
velo
pmen
t in
Cebu
Con
v. Z
one
50.
Live
stoc
k De
velo
pmen
t (M
agui
ndan
ao)
22.
Man
go In
dust
ry D
evel
opm
ent i
n ce
ntra
l Visa
yas
51.
Cor
n Pr
oces
sing
Deve
lopm
ent
VIII
52.
Int
egra
ted
Fish
ery
Deve
lopm
ent P
roje
ct23
. S
an J
uani
co F
isher
ies
Econ
omic
Zone
53.
Live
stoc
k De
velo
pmen
t (La
nao
del S
ur)
24.
Ley
te 2
Rice
Com
mer
cializ
atio
n Pr
ogra
m54
.
F
ish P
rese
rvat
ion
Deve
lopm
ent
25.
Sea
weed
s In
dust
rializ
atio
n Pr
ojec
t55
.
S
ulu-
Tawi
-Taw
i Fish
ery
Deve
lopm
ent C
onve
rgen
ce Z
one
IX26
.
Sibu
guey
Val
ley
and
Adja
cent
Mun
icipa
lities
Con
verg
ence
Zon
eSo
urce
: Nat
iona
l SAF
DZ C
omm
ittee
Sec
reta
riat,
BSW
M, 2
000.
NL
UC
/NE
DA
, NFP
P

2-25
d) Special Economic Zones The Special Economic Zone Acts or RA7916 provided the framework to establish and operate the Special Economic Zones (SEZs or Ecozones), and created the Philippine Economic Zone Authority (PEZA).
The Base Conversion and Development Act or RA7227 created the Base Conversion Development Authority (BCDA) to transform the previous US military facilities into SEZs or other industrial development purposes.
SEZs are selected areas with highly developed or which have the potential to be developed into agroindustrial, industrial, tourism, commercial, banking investment and financial centers. There are 37 areas that have been identified for SEZ development including potential ecozones (see Figure 3.2.1). Of the already 160 SEZs registered with PEZA as of 2001, 82 are proclaimed and 56 are located (see Appendix 2.2.3). Five SEZs are managed by BCDA such as Subic Bay Special Economic and Free port Zone, Clark Special Economic Zone, John Hay Special Economic Zone, Poro Point Special Economic Zone and Bataan Technological Park.
Reflecting the medium term strategy focusing on information and communications technology (ICT) sector, and under the guidelines for the establishment and operation issued by PEZA, there are IT parks among these SEZs to provide necessary infrastructures for IT business. PEZA offers the following incentives for SEZs:
- Income Tax Holiday (ITH) or Exemption from Corporate Income Tax for four years,
extendable to a maximum of eight years; After the ITH period, the option to pay a special 5% Tax on Gross Income, in lieu of all national and local taxes;
- Exemption from duties and taxes on imported capital equipment, spare parts, supplies, raw materials. Also breeding stocks and/or genetic materials or the equivalent tax credit on these items, when sourced locally;
- Domestic sales allowance equivalent to 30% of total sales; - Exemption from wharfage dues and export taxes, imposts and fees; - Permanent resident status for foreign investors and immediate family members; - Employment of foreign nationals; - Simplified import and export procedures; - Other incentives under Executive Order 226 (Omnibus Investment Code of 1987), as may
be determined by the PEZA Board

2-26
The incentives adopted by BCDA are the same as ones by PEZA except for the special income tax of 5% from the beginning year. Consequently, the investment in PEZA has successfuly risen although sudden drop after 2001 has happened presumely due to the peace and order problem. The total amount of investment from 1995 to 2002 reached 806 billion pesos and 58% of that was invested in the labor-intensive business of electrical parts and products. The dominant nationality is Japan (41%) followed by Philipino (17%) (see Figure 2.2.9).
Data Source: PEZA
Figure 2.2.9 Ecozone Investments
Figure 2.2.11 presents the location of SEZs where many electronics industries locate and assemble labor-intensive products. This figure includes potential areas of SEZ.
LOCATOR INVESTMENTS BY PRODUCT SECTORLOCATOR INVESTMENTS BY PRODUCT SECTOR( 1995 ( 1995 -- 2002 )2002 )
12.8 %12.8 % Electrical MachineryElectrical Machinery
Chemical & ChemicalChemical & ChemicalProductsProducts
3.6 %3.6 %
Rubber & PlasticRubber & PlasticProductsProducts
2.4 %2.4 %
Medical & Precision Medical & Precision InstrumentsInstruments
2.3 %2.3 %
Garments & TextilesGarments & Textiles1.5 %1.5 %
Other ManufacturesOther Manufactures10.9 %10.9 %
58.0 % 58.0 %
ElectronicElectronicParts Parts
& & ProductsProducts
IT ServicesIT Services1.0 %1.0 %
Transport /Car PartsTransport /Car Parts7.5 %7.5 %
LOCATOR INVESTMENTS BY NATIONALITYLOCATOR INVESTMENTS BY NATIONALITY( 1995 ( 1995 -- 2002 )2002 )
41.1 % 41.1 % JapaneseJapanese
17.4 % 17.4 % FilipinoFilipino12.6 % 12.6 % AmericanAmerican
7.8 % 7.8 % DutchDutch5.9 % 5.9 % BritishBritish5.1 % 5.1 % SingaporeanSingaporean3.6 % 3.6 % Korean Korean 2.4 % 2.4 % German German 0.9 % 0.9 % TaiwaneseTaiwanese0.8 % 0.8 % Malaysian Malaysian 2.4 % 2.4 % OthersOthers

2-27
3) Tourism The Tourism Master Plan (TMP)has the following objectives: (a) optimize the contribution of tourism to economic growth at the national and regional levels, (b) enhance and contribute to social cohesion and cultural preservation at the local level, (c) develop tourism on an environmentally sustainable basis, (d) develop a diversity of destinations, attractions and markets to minimize exposure to major external and international threats to tourism activity. The PMP has identified the priority tourism areas as shown in Figure 2.2.10. These include: Samal Island, Davao del Norte, Oanglao Island, Bohol, Nortern Palawan, Batangas, Taal, Tagaytay, Baguio, La Union, Ilocos Sur, and Ilocos Norte. In line with the TMP 's objective of developing more tourism products to attract larger volume of tourists, the Department of Tourism (DOT) under cooperation with the Department of Agriculture (DA) and other relevant authorities has initiated a program called Philippine Agri-Tourism Program. The objectives of Agri-tourism are as follows:
a) To diversify the local economic base thorough the introduction of another economic activity supplementing agriculture,
b) To generate local employment and provide new opportunities for the underemployed, and c) To help maintain the rural landscape by providing motivation to maintain farms through the
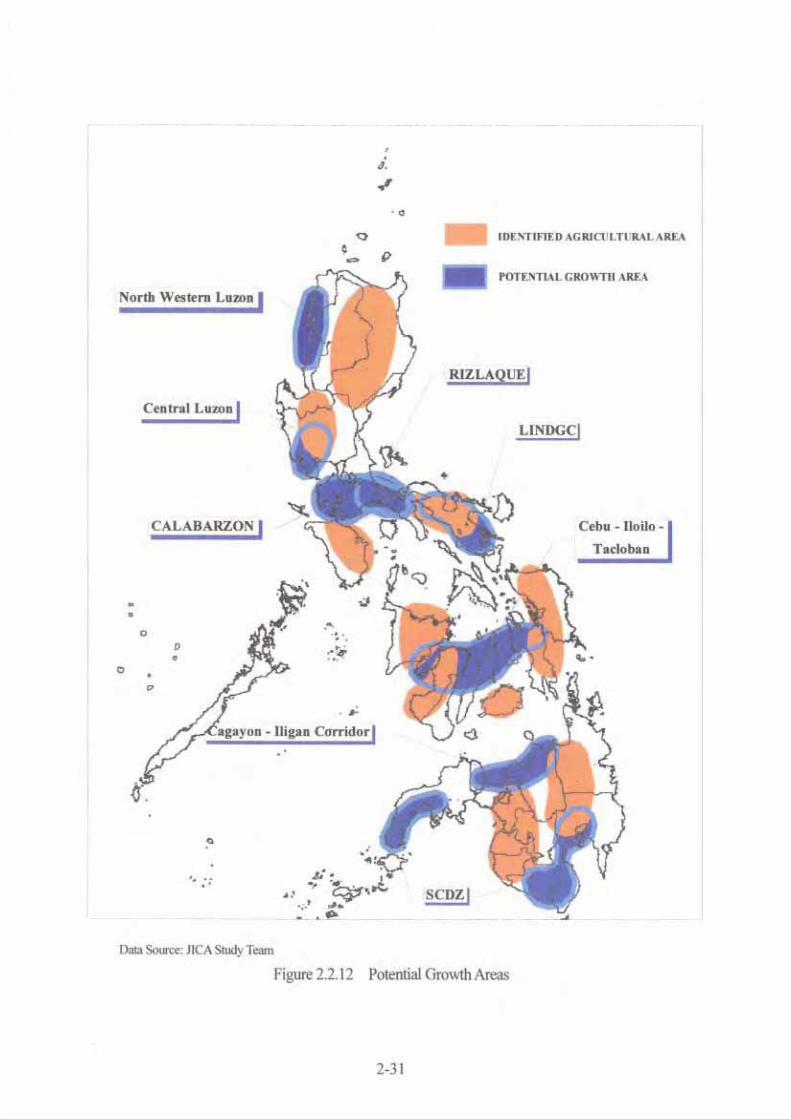
economic benefits to tourism. The Agri-tourism Program aims to provide tourists with opportunities to visit selected farm areas and discover the different agricultural products and techniques of production in the visited area. The model sites currently identified include the Central Luzon State University (CLSU) for on-farm activities and visit to research institutes, Oro Verde in Visayas for a mango farm tour, Del Monte Farm in Mindanao for a visit to a pineapple farm. 4) Potential Growth Area With reference to the distribution of projected population and GRDP, and above location map, the Study Team identified eight potential growth areas as shown in Table 2.2.6 (See also Figure 2.2.12 ), which would become core centers of economic development and possess high growth possibility. Those areas may mostly coincide with densely populated areas since population dependent growth is expected. The potential of those areas can be evaluated, by way of example, with the growth of cargo traffic at linked ports as selected in Table 2.2.6. The estimated high growth ratio (4.6) of the cargo at all linked ports during 2001-2024 as compared with one (2.9) at major public ports will be apparently derived from expanding activities in the identified potential areas.

2-28
Table 2.2.6 Potential Growth Areas and Major Link Ports
Cargo Volume(2001, MT)
Cargo Volume(2024, MT)
GrowthRatio2001-2024
Major Commodity
(a) North Western Luzon San Fernando NA 2,008,233 - NA
(b) Central Luzon Subic 997,000 9,522,238 9.6 NA
(c) CALABARZON (Cavite-Laguna-Batangas-Rizal-Quezon) Batangas 1,044,563 25,977,951 24.9 Transport Equipment,
Iron & Steel
(d) RIZLAQUE (Rizal-Laguna-Quezon) Pan Phil Highway - - - -
(e) LINDGC (Legaspi-Iriga-Naga-Daet Growth Corridor).
Legaspi / Pan PhilHighway 365,535 895,030 2.4 Cement
Cebu 9,159,243 29,243,250 3.2 NA
Iloilo 2,586,033 6,661,022 2.6Other General Cargo,Wheat, Cement, BottledCargo, Palay&Rice
Tacloban 614,632 2,127,376 3.5 Other General Cargo,Copra, Cement
Sub-total 12,359,908 38,031,648 3.1
(g) Cagayan-Iligan Corridor CDO 2,717,290 8,768,677 3.2Other General Cargo,Corn, Fertilizer,Palay&Rice,
Davao 2,492,689 9,356,415 3.8Other General Cargo,Cement, Fertilizer,Logs, Paper&Pulp
Gen Santos 1,575,894 6,094,118 3.9 Other General Cargo,Cement, Fertilizer
Zamboanga 1,253,679 5,195,721 4.1 Other General Cargo,Palay&Rice
Sub-total 5,322,262 20,646,254 3.9
22,806,558 105,850,031 4.6
67,746,769 198,100,990 2.9
Port Cargo
Source: JICA Study Team based on PPA
Potential Growth Area Identified bythe Study Team
Major Link Port /Road
All Linked Ports Total
Major Public Ports Total (Table 5.8.1)
(f) Cebu-Iloilo-Tacloban
(h) SCDZ (South Cotabato-Davao-Zamboanga)
2-29
Data Source NLUC/NEDA, National Framework for Physical Planning 2001-2030 Figure 2.2.10 Industrial Areas
LEGEND:
Pre-Operating RegionalAgroindustrial Center (RAIC)
Operating ExportProcessing Zone / RAIC
Provincial AgroindustrialCenter (PAIC)
Priority PAIC withFeasibility Study
Priority Tourismdevelopement areas
Bicol RGC
Eastern Visayas RGC
ARMM RGCMetro Cotabato
Metro Iligan RAIC Del Norte IE
RAIC
Baguio City
Catbalogan
LEGEND:
SUDOPARIM
SOKSARGEN
S.Cotabato-Davao-
Cagayan -Iligan Corridor
Naga-Iriga-Legaspi
MIMAROPA
RIZLAQUE
CALABARZON
Central Luzon Devt.Program
Tuguegarao-Ilagan-Cauayan
North Western LuzonGrowth Squad.
This area belongs to both RIZLAQUE/CALABARZONGrowth Networks.
Cebu-Iloilo- Tacloban
Zamboanga (SCDZ)
This area belongs to both SCDZ/SOKSARGENGrowth Networks
Sta.Ana RGC
CAR RGC
Cauayan RGC
Palayan City
Kauswagan
Hacienda Espina IE
Panabo
Bislig
Bacnotan RGC
Laoag City Lai-lo
Tayum
Sual
Hermosa RGC
Bataan EPZ
Cavite EPZ
Batangas RGC Milaor
Pavia RGC
Mactan EPZ
Ormor City
Malaybalay
Nasipit Agusan
Ayala De Zamboanga IP
Pres.Manuel Roxas
Davao RGCMalabang
PHIVIDEC IE
San Jose

2-30
Data Source: PEZA, NLUC/NEDA, National Framework for Physical Planning 2001-2030
Figure 2.2.11 Location of Special Economic Zones
LEGEND:Operating
Proclaimed
Devt. in Progress
Potential Ecozone
Ecozones (BCDA)
Economic Zoneand Freeport
FIG 2.2.11

2-32
2.2.3 Trade Major trade partners of the Philippines are shown in Figure 2.2.13. USA and Japan have been the dominant countries.
0
2,000
4,000
6,000
8,000
10,000
12,000
14,000
16,000
USA
Japa
n
Sing
apor
e
Taiw
an
Kor
ea, R
epub
lic o
f
Hon
gkon
g
Thai
land
Mal
aysi
a
Chi
na
Saud
i Ara
bia
Indo
nesi
a
Oth
ers
Country/region
Val
ue (
mill
ion
US d
olla
r)
Exports in 1991Imports in 1991
0
2,000
4,000
6,000
8,000
10,000
12,000
14,000
16,000
USA
Japa
n
Sing
apor
e
Taiw
an
Kor
ea, R
epub
lic o
f
Hon
gkon
g
Thai
land
Mal
aysi
a
Chi
na
Saud
i Ara
bia
Indo
nesi
a
Oth
ers
Country/region
Val
ue (
mill
ion
US d
olla
r)
Exports in 2001Imports in 2001
Source: NSCB (2002, 2000), Philippine Statistical Yearbook
Figure 2.2.13 Trade partner in 1991 and 2001 Value of the foreign trade has been rapidly increasing since the 1990’s, and there has been a trade surplus since 1998. In the same period, the share of the foreign trade has reached 40%-50% (Figure 2.2.14). Data Source: NSCB, Philippine Statistical Year Book 2002
Figure 2.2.14 Foreign Trade
Foreign Trade (1971-2001)
0
5,000
10,000
15,000
20,000
25,000
30,000
35,000
40,000
1971
1972
1973
1974
1975
1976
1977
1978
1979
1980
1981
1982
1983
1984
1985
1986
1987
1988
1989
1990
1991
1992
1993
1994
1995
1996
1997
1998
1999
2000
2001
F.O
.B. V
alue
in m
illio
n U
SD Export
Import

2-33
Data Source: NSCB, Philippine Statistical Year Book 2002 Figure 2.2.15 GDP Export / Import Ratio
The trade has expanded owing mainly to the electronics industry which is responsible for one half and one fifth of the total exports and imports, respectively (Table 2.2.7). Most of the electronics factories are located in the Special Economic Zones. They have been producing intermediate goods using imported raw material and relatively well educated labor forces. This trade trend will continue provided that the investment circumstances be maintained and improved, and a higher quality of labor be secured. It can be said, however, that one of the challenge the Philippines faces currently is how to make its own industries more value-added ones. It is obvious that labor-intensive industries (such as simply assemble industries) will face difficulties sooner or later when other countries with cheaper labor emerge.
GDP Export/Import Ratio
0.0%
10.0%
20.0%
30.0%
40.0%
50.0%
60.0%
1971
1973
1975
1977
1979
1981
1983
1985
1987
1989
1991
1993
1995
1997
1999
2001
Per
cent
age
to G
DP
Export
Import

2-34
Table 2.2.7 Top Ten Principal Commodities in Foreign Trade (2001)
Export
Total Amount (F.O.B. million USD) 32,150 Share
Elect. & elect'l equipment/parts & telecom 16,70752.0%
Machinery & transport equipment 6,132 19.1% Garments 2,403 7.5% Coconut oil 418 1.3% Processed food and beverages 337 1.0% Chemicals 318 1.0% Furniture and fixtures 298 0.9% Bananas 297 0.9% Fish, fresh or preserved 287 0.9% Copper metal 256 0.8%
Import
Total Amount (F.O.B. million USD) 29,551 Share Electronics and components 5,568 18.8%
Mineral fuels, lubricants, and related materials 3,37211.4%
Telecommunication equipment and electrical machinery 3,09310.5%
Office and electronic data processing machines 2,2317.5%
Industrial machinery and equipment 1,5685.3%
Materials and accessories for the manufacture of electronicequipment
1,2144.1%
Transport equipment 1,1093.8%
Textile yarns, fabrics, made-up articles, and related products 1,0843.7%
Iron and steel 833 2.8%Cereals and cereal preparations 646 2.2%
2001
2001
Data Source: NSCB, Philippine Statistical Year Book 2002 / NSO Philippine Yearbook 2002

2-35
2.3 National Development Plans 2.3.1 Planning Scheme Figure 2.3.1 indicates a comprehensive scheme in terms of the national and regional development plans. Among hierarchic plans, PNDP (Philippine National Development Plan) only describes the long-term vision, while MTPDP (Medium Term Philippine Development Plan) reflects the opinion of the current administration with the function of short-medium range development. The vision statement in PNDP, medium term outlook in MTPDP, outline of NFPP and RDP are reviewed in this section. Data Source: NEDA
Figure 2.3.1 National and Regional Development Planning Scheme 2.3.2 The Philippine National Development Plan for the 21st Century (PNDP) In 1998, the Philippine government formulated PNDP in response to the order of President Ramos for close collaboration among government agencies, private/non-government sectors. Although PNDP is prepared by a past President, the principal concept of the Plan has been adopted by subsequent administrations. The principal idea of the Plan is to promote modernization of all sectors of the economy (i.e.
L a n d / R e s o u r c e U s e P la n
E c o n o m i c D e v e lo p m e n t
P la n
I n v e s t m e n t P r o g r a m
N a t i o n a l F r a m e w o r k P N D P
N a t i o n a l N F P P M T P D P M T P I P
R e g i o n R P F P R D P R D I P
P r o v i n c e P P F P P D P P D I P
C i t y / M u n i c i p a l i t y C L U P C / M D P
N o t e s : N a t io n a l F r a m e w o r k f o r P h y s ic a l P la n n in g ( N F P P )R e g io n a l P h y s ic a l F r a m e w o r k P la n ( R P F P )P r o v in c ia l P h y s ic a l F r a m e w o r k P la n ( R P F P )C it y L a n d U s e P la n ( C L U P )P h ilip p in e N a t io n a l D e v e lo p m e n t P la n ( P N D P )M e d iu m - T e r m P h ilip p in e D e v e lo p m e n t P la n ( M T P D P )R e g io n a l D e v e lo p m e n t P la n ( R D P )P r o v in c ia l D e v e lo p m e n t P la n ( P D P )C it y / M u n ic ip a lit y D e v e lo p m e n t P la n ( C / M D P )M e d iu m - T e r m P h ilip p in e I n v e s t m e n t P r o g r a m ( M T P I P )R e g io n a l D e v e lo p m e n t I n v e s t m e n t P r o g r a m ( R D I P )P r o v in c ia l D e v e lo p m e n t I n v e s t m e n t P la n ( P D I P )

2-36
CENTRAL VISAYASISLANDS
NORTH MINDANAO
SOUTHMINDANAO
WESTMINDANAO
METROPOLITAN MANILAGROWTH NETWORK
BICOL PENINSULA-SAMAR-LEYTE ISANDS
SURIGAO CLUSTER
NORTH LUZON
WEST VISAYASISLAND GROUP
SOUTHWESTERNLUZON ISLANDS
REGION I
CAR REGION II
REGION III
REGION IV-A
REGION V
REGION VIII
REGION XIII
REGION XI REGION XII
ARMM
REGION IX
REGION X
REGION VII
REGION VI
REGION IV-B
NCR
agriculture, industry and services sectors). On one hand, the Plan argues that integration of markets is necessary to spread modernization all over the Philippines. Thus, one of the roles of infrastructure is to establish a physical network of spread markets in order to enhance the integration of the markets. According to the Plan, it is understood that 'physical integration through investments in transportation and communication reduces transaction costs in production and marketing of goods and services'. In other words, the improvement of economic efficiency is stressed. PNDP identified five strategies for the regional development: (a) national dispersion through regional concentration; (b) strengthening urban-rural linkages; (c) resource- and area-based development; (d) effective regional development administration; and (e) delivery of minimum desirable level of welfare. PNDP especially emphasized the improvement of transportation and telecommunications linkage; importance of the agricultural sector; potential human and natural resources; and stable employment and sufficient incomes. The Regional Development Groupings as described by PNDP are illustrated in Figure 2.3.2.
Data Source: NEDA Figure 2.3.2 Regional Grouping

2-37
In relation to the eight potential areas identified by the Study Team in the previous section (see Figure 2.2.9), seven potential groups nominated in PNDP are extracted as below. (1) North Luzon This group is strategically located and can serve as the country’s link to Taiwan, Southern China, Hong Kong, Japan and Korea. Ports of entry include the Laoag International Airport in Ilocos Norte and Port Irene in Cagayan. While North Luzon is still largely agricultural, it has pockets of industrial areas that can anchor the modernization of the agriculture sector. In particular, existing and designated special economic zones (SEZs) such as Baguio Export Processing Zone in Baguio City, the Poro Point SEZ in La Union and the Cagayan SEZ and Free Port in Sta. Ana, Cagayan, can accommodate various types of industrial activities. However, adequate access such as east-west lateral roads and effective linkage between urban centers, and countermeasures for landslides and erosions are required. (2) Metro Manila Growth Network This group provides textile, garments and consumer electronics factories in Cavite-Laguna-Batangas-Rizal-Quezon (CALABARZON), specialized industries and processing activities in Subic and Clark SEZ, and port-oriented industries in Batangas. Manila-Rizal-Laguna-Quezon (MARILAQUE) is considered as a potential expansion area from Manila, and the north and south of Manila are used for prime agricultural land. However, the issue of the environment which is threatened by increased population density and industrial activities needs to be addressed to ensure sustainable development. (3) Bicol Peninsula-Smar- Leyte Islands-Surigao Cluster Pan-Philippine Highway connects this regional group to provide interregional access and market potential such as Cebu. Tacloban is a main transport hub. Ormoc functions as passenger and cargo outlet port to Cebu and other areas. Pantao is a regional port. Libon is boosting the development of Legaspi-Iriga-Naga-Daet Growth Corridor (LINDGC). Furthermore, geothermal energy can be generated. Commercial cattle are raised in Masbate. Vast agricultural areas are reserved in Samar-Lyete. However, sufficient road system in Surigao-Davao area, irrigation facilities in Smal-Lyete are required. (4) Central Visayas Islands This group includes Metro Cebu, and its linkage and influence to the neighboring islands and urban centers such as Carmen, Danao, San Fernando, Tagbilaran, Ormoc, Dumaguerte and San Carlos. There are modern transportation and communication facilities, developed ferry services, and

2-38
substantial agricultural land in Bohol and Negros. Domestic and ocean going vessels are handled in Mandaue-Cebu City harbor. However, rapid urbanization, limited capacity of the agriculture productions, lack of water resources and power supply are issues that have to be resolved if this area is to realize its full potential. (5) West Visayas Island Group The group possesses strong economic links between Panay, Negros and Guimaras Islands, rich mineral reserves, marine, fishery and aquaculture potentials for exports, large agriculture bases, agri-based and light to medium scale industries, geothermal energy and tourism. Iloilo services domestic and international traffic. However, agricultural intensification after reaching peak expansion, siltation, flooding, massive destruction of mangroves and coral reefs by shrimp producers are issues that need to be dealt with. (6) North Mindanao In this group, there is the Cagayan-Iligan industrial corridor, iron and steel based industries, forestry, high-valued crops providing to agri-business firms, rich metallic and non-metallic mineral deposits, tourism, and opportunities of economic ties with Pacific Islands in the market of agriculture and processed foods. High literate and skilled manpower exist. However, development of seaports and major roads to improve linkage with the rest of the islands, adequate irrigation and post-harvest facilities are issues that need to be tackled. (7) South Mindanao This group has robust agricultural and processing sectors, good link between Davao and Cagayan de Oro, three major deep-water ports of Polloc, Sasa, and Gen. Santos as the outlet for exports, major urban centers of Davao, Gen. Santos, Cotabato and Marawi. In addition, participation of the private sector especially in agri-business farms increases the potential of this area. But, inadequate agricultural facilities, poor natural resource management, high transportation cost to Luzon and Visayas, high power transmission cost, weak private sector organization at the southwest part, and widespread poverty are issues requiring attention. Transportation and telecommunication linkages with the rest of islands and international markets, basic agricultural credit and infrastructure facilities, sustainable use and management of natural resources are required to address these weaknesses.
2.3.3 The Medium-Term Philippine Development Plan 2001-2004 (MTPDP) MTPDP was set up by the newly born Arroyo administration after the Estrada administration. Based on the notion of antipoverty in the Philippines, MTPDP embodies the overall development framework, which consists of four major policies: that is, 'macroeconomic stability with equitable
2-39
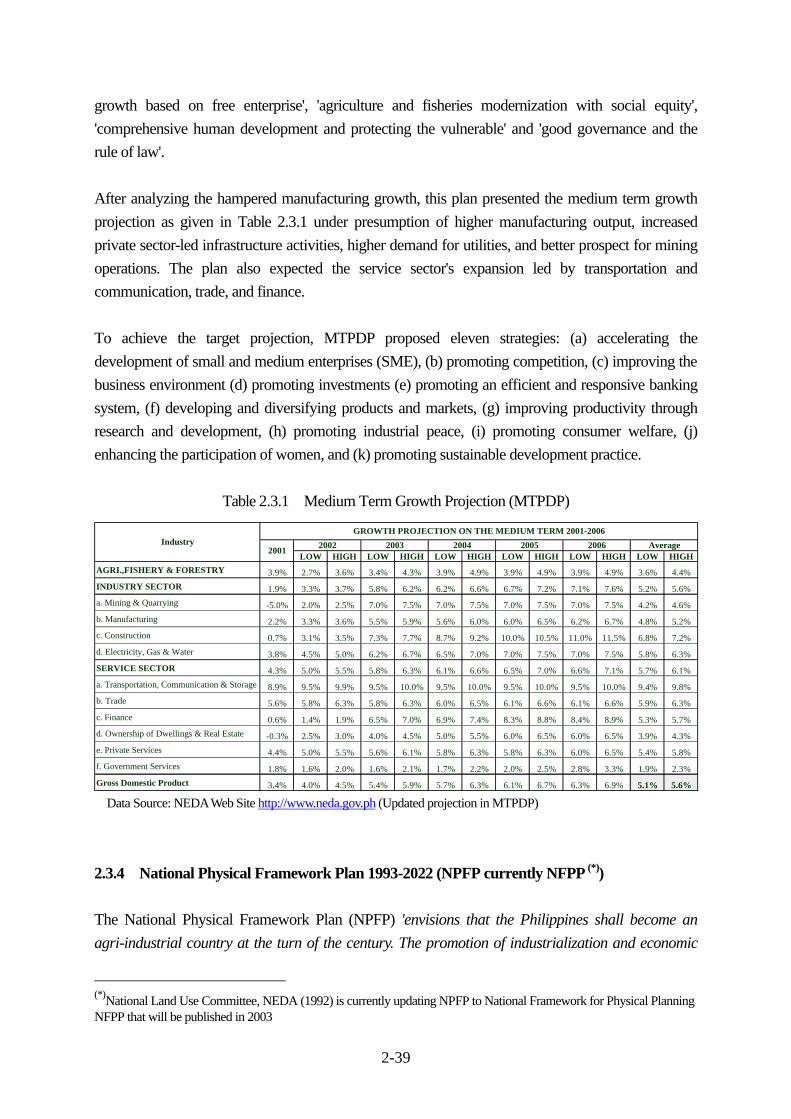
growth based on free enterprise', 'agriculture and fisheries modernization with social equity', 'comprehensive human development and protecting the vulnerable' and 'good governance and the rule of law'. After analyzing the hampered manufacturing growth, this plan presented the medium term growth projection as given in Table 2.3.1 under presumption of higher manufacturing output, increased private sector-led infrastructure activities, higher demand for utilities, and better prospect for mining operations. The plan also expected the service sector's expansion led by transportation and communication, trade, and finance. To achieve the target projection, MTPDP proposed eleven strategies: (a) accelerating the development of small and medium enterprises (SME), (b) promoting competition, (c) improving the business environment (d) promoting investments (e) promoting an efficient and responsive banking system, (f) developing and diversifying products and markets, (g) improving productivity through research and development, (h) promoting industrial peace, (i) promoting consumer welfare, (j) enhancing the participation of women, and (k) promoting sustainable development practice.
Table 2.3.1 Medium Term Growth Projection (MTPDP)
Data Source: NEDA Web Site http://www.neda.gov.ph (Updated projection in MTPDP) 2.3.4 National Physical Framework Plan 1993-2022 (NPFP currently NFPP (*)) The National Physical Framework Plan (NPFP) 'envisions that the Philippines shall become an agri-industrial country at the turn of the century. The promotion of industrialization and economic
(*)National Land Use Committee, NEDA (1992) is currently updating NPFP to National Framework for Physical Planning NFPP that will be published in 2003
LOW HIGH LOW HIGH LOW HIGH LOW HIGH LOW HIGH LOW HIGH
AGRI.,FISHERY & FORESTRY 3.9% 2.7% 3.6% 3.4% 4.3% 3.9% 4.9% 3.9% 4.9% 3.9% 4.9% 3.6% 4.4%
INDUSTRY SECTOR 1.9% 3.3% 3.7% 5.8% 6.2% 6.2% 6.6% 6.7% 7.2% 7.1% 7.6% 5.2% 5.6%
a. Mining & Quarrying -5.0% 2.0% 2.5% 7.0% 7.5% 7.0% 7.5% 7.0% 7.5% 7.0% 7.5% 4.2% 4.6%
b. Manufacturing 2.2% 3.3% 3.6% 5.5% 5.9% 5.6% 6.0% 6.0% 6.5% 6.2% 6.7% 4.8% 5.2%
c. Construction 0.7% 3.1% 3.5% 7.3% 7.7% 8.7% 9.2% 10.0% 10.5% 11.0% 11.5% 6.8% 7.2%
d. Electricity, Gas & Water 3.8% 4.5% 5.0% 6.2% 6.7% 6.5% 7.0% 7.0% 7.5% 7.0% 7.5% 5.8% 6.3%
SERVICE SECTOR 4.3% 5.0% 5.5% 5.8% 6.3% 6.1% 6.6% 6.5% 7.0% 6.6% 7.1% 5.7% 6.1%
a. Transportation, Communication & Storage 8.9% 9.5% 9.9% 9.5% 10.0% 9.5% 10.0% 9.5% 10.0% 9.5% 10.0% 9.4% 9.8%
b. Trade 5.6% 5.8% 6.3% 5.8% 6.3% 6.0% 6.5% 6.1% 6.6% 6.1% 6.6% 5.9% 6.3%
c. Finance 0.6% 1.4% 1.9% 6.5% 7.0% 6.9% 7.4% 8.3% 8.8% 8.4% 8.9% 5.3% 5.7%
d. Ownership of Dwellings & Real Estate -0.3% 2.5% 3.0% 4.0% 4.5% 5.0% 5.5% 6.0% 6.5% 6.0% 6.5% 3.9% 4.3%
e. Private Services 4.4% 5.0% 5.5% 5.6% 6.1% 5.8% 6.3% 5.8% 6.3% 6.0% 6.5% 5.4% 5.8%
f. Government Services 1.8% 1.6% 2.0% 1.6% 2.1% 1.7% 2.2% 2.0% 2.5% 2.8% 3.3% 1.9% 2.3%
Gross Domestic Product 3.4% 4.0% 4.5% 5.4% 5.9% 5.7% 6.3% 6.1% 6.7% 6.3% 6.9% 5.1% 5.6%
GROWTH PROJECTION ON THE MEDIUM TERM 2001-2006
20012002 2003 2004 2005 2006 AverageIndustry

2-40
growth shall be based on sound agricultural development that is conscious of the limitations of natural and other physical resources to effect a sustainable development'. In order to carry out the vision, NPFP includes policies on land usage of agricultural, forests, mining, industrial development and tourism development areas. It also expects the infrastructure system to provide 'the essential physical contribution for the integration of national development goals'. More specifically, with regard to port development, NPFP stresses the importance of port development including Ro/Ro ports especially in Visayas area and feeder ports system. 2.3.5 The Regional Development Plans (RDPs) Along the planning scheme in Figure 2.3.1, the Regional Development Councils (RDCs), which are organized by the relevant Governmental Departments and LGUs under coordination of NEDA, have formulated the Regional Development Plans 2001-2004 (RDPs) as accompanying documents of MTPDP. The major implementation port projects or programs in the RDPs are summarized in Figure 2.3.3. It is noted that all of RDPs do not describe their port development, and there is no detailed development scheme. (See Appendix 2.3)
APARRI
CURRIMAO
SN FERNANDO
SUAL
BATANGAS
ROXAS CITY
DUMANGASILOILO
JORDAN
PULUPANDAN
CALBAYOG
CATBALOGANNAVAL
SN ISIDRO
PALOMPONORMOC
BAYBAY
MAASIN
DUMAGUETE
PAGADIAN
ALABEL
GLANMAASIM
POLLOC
MALABANG
ZAMBOANGABASILAN
JOLO
PANAMAO
BONGAOS ETANGKAI
M ICP
CABANO
PULAUAN
CATICLAN
SASA
IRENE
BASCO
Figure 2.3.3 Proposed Port Development in Regional Development Plans

3-1
Chapter 3 Natural Conditions Some natural conditions strongly restrict or conversely encourage socio economic activities. In this section, major natural conditions which affect port activities are reviewed. 3.1 Physical Conditions 3.1.1 Geographic Location The Philippines is located on the opposite side of the South China Sea from Taiwan, China, Viet Nam and Malay Peninsula. This location offers easy access to those countries. The linear distance between Manila and those countries is indicated in Figure3.1.1.
Source: Microsoft Encarta
Figure 3.1.1 Geographic Location of Philippines On the other hand, the Philippines is an archipelago nation comprised of 7,107 islands spanning 1,840 kilometers from north to south. This inevitably requires national linkage between islands and north south regions. The distance between Manila and Davao via Pan–Philippine Highway is approximately 1,400 km, while that between Manila and Iligan via Strong Republic Nautical Highway is about 1,100 km (Figure 3.1.2). By contrast, the distance between Mania and Kaohsiung is only 900 km.
1,600km
2,400km
1,800km
1,100km 900km

3-2
Source: DOTC PMO-Port / DPWH
Figure 3.1.2 Major North South Linkage in the Philippines
BATANGAS - CALAPANDistance: 44Kms. Time Travel: 2.0 hrs.
MANILA - BATANGASDistance: 54 Kms.Time Travel: 2:30 mins.
CALAPAN - ROXAS Distance: 124 Kms. Time Travel: 2.0 hrs.
ROXAS - CATICLAN Distance: 87 Kms. Time Travel: 5.0 hrs .
CATICLAN - KALIBO Distance: 69 Kms.
Time Travel: 1:10 mins.
KALIBO - IVISAN Distance: 69 Kms.Time Travel: 1:10 mins.
IVISAN - ILOILO Distance: 97 Kms. Time Travel: 1:40 mins.
ILOILO - BACOLOD Distance: 46 Kms Time Travel: 3:30 mins.
BACOLOD - DUMAGUETEDistance: 214 Kms.
Time Travel: 3:35 mins.
DUMAGUETE - DAPITANDistance: 83 Kms.
Time Travel: 3:30 mins.
DAPITAN - ILIGAN(Via Panquil RORO Crossing)
Distance: 177 Kms. Time Travel: 4.0 hrs.
MANILA - ILIGAN Distance: 1064 Kms. Time Travel: 30.0 Hrs.
LIPATA - DAVAO Distance: 370 Kms. Time Travel: 6.0 hrs.
MANILA - DAVAO Distance: 1440 Kms. Time Travel: 35.0 hrs.
MANILA - MATNOG Distance: 580 Kms.
Time Travel: 12.0 hrs.
MATNOG - ALLEN Distance: 25 Kms.Time Travel: 2.0 hrs .
ALLEN - LILOANDistance: 410 Kms.Time Travel: 11.0 hrs .
LILOAN - LIPATADistance: 55 Kms.Time Travel: 4.0 hrs.
PAN - PHILIPPINE HIGHWAY STRONG REPUBLIC NAUTICAL HIGHWAY

3-3
3.1.2 Land Area The total land area of the Philippines is 299,404 sq km or approximately 30 million hectares. Eleven large islands (*) take up about 95 percent of the total land area, with small islands and islets comprising the remaining five percent. The country is divided into three major island groups. Luzon is the largest island with an area of 141,000 sq km followed by Mindanao with 102,000 sq km and the Visayas, 57,000 sq km. 3.1.3 Topography The Philippines is characterized by topographic variations. A study of the geological history of the archipelago shows that the islands are actually the peaks of mountains uplifted from the sea floor by the horizontal pressure exerted by the Indo-Australian Plate and the Asiatic Plate on the eastern borders of the Philippine Plate during the Miocene Period. What appear to be islands are, in effect, “half-drowned mountains” which form part of a long and wide Cordillera extending from Indonesia to Japan. Luzon, the largest island group, is the most mountainous with extensive valleys and plains running through its interiors. There are three major mountain ranges in the area and these are the Sierra Madre, Central Cordillera and the Caraballo Mountains. The southern portion of the island has a dominantly volcanic topography with ridges and valleys of gentle slopes and generally accordant drainage. Active volcanoes such as the Pinatubo, Taal, Mayon, Iriga and Bulusan volcanoes are also found in this group of islands. The group of islands at the center of the archipelago, commonly known as the Visayas Islands, has a severe dissection of topography due to its exposure to typhoons from the Pacific and torrential rains. This group of islands is characterized by mountains and hills where peaks reach 900 meters, river basins, flood plains, plateaus and valleys. Visayas is likewise known for its “haycock hills,” commonly referred to as Chocolate Hills with elevation ranging from 40 to 120 meters and covering an area of 70 to 100 sq km. Mindanao has diverse structural elements and different forms of physiographic development including fault block mountains, volcanic peaks, uplifted plateaus, low flat basins, a notable fault zone which also cuts through Luzon and Visayas, fissure flow masses and incised valleys and canyons. This island group has five major mountain ranges: the Eastern or Pacific Cordillera which is made up of two mountain systems with a series of ranges in each system; the Bukidnon-Davao Range, which is a complex series of ranges that extends for some 400 km from Diwata Point in the north to the southern tip of the Saranggani Peninsula. In the northern part of Mindanao is the
* 11 islands: Luzon, Mindoro, Masbate, Panay, Samar, Leyte, Negros, Cebu, Palawan, Bohol and Mindanao.

3-4
Bukidnon-Lanao Plateau. (See Appendix for summary of physiographical condition for each province.) 3.1.4 Water Resources There are more than 300 independent principal river basins spread over the archipelago, each of which has at least 40 sq km of basin area. Of these, 16 are considered as major river basins, with at least 990 sq km of basin area each. These are the Laoag, Cagayan, Pampanga, Agno, Pasig-Laguna de Bay, Bicol and Abulug river basins in Luzon island; the Agusan, Tagum- Libuganon, Tagoloan, Agus, Davao, Cagayan de Oro and Buayan-Malungum river basins in Mindanao island; the Amnay-Patrick river basin and Ilog-Hilabangan river basin in Negros Island. The principal river basins cover a total land area of 199,637 sq km which is equivalent to 66.5 percent of the total land area of the Philippines. The 20 major river basins(*) cover a total of 111,269 sq km equivalent to 37.1 percent of the total land area of the Philippines. The total annual run-off in the river basins is estimated at about 455 million cubic meters (MCM). The groundwater storage is estimated at 1,222,896 MCM and the recharge of 31,694 MCM per year. 3.2 Climatic The climate of the Philippines is tropical and maritime. It is characterized by relatively high temperature, high humidity and abundant rainfall. It is similar in many respects to the climate of the countries of Central America. Temperature, humidity, and rainfall, which are discussed hereunder, are the most important elements of the country's weather and climate. 3.2.1 Temperature Based on the average of all weather stations in the Philippines, excluding Baguio, the mean annual temperature is 26.6o C. The coolest months fall in January with a mean temperature of 25.5o C while the warmest month occurs in May with a mean temperature of 28.3o C. Latitude is an insignificant factor in the variation of temperature while altitude shows greater contrast in temperature. Thus, the mean annual temperature of Baguio with an elevation of 1,500 meters is 18.3o C. This makes the temperature of Baguio comparable with those in the temperate climate and because of this, it is known as the summer capital of the Philippines. The difference between the mean annual temperature of the southernmost station in Zamboanga and (*2) 20 major river basins: In addition to the above mentioned 16 basins, Laoag, Amnay-Patrick, Tagoloan and Agus.
3-5
that of the northermost station in Laoag is insignificant. In other words, there is essentially no difference in the mean annual temperature of places in Luzon, Visayas or Mindanao measured at or near sea level. 3.2.2 Humidity Humidity refers to the moisture content of the atmosphere. Due to high temperature and the surrounding bodies of water, the Philippines has a high relative humidity. The average monthly relative humidity varies between 71 percent in March and 85 percent in September. The combination of warm temperature and high relative and absolute humidities give rise to high sensible temperature throughout the archipelago. It is especially uncomfortable during March to May, when temperature and humidity attain their maximum levels. 3.2.3 Rainfall Rainfall is the most important climatic element in the Philippines. Rainfall distribution throughout the country varies from one region to another, depending upon the direction of the moisture-bearing winds and the location of the mountain systems. The mean annual rainfall of the Philippines varies from 965 to 4,064 millimeters annually. Baguio City, eastern Samar, and eastern Surigao receive the greatest amount of rainfall while the southern portion of Cotabato receives the least amount of rain. At General Santos City in Cotabato, the average annual rainfall is only 978 millimeters. 3.2.4 Seasons Using temperature and rainfall as bases, the climate of the country can be divided into two major seasons: (1) the rainy season, from June to November; and (2) the dry season, from December to May. The dry season may be subdivided further into (a) the cool dry season, from December to February; and (b) the hot dry season, from March to May. 3.2.5 Climate Type Based on the distribution of rainfall, four climate types are recognized as illustrated in Figure 3.2.1. The agricultural crops are produced according to these climatic characteristics (see Figure 2.2.8). The details of each climatic types are described as follows:

3-6
(1) Type 1 - Two pronounced wet and dry seasons: Wet during the months of June to November
and dry from December to May. This type of climate is found in the western parts of Luzon, Mindoro, Palawan, Panay and Negros. The controlling factor is topography. These regions are shielded from the northeast monsoon and even in good part from the trade winds by high mountain ranges but are open only to the southwest monsoon and cyclonic storms. This type is suited to palay production.
(2) Type 2 - No dry season with a very pronounced maximum rain period in December,
January and February. Catanduanes, Sorsogon, the eastern part of Albay, Camarines Norte, Camarines Sur, eastern Quezon, Samar, Leyte and eastern Mindanao are in this type. These regions are not sheltered from either the northeast monsoon or trade winds, or from the cyclonic storms. These are coconut tree zones.
(3) Type 3 - This is an intermediate type with no pronounced maximum rain period and short
dry season, lasting from one to three months only. Areas under this type are the western parts of the Cagayan Valley, the eastern part of the Mountain Region, southern Quezon, Masbate, Romblon, northeastern Panay, eastern Negros, central and southern Cebu, eastern Palawan and northern Mindanao. These localities are only partly sheltered from the northeast monsoon and trade winds, and are open to the southwest monsoon or at least to frequent cyclonic storms. Palay is produced in these areas
(4) Type 4 - Uniformly distributed rainfall. The regions affected by this type are the Batanes,
northeastern Luzon, southwestern part of Camarines Norte, the western parts of Camarines Sur and Albay, the Bondoc Peninsula, eastern Mindoro, Marinduque, western Leyte, northern Cebu, Bohol and most of central, eastern, and southern Mindanao. These regions are so situated that they receive the moderate effects of the northeast monsoon and trade winds, as well as the southwest monsoon and the cyclonic storms. These are corn production zones.
3.3 Hydrographic Conditions Figure 3.3.1 shows the Direction of Main Flood Stream in the Philippines, Figure3.3.2 shows the Wave Climate Diagram of area by area, and Figure 3.3.3 shows the tidal levels at the major ports in the Philippines.
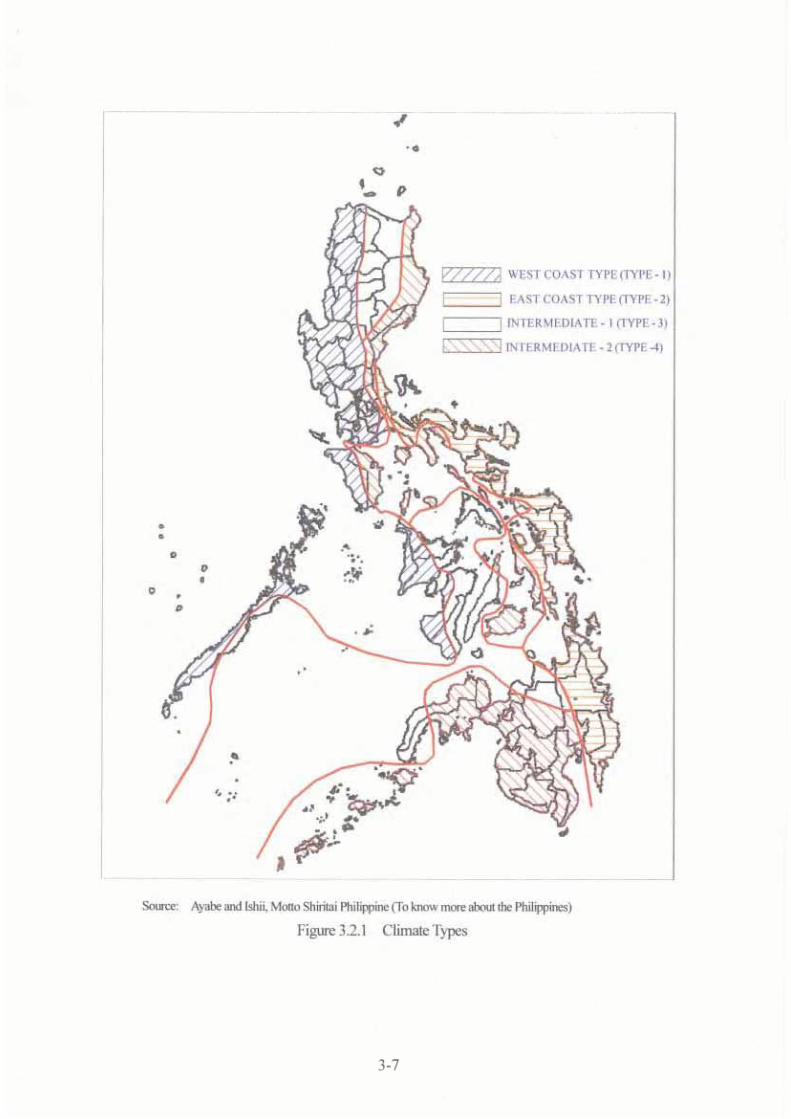


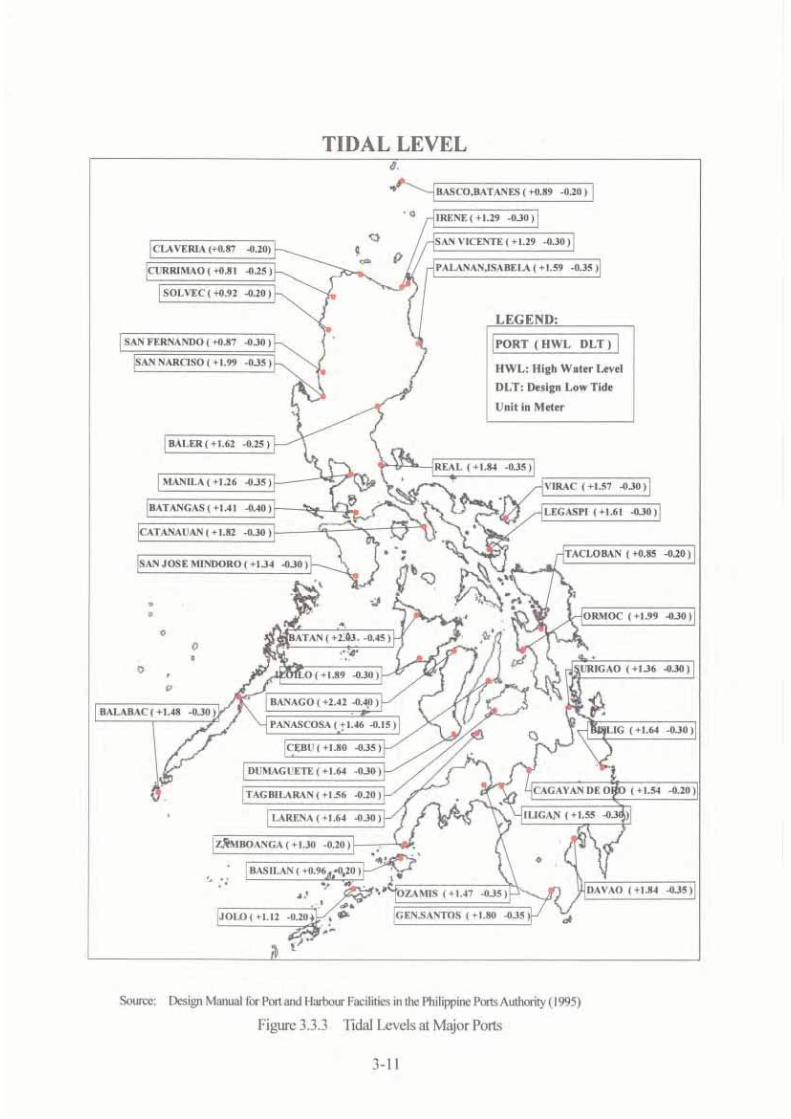

3-12
3.4 Natural Disasters The Philippines is the most disaster prone country in the world. It is known for its Mount Pinatubo eruption, disastrous typhoons, floods, garbage and land slides in Metro Manila. The Philippines was still at the top of the list of countries hit by disasters, as recorded by the Center for Research and Epidemiology of Disasters (CRED) in Belgium. These records show that the Philippines was hit by an average of 10 disasters a year since 1991 compared to 8 disasters a year from 1900 to 1991. The country’s National Disaster Coordinating Council monitored over 100 disasters during the last ten years causing some 180 billion pesos in damages. The Philippine National Red Cross records 2,000 deaths annually and more than 3.6 million people displaced within the last decade. 3.4.1 Tropical Cyclone Tropical cyclone or typhoons generally originate in the region of the Marianas and Caroline Islands of the Pacific Ocean. The annual average numbers of typhoon forming at the Philippine Area of Responsibility (PAR) is 20, and 9 of those directly attack the Philippines in which Luzon and Visayas are much affected. Their movements follow a northwesterly direction from the origin which have the same latitudinal location as Mindanao, sparing Mindanao from being directly hit by majority of the typhoons that cross the country. This makes the southern Philippines especially Mindanao very desirable for agriculture and industrial development. Frequency of only one time passage in 12 years at the most area of Mindanao is seen in Figure 3.4.1. 3.4.2 Volcanic Eruption and Earthquake Present active volcanoes are as follows: (1) Pinatubo Volcano : Boundaries of Zambales, Pampanga and Tarlac in west Luzon (2) Hibok Hibok Volcano : Camiguin Province Region X (3) Kanlaon Vcolcano : Negros Oriental Province Region VII (4) Bulusan Volcano : Sorsogon Province Region V (5) Taal Volcano : Batangas Province Region IV (6) Mayon Volcano : Albay Province Region V Active volcanoes scattered throughout the Philippines (Figure 3.4.2), and those related to the risk of earthquake are shown in Figure 3.4.3.

3-13
Data Source: NLUC/NEDA, National Framework for Physical Planning 2001-2030 Figure 3.4.1 Frequency of Tropical Cyclone Passage

3-14
Data Source: NLUC/NEDA, National Framework for Physical Planning 2001-2030
Figure 3.4.2 Active and Inactive Volcano

3-15
Data Source: S. Hattori, Seismic Risk Maps in the World Figure 3.4.3 Earthquake Risk Map Acceleration on Ground Surface (gal) Tr=100 years

4-1
Chapter 4 Development of Infrastructures other than Ports 4.1 Road Network 4.1.1 Outline Road network is one of the major national infrastructures supporting the socioeconomic development of the Philippines. In 1962, the total length of the road network in the Philippines measured about 52,628 kilometers. The network dramatically increased in the 1970’s and continues to increase steadily. In 2001, total length of road network reached 202,083 kilometers. The development of the road network in the Philippines is being undertaken by two entities: about 30,000 km of national road including expressways are under the Department of Public Works and Highways (DPWH), while the remaining 172,000km is under the jurisdiction of the local government units (LGUs). The ratio of paved road length in the total road length has increased every year and reached 21 % in 2001. However, the paved road ration in the Philippines is lower than that of other north-east Asian countries: Vietnam (35%), Indonesia (48%) and Malaysia (75%). As for traffic volume along national roads, heavy traffic of more than 10,000 vehicles a day is seen in GCR and its surrounding area, Iloilo, Cebu, Cagayan De Oro and Davao. Traffic volume of more than 1,000 vehicles a day is registered on the major roads of Luson and Mindanao islands and along the Pan-Pacific Highway. 4.1.2 Master Plan on Strategic Road Network Development Project DPWH has formulated the following master plans on road networks.
1) Master Plan Study on Luzon Island Strategic Road Network Development Project (LISR), July 1993
2) Master Plan Study on Visayas Mindanao Islands Strategic Road Network Development Project, March 1999
3) Updating of Master Plan Study on Luzon Island Strategic Road Network Development Project (LISR), June 2001
The road network is shown in Figure 4.1.1 referring to the available road map and the future plans described in these master plans under the assumption that the 2nd and 3rd program will be completed by 2009 and 2024, respectively.


4-5
4.1.3 Road network development in Metro Manila and its surrounding area Traffic congestion in Metro Manila is getting severe and it is anticipated that further restrictions on large vehicles will be introduced. City planners are not in favor of further development of Manila port because such development will spur traffic congestion. According to the demand forecast, consumer goods will increase in line with population growth. However main cargoes are and will continue to be generated in the industrial area in the south of Metro Manila. It is expected that the additional cargoes will be handled at the port of Batangas, the major port of south Luzon. (1) Metro Manila area It has been decided that all highway construction projects in Metro Manila except one route will be executed through BOT. However the projects have not moved forward due to difficulties in land acquisition and for a variety of other reasons. The government recognizes the importance of carrying out these projects as soon as possible. Allowing the private companies to return their rights and to reconsider the projects from the first step is an idea that should be examined. It has not been decided yet who will construct the route connecting to Manila port. The Philippine government is requesting that a feasibility study be done on the project for this route. However, it should be noted that the road network will not be able to function effectively if it is only partially completed. DPWH carries out construction of roads other than highways based on its development plan. However, the number of newly planned roads is inadequate to meet the increase in traffic. Therefore it is not expected that road conditions in Metro Manila will improve dramatically in the coming 20 years, moreover, it is believed that the expansion of Manila port would further aggravate the traffic congestion. The only possible site for a new port might be the offshore area in Manila bay on the extended line of Edsa Street. (2) South area of Metro Manila Large industrial areas have been developed in the south of Metro Manila including Cavite and Laguna. Many factories in Laguna are located along the expressway at the west side of Laguna bay. The condition of Cavite road, however, is very poor. At present the CAVITE BUSWAY, which runs through CAVITE from north to south and has five lanes on either side is being planned. In addition, two roads running from east to west, which cross

4-6
CAVITE BUSWAY at southern CAVITE and connect with the expressway, are under study. After completion of these roads, road transportation between the industrial areas and Batangas port, the south gateway, will be more convenient. Road development from Manila to Batangas has not been completed yet. The overhead construction project at Alaban has not commenced yet and the road improvement to Lipa has not been finished. (although an improvement project for the latter is expected to get underway soon.) The road between Lipa and Batangas is to be developed by another public corporation. NEDA would like to see this development carried out as soon as possible since there is a strong demand from factories in the southern industrial area. These road developments will surely bring benefits to Batangas. (3) North area of Metro Manila The road between Subic and Clark will be completed by 2007 using a JBIC loan.
Figure 4.1.2 Road network development in Metro Manila and its surrounding area
Batangas Road
BATANGAS
SUBIC
NCR
: Pan Phil. Highway
: S. L. Expressway
: Road Plan
: N. L. Expressway
: Tollways
LEGEND
TARLAC
SAN FERNANDO
DINALUPIHAN
North Harbor
MARIVELES
MICTSouth Harbor
STO. TOMAS
LUCENA
CALAPAN
LIPA CITY

4-7
4.2 Rail Transportation 4.2.1 Outline (1) Philippine National Railroad (PNR) The Manila Railway Co. established a 90 km stretch of railway from Manila to DAGUPAN in November 1892. Employing the technology of Britain, gauge width of 1067mm was adopted. Following the United States' occupation of the Philippines, the company changed its name to the Manila Railroad Co. Then the military government of Japan managed the railroad from 1942 to 1944. The U.S. army's military government managed it from January 1945 up to the end of January 1946. The management of railway was transferred again to the Manila railroad company on February 1, 1946. Philippine National Railroads (PNR) was established in 1964. The traditional rail transport system in the Philippines is the long-distance railroad being operated by the Philippine National Railroads. Its Main Line North is no longer operational, while the Main Line South to Bicol province runs only four or five trips daily. Philippine National Railroads (henceforth PNR) operates a 446km route from Tayuman in the downtown area of capital Manila to Legazpi of southern Luzon (South line) At present, the north line is not operating except for a 3.4km stretch between 2 stations from TAYUMAN to KAROOKAN. Two long-distance trains for Legazpi are in service each day. (See Figure 4.2.1 Philippine National Railway Existing Situations) The following railways are managed independently from PNR.
(2) Metro Manila Railway (MMR) There are two light rail systems operating in Metro Manila Railway: the Light Rail Transit (LRT) Line-1 and the Metro Rail Transit (MRT) Line-3. The Light Rail Transit Line-1 runs from north to south of Metro Manila (Monumento in Caloocan City to Pasay City) and serves passengers daily. The 16.7-kilometer Metro Rail Transit-3 runs from the North Avenue in Quezon City to Taft in Pasay City. (3) Passenger and Cargo Traffic of Railway Sector MMR and PNR transport railway passengers in the Philippines. Although the passenger traffic transported by PNR reached 1,650,000 people in 1981, the volume decreased by 319,000 in 2001. Passenger traffic of 6 million people was recorded by MMR in 1981. However, due to increased competition with road transport the volume of passengers spiraled downward, eventually dropping

4-8
as low as about 2 million people in 1989. Passenger traffic has since recovered somewhat due to a reduction in fares, recording 4,787,000 persons in 2001. Although the cargo volume by railway was 134,000 tons in 1981, the volume gradually declined. Eventually, cargo transported by PNR was discontinued in 1996. Detailed figures are seen Table 4.1 and Figure 4.3 and 4.4. 4.2.2 Major Development Plan (1) The Light Rail Transit Line-1 Capacity Expansion Project The project involves the acquisition of twelve (12) new air-conditioned four-car trains and the upgrading of old units. This will increase capacity from 27,000 to 40,000 passengers during peak hours per direction. (2) The Light Rail Transit Line-1 Extension/LRT6 project The project will extend the present line southward to Parañaque, Las Piñas, Muntinlupa and the adjoining towns of Bacoor, Imus and Dasmariñas in Cavite. Phase 1 of the project consists of a 12-kilometre extension to Bacoor with compatible technology for 'through train' operation. Ridership is projected to come up to 400,000 passengers per day. Estimated project cost is US$97 million and proposed construction schedule is from 2002 to 2004. (3) Metro Rail Transit (MRT) Line-3 Expansion The five-kilometer extension up to Monumento, Caloocan City has an estimated cost of US$270 million and will be built under the build-lease-transfer scheme. It will cover the construction of three additional stations and will increase MRT capacity to 600,000 per day. Timetable for this project is from 2002 to 2005. (4) The MRT Line-4 Project The project covers 22 kilometers of mostly elevated railroad from the Old Bilibid (prison house) in Manila to Novaliches, Quezon City (northern Metro Manila) and will be constructed under a build-operate-transfer (BOT) scheme. (5) The Light Rail Transit Line-2 project The project involves the construction of a 14-kilometre line from Recto Avenue in Divisoria, Manila

4-9
to Santolan, Pasig with 11 stations and 26 four-car trains. It has an estimated cost of US$582 million and scheduled for completion in the first quarter of 2004 ferrying 500,000 passengers per day. Partial operation from Cubao to Santolan will be started in the first quarter of 2003. (6) Manila-Calabarzon Express (MCX) Commuter Rail Project This involves the reconstruction of the 77.5-kilometre Philippine National Railroad commuter line from Manila to Calamba, Laguna (a province south of Metro Manila) into a modern rail system. Construction will be in five phases and will include the installation of signaling and communication systems and the use of new locomotives and passenger coaches. The estimated project cost is US$263 million to be funded from foreign funds. The schedule of this project will be from 2003 to 2006. (7) Rehabilitation Projects and New Line Construction Project The rehabilitation of two (2) existing railroads managed by Philippine National Railroads (PNR), and the construction of four (4) new railroad lines are as follows: a) Rehabilitation of the main railroad line from Manila to Legazpi City in Bicol region b) Rehabilitation of the main North Line from Manila to San Fernando, La Union. c) Construction of a new railroad line from Calamba, Laguna to Batangas City. d) Construction of a new railroad line from Cagayan de Oro City to Iligan City in Mindanao. e) Extension of the South railroad line from Legazpi City to Matnog, Sorsogon in Bicol region. f) Construction of Panay Railroad Line from Iloilo City to Roxas City in the Visayas.


4-11
Table 4.2.1 Passenger and Cargo Traffic by Railway
Figure 4.2.2 Passenger by Railway Figure 4.2.3 Cargo Traffic by Railway
P h ilip p ine N a tional R a ilw a y s
Fre ight E x p r e s sPassengers T o n s T o n s P a s s e n g e r
Y e a r Carr ied L o a d e d L o a d e d Carr ied('0 0 0 ) ('0 0 0 ) ('0 0 0 ) ('0 0 0 )P N R M M R
1 9 8 1 1,651.4 115.8 18.2 6,156.3
1 9 8 2 1,316.2 76.7 15.8 4,335.9
1 9 8 3 1,375.6 65.3 17.1 5,142.2
1 9 8 4 1,262.6 72.1 21.6 4,755.4
1 9 8 5 749.0 53.0 19.4 2,952.2
1 9 8 6 909.6 64.0 21.5 2,834.7
1 9 8 7 1,177.8 62.2 27.7 2,024.0
1 9 8 8 984.9 57.0 22.8 1,182.1
1 9 8 9 1,004.7 53.2 21.5 979.7
1 9 9 0 928.0 32.2 16.8 5,560.8
1 9 9 1 654.9 11.6 10.3 4,508.5
1 9 9 2 466.8 4.9 8.6 2,302.9
1 9 9 3 401.7 17.5 7.3 4,639.4
1 9 9 4 426.0 12.3 7.2 2,844.9
1 9 9 5 589.0 14.1 6.2 4,054.6
1 9 9 6 299.5 - 1.7 3,007.0
1 9 9 7 613.5 - 3.8 3,077.0
1 9 9 8 578.1 - 3.5 4,702.1
1 9 9 9 540.9 - 2.8 5,015.0
2 0 0 0 374.3 - 1.9 3,504.0
2 0 0 1 318.7 - 1.7 4,787.0
1 Inc ludes B ico l M etro Ra i l Com m uter .
Source : Phi l ippine N a t i o n a l R a i l w a y s .
M e tro M anilaR a il C o m m uter 1
Passenger by Railway(Thousand)
0
1,000
2,000
3,000
4,000
5,000
6,000
7,000
8,000
9,000
1981
1982
1983
1984
1985
1986
1987
1988
1989
1990
1991
1992
1993
1994
1995
1996
1997
1998
1999
2000
2001
MMRPNR
Cargo Traffic by Railways(ton)
0
20,000
40,000
60,000
80,000
100,000
120,000
140,000
160,000
1981
1982
1983
1984
1985
1986
1987
1988
1989
1990
1991
1992
1993
1994
1995
1996
1997
1998
1999
2000
2001
Cargo Volume

4-12
4.3 Air Transportation 4.3.1 Outline The airport sector is managed, operated, and regulated by the Air Transportation Office, which is under the direct supervision of the Department of Transportation and Communications. There are eighty-five (87) public airports in the Philippines in year 2000. Four (4) airports are designated as international airports (Ninoy Aquino Inter-national Airport, Subic, Clark, and Cebu) and four (4) others are designated as alternate international airports (Zamboanga, Davao, General Santos/Tambler, and Laoag). An additional twelve (12) airports are designated as trunk-link airports, thirty-six (36) as secondary airports and thirty-one (31) as feeder airports (See Figure 4.3.1 Major Airport and Route). In these public airports, domestic passenger and cargo traffic of 12 million persons and 245,000 tons were recorded in 2000 (See Figure 4.3.2, 4.3.3 and Table 4.3.1.).
Table 4.3.1 Domestic Air Passenger & Cargo Traffic
Source: air Transportation Office
4.3.2 Major Development Plan (1) Master Plan The Philippines civil aviation master plan was drawn up with the assistance of the International Civil Aviation Organization (ICAO) and United Nations Development Programme (UNDP) in 1992.
Air Cargo 1995 1996 1997 1998 1999 2000 2001 20021 Ninoy Aquino International airport (NAIA) 79,743 101,020 101,339 85,975 221,054 120,398 121,130 121,8622 Mactan-Cebu International Airport (MCIA) 23,151 27,919 68,151 26,476 34,144 34,685 39,407 44,3803 Iloilo Airport 0 38,507 40,636 24,344 26,434 29,522 21,211 31,2774 Cagayan de Oro Airport 8,206 9,094 11,748 6,913 8,771 9,480 7,834 9,5155 Bacolod Airport 7,582 6,506 6,786 5,539 5,709 7,262 6,091 7,1616 Zamboangan International Airport 4,772 4,286 11,159 4,811 6,699 6,434 8,708 8,8908 Davao International Airport 827 1,956 4,164 6,272 7,278 8,929 6,713 6,4679 General Santos International Airport 4,022 4,618 5,181 3,883 4,062 6,239 5,872 6,21012 Puerto Princesa Airport 2,322 3,724 3,585 2,545 4,173 4,810 3,886 3,79613 Roxas Airport 3,910 2,865 3,250 2,106 3,480 3,837 3,637 2,997100 Others 15,966 14,460 19,080 11,990 11,974 14,063 N.A N.A
Domestic 150,500 214,954 275,077 180,854 333,777 245,660 N.A N.A
Air Passenger 1995 1996 1997 1998 1999 2000 2001 20021 Ninoy Aquino International airport (NAIA) 4,308,874 4,986,164 6,155,189 5,369,908 5,490,735 5,538,320 5,474,450 5,521,6012 Mactan-Cebu International Airport (MCIA) 1,841,904 2,047,566 2,330,431 1,761,530 1,895,077 1,699,378 1,710,943 1,597,5243 Iloilo Airport 466,423 583,910 693,775 615,577 642,541 379,745 639,512 677,0754 Cagayan de Oro Airport 349,947 353,902 510,519 835,797 439,706 357,534 404,906 467,8775 Bacolod Airport 371,955 419,951 538,950 370,365 536,201 450,884 537,809 514,0136 Zamboangan International Airport 319,165 355,594 422,491 252,994 292,221 285,206 270,138 296,1917 Tacloban Airport 265,995 235,949 303,763 318,189 339,701 309,152 299,295 303,7308 Davao International Airport 640,000 860,000 1,010,000 780,000 926,989 739,316 937,751 961,9909 General Santos International Airport 76,721 100,893 127,487 322,702 206,210 585,629 148,204 129,44510 Kalibo Airport 207,442 250,943 259,638 211,327 247,100 177,138 238,123 253,563100 Others 1,595,036 1,533,564 1,825,302 1,269,468 1,230,721 1,071,443 1,313,318 1,294,408
Total 10,443,462 11,728,436 14,177,545 12,107,857 12,247,202 11,593,745 11,974,449 12,017,417

4-13
The plan was re-examined in 1996. According to this master plan, the goal is to improve international airports in each region in which DOTC has jurisdiction from the viewpoint of local equilibrium development. (2) Development Plan of Airports
1) NINA Development a) Terminal III b) Rehab. of Manila TRACON c) Revitalization of Manila CACT
2) Laoag International Airport Development Project 3) Legazpi Airport Development Project 4) Selected Airports Development Project
a) Tacloban b) Bacolod (Silay)
5) New Iloilo Airport Development Project Sta. Barbara / Cabanatuan Site
6) Mactan (Cebu) International Airport Project Additional Works
7) Third Airport Development Project a) Pto. Princesa b) Cotabato c) Pagadian e) Butuan f) Sanga-Sanga g) Dipolog
8) Laguindingan Airport Development Project 9) Davao International Airport Development Project 10) Zamboanga International Airport
a) Pre-Feasibility Study/Master Plan b) Zamboanga Airport Development Project (3) Airport facilities 1) Rehabilitation of the Manila TRACON Facility Project 2) Nationwide Air Navigation Facilities Modernization Project –Phase III 3) ew CNS/ATM System Development Project


4-15
Figure 4.3.2 Domestic Air Passenger
Figure 4.3.3 Domestic Air Cargo Traffic
Domestic Air Passenger
0
2,000,000
4,000,000
6,000,000
8,000,000
10,000,000
12,000,000
14,000,000
16,000,00019
95
1996
1997
1998
1999
2000
2001
2002
Others
Kalibo Airport
General Santos InternationalAirportDavao International Airport
Tacloban Airport
Zamboangan InternationalAirportBacolod Airport
Cagayan de Oro Airport
Iloilo Airport
Mactan-Cebu InternationalAirport (MCIA)Ninoy Aquino Internationalairport (NAIA)
Domestic Air Cargo Traff ic by Airport( ton)
0
50,000
100,000
150,000
200,000
250,000
300,000
350,000
1995 1996 1997 1998 1999 2000 2001 2002
Roxas Airport
Puerto Princesa Airport
General Santos InternationalAirport
Davao International Airport
Zamboangan InternationalAirport
Bacolod Airport
Cagayan de Oro Airport
Iloilo Airport
Mactan-Cebu InternationalAirport (MCIA)
Ninoy Aquino Internationalairport (NAIA)

4-16
4.4 Traffic by Transportation Modes Transportation has a very important role in supporting national development and stimulating economic growth. There are three modes of transportation, namely, Land Transportation, Sea Transportation and Air Transportation. In addition, Land Transportation is divided into Road Transportation and Railroad Transportation. In ports and airports, cargo traffic is measured by handling volume such as inbound and outbound, and passengers are also counted by embarked and disembarked. Other wise in railroad transportation, transported cargo volume and passenger are recorded as traffic volume. For this reason, in order to compare under the same conditions, the cargo volume transported by railroad is doubled. 4.4.1 Passenger Traffic (1) Growth and Increase rate of Passenger Traffic Table 4.4.5 shows passenger traffic volume, growth and average annual growth rate by railroad traffic, long-distance bus (*) passenger traffic, domestic shipping passenger traffic and domestic air passenger traffic. This table does not include short distance road passenger such as those transported by city bus, jeepney and taxi. Railroad passenger traffic has remained rather stable while that of long-distance bus, domestic shipping and domestic air traffic has been increasing. Average annual rate of increase is shown in Table 4.4.1.
Table 4.4.1 Passenger Traffic by Mode Unit: Person
Mode Sector Indicator 1991 2001 Growth (%) Average Annual
Growth rate
Land Rail traffic Passenger 10,326,800 10,211,400 98.88% -0.11%
Long distance bus Passenger 762,727 1,513,590 198.44% 7.09%
Sea Domestic Passenger 31,715,783 55,797,795 175.93% 5.81%
Air Domestic Passenger 7,687,468 12,017,417 156.32% 5.09%
Total 50,492,778 79,540,202 157.53% 4.65%
Source: Philippine statistical Yearbook, PPA, CPA, Air Transportation Office and Field survey by JICA Study Team
(2) Share of Passenger Traffic by each Mode * Bus which connects cities between Luzon island and other islands

4-17
Share of Passenger Traffic by each mode is shown in Figure 4.4.1, 4.4.2 and Table 4.4.2 Figurer 4.4.1 Share of Passenger Traffic in 1991 Figurer 4.4.2 Share of Passenger Traffic in 2001
Table 4.4.2 Share of Passenger Traffic by Mode Unit : Person
Mode Sector Indicator 1991 Share 2001 Share
Land Rail traffic Passenger 5,163,400 11.39% 5,105,700 6.86%
Long distance bus Passenger 762,727 1.68% 1,513,590 2.03%
Sea Domestic Passenger 31,715,783 69.97% 55,797,795 74.96%
Air Domestic Passenger 7,687,468 16.96% 12,017,417 16.14%
Total 45,329,378 100.00% 74,434,502 100.00%
Source: Philippine statistical Yearbook, PPA, CPA, Air Transportation Office
4.4.2 Cargo Traffic (1) Growth and Increase rate of Cargo Traffic Table 4.4.3 shows cargo traffic volume, growth and average annual growth rate by rail traffic, domestic shipping traffic and domestic air traffic. This table does not include cargo traffic by road. Cargo traffic of railroad decreased while that of domestic shipping and domestic air traffic has been increasing. Average annual rate of increase is shown in Table 4.4.3.
Table 4.4.3 Cargo Traffic by Mode Mode Sector Indicator 1991
(ton)
2001
(ton)
Growth (%) Average Annual
Growth rate
Land Rail traffic Cargo (ton) 43,800 3,400 7.76% -22.55%
Sea Domestic Cargo (ton) 58,630,134 87,544,738 149.32% 4.09%
Air Domestic Cargo (ton) 151,098 246,289 163.00% 5.58%
Total 58,825,032 87,794,427 149.25% 4.09%
Source: Philippine Statistical Yearbook, PPA, CPA and Air Transportation Office
1991
70%
11%
2%17%
SeaRailBusAir
2001
75%
7%
2%16%
SeaRailBus
Air
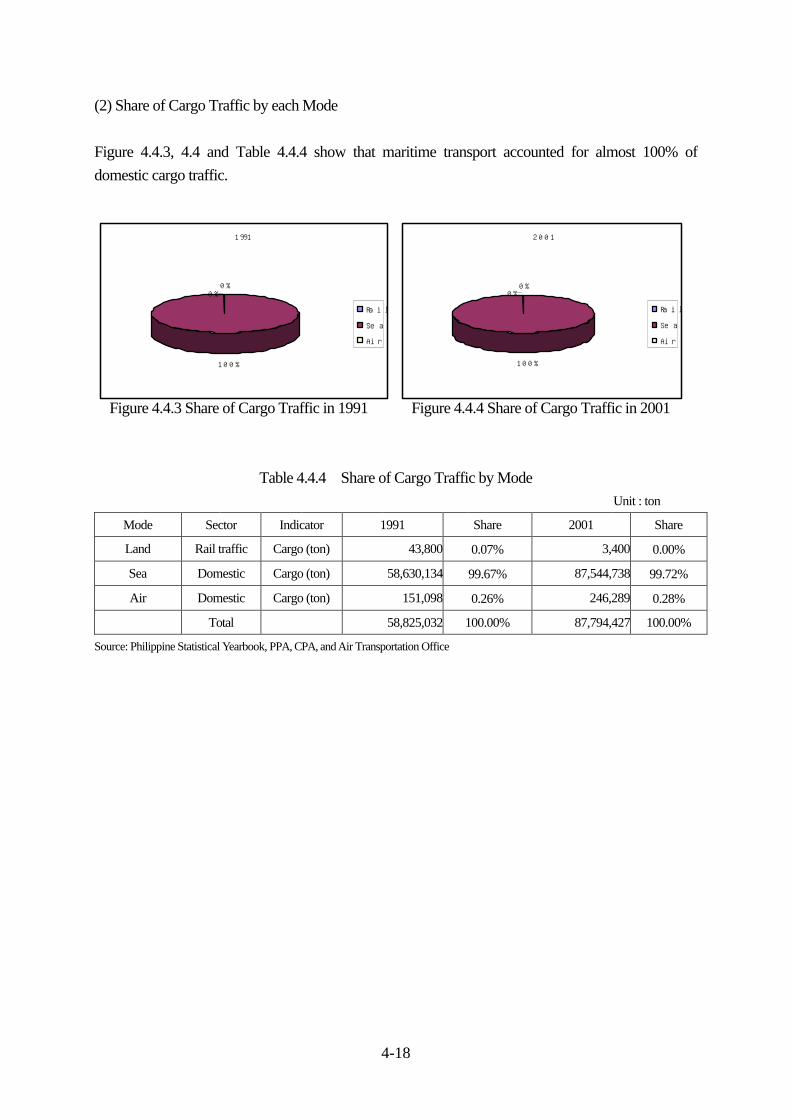
4-18
(2) Share of Cargo Traffic by each Mode Figure 4.4.3, 4.4 and Table 4.4.4 show that maritime transport accounted for almost 100% of domestic cargo traffic.
Figure 4.4.3 Share of Cargo Traffic in 1991 Figure 4.4.4 Share of Cargo Traffic in 2001
Table 4.4.4 Share of Cargo Traffic by Mode Unit : ton
Mode Sector Indicator 1991 Share 2001 Share
Land Rail traffic Cargo (ton) 43,800 0.07% 3,400 0.00%
Sea Domestic Cargo (ton) 58,630,134 99.67% 87,544,738 99.72%
Air Domestic Cargo (ton) 151,098 0.26% 246,289 0.28%
Total 58,825,032 100.00% 87,794,427 100.00%
Source: Philippine Statistical Yearbook, PPA, CPA, and Air Transportation Office
1991
0%
100%
0%
Rail
Sea
Air
2001
0%
100%
0%
Rail
Sea
Air

5-1
Chapter 5 Present and Future Traffic of Cargo and Passenger 5.1 Cargo Volume by Regions and Port Management Body Port Management Offices (PMOs) of PPA, CPA and many public port development bodies such as SMBA, PIA, BCDA, CEZA, ARMM and LGUs are found in seventeen (17) regions of the Philippines. These organizations are arranged in almost all areas in the Philippines and manage their ports. In addition PPA and CPA (port authorities: PAs) also monitor other private ports in their areas. Although each management body prepares data on port activities individually, there is no organization that consolidates all data. Table 5.1.1 shows around thirty (30) management bodies and almost all of them belong to PPA except SBMA and CEZA. Polloc and Jolo were transferred to ARMM from PPA in 1998. Each management body prepares the data of port activities individually; there are no organizations that consolidate all data. The study team collected these data and arranged them in Table 5.1.1. The total cargo-handling volume of Philippines ports in 2001 is around 163 million tons.
Table 5.1.1 Sea Borne Cargo Volume in 2001 Unit : ton
Region Region Port Management Body Import Export Inbound Outbound Total CargoNorth Harbor (Mnl) 1,540,943 0 7,726,750 8,589,744 17,857,437
NCR National Capital Region South Harbor (Mnl) 6,348,106 474,980 6,203,211 64,487 13,090,784M.I.C.T. 6,914,717 3,989,829 3,750 6,090 10,914,386
CAR Cordillera Autonomous Region
1 Ilocos San Fernando, BCDA 3,483,174 31,729 303,670 13,920 3,832,4932 Cagayan Valley San Fernando, CEZA 5 55,500 408 0 55,9133 Central Luzon SBMA 1,384,325
Limay 9,812,702 794,990 394,043 5,794,105 16,795,8404A Southern Tagalog Batangas 15,037,310 644,009 3,019,643 5,248,072 23,949,0344B Southern Tagalog Calapan 0 0 368,371 328,719 697,0904B P. Princesa 8,349 483,402 478,346 210,302 1,180,3995 Bicol Legazpi 216,315 135,784 1,849,468 1,151,849 3,353,4166 Western Visayas Iloilo 385,577 176 2,379,118 890,839 3,655,710
Pulupandan 201,936 148,539 2,112,468 1,331,007 3,793,950Dumaguete 32,698 472,357 700,175 388,256 1,593,486
7 Central Visayas Cebu 1,811,998 1,599,130 5,250,167 6,143,334 14,804,629Tagbilaran 40,648 387,999 827,309 903,973 2,159,929
8 Eastern Visayas Tacloban 1,909,948 827,665 2,345,464 2,928,709 8,011,7869 Western Mindanao Zamboanga 177,977 249,158 1,241,149 659,151 2,327,43510 Northern Mindanao Cag. De Oro 4,982,114 5,308,801 2,632,046 2,417,630 15,340,591
Ozamiz 35,758 165,423 1,363,754 1,082,785 2,647,72011 Southern Mindanao Davao 1,168,845 2,836,733 2,192,399 1,210,780 7,408,757
Gen. Santos 251,303 443,110 878,092 876,893 2,449,39812 Central Mindanao Iligan 436,349 488,750 1,250,807 1,298,185 3,474,091
Cotabato 0 0 38,917 69,968 108,88513 Caraga Surigao 64,491 990,092 405,754 650,292 2,110,629
Nasipit 93,876 415 561,389 442,073 1,097,753ARMM Autonomous Region Polloc* 0 0 0 0 757,948*
Muslim Mindanao Jolo* 0 0 0 0 240,362*
Total 54,955,139 20,528,571 44,526,668 42,701,163 162,711,540Sauce: Statistical Yearbook 2001, PPA Annual Statistical Report, CPA, SBMA and arranged by the Study Team.
Remarks: Cargo volume of Polloc* and Jolo* were recorded in1998 and the Total is not include these figures.

5-2
5.2 Present Cargo Traffic 5.2.1. Total Cargo Volume (1) Total Sea Borne Cargo Volume Total sea borne cargo volume in Philippines increased from 106 million tons in 1991 to 163 million tons in 2001 at an average annual growth rate of 4.43%. Cargo volume of Luzon occupies half and the remainder is halved in Visayas and Mindanao.
Figure 5.2.1 Total Cargo Volume
Total Cargo Volume
0
20,000,000
40,000,000
60,000,000
80,000,000
100,000,000
120,000,000
140,000,000
160,000,000
180,000,000
1991 2001
TotalCargo
Cargo Volume by Area
010,000,00020,000,00030,000,00040,000,00050,000,00060,000,00070,000,00080,000,00090,000,000
100,000,000
1991 2001
LusonVisayasMindanao

5-3
(2) Total Cargo Volume by Regions Figure 5.2.2 shows total cargo volume of each region in 1991 and 2001 (also see Table 5.2.1). GCR (NCR, Region-3 and Region-4A. Major ports are Subic, Manila and Batangas) handles the largest share of cargo followed by Central Visayas. Ilocos region shows the largest increase because a coal power plant recently started operations, but this is a temporary phenomenon.
Figure 5.2.2 Cargo Volume by Regions
Table 5.2.1 Cargo Volume by Regions
Cargo Volume by Regions
010,000,00020,000,00030,000,00040,000,00050,000,00060,000,00070,000,00080,000,00090,000,000
NCR + 3+
4A CARIlo
cos
Cagayan
Valle
y
South
ern Taga
log Bicol
West
ern V
isayas
Central
Visayas
Eastern
Visa
yas
West
ern M
indana
o
Norther
n Mind
anao
South
ern M
indana
o
Central
Mind
anao
Caraga
ARMM
ton
1991
2001
Unit : tonRegion Region Total Total Growth Rate
No. 1991 2001NCR NCR + 3+4A 49,093,882 82,607,481 5.34%CAR CAR 0 0
1 Ilocos 1,167,167 3,778,319 12.46%2 Cagayan Valley 154,091 110,087 -3.31%
4B Southern Tagalog 1,492,577 1,877,489 2.32%5 Bicol 1,778,329 3,353,416 6.55%6 Western Visayas 5,999,298 7,449,660 2.19%7 Central Visayas 12,256,280 18,558,044 4.24%8 Eastern Visayas 5,520,917 8,011,786 3.79%9 Western Mindanao 1,944,977 2,327,435 1.81%
10 Northern Mindanao 13,622,405 17,988,311 2.82%11 Southern Mindanao 5,785,206 9,858,155 5.47%12 Central Mindanao 4,226,695 3,582,976 -1.64%13 Caraga 2,261,381 3,208,382 3.56%
ARMM ARMM 925,096 871,450 -0.60%Total Cargo 106,228,301 163,582,990 4.41%

5-4
(3) Total Cargo Volume by Cargo Type Figure 5.2.3 and Table 5.2.2 show the cargo volume by cargo types in 1991 and 2001. Foreign bulk cargo, comprised mainly of crude petroleum and mineral fuel, is the major cargo type. For foreign cargo, the biggest growth rate is seen in container cargo while for domestic cargo, container cargo and RO/RO cargo show large growth rates. The growth of foreign break bulk cargo and domestic break bulk cargo is stable. Some break bulk cargo is shifting to container or bulk cargo and this is pushing up container cargo growth. Foreign cargo growth rate is 4.87 %, slightly higher than the domestic cargo growth rate of 4.05%. The volume and growth rate of import cargo are larger than that of export cargo (see Table 5.2.2).
Source: PPA, CPA
Figure 5.2.3 Cargo Volume by Cargo Types
Cargo Volume by Cargo Types(unit : ton)
0
10,000,000
20,000,000
30,000,000
40,000,000
50,000,000
60,000,000
For
eign
Con
tain
er
For
eign
Bre
ak b
ulk
For
eign
Bul
k
Dom
estic
Con
tain
er
Dom
estic
Bre
akbu
lk
Dom
estic
Ro/
Ro
Dom
estic
Bul
k
19912001

5-5
Table 5.2.2 Total Cargo Volume by Cargo Type
Source: PPA, CPA
Unit : tonForeign 1991 2001 Growth Rate
Containerized Cargo Import 3,495,597 9,645,669 10.68%Export 2,400,482 5,456,496 8.56%
Sub Total 5,896,078 15,102,165 9.86%Break Bulk Cargo Import 4,656,873 6,366,543 3.18%
Export 1,831,960 2,012,678 0.95%Sub Total 6,488,833 8,379,221 2.59%
Bulk Cargo Import 23,134,559 38,942,927 5.35%Export 11,690,017 13,059,397 1.11%
Sub Total 34,824,576 52,002,324 4.09%Foreign Cargo Total Import 31,287,029 54,955,139 5.79%
Export 15,922,459 20,528,571 2.57%Total 47,209,487 75,483,710 4.81%
DomesticContainerized Cargo Inbound 6,999,397 13,374,539 6.69%
Outbound 7,002,278 13,123,828 6.48%Sub Total 14,001,675 26,498,367 6.59%
Break Bulk Cargo Inbound 12,522,303 12,340,561 -0.15%Outbound 10,571,799 11,055,445 0.45%
Sub Total 23,094,102 23,396,007 0.13%Ro/Ro Cargo Inbound 1,375,768 4,720,284 13.12%
Outbound 1,324,409 4,568,806 13.18%Sub Total 2,700,177 9,289,090 13.15%
Bulk Cargo Inbound 9,948,916 14,531,306 3.86%Outbound 9,273,944 14,384,512 4.49%
Sub Total 19,222,860 28,915,818 4.17%Domestic Cargo Total Inbound 30,846,384 44,966,690 3.84%
Outbound 28,172,430 43,132,591 4.35%Total 59,018,814 88,099,281 4.09%
Ground Total 106,228,301 163,582,990 4.41%

5-6
5.2.2 Cargo Volume by Cargo Type and by Regions (1) Foreign Container Cargo
Figure 5.2.4 Foreign Container Cargo by Regions Figure 5.2.4 shows foreign container cargo volume in 1991 and 2001. Foreign container cargo volume increased from 5.9 million tons in 1991 to 15 million tons in 2001. This large increase is partly due to the fact that some break bulk cargo is shifting to container cargo. Foreign container cargo is handled mainly at four (4) regions but the vast majority is handled at Manila. About 20% of foreign container cargo handled in NCR is transferred as domestic container cargo to/from other regions. Import container cargo volume is about 1.8 times larger than export container cargo volume and the former is growing at a faster rate than the latter. Large growth rates are seen in Central Visayas and Southern Mindanao (see Table 5.2.3).
Foreign Conta iner ized Cargo by Reg ions(Un i t : ton)
02,000,000
4,000,0006,000,0008,000,000
10,000,000
12,000,00014,000,000
NC
R +
3+4
A
CA
R
Iloco
s
Cag
ayan
Val
ley
Cen
tral
Luz
on
Sou
ther
n T
agal
og
Bic
ol
Wes
tern
Vis
ayas
Cen
tral
Vis
ayas
East
ern
Vis
ayas
Wes
tern
Min
dana
o
Nor
ther
n M
inda
nao
Sou
ther
n M
inda
nao
Cen
tral
Min
dana
o
Car
aga
AR
MM
19912001

5-7
Table.5.2.3 Foreign Container Cargo by Regions
Source: PPA & CPA
Unit : tonRegion Region Port Mangement Body Total Total Growth Rate
No. 1991 2001NCR NCR + 3+4A Subic, Manila, Batangas 5,002,336 13,156,257 10.15%CAR CAR 0 0
1 Ilocos San Fernando, BCDA 0 02 Cagayan Valley San Fernando, CEZA 0 03 Central Luzon Limay 0 2,029
4B Southern Tagalog Calapan, P. Princesa 16 05 Bicol Legazpi 0 06 Western Visayas Iloilo 0 07 Central Visayas Cebu, Dumaguete, Tagbilaran 346,674 852,527 9.42%8 Eastern Visayas Tacloban 0 09 Western Mindanao Zamboanga 0 1,518
10 Northern Mindanao Caga.De.Oro, Ozamiz 193,038 248,641 2.56%11 Southern Mindanao Davao, Gen.Santos 341,240 724,837 7.82%12 Central Mindanao Iligan 3,202 013 Caraga Surigao, Nasipit 9,572 0
ARMM ARMM ARMM 0 0TOTAL 5,896,078 14,985,809 9.78%
Region Region Port Mangement Body Import Import Growth Rate
No. 1991 2001NCR NCR + 3+4A Subic, Manila, Batangas 3,204,834 8,742,458 10.56%CAR CAR 0 0
1 Ilocos San Fernando, BCDA 0 02 Cagayan Valley San Fernando, CEZA 0 03 Central Luzon Limay 0 690
4B Southern Tagalog Calapan, P. Princesa 16 05 Bicol Legazpi 0 06 Western Visayas Iloilo 0 07 Central Visayas Cebu, Dumaguete, Tagbilaran 169,352 517,310 11.81%8 Eastern Visayas Tacloban 0 09 Western Mindanao Zamboanga 0 1,340
10 Northern Mindanao Caga.De.Oro, Ozamiz 15,269 58,932 14.46%11 Southern Mindanao Davao, Gen.Santos 99,739 266,761 10.34%12 Central Mindanao Iligan 1,601 013 Caraga Surigao, Nasipit 4,786 0
ARMM ARMM ARMM 0 0TOTAL 3,495,597 9,587,491 10.62%
Region Region Port Mangement Body Export Export Growth Rate
No. 1991 2001NCR NCR + 3+4A Subic, Manila, Batangas 1,797,503 4,413,799 9.40%CAR CAR 0 0
1 Ilocos San Fernando, BCDA 0 02 Cagayan Valley San Fernando, CEZA 0 03 Central Luzon Limay 0 1,339
4B Southern Tagalog Calapan, P. Princesa 0 05 Bicol Legazpi 0 06 Western Visayas Iloilo 0 07 Central Visayas Cebu, Dumaguete, Tagbilaran 177,322 335,217 6.58%8 Eastern Visayas Tacloban 0 09 Western Mindanao Zamboanga 0 178
10 Northern Mindanao Caga.De.Oro, Ozamiz 177,769 189,709 0.65%11 Southern Mindanao Davao, Gen.Santos 241,501 458,076 6.61%12 Central Mindanao Iligan 1,601 013 Caraga Surigao, Nasipit 4,786 0
ARMM ARMM ARMM 0 0TOTAL 2,400,482 5,398,318 8.44%

5-8
(2) Foreign Break Bulk Cargo by Regions
Figure 5.2.5 Foreign Break Bulk Cargo by Regions Foreign break bulk cargo volume increased from 6.5 million tons in 1991 to 8.5 million tons in 2001. Foreign break bulk cargo has not greatly increased in the past 10 year period. One of the reasons for this is that break bulk cargo is shifting to container cargo. NCR and Southern Mindanao regions have a large share of break bulk cargo. Major commodities of import break bulk cargo are Iron & Steel and Cement at NCR while those for export are fruits & vegetable in the Southern Mindanao region. Import break bulk cargo growth rate is 3.27% and that for export is 1.23% (see Table 5.2.4).
Fore ign Break Bulk Cargo by Regions(Unit : ton)
0500,000
1,000,0001,500,0002,000,0002,500,0003,000,0003,500,0004,000,0004,500,0005,000,000
NC
R +
4A
CA
R
Iloco
s
Cag
ayan
Val
ley
Cen
tral
Luz
on
Sou
ther
n T
agal
og
Bic
ol
Wes
tern
Vis
ayas
Cen
tral
Vis
ayas
East
ern
Vis
ayas
Wes
tern
Min
dana
o
Nor
ther
n M
inda
nao
Sou
ther
n M
inda
nao
Cen
tral
Min
dana
o
Car
aga
AR
MM
19912001

5-9
Table 5.2.4 Foreign Break Bulk Cargo by Regions
Source: PPA & CPA
Unit : tonRegion Region Port Mangement Body Total Total Growth Rate
No. 1991 2001NCR NCR + 4A Subic, Manila, Batangas 3,314,485 4,367,118 2.80%CAR CAR 0 0
1 Ilocos San Fernando, BCDA 117,223 962 -38.14%2 Cagayan Valley San Fernando, CEZA 0 53 Central Luzon Limay 0 9,905
4B Southern Tagalog Calapan, P. Princesa 10,455 8,493 -2.06%5 Bicol Legazpi 18,501 106,996 19.18%6 Western Visayas Iloilo 62,868 272,494 15.80%7 Central Visayas Cebu, Dumaguete, Tagbilaran91,588 533,925 19.28%8 Eastern Visayas Tacloban 411,109 292,400 -3.35%9 Western Mindanao Zamboanga 54,929 167,971 11.83%
10 Northern Mindanao Caga.De.Oro, Ozamiz 330,914 313,921 -0.53%11 Southern Mindanao Davao, Gen.Santos 1,252,473 2,292,102 6.23%12 Central Mindanao Iligan 700,230 21,539 -29.40%13 Caraga Surigao, Nasipit 83,605 107,746 2.57%
ARMM ARMM ARMM 40,453 0TOTAL 6,488,833 8,495,577 2.73%
Region Region Port Mangement Body Import Import Growth Rate
No. 1991 2001NCR NCR + 4A Subic, Manila, Batangas 3,207,051 4,327,249 3.04%CAR CAR 0 0
1 Ilocos San Fernando, BCDA 75,981 0 -100.00%2 Cagayan Valley San Fernando, CEZA 0 53 Central Luzon Limay 0 5,739
4B Southern Tagalog Calapan, P. Princesa 355 8,349 37.13%5 Bicol Legazpi 3,343 106,916 41.41%6 Western Visayas Iloilo 62,868 272,318 15.79%7 Central Visayas Cebu, Dumaguete, Tagbilaran85,555 487,865 19.02%8 Eastern Visayas Tacloban 2,087 29,515 30.33%9 Western Mindanao Zamboanga 36,405 167,561 16.49%
10 Northern Mindanao Caga.De.Oro, Ozamiz 230,584 304,963 2.84%11 Southern Mindanao Davao, Gen.Santos 219,452 609,610 10.76%12 Central Mindanao Iligan 653,195 013 Caraga Surigao, Nasipit 42,440 104,631 9.44%
ARMM ARMM ARMM 37,557 0TOTAL 4,656,873 6,424,721 3.27%
Region Region Port Mangement Body Export Export Growth Rate
No. 1991 2001NCR NCR + 4A Subic, Manila, Batangas 107,434 39,869 -9.44%CAR CAR 0 0
1 Ilocos San Fernando, BCDA 41,242 962 -31.33%2 Cagayan Valley San Fernando, CEZA 0 03 Central Luzon Limay 0 4,166
4B Southern Tagalog Calapan, P. Princesa 10,100 144 -34.63%5 Bicol Legazpi 15,158 80 -40.81%6 Western Visayas Iloilo 0 1767 Central Visayas Cebu, Dumaguete, Tagbilaran 6,033 46,060 22.54%8 Eastern Visayas Tacloban 409,022 262,885 -4.32%9 Western Mindanao Zamboanga 18,524 410 -31.69%
10 Northern Mindanao Caga.De.Oro, Ozamiz 100,330 8,958 -21.46%11 Southern Mindanao Davao, Gen.Santos 1,033,021 1,682,492 5.00%12 Central Mindanao Iligan 47,035 21,53913 Caraga Surigao, Nasipit 41,165 3,115 -22.75%
ARMM ARMM ARMM 2,896 0TOTAL 1,831,960 2,070,856 1.23%

5-10
(3) Foreign Bulk Cargo
Figure 5.2.6 Foreign Bulk Cargo by Regions Foreign Bulk cargo volume increased from 35 million tons in 1991 to 52 million tons in 2001. Import bulk cargo volume is three times larger than the export cargo volume. Major commodities of import bulk cargo are crude petroleum and mineral fuel. Major commodities of export bulk cargo are metalliferous exported at Northern Mindanao region followed by coconut oil. Ilocos region showed the largest increase because a coal power plant started operations there. This should be understood as a temporary increase. Detailed figures can be seen in Table 5.2.5.
Fore ign Bulk Cargo by Regions(Unit : ton)
0
5,000,000
10,000,000
15,000,000
20,000,000
25,000,000
30,000,000N
CR
+3+4
A
CA
R
Iloco
s
Cag
ayan
Val
ley
Sou
ther
n T
agal
og
Bic
ol
Wes
tern
Vis
ayas
Cen
tral
Vis
ayas
East
ern
Vis
ayas
Wes
tern
Min
dana
o
Nor
ther
n M
inda
nao
Sou
ther
n M
inda
nao
Cen
tral
Min
dana
o
Car
aga
AR
MM
19912001

5-11
Table 5.2.5 Foreign Bulk Cargo by Regions
Source: PPA & CPA
Unit : tonRegion Region Port Management Body Total Total Growth Rate
No. 1991 2001NCR NCR+3+4A Subic, Manila, Batangas 17,542,926 28,022,277 4.79%CAR CAR 0 0
1 Ilocos San Fernando, BCDA 291,793 3,513,941 28.25%2 Cagayan Valley San Fernando, CEZA 0 55,500
4B Southern Tagalog Calapan, P. Princesa 520,441 483,258 -0.74%5 Bicol Legazpi 177,814 245,103 3.26%6 Western Visayas Iloilo 576,725 463,734 -2.16%7 Central Visayas Cebu, Dumaguete, Tagbilaran1,356,966 2,958,378 8.11%8 Eastern Visayas Tacloban 2,448,275 2,445,213 -0.01%9 Western Mindanao Zamboanga 243,395 257,646 0.57%10 Northern Mindanao Caga.De.Oro, Ozamiz 9,927,340 9,929,534 0.00%11 Southern Mindanao Davao, Gen.Santos 559,938 1,683,052 11.63%12 Central Mindanao Iligan 827,463 903,560 0.88%13 Caraga Surigao, Nasipit 351,500 1,041,128 11.47%
ARMM ARMM ARMM 0 0TOTAL 34,824,576 52,002,324 4.09%
Region Region Port Management Body Import Import Growth Rate
No. 1991 2001NCR NCR+3+4A Subic, Manila, Batangas 15,035,459 26,577,642 5.86%CAR CAR
1 Ilocos San Fernando, BCDA 110,119 3,483,174 41.26%2 Cagayan Valley San Fernando, CEZA
4B Southern Tagalog Calapan, P. Princesa 0 05 Bicol Legazpi 6,964 109,399 31.71%6 Western Visayas Iloilo 239,351 315,195 2.79%7 Central Visayas Cebu, Dumaguete, Tagbilaran 452,861 880,169 6.87%8 Eastern Visayas Tacloban 1,651,438 1,880,433 1.31%9 Western Mindanao Zamboanga 25,355 9,076 -9.76%10 Northern Mindanao Caga.De.Oro, Ozamiz 5,064,235 4,653,977 -0.84%11 Southern Mindanao Davao, Gen.Santos 189,270 543,777 11.13%12 Central Mindanao Iligan 359,507 436,349 1.96%13 Caraga Surigao, Nasipit 0 53,736
ARMM ARMM ARMM 0 0TOTAL 23,134,559 38,942,927 5.35%
Region Region Port Management Body Export Export Growth Rate
No. 1991 2001NCR NCR+3+4A Subic, Manila, Batangas 2,507,467 1,444,635 -5.36%CAR CAR
1 Ilocos San Fernando, BCDA 181,674 30,767 -16.27%2 Cagayan Valley San Fernando, CEZA 55,500
4B Southern Tagalog Calapan, P. Princesa 520,441 483,258 -0.74%5 Bicol Legazpi 170,850 135,704 -2.28%6 Western Visayas Iloilo 337,374 148,539 -7.88%7 Central Visayas Cebu, Dumaguete, Tagbilaran 904,105 2,078,209 8.68%8 Eastern Visayas Tacloban 796,837 564,780 -3.38%9 Western Mindanao Zamboanga 218,040 248,570 1.32%10 Northern Mindanao Caga.De.Oro, Ozamiz 4,863,105 5,275,557 0.82%11 Southern Mindanao Davao, Gen.Santos 370,668 1,139,275 11.88%12 Central Mindanao Iligan 467,956 467,211 -0.02%13 Caraga Surigao, Nasipit 351,500 987,392 10.88%
ARMM ARMM ARMM 0 0TOTAL 11,690,017 13,059,397 1.11%

5-12
(4) Domestic Container Cargo
Figure 5.2.7 Domestic Container Cargo by Regions Domestic container cargo volume increased from 14.3 million tons in 1991 to 26.9 million tons in 2001. Domestic container cargo has continued to increase at a high growth rate. All the incoming and outgoing container cargo was primarily from the NCR region followed by Central Visayas, Southern Mindanao, Northern Mindanao and Western Visayas. Domestic container cargo is mainly adopted for long distance transport and transported by long distance RO/RO ferry vessels and conventional cargo vessels.
Domestic Containerized Cargo by Regions(unit :ton)
0
2,000,000
4,000,000
6,000,000
8,000,000
10,000,000
12,000,000
14,000,000
16,000,000N
CR
+ 4
A
CA
R
Iloc
os
Cag
ayan
Val
ley
Cen
tral
Luz
on
Sout
hern
Tag
alog
Bic
ol
Wes
tern
Vis
ayas
Cen
tral
Vis
ayas
Eas
tern
Vis
ayas
Wes
tern
Min
dana
o
Nor
ther
n M
inda
nao
Sout
hern
Min
dana
o
Cen
tral
Min
dana
o
Car
aga
AR
MM
19912001
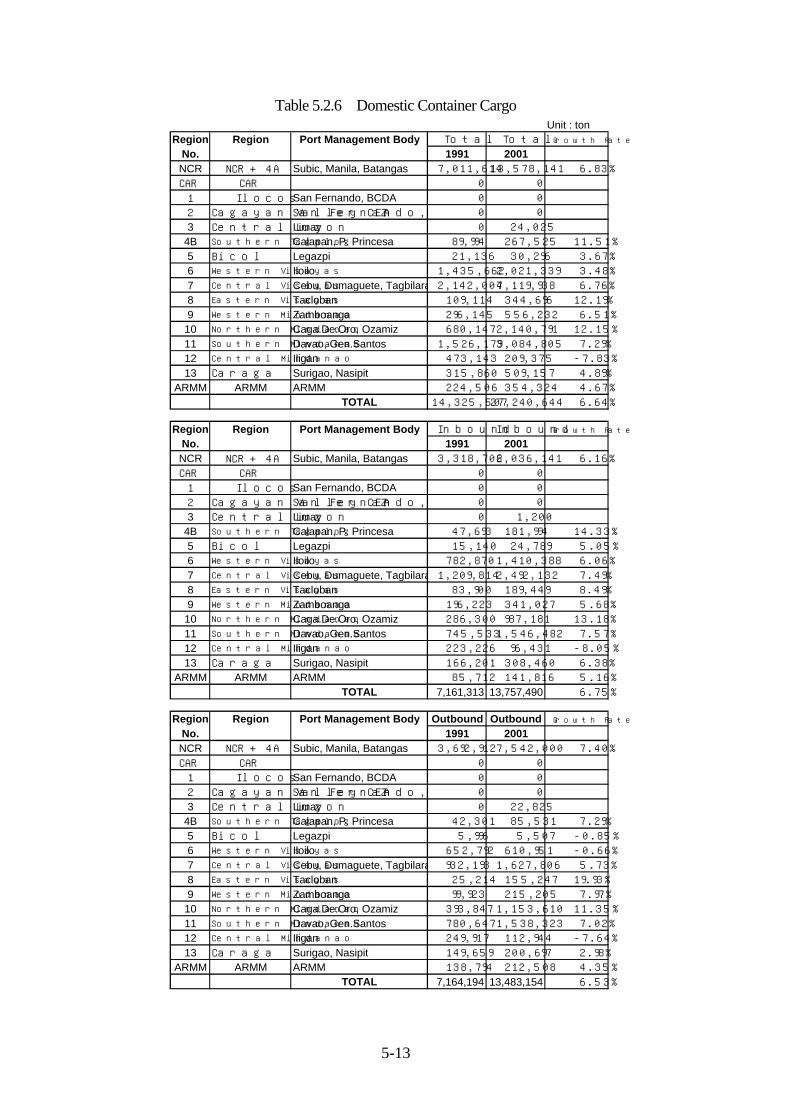
5-13
Table 5.2.6 Domestic Container Cargo Unit : ton
Region Region Port Management Body Total Total Growth Rate
No. 1991 2001NCR NCR + 4A Subic, Manila, Batangas 7,011,614 13,578,141 6.83%CAR CAR 0 0
1 Ilocos San Fernando, BCDA 0 02 Cagayan Valley San Fernando, CEZA 0 03 Central Luzon Limay 0 24,025
4B Southern Tagalog Calapan, P. Princesa 89,994 267,525 11.51%5 Bicol Legazpi 21,136 30,296 3.67%6 Western Visayas Iloilo 1,435,662 2,021,339 3.48%7 Central Visayas Cebu, Dumaguete, Tagbilaran2,142,007 4,119,938 6.76%8 Eastern Visayas Tacloban 109,114 344,696 12.19%9 Western Mindanao Zamboanga 296,145 556,232 6.51%
10 Northern Mindanao Caga.De.Oro, Ozamiz 680,147 2,140,791 12.15%11 Southern Mindanao Davao, Gen.Santos 1,526,179 3,084,805 7.29%12 Central Mindanao Iligan 473,143 209,375 -7.83%13 Caraga Surigao, Nasipit 315,860 509,157 4.89%
ARMM ARMM ARMM 224,506 354,324 4.67%TOTAL 14,325,507 27,240,644 6.64%
Region Region Port Management Body Inbound Inbound Growth Rate
No. 1991 2001NCR NCR + 4A Subic, Manila, Batangas 3,318,702 6,036,141 6.16%CAR CAR 0 0
1 Ilocos San Fernando, BCDA 0 02 Cagayan Valley San Fernando, CEZA 0 03 Central Luzon Limay 0 1,200
4B Southern Tagalog Calapan, P. Princesa 47,693 181,994 14.33%5 Bicol Legazpi 15,140 24,789 5.05%6 Western Visayas Iloilo 782,870 1,410,388 6.06%7 Central Visayas Cebu, Dumaguete, Tagbilaran1,209,814 2,492,132 7.49%8 Eastern Visayas Tacloban 83,900 189,449 8.49%9 Western Mindanao Zamboanga 196,223 341,027 5.68%
10 Northern Mindanao Caga.De.Oro, Ozamiz 286,300 987,181 13.18%11 Southern Mindanao Davao, Gen.Santos 745,533 1,546,482 7.57%12 Central Mindanao Iligan 223,226 96,431 -8.05%13 Caraga Surigao, Nasipit 166,201 308,460 6.38%
ARMM ARMM ARMM 85,712 141,816 5.16%TOTAL 7,161,313 13,757,490 6.75%
Region Region Port Management Body Outbound Outbound Growth Rate
No. 1991 2001NCR NCR + 4A Subic, Manila, Batangas 3,692,912 7,542,000 7.40%CAR CAR 0 0
1 Ilocos San Fernando, BCDA 0 02 Cagayan Valley San Fernando, CEZA 0 03 Central Luzon Limay 0 22,825
4B Southern Tagalog Calapan, P. Princesa 42,301 85,531 7.29%5 Bicol Legazpi 5,996 5,507 -0.85%6 Western Visayas Iloilo 652,792 610,951 -0.66%7 Central Visayas Cebu, Dumaguete, Tagbilaran 932,193 1,627,806 5.73%8 Eastern Visayas Tacloban 25,214 155,247 19.93%9 Western Mindanao Zamboanga 99,923 215,205 7.97%
10 Northern Mindanao Caga.De.Oro, Ozamiz 393,847 1,153,610 11.35%11 Southern Mindanao Davao, Gen.Santos 780,647 1,538,323 7.02%12 Central Mindanao Iligan 249,917 112,944 -7.64%13 Caraga Surigao, Nasipit 149,659 200,697 2.98%
ARMM ARMM ARMM 138,794 212,508 4.35%TOTAL 7,164,194 13,483,154 6.53%

5-14
(5) Domestic Break Bulk Cargo
Figure 5.2.8 Domestic Break Bulk Cargo by Regions s Domestic break bulk cargo volume has increased from 25.5 million tons in 1991 to 31.5 million tons in 2001. Statistical domestic break bulk cargo can be classified into two categories, one is RO/RO cargo and the other is actual break bulk cargo. Major commodity of RO/RO cargo is transport equipment. Figure 5.2.8 and Table 5.2.7 show total domestic break bulk cargo, which is further divided into RO/RO cargo and actual break bulk cargo. Results of further analysis are found in Table 5.2.8 and 5.2.9.
Domestic Break Bulk Cargo by Regions(Unit : ton)
0
1,000,000
2,000,000
3,000,000
4,000,000
5,000,000
6,000,000
7,000,000
8,000,000
9,000,000
NC
R +
4A
CA
R
Iloc
os
Cag
ayan
Val
ley
Cen
tral
Luz
on
Sout
hern
Tag
alog
Bic
ol
Wes
tern
Vis
ayas
Cen
tral
Vis
ayas
Eas
tern
Vis
ayas
Wes
tern
Min
dana
o
Nor
ther
n M
inda
nao
Sout
hern
Min
dana
o
Cen
tral
Min
dana
o
Car
aga
AR
MM
19912001

5-15
Table 5.2.7 Domestic Break Bulk Cargo Unit : ton
Region Region Port Management Body Total Total Growth Rate
No. 1991 2001NCR NCR + 4A Subic, Manila, Batangas 6,126,549 5,813,131 -0.52%CAR CAR 0 0
1 Ilocos San Fernando, BCDA 194,582 71,251 -9.56%2 Cagayan Valley San Fernando, CEZA 64,708 408 -39.74%3 Central Luzon Limay 0 0
4B Southern Tagalog Calapan, P. Princesa 766,495 972,930 2.41%5 Bicol Legazpi 1,237,069 2,494,950 7.27%6 Western Visayas Iloilo 3,161,025 3,119,623 -0.13%7 Central Visayas Cebu, Dumaguete, Tagbilaran5,816,276 7,656,308 2.79%8 Eastern Visayas Tacloban 1,460,553 3,472,875 9.05%9 Western Mindanao Zamboanga 936,096 957,544 0.23%10 Northern Mindanao Caga.De.Oro, Ozamiz 1,165,882 3,047,840 10.09%11 Southern Mindanao Davao, Gen.Santos 1,326,246 780,076 -5.17%12 Central Mindanao Iligan 1,536,419 1,900,796 2.15%13 Caraga Surigao, Nasipit 1,087,443 1,210,265 1.08%
ARMM ARMM ARMM 591,104 349,018 -5.13%TOTAL 25,470,447 31,847,015 2.26%
Region Region Port Management Body Inbound Inbound Growth Rate
No. 1991 2001NCR NCR + 4A Subic, Manila, Batangas 4,380,508 3,907,495 -1.14%CAR CAR 0 0
1 Ilocos San Fernando, BCDA 103,455 59,362 -5.40%2 Cagayan Valley San Fernando, CEZA 8,031 408 -25.76%3 Central Luzon Limay 0 0
4B Southern Tagalog Calapan, P. Princesa 402,980 535,733 2.89%5 Bicol Legazpi 789,314 1,451,302 6.28%6 Western Visayas Iloilo 1,707,736 1,838,962 0.74%7 Central Visayas Cebu, Dumaguete, Tagbilaran3,402,864 3,370,278 -0.10%8 Eastern Visayas Tacloban 723,174 1,743,430 9.20%9 Western Mindanao Zamboanga 602,333 575,318 -0.46%10 Northern Mindanao Caga.De.Oro, Ozamiz 311,575 1,394,958 16.17%11 Southern Mindanao Davao, Gen.Santos 534,836 422,428 -2.33%12 Central Mindanao Iligan 226,943 728,267 12.37%13 Caraga Surigao, Nasipit 316,940 424,051 2.95%
ARMM ARMM ARMM 225,466 196,677 -1.36%TOTAL 13,736,155 16,648,669 1.94%
Region Region Port Management Body Outbound Outbound Growth Rate
No. 1991 2001NCR NCR + 4A Subic, Manila, Batangas 1,746,041 1,905,636 0.88%CAR CAR 0 0
1 Ilocos San Fernando, BCDA 91,127 11,889 -18.43%2 Cagayan Valley San Fernando, CEZA 56,677 03 Central Luzon Limay 0 0
4B Southern Tagalog Calapan, P. Princesa 363,515 437,197 1.86%5 Bicol Legazpi 447,755 1,043,648 8.83%6 Western Visayas Iloilo 1,453,289 1,280,661 -1.26%7 Central Visayas Cebu, Dumaguete, Tagbilaran2,413,412 4,286,030 5.91%8 Eastern Visayas Tacloban 737,379 1,729,445 8.90%9 Western Mindanao Zamboanga 333,763 382,226 1.37%10 Northern Mindanao Caga.De.Oro, Ozamiz 854,307 1,652,882 6.82%11 Southern Mindanao Davao, Gen.Santos 791,410 357,648 -7.64%12 Central Mindanao Iligan 1,309,476 1,172,529 -1.10%13 Caraga Surigao, Nasipit 770,503 786,214 0.20%
ARMM ARMM ARMM 365,638 152,341 -8.38%TOTAL 11,734,292 15,198,346 2.62%

5-16
1) Domestic RO/RO Cargo (Transport Equipment)
Figure 5.2.9 Domestic RO/RO cargo by Regions Short distance RO/RO vessels transport domestic RO/RO cargo (mainly transport equipment such as buses, trucks, jeepney, etc.). RO/RO cargo has increased rapidly from 2.7 million tons in 1991 to 9.2 million tons in 2001, especially in Bicol and Eastern Visayas. (It should be noted that the RO/RO cargo volume includes only the weight of the vehicles being carried, and excludes the weight of any cargo that vehicle may be carrying.) These regions are located on the Pan-Philippine Highway. Increased growth is also seen in Central Visayas, Northern Mindanao and Central Mindanao; these regions are located around Visayas Sea. The above regions can continue to expect high growth in future.
Domestic RO/RO Cargo by Regions(Unit : ton)
0
200,000
400,000
600,000
800,000
1,000,000
1,200,000
1,400,000
1,600,000
1,800,000
2,000,000N
CR
+ 4
A
CA
R
Iloc
os
Cag
ayan
Val
ley
Cen
tral
Luz
on
Sout
hern
Tag
alog
Bic
ol
Wes
tern
Vis
ayas
Cen
tral
Vis
ayas
Eas
tern
Vis
ayas
Wes
tern
Min
dana
o
Nor
ther
n M
inda
nao
Sout
hern
Min
dana
o
Cen
tral
Min
dana
o
Car
aga
AR
MM
1991
2001
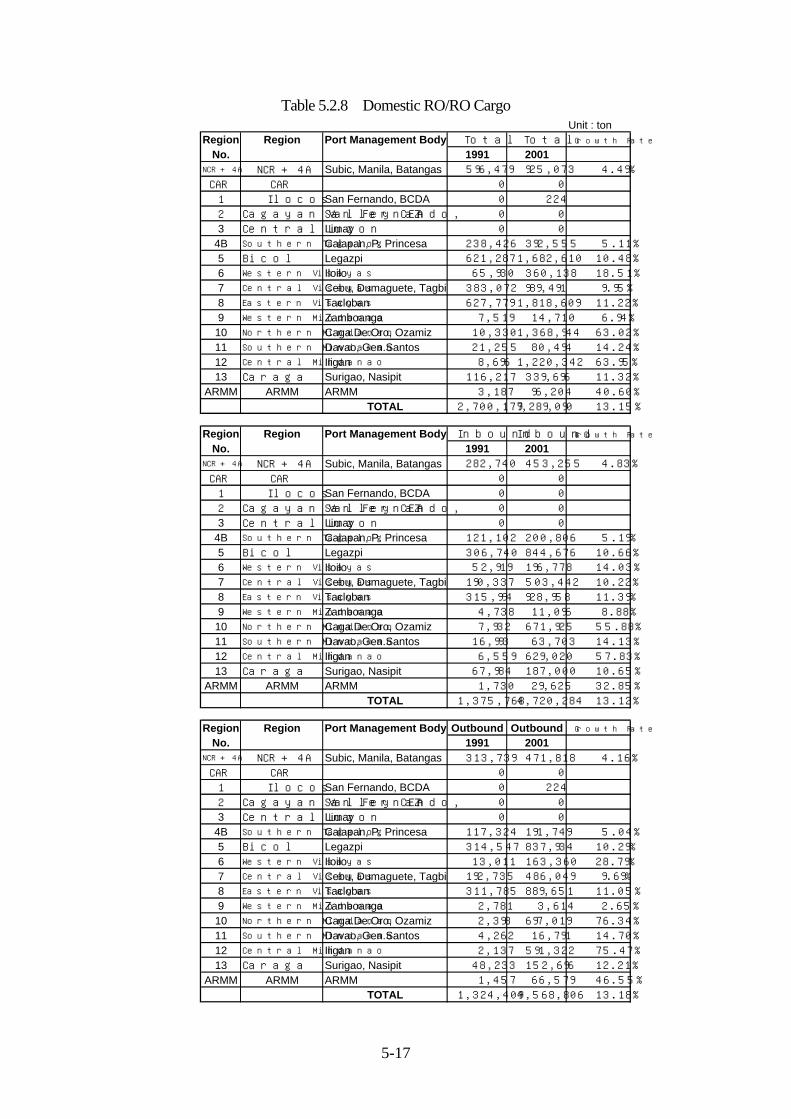
5-17
Table 5.2.8 Domestic RO/RO Cargo Unit : ton
Region Region Port Management Body Total Total Growth Rate
No. 1991 2001NCR + 4A NCR + 4A Subic, Manila, Batangas 596,479 925,073 4.49%CAR CAR 0 0
1 Ilocos San Fernando, BCDA 0 2242 Cagayan Valley San Fernando, CEZA 0 03 Central Luzon Limay 0 0
4B Southern Tagalog Calapan, P. Princesa 238,426 392,555 5.11%5 Bicol Legazpi 621,287 1,682,610 10.48%6 Western Visayas Iloilo 65,930 360,138 18.51%7 Central Visayas Cebu, Dumaguete, Tagbilaran383,072 989,491 9.95%8 Eastern Visayas Tacloban 627,779 1,818,609 11.22%9 Western Mindanao Zamboanga 7,519 14,710 6.94%
10 Northern Mindanao Caga.De.Oro, Ozamiz 10,330 1,368,944 63.02%11 Southern Mindanao Davao, Gen.Santos 21,255 80,494 14.24%12 Central Mindanao Iligan 8,696 1,220,342 63.95%13 Caraga Surigao, Nasipit 116,217 339,696 11.32%
ARMM ARMM ARMM 3,187 96,204 40.60%TOTAL 2,700,177 9,289,090 13.15%
Region Region Port Management Body Inbound Inbound Growth Rate
No. 1991 2001NCR + 4A NCR + 4A Subic, Manila, Batangas 282,740 453,255 4.83%CAR CAR 0 0
1 Ilocos San Fernando, BCDA 0 02 Cagayan Valley San Fernando, CEZA 0 03 Central Luzon Limay 0 0
4B Southern Tagalog Calapan, P. Princesa 121,102 200,806 5.19%5 Bicol Legazpi 306,740 844,676 10.66%6 Western Visayas Iloilo 52,919 196,778 14.03%7 Central Visayas Cebu, Dumaguete, Tagbilaran190,337 503,442 10.22%8 Eastern Visayas Tacloban 315,994 928,958 11.39%9 Western Mindanao Zamboanga 4,738 11,096 8.88%
10 Northern Mindanao Caga.De.Oro, Ozamiz 7,932 671,925 55.88%11 Southern Mindanao Davao, Gen.Santos 16,993 63,703 14.13%12 Central Mindanao Iligan 6,559 629,020 57.83%13 Caraga Surigao, Nasipit 67,984 187,000 10.65%
ARMM ARMM ARMM 1,730 29,625 32.85%TOTAL 1,375,768 4,720,284 13.12%
Region Region Port Management Body Outbound Outbound Growth Rate
No. 1991 2001NCR + 4A NCR + 4A Subic, Manila, Batangas 313,739 471,818 4.16%CAR CAR 0 0
1 Ilocos San Fernando, BCDA 0 2242 Cagayan Valley San Fernando, CEZA 0 03 Central Luzon Limay 0 0
4B Southern Tagalog Calapan, P. Princesa 117,324 191,749 5.04%5 Bicol Legazpi 314,547 837,934 10.29%6 Western Visayas Iloilo 13,011 163,360 28.79%7 Central Visayas Cebu, Dumaguete, Tagbilaran192,735 486,049 9.69%8 Eastern Visayas Tacloban 311,785 889,651 11.05%9 Western Mindanao Zamboanga 2,781 3,614 2.65%
10 Northern Mindanao Caga.De.Oro, Ozamiz 2,398 697,019 76.34%11 Southern Mindanao Davao, Gen.Santos 4,262 16,791 14.70%12 Central Mindanao Iligan 2,137 591,322 75.47%13 Caraga Surigao, Nasipit 48,233 152,696 12.21%
ARMM ARMM ARMM 1,457 66,579 46.55%TOTAL 1,324,409 4,568,806 13.18%

5-18
2) Actual Break Bulk Cargo by Regions
Figure 5.2.10 Actual Break Bulk Cargo by Regions Statistical break bulk cargo is classified into RO/RO cargo and actual break bulk cargo. Actual bulk cargo is cargo that cannot be containerized cargo such as long Iron & Steel, some types of heavy cargo and small-lot consignment and that is not carried on a vehicle in a vessel. However, transport equipment (vehicles) does not fall under this category. Actual domestic break bulk cargo was 22.8 million tons in 1991 and 22.7 million tons in 2001. Actual domestic break bulk shows a slightly downward trend. Break bulk cargo is shifting to RO/RO cargo, container cargo and bulk cargo. GCR, Central Visayas and Western Visayas, where much of actual break bulk cargo is handled, distributes break bulk cargo (sometimes transported as container cargo) to neighboring areas.
Actual Domestic Break Bulk Cargo by Regions(Unit : ton)
0
1,000,000
2,000,000
3,000,000
4,000,000
5,000,000
6,000,000
7,000,000
8,000,000N
CR
+ 4
A
CA
R
Iloc
os
Cag
ayan
Val
ley
Cen
tral
Luz
on
Sout
hern
Tag
alog
Bic
ol
Wes
tern
Vis
ayas
Cen
tral
Vis
ayas
Eas
tern
Vis
ayas
Wes
tern
Min
dana
o
Nor
ther
n M
inda
nao
Sout
hern
Min
dana
o
Cen
tral
Min
dana
o
Car
aga
AR
MM
19912001

5-19
Table 5.2.9 Actual Domestic Break Bulk Cargo Unit : ton
Region Region Port Management Body Total Total Growth Rate
No. 1991 2001NCR NCR + 4A Subic, Manila, Batangas 5,530,070 4,888,058 -1.23%CAR CAR 0 0
1 Ilocos San Fernando, BCDA 194,582 71,027 -9.59%2 Cagayan Valley San Fernando, CEZA 64,708 4083 Central Luzon Limay 0 0
4B Southern Tagalog Calapan, P. Princesa 528,069 580,375 0.95%5 Bicol Legazpi 615,782 812,340 2.81%6 Western Visayas Iloilo 3,095,095 2,759,485 -1.14%7 Central Visayas Cebu, Dumaguete, Tagbilaran5,433,204 6,666,817 2.07%8 Eastern Visayas Tacloban 832,774 1,654,266 7.10%9 Western Mindanao Zamboanga 928,577 942,834 0.15%10 Northern Mindanao Caga.De.Oro, Ozamiz 1,155,552 1,678,896 3.81%11 Southern Mindanao Davao, Gen.Santos 1,304,991 699,582 -6.04%12 Central Mindanao Iligan 1,527,723 680,454 -7.77%13 Caraga Surigao, Nasipit 971,226 870,569 -1.09%
ARMM ARMM ARMM 587,917 348,618 -5.09%TOTAL 22,770,270 22,653,730 -0.05%
Region Region Port Management Body Inbound Inbound Growth Rate
No. 1991 2001NCR NCR + 4A Subic, Manila, Batangas 4,097,768 3,454,240 -1.69%CAR CAR 0 0
1 Ilocos San Fernando, BCDA 103,455 59,362 -5.40%2 Cagayan Valley San Fernando, CEZA 8,031 4083 Central Luzon Limay 0 0
4B Southern Tagalog Calapan, P. Princesa 281,878 334,927 1.74%5 Bicol Legazpi 482,574 606,626 2.31%6 Western Visayas Iloilo 1,654,817 1,642,184 -0.08%7 Central Visayas Cebu, Dumaguete, Tagbilaran3,212,527 2,866,836 -1.13%8 Eastern Visayas Tacloban 407,180 814,472 7.18%9 Western Mindanao Zamboanga 597,595 564,222 -0.57%10 Northern Mindanao Caga.De.Oro, Ozamiz 303,643 723,033 9.06%11 Southern Mindanao Davao, Gen.Santos 517,843 358,725 -3.60%12 Central Mindanao Iligan 220,384 99,247 -7.67%13 Caraga Surigao, Nasipit 248,956 237,051 -0.49%
ARMM ARMM ARMM 223,736 196,277 -1.30%TOTAL 12,360,387 11,957,610 -0.33%
Region Region Port Management Body Outbound Outbound Growth Rate
No. 1991 2001NCR NCR + 4A Subic, Manila, Batangas 1,432,302 1,433,818 0.01%CAR CAR 0 0
1 Ilocos San Fernando, BCDA 91,127 11,665 -18.58%2 Cagayan Valley San Fernando, CEZA 56,677 03 Central Luzon Limay 0 0
4B Southern Tagalog Calapan, P. Princesa 246,191 245,448 -0.03%5 Bicol Legazpi 133,208 205,714 4.44%6 Western Visayas Iloilo 1,440,278 1,117,301 -2.51%7 Central Visayas Cebu, Dumaguete, Tagbilaran2,220,677 3,799,981 5.52%8 Eastern Visayas Tacloban 425,594 839,794 7.03%9 Western Mindanao Zamboanga 330,982 378,612 1.35%10 Northern Mindanao Caga.De.Oro, Ozamiz 851,909 955,863 1.16%11 Southern Mindanao Davao, Gen.Santos 787,148 340,857 -8.03%12 Central Mindanao Iligan 1,307,339 581,207 -7.79%13 Caraga Surigao, Nasipit 722,270 633,518 -1.30%
ARMM ARMM ARMM 364,181 152,341 -8.35%TOTAL 10,409,883 10,696,119 0.27%

5-20
(6) Domestic Bulk Cargo by Regions
Figure 5.2.11 Domestic Bulk Cargo by Regions Figure 5.2.11 shows the situation of domestic bulk cargo. Domestic bulk cargo has increased from 19.2 million tons in 1991 to 28.8 million tons in 2001. Domestic bulk cargo has a strong increase. The major commodity of domestic bulk cargo is refined petroleum. Crude petroleum is imported at Central Luzon and Southern Tagalog (Region 4A) and refined there. Major origins of domestic bulk cargo are Central Luzon and Southern Tagalog (Region 4A) and destinations are NCR, Central Luzon, Central Visayas and other regions. Almost all domestic bulk cargo is handled at private ports. Detailed figures are seen in Table 5.2.10
Domestic Bulk Cargo by Regions(Unit : ton)
0
1,000,000
2,000,000
3,000,000
4,000,000
5,000,000
6,000,000
7,000,000N
CR
CA
R
Iloc
os
Cag
ayan
Val
ley
Cen
tral
Luz
on
Sout
hern
Tag
alog
Sout
hern
Tag
alog
Bic
ol
Wes
tern
Vis
ayas
Cen
tral
Vis
ayas
Eas
tern
Vis
ayas
Wes
tern
Min
dana
o
Nor
ther
n M
inda
nao
Sout
hern
Min
dana
o
Cen
tral
Min
dana
o
Car
aga
AR
MM
19912001

5-21
Table 5.2.10 Domestic Bulk Cargo Unit : ton
Region Region Port Management Body Total Total Growth Rate
No. 1991 2001NCR NCR Manila 2,974,369 4,963,574 5.25%CAR CAR 0 0
1 Ilocos San Fernando, BCDA 652,812 246,339 -9.29%2 Cagayan Valley San Fernando, CEZA 140 03 Central Luzon Limay, Subic 3,929,520 6,164,123 4.61%
4A Southern Tagalog Batangas 3,192,083 6,506,901 7.38%4B Southern Tagalog Calapan, P. Princesa 105,176 145,283 3.28%5 Bicol Legazpi 323,809 476,071 3.93%6 Western Visayas Iloilo 763,018 1,572,470 7.50%7 Central Visayas Cebu, Dumaguete, Tagbilaran2,502,769 2,436,968 -0.27%8 Eastern Visayas Tacloban 1,091,866 1,456,602 2.92%9 Western Mindanao Zamboanga 414,412 386,524 -0.69%10 Northern Mindanao Caga.De.Oro, Ozamiz 1,325,084 2,307,584 5.70%11 Southern Mindanao Davao, Gen.Santos 779,130 1,293,283 5.20%12 Central Mindanao Iligan 686,238 547,706 -2.23%13 Caraga Surigao, Nasipit 413,401 340,086 -1.93%
ARMM ARMM ARMM 69,033 72,304 0.46%TOTAL 19,222,860 28,915,818 4.17%
Region Region Port Management Body Inbound Inbound Growth Rate
No. 1991 2001NCR NCR Manila 2,956,891 4,896,289 5.17%CAR CAR 0 0
1 Ilocos San Fernando, BCDA 571,337 244,308 -8.14%2 Cagayan Valley San Fernando, CEZA 20 03 Central Luzon Limay, Subic 55,926 392,843 21.52%
4A Southern Tagalog Batangas 767,421 2,113,429 10.66%4B Southern Tagalog Calapan, P. Princesa 42,731 128,990 11.68%5 Bicol Legazpi 183,887 373,377 7.34%6 Western Visayas Iloilo 565,915 1,242,236 8.18%7 Central Visayas Cebu, Dumaguete, Tagbilaran1,033,855 915,241 -1.21%8 Eastern Visayas Tacloban 821,043 412,585 -6.65%9 Western Mindanao Zamboanga 214,849 324,804 4.22%10 Northern Mindanao Caga.De.Oro, Ozamiz 1,294,987 1,613,661 2.22%11 Southern Mindanao Davao, Gen.Santos 516,957 1,101,581 7.86%12 Central Mindanao Iligan 616,871 465,026 -2.79%13 Caraga Surigao, Nasipit 253,330 234,632 -0.76%
ARMM ARMM ARMM 52,896 72,304 3.17%TOTAL 9,948,916 14,531,306 3.86%
Region Region Port Management Body Outbound Outbound Growth RateNo. 1991 2001
NCR NCR Manila 17,478 67,285 14.43%CAR CAR 0 0
1 Ilocos San Fernando, BCDA 81,475 2,031 -30.87%2 Cagayan Valley San Fernando, CEZA 120 03 Central Luzon Limay, Subic 3,873,594 5,771,280 4.07%
4A Southern Tagalog Batangas 2,424,662 4,393,472 6.12%4B Southern Tagalog Calapan, P. Princesa 62,445 16,293 -12.57%5 Bicol Legazpi 139,922 102,694 -3.05%6 Western Visayas Iloilo 197,103 330,234 5.30%7 Central Visayas Cebu, Dumaguete, Tagbilaran1,468,914 1,521,727 0.35%8 Eastern Visayas Tacloban 270,823 1,044,017 14.45%9 Western Mindanao Zamboanga 199,563 61,720 -11.07%10 Northern Mindanao Caga.De.Oro, Ozamiz 30,097 693,923 36.86%11 Southern Mindanao Davao, Gen.Santos 262,173 191,702 -3.08%12 Central Mindanao Iligan 69,367 82,680 1.77%13 Caraga Surigao, Nasipit 160,071 105,454 -4.09%
ARMM ARMM ARMM 16,137 0TOTAL 9,273,944 14,384,512 4.49%

5-22
5.3 Present Sea Passenger Traffic by Regions 5.3.1 Present Sea Passenger Traffic by Regions
Figure 5.3.1 Present Sea Passenger Traffic by Regions Domestic sea passenger traffic by region is shown in Figure 5.3.1 (also see Table5.3.1). Sea passenger traffic increased from 31 million passengers in 1991 to 55 million passengers in 2001. Sea passengers are classified into long distance passenger and short distance passenger. Long distance passengers are carried on long distance transport vessels and stay on board at least one night or more than twelve (12) hours. Short distance passengers are carried on short distance transport vessels such as RO/RO vessels, fast ships and traditional boats. Figure 5.3.1 shows that passenger traffic in Western Visayas, Central Visayas, Eastern Visayas, Western Mindanao and Northern Mindanao are increasing, with short distance passenger accounting for most of the traffic.
Sea Passenger Traffic
0
2,000,000
4,000,000
6,000,000
8,000,000
10,000,000
12,000,000
14,000,000
16,000,000
18,000,000
20,000,000
NC
R
Cen
tral
Luz
on
Sout
hern
Tag
alog
Sout
hern
Tag
alog
Bic
ol
Wes
tern
Vis
ayas
Cen
tral
Vis
ayas
Eas
tern
Vis
ayas
Wes
tern
Min
dana
o
Nor
ther
n M
inda
nao
Sout
hern
Min
dana
o
Cen
tral
Min
dana
o
Car
aga
AR
MM
persons
19912001

5-23
Table 5.3.1 Sea Passenger Traffic
Source: PPA Statistics and CPA
Region Region Port Management Body Total Total Growth Rate
No. 1991 2001NCR NCR Manila 3,308,912 3,435,663 0.38%
3 Central Luzon Limay, Subic 0 533,8774A Southern Tagalog Batangas 2,596,716 3,434,249 2.83%4B Southern Tagalog Calapan, P. Princesa 158,159 2,207,527 30.16%5 Bicol Legazpi 1,209,425 2,752,090 8.57%6 Western Visayas Iloilo 4,390,065 5,527,762 2.33%7 Central Visayas Cebu, Dumaguete, Tagbilaran7,375,929 17,662,986 9.13%8 Eastern Visayas Tacloban 2,321,219 3,892,072 5.30%9 Western Mindanao Zamboanga 2,386,047 5,244,387 8.19%10 Northern Mindanao Caga.De.Oro, Ozamiz 776,594 5,324,851 21.23%11 Southern Mindanao Davao, Gen.Santos 439,361 1,318,374 11.61%12 Central Mindanao Iligan 4,550,226 2,687,603 -5.13%13 Caraga Surigao, Nasipit 1,086,543 1,776,354 5.04%
ARMM ARMM ARMM 1,116,587 1,242,262 1.07%TOTAL 31,715,783 57,040,057 6.05%
Region Region Port Mangement Body Inbound Inbound Growth Rate
No. 1991 2001NCR NCR Manila 1,763,982 1,832,996 0.38%CAR CAR
1 Ilocos San Fernando2 Cagayan Valley San Fernando, CEZA3 Central Luzon Limay, Subic 260,494
4A Southern Tagalog Batangas 1,461,991 1,787,867 2.03%4B Southern Tagalog Calapan, P. Princesa 78,186 1,304,477 32.50%5 Bicol Legazpi 604,215 1,426,118 8.97%6 Western Visayas Iloilo 2,208,734 2,846,300 2.57%7 Central Visayas Cebu, Dumaguete, Tagbilaran3,704,134 9,006,375 9.29%8 Eastern Visayas Tacloban 1,166,781 1,967,514 5.36%9 Western Mindanao Zamboanga 1,211,175 2,643,093 8.12%10 Northern Mindanao Caga.De.Oro, Ozamiz 367,168 2,636,922 21.79%11 Southern Mindanao Davao, Gen.Santos 212,442 657,906 11.97%12 Central Mindanao Iligan 2,270,581 1,305,880 -5.38%13 Caraga Surigao, Nasipit 539,699 932,232 5.62%
ARMM ARMM ARMM 582,410 639,120 0.93%TOTAL 16,171,498 28,608,174 5.87%
Region Region Port Mangement Body Outbound Outbound Growth RateNo. 1991 2001NCR NCR Manila 1,544,930 1,602,667 0.37%CAR CAR
1 Ilocos San Fernando2 Cagayan Valley San Fernando, CEZA3 Central Luzon Limay, Subic 273,383
4A Southern Tagalog Batangas 1,134,725 1,646,382 3.79%4B Southern Tagalog Calapan, P. Princesa 79,973 903,050 27.43%5 Bicol Legazpi 605,210 1,325,972 8.16%6 Western Visayas Iloilo 2,181,331 2,681,462 2.09%7 Central Visayas Cebu, Dumaguete, Tagbilaran3,671,795 8,656,611 8.95%8 Eastern Visayas Tacloban 1,154,438 1,924,558 5.24%9 Western Mindanao Zamboanga 1,174,872 2,601,294 8.27%10 Northern Mindanao Caga.De.Oro, Ozamiz 409,426 2,687,929 20.70%11 Southern Mindanao Davao, Gen.Santos 226,919 660,468 11.28%12 Central Mindanao Iligan 2,279,645 1,381,723 -4.88%13 Caraga Surigao, Nasipit 546,844 844,122 4.44%
ARMM ARMM ARMM 534,177 603,142 1.22%TOTAL 15,544,285 27,189,621 5.75%

5-24
5.3.2 Present Long Distance Passenger and Short Distance Passenger by Traffic Modes
Figure 5.3.2 Long Distance Passenger by Traffic Mode There are three (3) modes for long distance passengers in Philippines: sea transportation, air transportation and land transportation. Land transportation is divided into road and railroad. Although the passengers transported by railroad (PNR) reached 1.65 million people in 1981, the volume decreased by 319 thousand in 2001 and only a negligible number was transported between Manila and Legazpi as long distance passenger, therefore railroad transportation will not be considered for long distance passenger transport. Buses are used to transport most long distance passengers on land. Long distance passenger by land shows a high growth rate but the actual volume is not so large. Long distance passenger by sea shows the smallest increase rate, although growth rate of short distance sea passengers is high.
Table 5.3.2 Long Distance Passengers
Source: PPA, CPA, Air transportation Office and survey by the Study Team
Long Distance Passenger by Mode
0
2,000,000
4,000,000
6,000,000
8,000,000
10,000,000
12,000,000
14,000,000
16,000,000
1991
1992
1993
1994
1995
1996
1997
1998
1999
2000
2001
2002
By SeaBy AirBy Land
Long Distance 1991 2002 IncreaseBy Sea 7,469,648 8,999,251 120.48%By Air 7,687,468 12,017,417 156.32%By Land 762,727 1,696,554 222.43%
Total 15,919,843 22,713,222 142.67%
Short Distance 1991 2002 IncreaseBy Sea 24,246,135 48,000,749 197.97%

5-25
5.4 Procedure for Estimation of Cargo and Passenger 5.4.1 Flow of Estimations The initial stage of the procedure is to collect statistical data on traffic activities, especially port-related data, and arrange them in a time series. Data is also arranged by regions according to the port management bodies. The data is complemented by data obtained through an OD survey conducted by the Study Team at the ports located on the Pan-Philippine Highway and through interviews at major ports in Philippines. The data is then analyzed to identify characteristics, trends and growth of cargo and passenger traffic. Further, the correlations between this data and socio-economic data are analyzed. Next, future cargo volume and passenger will be estimated according to the formulated socio-economic framework. The detailed procedure can be found in Appendix 5.2.
Figure 5.4.1 Flow of Estimations
Procedure for Cargo & Passenger Estimations
Collection Statistical Cargo & Natural Conditions
Passenger Data and Site Survey Socio-Economic Data
Analyze Analyze
Characteristics, Trends, Growth, etc. Analyze Characteristic, Trend, etc.
of Cargo and Passenger Correlation, Relevancy, of Population, GDP, GRDP, etc.
by Cargo Types, Regions and Ports Relation, etc.
Socio-Economic Framework
Population, GDP, GRDP, etc.
Future Cargo and Passenger
Estimations
by Cargo Types and Regions

5-26
5.4.2 Conditions for Estimations The followings conditions are adopted and considered for forecasting the passenger and cargo volumes. (1) Natural Conditions The Philippines is an archipelagic country consisting of more than 7,000 islands. (2) Socio-economic conditions 1) Population projection as given in chapter 2.1 is taken into account. 2) Three (3) GDP growth rate scenarios (3.5% in the low growth case, 4.5% in the medium growth
case and 5.73% in the high growth case) are adopted for macro estimations. 3) The medium growth case of GRDP (Gross Regional Domestic Product) projection as described
in chapter 2.2.1 is adopted for regional cargo estimations. 4) Potential growth areas as identified in Figure 2.2.12 are considered. 5) NCR, Region-3 and Region-4A are treated as the same region group where the same economic
trend and activities will be seen in a broad perspective. Greater Capital Region (GCR) covers these 3 regions.
(3) Present situations and trend of transportation 1) Break bulk cargo is shifting to containerized cargo. 2) Domestic break bulk cargo is classified into RO/RO cargo and break bulk cargo. 3) Passenger traffic is classified into long distance passenger and short distance passenger. 4) Future maximum containerized ratio is assumed as 90% for foreign and 80% for domestic. 5) Shortening of whole transportation time 6) Reducing the whole transportation cost 7) Reducing the cargo damage during transport 8) More efficient transport (Mass transportation without delays and multiple handling) 9) Reducing port development cost (4) Future development plans 1) Port Development Plans which are prepared mainly by PPA and other port development bodies 2) Road Development Plans which are prepared by DPWH.

5-27
5.5 Future Cargo Volume 5.5.1 Projected Total Cargo Volume (1) Total Cargo Volume Based on socio-economic frameworks and analysis of cargo statistics, total sea borne cargo volume is estimated for each of the economic growth scenarios. Three economic growth scenarios are as follows: Economic growth rate is projected at 5.73% in the high case, 4.5% in the medium case and 3.5% in the low case. In 2024, total cargo volume will reach 711 million tons (increase of 4.36 times over 2001 at an annual growth rate of 6.62%) in the high case, 535 million tons (3.28 times and 5.31%) in the medium case and 426 million tons (2.61 times and 4.27%) in the low case (see Figure 5.5.1 and Table 5.5.1). Average annual growth rate of cargo volume from 1980 to 1991 is 3.52% and that from 1991 to 2001 is 4.36%. Cargo growth rates of each scenario are listed in Table 5.5.1.
Figure 5.5.1 Macro estimation for Total Cargo volume by economic growth scenario (2) Cargo Volumes by Cargo Types in the Medium Growth Case Figure 5.5.2 shows macro estimations for cargo volume by cargo types that are estimated based on medium economic growth case. Detailed figures are shown in Table 5.5.2, 5.5.3 and 5.5.4. Foreign bulk cargo shows largest cargo volume, followed by domestic container cargo, domestic bulk cargo, foreign container cargo, domestic RO/RO cargo, domestic break bulk cargo and foreign break bulk cargo. Transition of share of each cargo type is seen in Table 5.5.3 and projected growth rates of each cargo type are given in Table 5.5.4.
Macro Estimation for Total Cargo Volume
0
100,000,000
200,000,000
300,000,000
400,000,000
500,000,000
600,000,000
700,000,000
800,000,000
1975 1980 1985 1990 1995 2000 2005 2010 2015 2020 2025 2030
Low Case
Medium Case
High Case

5-28
Table 5.5.1 Macro Estimations for Total Cargo Volume by Economic Growth Scenario
Figure 5.5.2 Macro Estimation for Cargo Volume by Cargo Types
Table 5.5.2 Macro Estimations for Cargo Volume by Cargo Types
Macro Estimation for Cargo Volume by Cargo Type(Unit : ton)
0
20,000,000
40,000,000
60,000,000
80,000,000
100,000,000
120,000,000
140,000,000
160,000,000
180,000,000
1991 2001 2009 2024
Foreign Container
Foreign Break Bulk
Foreign Bulk
Domestic Container
Domestic Break Bulk
Domestic Ro/Ro
Domestic Bulk
Unit : tonGDP Growth Scenario 1980 1991 2001 2009 2024 Growth RateLow Case 3.50% 72,628,086 106,228,301 163,582,991 238,719,412 424,770,922 4.24%Medium Case 4.50% 72,628,086 106,228,301 163,582,990 257,900,395 533,500,523 5.27%High Case 5.73% 72,628,086 106,228,301 163,582,991 274,616,392 709,485,729 6.59%
GDP Growth Scenario 1980 1980-1991 1991-2001 2001-2009 2009-2024 2001-2024Low Case 3.50% 3.52% 4.41% 4.84% 3.92% 4.24%Medium Case 4.50% 3.52% 4.41% 5.86% 4.97% 5.27%High Case 5.73% 3.52% 4.41% 6.69% 6.53% 6.59%
Unit : tonCargo Type 1991 2001 2009 2024
Foreign Container 5,896,078 15,102,165 31,353,955 81,621,403Foreign Break Bulk 6,488,833 8,379,221 11,318,304 15,957,630Foreign Bulk 34,824,576 52,002,324 78,003,926 158,969,886Domestic Container 14,001,675 26,498,367 47,193,215 115,089,556Domestic Break Bulk 23,094,102 23,396,007 23,662,946 29,490,124Domestic Ro/Ro 2,700,177 9,289,090 18,623,696 34,267,795Domestic Bulk 19,222,860 28,915,818 47,744,354 98,104,129
Foreign Cargo Total 47,209,487 75,483,710 120,676,184 256,548,919Domestic Cargo Total 59,018,814 88,099,281 137,224,211 276,951,604
Total 106,228,301 163,582,991 257,900,395 533,500,523

5-29
Figure 5.5.3 Macro Estimation for Cargo Volume by Cargo Types
Table 5.5.3 Share of Each Cargo Type
Table 5.5.4 Growth Rate for Each Cargo type
Macro Estimation for Cargo Volume by Cargo Types (Medium Case)(Unit : ton)
0
20,000,000
40,000,000
60,000,000
80,000,000
100,000,000
120,000,000
140,000,000
160,000,000
180,000,000
1990 1995 2000 2005 2010 2015 2020 2025
ForeignContainer
ForeignBreak Bulk
Foreign Bulk
DomesticContainer
DomesticBreak Bulk
DomesticRo/Ro
DomesticBulk
Cargo Type 1991 2001 2009 2024Foreign Container 5.55% 9.23% 12.16% 15.30%Foreign Break Bulk 6.11% 5.12% 4.39% 2.99%Foreign Bulk 32.78% 31.79% 30.25% 29.80%Domestic Container 13.18% 16.20% 18.30% 21.57%Domestic Break Bulk 21.74% 14.30% 9.18% 5.53%Domestic Ro/Ro 2.54% 5.68% 7.22% 6.42%Domestic Bulk 18.10% 17.68% 18.51% 18.39%
Foreign Cargo Total 44.44% 46.14% 46.79% 48.09%Domestic Cargo Total 55.56% 53.86% 53.21% 51.91%
Total 100.00% 100.00% 100.00% 100.00%
Cargo Type 1991-2001 2001-2009 2009-2024 2001-2024Foreign Container 9.86% 9.56% 6.59% 7.61%Foreign Break Bulk 2.59% 3.83% 2.32% 2.84%Foreign Bulk 4.09% 5.20% 4.86% 4.98%Domestic Container 6.59% 7.48% 6.12% 6.59%Domestic Break Bulk 0.13% 0.14% 1.48% 1.01%Domestic Ro/Ro 13.15% 9.08% 4.15% 5.84%Domestic Bulk 4.17% 6.47% 4.92% 5.46%
Foreign Cargo Total 4.81% 6.04% 5.16% 5.46%Domestic Cargo Total 4.09% 5.70% 4.79% 5.11%
Total 4.41% 5.86% 4.97% 5.27%

5-30
(3) Total Cargo Volume by Region in the Medium Growth Case
Figure 5.5.4 Total Cargo Volume by Regions Total cargo volume by regions is estimated according to the regional economic growth (GRDP) scenarios based on the medium economic growth (GDP) case. Projected regional cargo volumes are shown in Figure 5.5.4. Total cargo volume will increase from 163 million tons to 5.26 million tons and at a growth rate of 330%. GCR will handle the largest amount of cargo, followed by Central Visayas, Northern Mindanao and Southern Mindanao. GCR (NCR, Region 3 and Region 4A) shows largest cargo volume because the major portion of foreign cargo will be handled at this area. Details can be found in Chapter 5.5 Projected Cargo Volume by Cargo Type and by Region.
Total Cargo Estimation by Regions(Unit : ton)
0
50,000,000
100,000,000
150,000,000
200,000,000
250,000,000
300,000,000
350,000,000
NC
R +
3+4
A
CA
R
Iloco
s
Cag
ayan
Val
ley
Sou
ther
n Tag
alog
Bic
ol
Wes
tern
Vis
ayas
Cen
tral
Vis
ayas
Eas
tern
Vis
ayas
Wes
tern
Min
dana
o
Nor
ther
n M
inda
nao
Sou
ther
n M
inda
nao
Cen
tral
Min
dana
o
Car
aga
AR
MM
200120092024

5-31
Table 5.5.5 Total Cargo Estimation by Regions
Unit : tonRegion Total 2001 2009 2024NCR + 4A NCR + 3+4A 82,607,481 144,523,211 318,306,313CAR CAR 0 0 0
1 Ilocos 3,832,493 4,718,797 7,034,5202 Cagayan Valley 55,913 86,059 171,994
4B Southern Tagalog 1,877,489 2,002,023 3,640,3395 Bicol 3,353,416 5,356,250 12,019,5996 Western Visayas 7,449,660 11,358,494 20,791,7297 Central Visayas 18,558,044 25,896,765 51,286,1768 Eastern Visayas 8,011,786 10,430,688 21,162,0889 Western Mindanao 2,327,435 2,928,082 5,471,015
10 Northern Mindanao 17,988,311 23,349,228 40,290,24211 Southern Mindanao 9,858,155 15,561,004 33,601,55112 Central Mindanao 3,582,976 4,156,204 6,168,59113 Caraga 3,208,382 6,131,863 13,216,418
ARMM ARMM 871,450 1,499,169 2,630,014Total 163,582,990 257,997,837 535,790,589
Region Domestic Cargo 2001 2009 2024NCR + 4A NCR + 3+4A 37,049,895 63,163,284 134,260,861CAR CAR
1 Ilocos 317,590 492,114 918,1942 Cagayan Valley 408 86,059 171,994
4B Southern Tagalog 1,385,738 1,847,469 3,599,4575 Bicol 3,001,317 4,887,487 10,686,6156 Western Visayas 6,713,432 10,555,379 19,268,9607 Central Visayas 14,213,214 19,784,600 39,304,6948 Eastern Visayas 5,274,173 8,062,772 17,801,7469 Western Mindanao 1,900,300 2,651,745 4,788,330
10 Northern Mindanao 7,496,215 11,955,304 24,876,04611 Southern Mindanao 5,158,164 7,691,603 14,471,28512 Central Mindanao 2,657,877 3,327,576 4,924,49813 Caraga 2,059,508 3,045,059 4,910,270
ARMM ARMM 440,022 1,188,736 1,794,200Total 87,667,853 138,739,185 281,777,150
Region Foreign Cargo 2001 2009 2024NCR + 4A NCR + 3+4A 45,557,586 81,359,928 184,045,452CAR CAR 0 0 0
1 Ilocos 3,514,903 4,226,683 6,116,3262 Cagayan Valley 55,505 0 0
4B Southern Tagalog 491,751 154,555 40,8825 Bicol 352,099 468,762 1,332,9846 Western Visayas 736,228 803,115 1,522,7697 Central Visayas 4,344,830 6,112,166 11,981,4828 Eastern Visayas 2,737,613 2,367,916 3,360,3429 Western Mindanao 427,135 276,337 682,685
10 Northern Mindanao 10,492,096 11,393,924 15,414,19511 Southern Mindanao 4,699,991 7,869,400 19,130,26712 Central Mindanao 925,099 828,628 1,244,09313 Caraga 1,148,874 3,086,804 8,306,148
ARMM ARMM 431,428 310,433 835,814Total 75,915,138 119,258,652 254,013,439

5-32
5.5.2 Projected Cargo Volume by Cargo Type and by Region (1) Projected Foreign Container Cargo Volume by Region
Figure 5.5.5 Projected Foreign Container Cargo by Regions Projected foreign container cargo is shown in Figure 5.5.5 (Also see Table 5.5.6). Foreign container cargo will increase, reaching 31 million tons in 2009 and 81 million tons in 2024. This large increase will be partly due to the fact that break bulk cargo will shift to container cargo. Foreign container cargo will be handled in mainly 4 regions (GCR, Central Visayas, Northern Mindanao and Southern Mindanao). If the present situation continues, almost all foreign cargo will be handled in GCR and about 20% of foreign container cargo handled in GCR will be transferred as domestic container cargo to/from other regions. When international container terminals are opened at Visayas and Mindanao, percentage of foreign container cargo of GCR will decrease from 90% to 70%. Foreign container cargo in GCR will be 57.5 million tons in 2024.
Figure 5.5.6 Projected Foreign Container Cargo for each Area
Estimations for Foreign Containerized Cargo by Regions(unit :ton)
0
10,000,000
20,000,000
30,000,000
40,000,000
50,000,000
60,000,000
70,000,000
80,000,000N
CR
+ 3
+4A
CA
R
Iloco
s
Cag
ayan
Val
ley
Cen
tral
Luz
on
Sou
ther
n Tag
alog
Bic
ol
Wes
tern
Vis
ayas
Cen
tral
Vis
ayas
Eas
tern
Vis
ayas
Wes
tern
Min
dana
o
Nor
ther
n M
inda
nao
Sou
ther
n M
inda
nao
Cen
tral
Min
dana
o
Car
aga
AR
MM
2001
2009
2024
Foreign Containerized Cargo Volumeby AreWith Container Terminal (Unit : ton)
0
10,000,000
20,000,000
30,000,000
40,000,000
50,000,000
60,000,000
70,000,000
2001 2009 2024
LuzonVisayasMindanao

5-33
Table 5.5.6 Estimations for Foreign Container Cargo by Regions
Present situation With international container terminal
Unit : ton Unit : tonRegion Region Total Total Total Region Region Total Total Total
No. 2001 2009 2024 No. 2001 2009 2024NCR NCR + 3+4A 13,156,257 27,717,747 70,099,588 NCR NCR + 3+4A 13,156,257 23,837,263 57,481,663CAR CAR 0 0 0 CAR CAR 0 0 0
1 Ilocos 0 0 0 1 Ilocos 0 0 02 Cagayan Valley 0 0 0 2 Cagayan Valley 0 0 03 Central Luzon 2,029 0 0 3 Central Luzon 2,029 0 0
4B Southern Tagalog 0 0 0 4B Southern Tagalog 0 0 05 Bicol 0 0 0 5 Bicol 0 0 06 Western Visayas 0 0 0 6 Western Visayas 0 554,355 1,401,9927 Central Visayas 852,527 1,683,321 4,950,352 7 Central Visayas 852,527 2,792,031 10,558,3198 Eastern Visayas 0 0 0 8 Eastern Visayas 0 0 09 Western Mindanao 1,518 0 0 9 Western Mindanao 1,518 0 010 Northern Mindanao 248,641 375,320 1,019,012 10 Northern Mindanao 248,641 1,484,030 3,822,99511 Southern Mindanao 724,837 1,512,460 5,201,413 11 Southern Mindanao 724,837 2,621,170 8,005,39612 Central Mindanao 0 0 0 12 Central Mindanao 0 0 013 Caraga 0 0 0 13 Caraga 0 0 0
ARMM ARMM 0 0 0 ARMM ARMM 0 0 014,985,809 31,288,849 81,270,365 Total 14,985,809 31,288,849 81,270,365
Region Region Import Import Import Region Region Import Import ImportNo. 2001 2009 2024 No. 2001 2009 2024NCR NCR + 3+4A 8,742,458 18,554,019 47,153,213 NCR NCR + 3+4A 8,742,458 15,956,456 38,665,635CAR CAR 0 CAR CAR 0 0 0
1 Ilocos 0 1 Ilocos 0 0 02 Cagayan Valley 0 2 Cagayan Valley 0 0 0
4B Southern Tagalog 0 4B Southern Tagalog 0 0 05 Bicol 0 5 Bicol 0 0 06 Western Visayas 0 6 Western Visayas 0 371,080 943,0647 Central Visayas 517,310 1,168,196 3,599,065 7 Central Visayas 517,310 1,910,356 7,371,3238 Eastern Visayas 0 8 Eastern Visayas 0 0 09 Western Mindanao 1,340 9 Western Mindanao 1,340 0 010 Northern Mindanao 58,932 161,774 715,881 10 Northern Mindanao 58,932 903,935 2,602,00911 Southern Mindanao 266,761 771,812 3,034,006 11 Southern Mindanao 266,761 1,513,973 4,920,13412 Central Mindanao 0 12 Central Mindanao 0 0 013 Caraga 0 13 Caraga 0 0 0
ARMM ARMM 0 ARMM ARMM 0 0 09,587,491 20,655,800 54,502,165 Total 9,587,491 20,655,800 54,502,165
Region Region Export Export Export Region Region Export Export ExportNo. 2001 2009 2024 No. 2001 2009 2024NCR NCR + 3+4A 4,413,799 9,163,729 22,946,375 NCR NCR + 3+4A 4,413,799 7,880,807 18,816,028CAR CAR 0 CAR CAR 0 0 0
1 Ilocos 0 1 Ilocos 0 0 02 Cagayan Valley 0 2 Cagayan Valley 0 0 0
4B Southern Tagalog 0 4B Southern Tagalog 0 0 05 Bicol 0 5 Bicol 0 0 06 Western Visayas 0 6 Western Visayas 0 183,275 458,9287 Central Visayas 335,217 515,126 1,351,287 7 Central Visayas 335,217 881,675 3,186,9978 Eastern Visayas 0 8 Eastern Visayas 0 0 09 Western Mindanao 178 9 Western Mindanao 178 0 010 Northern Mindanao 189,709 213,546 303,131 10 Northern Mindanao 189,709 580,096 1,220,98611 Southern Mindanao 458,076 740,648 2,167,407 11 Southern Mindanao 458,076 1,107,197 3,085,26212 Central Mindanao 0 12 Central Mindanao 0 0 013 Caraga 0 13 Caraga 0 0 0
ARMM ARMM 0 ARMM ARMM 0 0 05,398,318 10,633,049 26,768,200 Total 5,398,318 10,633,049 26,768,200

5-34
(2) Projected Foreign Beak Bulk Cargo by Region
Figure 5.5.7 Projected Foreign Break Bulk Cargo by Regions Projected foreign break bulk cargo is shown in Figure 5.5.7 (also see Table5.5.7). Foreign break bulk cargo will increase gradually, reaching 13 million tons in 2009 and 26 million tons in 2024. Foreign break bulk cargo will be handled in many regions but GCR will handle the largest share of import while Southern Mindanao will handle the largest share of export.
Est imat ion for Foreigns Break Bulk Cargo by Regions(Un i t : ton)
0
2,000,000
4,000,000
6,000,000
8,000,000
10,000,000
12,000,000
14,000,000
16,000,000
NC
R+3
+4A
CA
R
Iloco
s
Cag
ayan
Val
ley
Sou
ther
n T
agal
og
Bic
ol
Wes
tern
Vis
ayas
Cen
tral
Vis
ayas
East
ern
Vis
ayas
Wes
tern
Min
dana
o
Nor
ther
n M
inda
nao
Sou
ther
n M
inda
nao
Cen
tral
Min
dana
o
Car
aga
AR
MM
200120092024

5-35
Table 5.5.7 Estimations for Foreign Break Bulk Cargo by Regions Unit : ton
Region Region Total Total TotalNo. 2001 2009 2024NCR NCR+3+4A 4,371,067 7,479,718 14,574,904CAR CAR 0 0 0
1 Ilocos 964 142,105 136,6872 Cagayan Valley 5 0 0
4B Southern Tagalog 8,501 13,621 40,8825 Bicol 107,092 375,311 1,064,0276 Western Visayas 272,738 163,892 336,0197 Central Visayas 534,454 717,971 1,374,5338 Eastern Visayas 292,956 90,381 1,6249 Western Mindanao 168,122 254,860 682,68510 Northern Mindanao 314,212 382,008 515,72011 Southern Mindanao 2,296,039 3,276,035 5,868,07012 Central Mindanao 21,582 0 013 Caraga 107,846 282,228 633,798
ARMM ARMM 0 310,433 835,8148,495,577 13,488,565 26,064,762
Region Region Import Import ImportNo. 2001 2009 2024NCR NCR+3+4A 4,331,118 7,454,915 14,571,548CAR CAR 0
1 Ilocos 0 140,750 134,1262 Cagayan Valley 5
4B Southern Tagalog 8,356 12,936 39,1895 Bicol 107,012 374,934 1,063,9876 Western Visayas 272,561 163,892 336,0197 Central Visayas 488,301 686,207 1,317,2938 Eastern Visayas 29,541 15,170 1,6249 Western Mindanao 167,711 252,440 680,57310 Northern Mindanao 305,236 375,029 514,70811 Southern Mindanao 610,155 986,628 1,604,60412 Central Mindanao 013 Caraga 104,725 282,228 633,798
ARMM ARMM 0 254,756 691,0666,424,721 10,999,885 21,588,533
Region Region Export Export ExportNo. 2001 2009 2024NCR NCR+3+4A 39,949 24,804 3,357CAR CAR 0
1 Ilocos 964 1,355 2,5612 Cagayan Valley 0
4B Southern Tagalog 144 685 1,6935 Bicol 80 378 396 Western Visayas 1767 Central Visayas 46,153 31,764 57,2408 Eastern Visayas 263,415 75,2109 Western Mindanao 411 2,421 2,11210 Northern Mindanao 8,976 6,980 1,01211 Southern Mindanao 1,685,884 2,289,407 4,263,46612 Central Mindanao 21,582 0 013 Caraga 3,121 0 0
ARMM ARMM 0 55,677 144,7482,070,856 2,488,681 4,476,228

5-36
(3) Projected Foreign Bulk Cargo by Regions
Figure 5.5.8 Projected Foreign Bulk Cargo by Regions Projected foreign bulk cargo is shown in Figure 5.5.8 (also see Table 5.5.8). Foreign bulk cargo will increase to 74 million tons in 2009 and 146 million tons in 2024. Foreign bulk cargo will occupy the largest share of the total cargo volume. Foreign bulk cargo is greatly imbalanced with the volume of import bulk cargo about 5 times larger than that of export bulk cargo. NCR, Region 3 and Region 4A will treat large shares of foreign bulk cargo. Major commodities of import bulk are crude petroleum and mineral fuel. Refineries will be located in GCR (Limay and Batangas) and crude petroleum will be imported for refining. Refined petroleum will be distributed to all regions as domestic bulk cargo.
Estimations for Foreign Bulk Cargo by Regions(Unit : ton)
0
20,000,000
40,000,000
60,000,000
80,000,000
100,000,000
120,000,000
NC
R+3
+4A
CA
R
Iloco
s
Cag
ayan
Val
ley
Sou
ther
n T
agal
og
Bic
ol
Wes
tern
Vis
ayas
Cen
tral
Vis
ayas
East
ern
Vis
ayas
Wes
tern
Min
dana
o
Nor
ther
n M
inda
nao
Sou
ther
n M
inda
nao
Cen
tral
Min
dana
o
Car
aga
AR
MM
2001
2009
2024
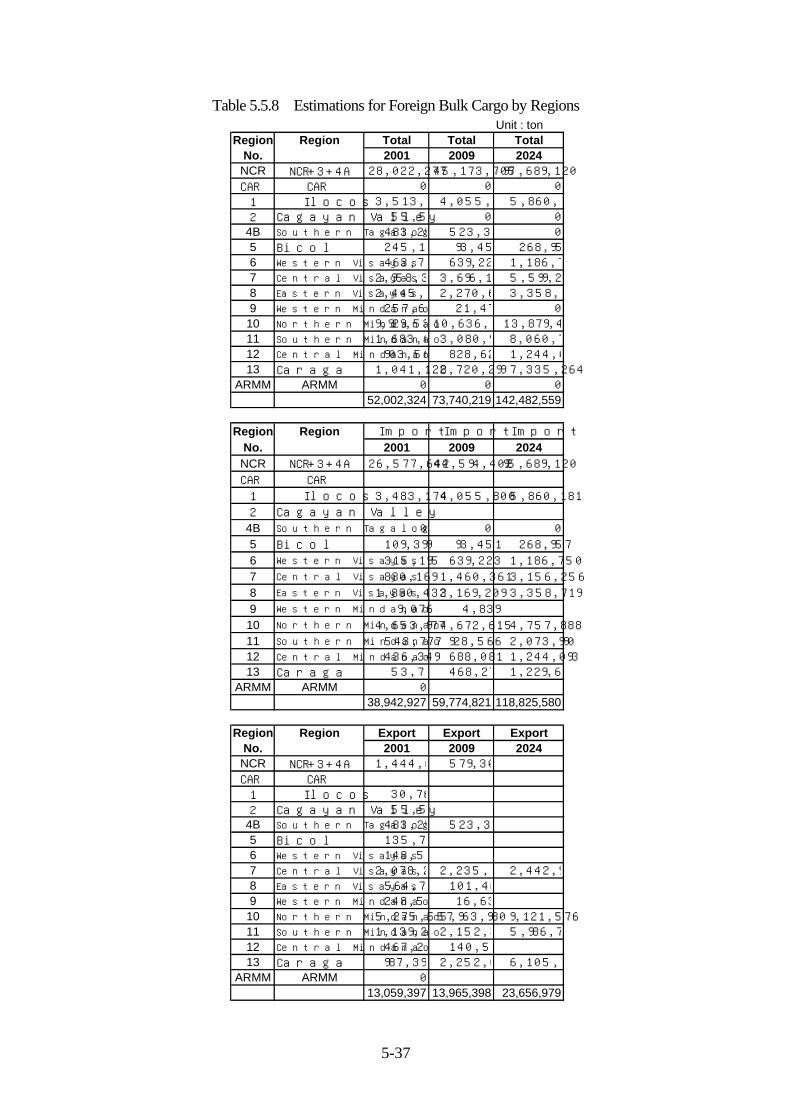
5-37
Table 5.5.8 Estimations for Foreign Bulk Cargo by Regions Unit : ton
Region Region Total Total TotalNo. 2001 2009 2024NCR NCR+3+4A 28,022,277 45,173,707 95,689,120CAR CAR 0 0 0
1 Ilocos 3,513,941 4,055,800 5,860,1812 Cagayan Valley 55,500 0 0
4B Southern Tagalog 483,258 523,301 05 Bicol 245,103 93,451 268,9576 Western Visayas 463,734 639,223 1,186,7507 Central Visayas 2,958,378 3,696,161 5,599,2278 Eastern Visayas 2,445,213 2,270,673 3,358,7199 Western Mindanao 257,646 21,476 0
10 Northern Mindanao 9,929,534 10,636,596 13,879,46411 Southern Mindanao 1,683,052 3,080,905 8,060,78412 Central Mindanao 903,560 828,628 1,244,09313 Caraga 1,041,128 2,720,299 7,335,264
ARMM ARMM 0 0 052,002,324 73,740,219 142,482,559
Region Region Import Import ImportNo. 2001 2009 2024NCR NCR+3+4A 26,577,642 44,594,402 95,689,120CAR CAR
1 Ilocos 3,483,174 4,055,800 5,860,1812 Cagayan Valley
4B Southern Tagalog 0 0 05 Bicol 109,399 93,451 268,9576 Western Visayas 315,195 639,223 1,186,7507 Central Visayas 880,169 1,460,361 3,156,2568 Eastern Visayas 1,880,433 2,169,209 3,358,7199 Western Mindanao 9,076 4,839
10 Northern Mindanao 4,653,977 4,672,615 4,757,88811 Southern Mindanao 543,777 928,566 2,073,99012 Central Mindanao 436,349 688,081 1,244,09313 Caraga 53,736 468,273 1,229,626
ARMM ARMM 038,942,927 59,774,821 118,825,580
Region Region Export Export ExportNo. 2001 2009 2024NCR NCR+3+4A 1,444,635 579,305CAR CAR
1 Ilocos 30,7672 Cagayan Valley 55,500
4B Southern Tagalog 483,258 523,3015 Bicol 135,7046 Western Visayas 148,5397 Central Visayas 2,078,209 2,235,800 2,442,9718 Eastern Visayas 564,780 101,4649 Western Mindanao 248,570 16,637
10 Northern Mindanao 5,275,557 5,963,980 9,121,57611 Southern Mindanao 1,139,275 2,152,339 5,986,79412 Central Mindanao 467,211 140,54613 Caraga 987,392 2,252,025 6,105,638
ARMM ARMM 013,059,397 13,965,398 23,656,979
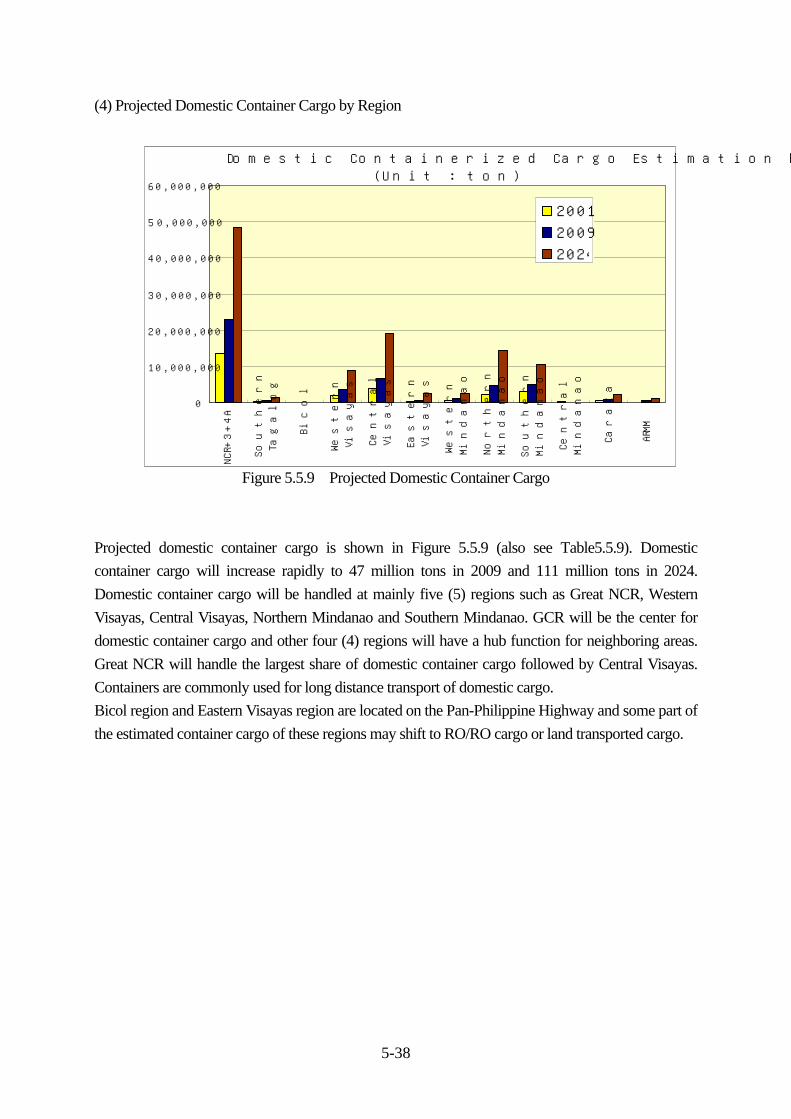
5-38
(4) Projected Domestic Container Cargo by Region
Figure 5.5.9 Projected Domestic Container Cargo Projected domestic container cargo is shown in Figure 5.5.9 (also see Table5.5.9). Domestic container cargo will increase rapidly to 47 million tons in 2009 and 111 million tons in 2024. Domestic container cargo will be handled at mainly five (5) regions such as Great NCR, Western Visayas, Central Visayas, Northern Mindanao and Southern Mindanao. GCR will be the center for domestic container cargo and other four (4) regions will have a hub function for neighboring areas. Great NCR will handle the largest share of domestic container cargo followed by Central Visayas. Containers are commonly used for long distance transport of domestic cargo. Bicol region and Eastern Visayas region are located on the Pan-Philippine Highway and some part of the estimated container cargo of these regions may shift to RO/RO cargo or land transported cargo.
Domestic Containerized Cargo Estimation by Regions(Unit : ton)
0
10,000,000
20,000,000
30,000,000
40,000,000
50,000,000
60,000,000
NC
R+3
+4A
Sou
ther
nTag
alog
Bic
ol
Wes
tern
Vis
ayas
Cen
tral
Vis
ayas
Eas
tern
Vis
ayas
Wes
tern
Min
dana
o
Nor
ther
nM
inda
nao
Sou
ther
nM
inda
nao
Cen
tral
Min
dana
o
Car
aga
AR
MM
200120092024


5-40
Table 5.5.9 Estimations for Domestic Container Cargo by Regions Region Domestic Container 2001 2009 2024NCR + 4A NCR+3+4A 13,602,166 22,967,180 48,271,083
4B Southern Tagalog 267,525 522,812 1,367,1995 Bicol 30,296 44,445 64,4506 Western Visayas 2,021,339 3,739,175 8,942,7847 Central Visayas 4,119,938 6,633,662 18,960,9628 Eastern Visayas 344,696 709,909 2,624,6679 Western Mindanao 556,232 1,043,325 2,443,070
10 Northern Mindanao 2,140,791 4,964,301 14,532,94111 Southern Mindanao 3,047,036 5,054,614 10,535,92012 Central Mindanao 209,375 106,105 41,43713 Caraga 490,598 966,741 2,206,837
ARMM ARMM 354,324 607,856 1,102,903Total 27,184,316 47,360,125 111,094,254
Unit : tonRegion Inbound Container 2001 2009 2024NCR + 4A NCR+3+4A 6,037,341 9,718,581 18,758,767
4B Southern Tagalog 181,994 349,860 809,1485 Bicol 24,789 31,105 46,7056 Western Visayas 1,410,388 2,344,737 5,772,4117 Central Visayas 2,492,132 4,253,799 12,553,9898 Eastern Visayas 189,449 444,773 1,078,6529 Western Mindanao 341,027 634,664 1,329,621
10 Northern Mindanao 987,181 2,353,682 7,237,33011 Southern Mindanao 1,536,916 2,651,501 5,745,82612 Central Mindanao 96,431 10,764 27413 Caraga 289,901 593,395 1,503,706
ARMM ARMM 141,816 293,202 710,698Total 13,587,549 23,680,063 55,547,127
Unit : tonRegion Outbound Container 2001 2009 2024NCR + 4A NCR+3+4A 7,564,825 13,203,788 29,502,551
4B Southern Tagalog 85,531 175,198 558,2795 Bicol 5,507 13,566 17,7726 Western Visayas 610,951 1,406,502 3,172,7367 Central Visayas 1,627,806 2,403,651 6,412,5558 Eastern Visayas 155,247 267,417 1,545,5909 Western Mindanao 215,205 411,530 1,113,645
10 Northern Mindanao 1,153,610 2,607,357 7,295,55811 Southern Mindanao 1,510,120 2,406,266 4,790,96212 Central Mindanao 112,944 94,268 41,12613 Caraga 200,697 376,139 703,858
ARMM ARMM 212,508 314,381 392,494Total 13,242,443 23,680,063 55,547,127

5-41
(5) Projected Domestic Break Bulk Cargo by Regions
Figure 5.5.11 Projected Domestic Break Bulk Cargo Projected domestic break bulk cargo is shown in Figure 5.5.11 (also see Table5.5.10). Domestic break bulk cargo will increase gradually, reaching 24 million tons in 2009 and 32 million tons in 2024. Central Visayas will handle the largest cargo volume. GCR, Eastern Visayas and Western Visayas will also handle large cargo volumes. In Central Visayas and Western Visayas, some portion of break bulk cargo will be transported to /from these regions by container cargo and distributed (collected) to/from neighboring area by break bulk cargo. Therefore these areas will have a function as distribution centers for neighboring area.
Domestic Breakbulk Cargo Estimation by Regions(Unit : ton)
0
2,000,000
4,000,000
6,000,000
8,000,000
10,000,000
12,000,000
14,000,000
NC
R +
3+4
A
Iloco
s
Cag
ayan
Val
ley
Sou
ther
n T
agal
og
Bic
ol
Wes
tern
Vis
ayas
Cen
tral
Vis
ayas
East
ern
Vis
ayas
Wes
tern
Min
dana
o
Nor
ther
n M
inda
nao
Sou
ther
n M
inda
nao
Cen
tral
Min
dana
o
Car
aga
AR
MM
200120092024


5-43
Table 5.5.10 Estimations for Domestic Break Bulk cargo by Regions Unit : ton
Region Domestic Break Bulk Cargo 2001 2009 2024NCR + 4A NCR + 3+4A 4,888,058 4,884,091 5,944,603
1 Ilocos 61,572 393,752 918,1942 Cagayan Valley 9,455 10,089 13,453
4B Southern Tagalog 580,375 404,275 396,4965 Bicol 812,340 1,113,756 1,698,0886 Western Visayas 2,759,485 2,660,888 2,976,0597 Central Visayas 6,666,817 7,880,745 11,701,2168 Eastern Visayas 1,654,266 2,466,597 4,411,6619 Western Mindanao 942,834 998,479 963,848
10 Northern Mindanao 1,678,896 1,479,762 1,210,97211 Southern Mindanao 699,582 946,255 1,143,63712 Central Mindanao 680,454 263,905 410,99513 Caraga 870,569 652,461 682,647
ARMM ARMM 348,618 214,681 133,369Total 22,653,321 24,369,735 32,605,239
Region Inbound Break Bulk Cargo 2001 2009 2024NCR + 4A NCR + 4A 3,454,240 3,398,740 4,530,831
1 Ilocos 51,265 74,153 85,8372 Cagayan Valley 8,097 8,684 13,475
4B Southern Tagalog 334,927 227,262 288,2745 Bicol 606,626 872,414 1,407,0036 Western Visayas 1,642,184 1,485,532 1,597,4137 Central Visayas 2,866,836 2,519,603 2,434,2668 Eastern Visayas 814,472 1,375,935 3,243,7819 Western Mindanao 564,222 517,035 389,766
10 Northern Mindanao 723,033 720,870 716,64611 Southern Mindanao 358,725 526,726 897,67512 Central Mindanao 99,247 100,857 256,68813 Caraga 237,051 244,020 347,683
ARMM ARMM 196,277 113,037 93,283Total 11,957,202 12,184,868 16,302,620
Region Outbound Break Bulk Cargo 2001 2009 2024NCR + 4A NCR + 4A 1,433,818 1,393,846 1,700,917
1 Ilocos 10,307 331,337 763,5882 Cagayan Valley 1,358 1,057 1,221
4B Southern Tagalog 245,448 174,610 124,8085 Bicol 205,714 211,161 393,8846 Western Visayas 1,117,301 1,160,522 1,398,7997 Central Visayas 3,799,981 5,497,035 8,637,5218 Eastern Visayas 839,794 1,077,019 1,359,1139 Western Mindanao 378,612 479,743 557,102
10 Northern Mindanao 955,863 760,710 514,80611 Southern Mindanao 340,857 414,403 305,99812 Central Mindanao 581,207 166,022 163,73913 Caraga 633,518 416,304 336,136
ARMM ARMM 152,341 101,100 44,987Total 10,696,119 12,184,868 16,302,620

5-44
(6) Projected Domestic RO/RO Cargo by Regions
Figure 5.5.13 Projected Domestic RO/RO Cargo by Regions Projected domestic RO/RO cargo is shown in Figure 5.5.13 (also see Table5.5.11). Domestic RO/RO cargo will increase rapidly from 9 million tons in 2001 to18 million tons in 2009 and 36 million tons in 2024. Bicol and Eastern Visayas, located on the Pan-Philippine Highway, have large shares. Central Visayas, Northern Mindanao and Central Mindanao, located around Visayas Sea, will also handle a large amount of cargo.
Domestic RO/RO Cargo Estimation by Regions(Unit : ton)
0
1,000,000
2,000,000
3,000,000
4,000,000
5,000,000
6,000,000
7,000,000
8,000,000
9,000,000
NC
R+3
+4A
Sout
hern
Tag
alog
Bic
ol
Wes
tern
Vis
ayas
Cen
tral
Vis
ayas
Eas
tern
Vis
ayas
Wes
tern
Min
dana
o
Nor
ther
nM
inda
nao
Sout
hern
Min
dana
o
Cen
tral
Min
dana
o
Car
aga
AR
MM
2001
2009
2024
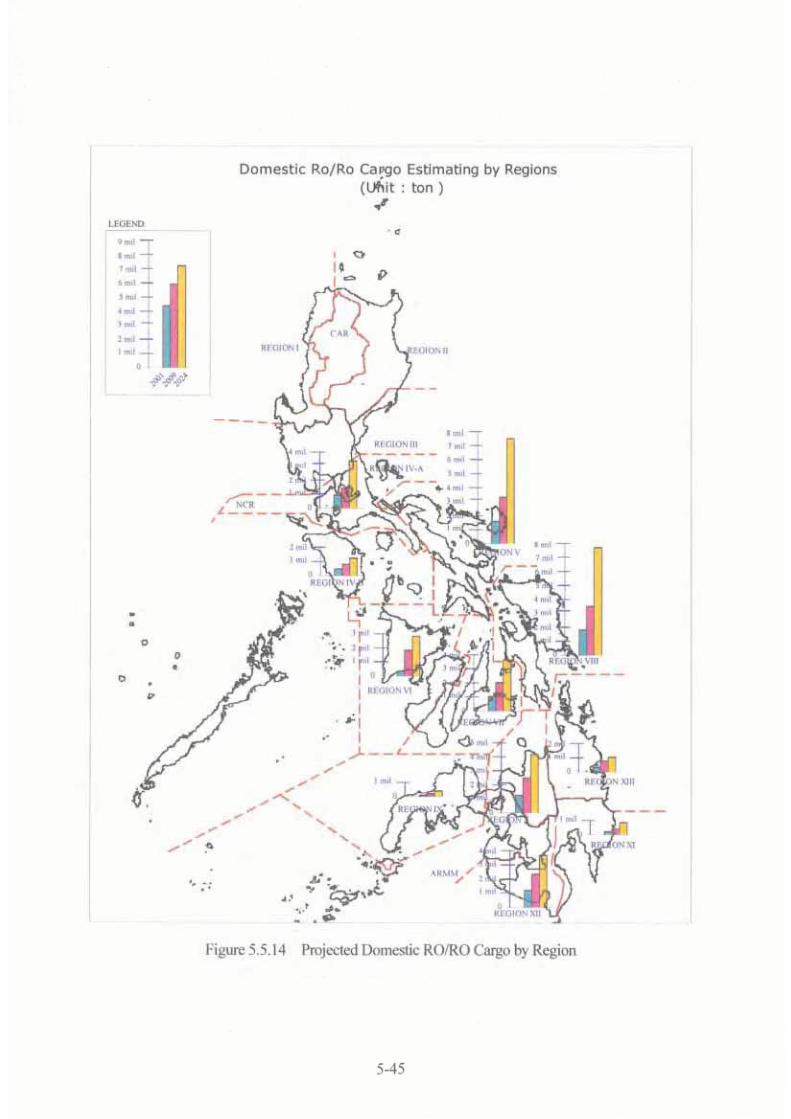

5-46
Table 5.5.11 Estimations for Domestic RO/RO Cargo by Regions Unit : ton
Region Domestic Ro/Ro Cargo 2001 2009 2024NCR + 4A NCR+3+4A 925,297 1,439,028 3,034,281
4B Southern Tagalog 392,555 643,932 1,072,9475 Bicol 1,682,610 3,021,768 7,480,2706 Western Visayas 360,138 1,842,410 2,923,2697 Central Visayas 989,491 2,006,208 3,622,9758 Eastern Visayas 1,818,609 3,161,891 7,699,9359 Western Mindanao 14,710 42,448 102,66010 Northern Mindanao 1,368,944 2,535,870 4,256,43511 Southern Mindanao 80,494 205,728 874,38112 Central Mindanao 1,220,342 2,347,924 3,698,95713 Caraga 339,696 758,033 983,639
ARMM ARMM 96,204 214,681 200,053Total 9,289,090 18,219,921 35,949,804
Region Inbound Ro/Ro Cargo 2001 2009 2024NCR + 4A NCR+3+4A 453,255 690,077 1,373,268
4B Southern Tagalog 200,806 294,009 560,2985 Bicol 844,676 1,465,716 3,490,1816 Western Visayas 196,778 878,223 1,337,8557 Central Visayas 503,442 1,169,304 1,678,8298 Eastern Visayas 928,958 1,684,577 4,125,1819 Western Mindanao 11,096 35,903 81,06210 Northern Mindanao 671,925 1,324,086 2,148,48411 Southern Mindanao 63,703 164,387 614,72512 Central Mindanao 629,020 975,604 2,007,95913 Caraga 187,000 306,047 435,442
ARMM ARMM 29,625 122,025 121,619Total 4,720,284 9,109,961 17,974,902
Region Outbound Ro/Ro Cargo 2001 2009 2024NCR + 4A NCR+3+4A 472,042 747,159 1,671,072
4B Southern Tagalog 191,749 348,222 510,9845 Bicol 837,934 1,553,304 4,007,5646 Western Visayas 163,360 961,571 1,594,0687 Central Visayas 486,049 847,017 1,953,4208 Eastern Visayas 889,651 1,483,620 3,555,5149 Western Mindanao 3,614 7,439 19,51910 Northern Mindanao 697,019 1,215,201 2,106,53311 Southern Mindanao 16,791 45,085 247,24512 Central Mindanao 591,322 1,360,249 1,679,91913 Caraga 152,696 447,545 552,139
ARMM ARMM 66,579 93,550 76,925Total 4,568,806 9,109,961 17,974,902

5-47
(7) Projected Domestic Bulk Cargo by Regions
Figure 5.5.15 Projected Domestic Bulk Cargo by Regions Projected domestic bulk cargo by region is shown in Figure 5.5.15 (also see Table5.5.12). Domestic bulk cargo will increase, reaching 48 million tons in 2009 and 101 million tons in 2024. The major commodity of domestic bulk cargo will be refined petroleum. Major origins of domestic bulk cargo will be Central Luzon and Southern Tagalog (4A) and destinations will be NCR, Central Luzon, Central Visayas and other regions. Almost all bulk cargo will be handled at private ports.
Domestic Bulk Cargo Estimation by Regions(Unit : ton)
0
5,000,000
10,000,000
15,000,000
20,000,000
25,000,000
30,000,000
35,000,000N
CR
Iloco
s
Cag
ayan
Val
ley
Cen
tral
Luz
on
4A S
outh
ern
Tag
alog
4B S
outh
ern
Tag
alog
Bic
ol
Wes
tern
Vis
ayas
Cen
tral
Vis
ayas
East
ern
Vis
ayas
Wes
tern
Min
dana
o
Nor
ther
n M
inda
nao
Sou
ther
n M
inda
nao
Cen
tral
Min
dana
o
Car
aga
AR
MM
200120092024


5-49
Table 5.5.12 Projected Domestic Bulk Cargo by Region Unit : ton
Region Domestic Bulk Cargo 2001 2009 2024NCR NCR 4,963,574 8,753,975 18,637,711
1 Ilocos 201,620 98,362 02 Cagayan Valley 44,719 75,520 03 Central Luzon 6,164,123 11,791,106 25,719,434
4A 4A Southern Tagalog 6,506,901 13,327,903 32,653,7484B 4B Southern Tagalog 145,283 276,450 762,8145 Bicol 476,071 707,518 1,443,8066 Western Visayas 1,572,470 2,312,906 4,426,8487 Central Visayas 2,436,968 3,263,986 5,019,5418 Eastern Visayas 1,456,602 1,724,374 3,065,4839 Western Mindanao 386,524 567,492 1,278,752
10 Northern Mindanao 2,307,584 2,975,371 4,875,69811 Southern Mindanao 1,293,283 1,485,006 1,917,34612 Central Mindanao 547,706 609,641 773,10913 Caraga 340,086 667,825 1,037,147
ARMM ARMM 72,304 148,227 354,640Total 28,915,818 48,785,663 101,966,078
Region Inbound Bulk Cargo 2001 2009 2024NCR NCR 4,896,289 8,972,151 19,378,342
1 Ilocos 199,589 102,476 02 Cagayan Valley 44,719 78,679 03 Central Luzon 392,843 853,288 2,325,091
4A Southern Tagalog 2,113,429 5,445,904 14,694,5184B Southern Tagalog 128,990 242,953 670,8555 Bicol 373,377 644,992 1,398,5826 Western Visayas 1,242,236 1,758,972 3,115,9757 Central Visayas 915,241 1,113,094 1,510,0068 Eastern Visayas 412,585 577,407 1,061,4589 Western Mindanao 324,804 390,904 735,208
10 Northern Mindanao 1,613,661 2,115,631 3,312,42111 Southern Mindanao 1,101,581 1,307,614 1,837,70512 Central Mindanao 465,026 445,035 400,27713 Caraga 234,632 278,455 413,452
ARMM ARMM 72,304 65,278 129,150Total 14,531,306 24,392,831 50,983,039
Region Outbound Bulk Cargo 2001 2009 2024NCR NCR 67,285 136,526 281,290
1 Ilocos 2,031 0 02 Cagayan Valley 0 0 03 Central Luzon 5,771,280 10,548,605 22,324,154
4A Southern Tagalog 4,393,472 7,787,978 17,793,4034B Southern Tagalog 16,293 41,580 121,3645 Bicol 102,694 85,006 113,9666 Western Visayas 330,234 600,443 1,402,5617 Central Visayas 1,521,727 2,110,838 3,407,9718 Eastern Visayas 1,044,017 1,124,985 1,956,1489 Western Mindanao 61,720 184,860 553,280
10 Northern Mindanao 693,923 908,211 1,652,12211 Southern Mindanao 191,702 221,013 168,94112 Central Mindanao 82,680 175,430 374,22613 Caraga 105,454 385,090 613,015
ARMM ARMM 0 82,267 220,597Total 14,384,512 24,392,831 50,983,039

5-50
5.5.3 Summary of Estimations 1) Total cargo volume will rise to 711 million tons in the high case, 535 million tons in the medium
case and 426 million tons in the low case in 2024 from 163 million tons in 2001. 2) In the medium case, foreign cargo volume will increase to 260 million tons from 76 million tons
and domestic cargo will increase to 276 million tons from 87 million tons. 3) For foreign cargo, tendency of containerization will remain strong though break bulk cargo
growth will be small. Growth of bulk cargo will continue steadily. (Refer to Chapter 5.5.2) 4) For domestic cargo, tendency of containerization will remain strong. Break bulk cargo will grow
slightly, RO/RO cargo will show high increase and growth of bulk cargo will continue steadily. (Based on these forecasts, it will be necessary to increase the efficiency of container and short distance RO/RO transport systems.)
5) Total sea passenger traffic will reach158 million in 2024 from 57 million in 2001. 6) Long distance passenger will increase to 14 million from 7 million and short distance passenger
will increase to 144 million from 50 million. (Therefore measures to improve the transport system for short distance sea passenger such as replacing traditional passenger boat with faster ships must be introduced.)
7) Typical domestic transportation modes among regions are projected as Table 5.5.13 and Figure 5.5.17.
Table 5.5.13 Projected Typical Domestic Transportation Modes
Destination CAR Central Luzon 4B Southern Tagalog Northern Mindanao Western Mindanao
Ilocos NCR Eastern Visayas Western Visayas Southern Mindanao Central Mindanao
Cagayan Valley 4A Southern Tagalog Central Visayas Caraga ARMM
Origin Bicol
CAR CAR Road + Container1 Ilocos Road Road Road + Ro/Ro Road + Ro/Ro Road + Container Road + Container2 Cagayan Valley
3 Central Luzon ContainerNCR NCR Road Road Road + Ro/Ro Road + Ro/Ro Container Container4A Southern Tagalog
5 Bicol
8 Eastern Visayas Ro/Ro + Road Ro/Ro + Road Road + (Ro/Ro) Road + Ro/Ro Road + Ro/Ro Ro/Ro + (Road)
4B Southern Tagalog Ro/Ro + Road Ro/Ro + Road Ro/Ro + Road Ro/Ro + (Road)6 Western Visayas Container + Road Container Ro/Ro + Road Road + Ro/Ro Container Container7 Central Visayas
10 Northern Mindanao Container Ro/Ro + Road11 Southern Mindanao Container + Road Container + Road Ro/Ro + Road Container Road Road + (Ro/Ro)13 Caraga
9 Western Mindanao Container Ro/Ro + Road12 Central Mindanao Container + Road Container + Road Ro/Ro + Road Container Road + (Ro/Ro) Road
ARMM ARMM


5-52
5.6 Projected Sea Passenger Traffic 5.6.1 Projected Long Distance Sea Passenger by Regions
Figure 5.6.1 Projected Long Distance Sea Passenger by Regions Projected long distance sea passenger by region is shown in Figure 5.6.4 (also see Table5.6.4). Long distance sea passenger will increase, reaching 10 million in 2009 and 14 million in 2024. Major origins and destinations of long distance sea passengers will be NCR, Western Visayas, Central Visayas, Northern Mindanao and Southern Mindanao. NCR will be biggest hub for domestic long distance sea passengers followed by Central Visayas.
Table 5.6.1 Projected Long Distance Sea Passenger Traffic
Long Distance Sea Passenger Traffic
0
1,000,000
2,000,000
3,000,000
4,000,000
5,000,000
6,000,000
7,000,000
NC
R+3
+4A
Sou
ther
nTag
alon
g
Bic
ol
Wes
tern
Vis
ayas
Cen
tral
Vis
ayas
Eas
tern
Vis
ayas
Wes
tern
Min
dana
o
Nor
ther
nM
inda
nao
Sou
ther
nM
inda
nao
Cen
tral
Min
dana
o
Car
aga
200120092024
Long Distance Sea Passenger2001 2009 2024
NCR NCR+3+4A 3,435,663 4,810,256 6,447,0184B Southern Tagalong 84,550 118,377 158,6575 Bicol 9,575 13,406 17,9676 Western Visayas 637,532 892,606 1,196,3297 Central Visayas 1,302,080 1,823,036 2,443,3518 Eastern Visayas 108,939 152,525 204,4249 Western Mindanao 175,793 246,128 329,876
10 Northern Mindanao 676,583 947,281 1,269,60711 Southern Mindanao 962,996 1,348,286 1,807,06112 Central Mindanao 66,172 92,647 124,17113 Caraga 155,050 217,085 290,952
Total 7,614,933 10,661,632 14,289,414

5-53
5.6.2 Projected Short Distance Sea Passenger by Region
Figure 5.6.2 Projected Short Distance Sea Passenger by Region Projected short distance sea passenger traffic by region is shown in Figure 5.6.2 (also see Table5.6.2). Short distance sea passenger will increase gradually to 73 million passengers in 2009 and to 143 million passengers in 2024. Central Visayas will be the hub of short distance sea passengers of Visayas Sea while Western Mindanao will also play an important role.
Table 5.6.2 Projected Short Distance Sea Passenger
Estimation for Short Distance Passenger
05,000,000
10,000,00015,000,00020,000,00025,000,00030,000,00035,000,00040,000,000
NC
R
Cen
tral
Luz
on
Sou
ther
n Tag
alog
Sou
ther
n Tag
alog
Bic
ol
Wes
tern
Vis
ayas
Cen
tral
Vis
ayas
Eas
tern
Vis
ayas
Wes
tern
Min
dana
o
Nor
ther
n M
inda
nao
Sou
ther
n M
inda
nao
Cen
tral
Min
dana
o
Car
aga
AR
MM
200120092024
Short Distance Passenger2001 2009 2024
NCR NCR 462,074 796,780 1,696,3973 Central Luzon 71,803 110,742 277,179
4A Southern Tagalog 3,434,249 5,113,704 10,084,1814B Southern Tagalog 2,122,977 3,124,358 5,996,3245 Bicol 2,742,515 5,189,259 12,807,0376 Western Visayas 4,890,230 7,398,350 13,676,4887 Central Visayas 16,360,906 21,422,742 35,703,0368 Eastern Visayas 3,783,133 6,231,742 13,353,7739 Western Mindanao 5,068,594 7,704,628 17,623,691
10 Northern Mindanao 4,648,268 5,059,284 6,641,32211 Southern Mindanao 355,378 1,230,043 5,081,54912 Central Mindanao 2,621,431 3,638,717 6,825,00113 Caraga 1,621,304 2,851,735 6,051,963
ARMM ARMM 603,142 3,379,413 7,521,676Total 48,786,004 73,251,498 143,339,617

5-54
5.7 Domestic Container Cargo Volume at Major Ports At present, some foreign container cargo handled in Manila is transferred as domestic container cargo to/from other regions. When the international container terminals in other regions start operation, this domestic cargo will be imported/exported directly at the regional ports. The domestic container volume for each major port is estimated in Table 5.7.1 based on present conditions and considering this trend.
Table 5.7.1 Forecast of Domestic Container Volume at Major Ports
Unit : TEUsName of Port Prot Mgt. Body
2001 2009 2014 2019 20241 Batangas PPA 3,475 61,729 89,081 114,251 145,5322 Cagayan de Oro PPA/PIA 149,348 151,811 190,708 232,970 280,5593 Cebu CPA 313,369 359,424 408,402 659,032 955,2974 Davao PPA 90,368 77,579 95,847 119,247 144,0695 Dumaguete PPA 20,311 31,829 43,261 56,879 73,4306 General Santos PPA 113,847 153,133 169,949 216,681 274,4717 Iligan PPA 15,762 20,846 20,767 23,216 28,0128 Iloilo PPA 98,471 146,645 217,046 300,381 399,4809 Manila North Harbor PPA 770,069 804,465 886,246 1,122,067 1,426,235
10 Manila South Harbor PPA 0 110,000 110,000 110,000 110,00011 Nasipit PPA 22,851 37,439 50,104 66,494 87,88912 Ozamiz PPA 23,613 5,017 1,789 621 20413 Pto. Princesa PPA 17,172 40,627 63,113 92,392 130,61414 Surigao PPA 5,669 7,279 10,523 14,907 20,78315 Tacloban PPA 23,745 56,229 81,359 112,502 150,73316 Tagbilaran PPA 14,430 14,747 18,006 22,226 27,73417 Zamboanga PPA 56,389 111,308 156,804 213,190 282,60418 Bredoco Private 24,816 122,560 182,949 260,715 363,50819 Culasi Iloilo 13,156 18,033 22,996 29,074 36,61720 Masao Nasipit 659 856 1,428 2,620 4,59521 Masbate Legazpi 2,486 4,422 5,358 6,333 8,16822 Ormoc Tacloban 5,055 9,352 13,049 17,800 23,70623 Palompon Tacloban 1,592 4,609 6,263 8,026 9,88724 Pulauan Dapitan Ozamiz 6,720 13,280 19,357 26,778 36,07725 San Jose Calapan 461 23,916 31,659 41,268 53,24226 Harbor Center Private 3,454 36,720 60,812 87,738 121,270
Total 1,797,288 2,423,853 2,956,877 3,957,409 5,194,716
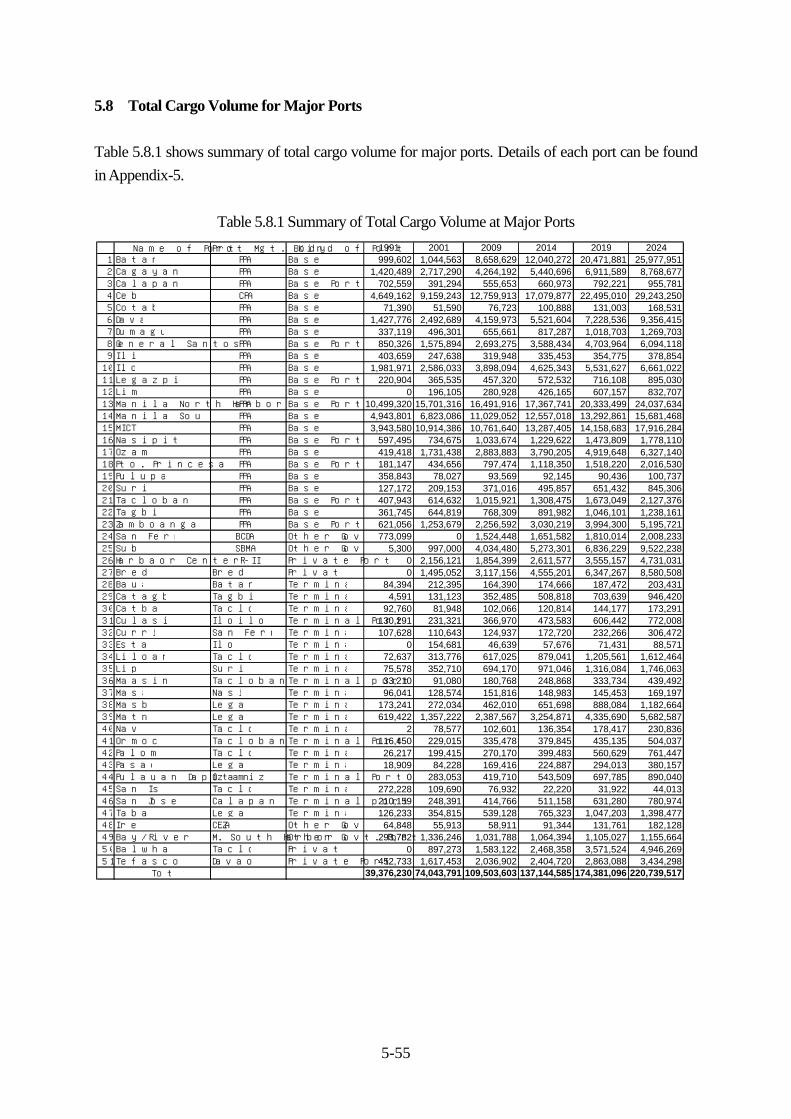
5-55
5.8 Total Cargo Volume for Major Ports Table 5.8.1 shows summary of total cargo volume for major ports. Details of each port can be found in Appendix-5.
Table 5.8.1 Summary of Total Cargo Volume at Major Ports
Name of Port Prot Mgt. Body Kind of Port 1991 2001 2009 2014 2019 20241 Batangas PPA Base Port 999,602 1,044,563 8,658,629 12,040,272 20,471,881 25,977,9512 Cagayan de Oro PPA Base Port 1,420,489 2,717,290 4,264,192 5,440,696 6,911,589 8,768,6773 Calapan PPA Base Port 702,559 391,294 555,653 660,973 792,221 955,7814 Cebu CPA Base Port 4,649,162 9,159,243 12,759,913 17,079,877 22,495,010 29,243,2505 Cotabato PPA Base Port 71,390 51,590 76,723 100,888 131,003 168,5316 Davao PPA Base Port 1,427,776 2,492,689 4,159,973 5,521,604 7,228,536 9,356,4157 Dumaguete PPA Base Port 337,119 496,301 655,661 817,287 1,018,703 1,269,7038 General Santos PPA Base Port 850,326 1,575,894 2,693,275 3,588,434 4,703,964 6,094,1189 Iligan PPA Base Port 403,659 247,638 319,948 335,453 354,775 378,854
10 Iloilo PPA Base Port 1,981,971 2,586,033 3,898,094 4,625,343 5,531,627 6,661,02211 Legazpi PPA Base Port 220,904 365,535 457,320 572,532 716,108 895,03012 Limay PPA Base Port 0 196,105 280,928 426,165 607,157 832,70713 Manila North Harbor PPA Base Port 10,499,320 15,701,316 16,491,916 17,367,741 20,333,499 24,037,63414 Manila South Harbor PPA Base Port 4,943,801 6,823,086 11,029,052 12,557,018 13,292,861 15,681,46815 MICT PPA Base Port 3,943,580 10,914,386 10,761,640 13,287,405 14,158,683 17,916,28416 Nasipit PPA Base Port 597,495 734,675 1,033,674 1,229,622 1,473,809 1,778,11017 Ozamiz PPA Base Port 419,418 1,731,438 2,883,883 3,790,205 4,919,648 6,327,14018 Pto. Princesa PPA Base Port 181,147 434,656 797,474 1,118,350 1,518,220 2,016,53019 Pulupandan PPA Base Port 358,843 78,027 93,569 92,145 90,436 100,73720 Surigao PPA Base Port 127,172 209,153 371,016 495,857 651,432 845,30621 Tacloban PPA Base Port 407,943 614,632 1,015,921 1,308,475 1,673,049 2,127,37622 Tagbilaran PPA Base Port 361,745 644,819 768,309 891,982 1,046,101 1,238,16123 Zamboanga PPA Base Port 621,056 1,253,679 2,256,592 3,030,219 3,994,300 5,195,72124 San Fernando BCDA Other Govt. Port 773,099 0 1,524,448 1,651,582 1,810,014 2,008,23325 Subic SBMA Other Govt. Port 5,300 997,000 4,034,480 5,273,301 6,836,229 9,522,23826 Harbaor Center R-II Private Port 0 2,156,121 1,854,399 2,611,577 3,555,157 4,731,03127 Bredoco Bredoco Private Port 0 1,495,052 3,117,156 4,555,201 6,347,267 8,580,50828 Bauan Batangas Terminal Port 84,394 212,395 164,390 174,666 187,472 203,43129 Catagbacan Tagbilaran Terminal Port 4,591 131,123 352,485 508,818 703,639 946,42030 Catbalogan Tacloban Terminal Port 92,760 81,948 102,066 120,814 144,177 173,29131 Culasi Iloilo Terminal Port 130,291 231,321 366,970 473,583 606,442 772,00832 Currimao San Fernando Terminal port 107,628 110,643 124,937 172,720 232,266 306,47233 Estancia Iloilo Terminal port 0 154,681 46,639 57,676 71,431 88,57134 Liloan ferry Tacloban Terminal Port 72,637 313,776 617,025 879,041 1,205,561 1,612,46435 Lipata Surigao Terminal Port 75,578 352,710 694,170 971,046 1,316,084 1,746,06336 Maasin Tacloban Terminal port 33,210 91,080 180,768 248,868 333,734 439,49237 Masao Nasipit Terminal port 96,041 128,574 151,816 148,983 145,453 169,19738 Masbate Legazpi Terminal Port 173,241 272,034 462,010 651,698 888,084 1,182,66439 Matnog Legazpi Terminal Port 619,422 1,357,222 2,387,567 3,254,871 4,335,690 5,682,58740 Naval Tacloban Terminal Port 2 78,577 102,601 136,354 178,417 230,83641 Ormoc Tacloban Terminal Port 116,450 229,015 335,478 379,845 435,135 504,03742 Palompon Tacloban Terminal Port 26,217 199,415 270,170 399,483 560,629 761,44743 Pasacao Legazpi Terminal port 18,909 84,228 169,416 224,887 294,013 380,15744 Pulauan Dapitan Ozamiz Terminal Port 0 283,053 419,710 543,509 697,785 890,04045 San Isidro Tacloban Terminal Port 272,228 109,690 76,932 22,220 31,922 44,01346 San Jose Calapan Terminal port 210,159 248,391 414,766 511,158 631,280 780,97447 Tabaco Legazpi Terminal port 126,233 354,815 539,128 765,323 1,047,203 1,398,47748 Irene CEZA Other Govt. Port 64,848 55,913 58,911 91,344 131,761 182,12849 Bay/River M. South Harbor Other Govt. Port 293,782 1,336,246 1,031,788 1,064,394 1,105,027 1,155,66450 Balwharteco Tacloban Private Port 0 897,273 1,583,122 2,468,358 3,571,524 4,946,26951 Tefasco Davao Private Port 452,733 1,617,453 2,036,902 2,404,720 2,863,088 3,434,298
Total 39,376,230 74,043,791 109,503,603 137,144,585 174,381,096 220,739,517


