Download - Chapter 2 chemistry revised

• August 27,2014
• 4th period Class starter:
Using your book, Define qualitative and quantitative. Give an example of each.
5th period class starter:
Make 5 qualitative descriptions about the room. Make 5 quantitative descriptions about the room.

Math and graphing and more…..
Whoopee!!!!!!

Derived units, percent error and
significant figures….

Section 2-1
Units (cont.)

Section 2-1
Derived Units
• A unit that is defined by a combination of base units is called a derived unit.

Section 2-1
Derived Units (cont.)
• Density is a derived unit, g/cm3, the amount of mass per unit volume.
• The density equation is density = mass/volume.

Section 2-3
• Error is defined as the difference between and experimental value and an accepted value.

Section 2-3
• The error equation is error = experimental value – accepted value.
• Percent error expresses error as a percentage of the accepted value.
Section 2-2
Scientific Notation
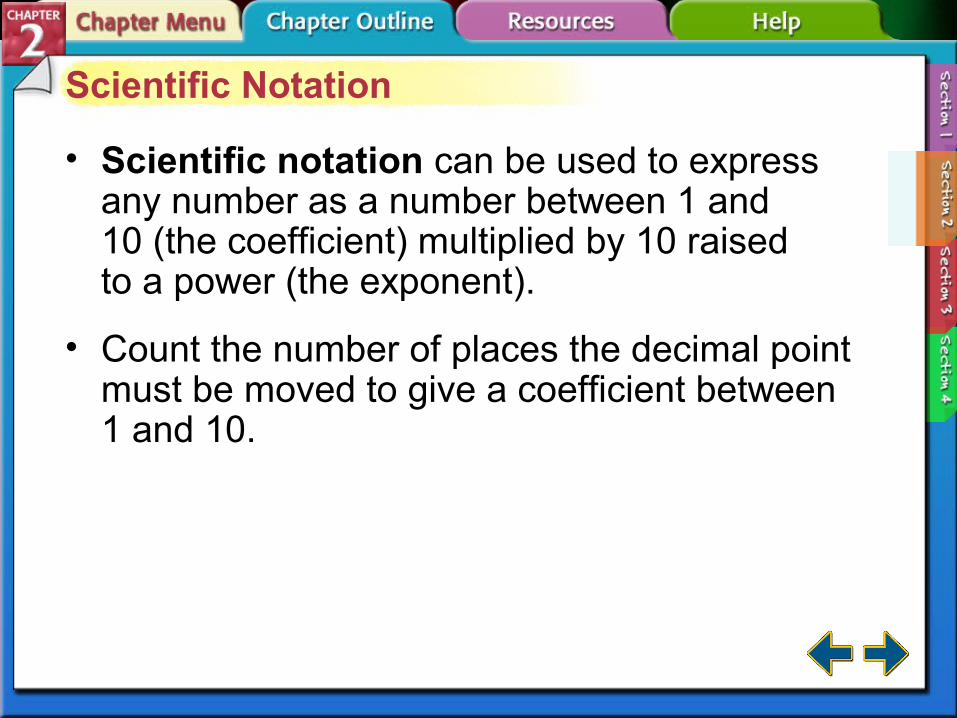
• Scientific notation can be used to express any number as a number between 1 and 10 (the coefficient) multiplied by 10 raised to a power (the exponent).
• Count the number of places the decimal point must be moved to give a coefficient between 1 and 10.

Section 2-2
Scientific Notation (cont.)
800 = 8.0 × 10²
0.0000343 = 3.43 × 10⁻⁵
• The number of places moved equals the value of the exponent.
• The exponent is positive when the decimal moves to the left and negative when the decimal moves to the right.

Section 2-3
Significant Figures
• Often, precision is limited by the tools available.
• Significant figures include all known digits plus one estimated digit.

Section 2-3
Significant Figures (cont.)
• Rules for significant figures
– Rule 1: Nonzero numbers are always significant.
– Rule 2: Zeros between nonzero numbers are always significant.
– Rule 3: All final zeros to the right of the decimal are significant.
– Rule 4: Placeholder zeros are not significant. To remove placeholder zeros, rewrite the number in scientific notation.
– Rule 5: Counting numbers and defined constants have an infinite number of significant figures.

Section 2-3
Rounding Numbers
• Calculators are not aware of significant figures.
• Answers should not have more significant figures than the original data with the fewest figures, and should be rounded.

Section 2-3
Rounding Numbers (cont.)
• Rules for rounding
– Rule 1: If the digit to the right of the last significant figure is less than 5, do not change the last significant figure.
– Rule 2: If the digit to the right of the last significant figure is greater than 5, round up to the last significant figure.
– Rule 3: If the digits to the right of the last significant figure are a 5 followed by a nonzero digit, round up to the last significant figure.

Section 2-3
Rounding Numbers (cont.)
• Rules for rounding (cont.)
– Rule 4: If the digits to the right of the last significant figure are a 5 followed by a 0 or no other number at all, look at the last significant figure. If it is odd, round it up; if it is even, do not round up.

Section 2-3
Rounding Numbers (cont.)
• Addition and subtraction
– Round numbers so all numbers have the same number of digits to the right of the decimal.
• Multiplication and division
– Round the answer to the same number of significant figures as the original measurement with the fewest significant figures.

Section 2-4
Graphing
• A graph is a visual display of data that makes trends easier to see than in a table.

Section 2-4
Graphing (cont.)
• A circle graph, or pie chart, has wedges that visually represent percentages of a fixed whole.

Section 2-4
Graphing (cont.)
• Bar graphs are often used to show how a quantity varies across categories.

Section 2-4
Graphing (cont.)
• On line graphs, independent variables are plotted on the x-axis and dependent variables are plotted on the y-axis.
Section 2-4
Graphing (cont.)
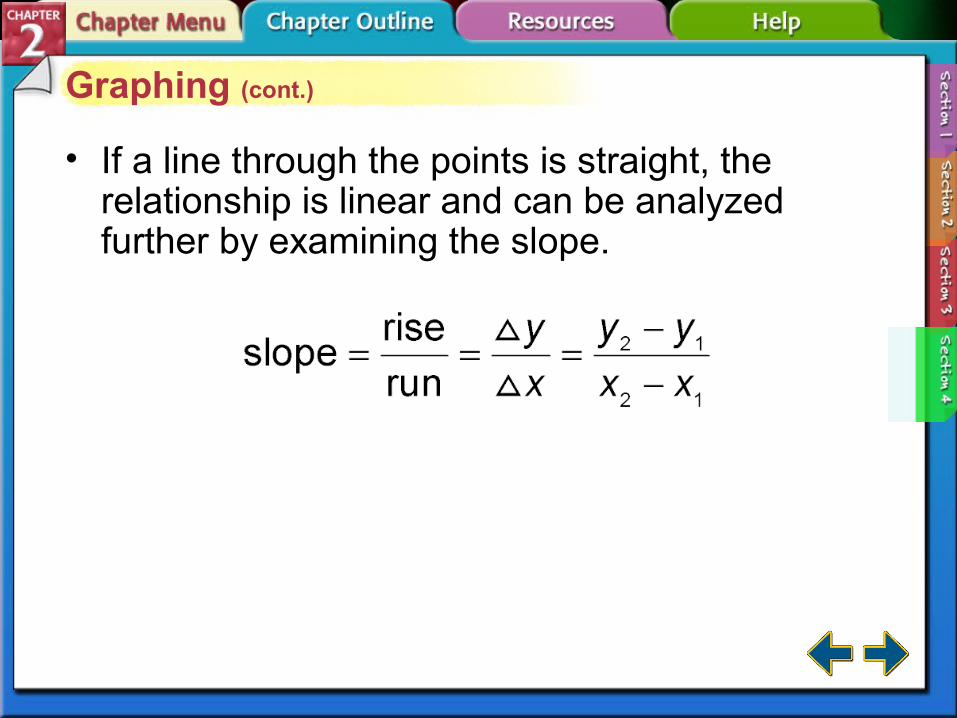
• If a line through the points is straight, the relationship is linear and can be analyzed further by examining the slope.

Section 2-4
Interpreting Graphs
• Interpolation is reading and estimating values falling between points on the graph.
• Extrapolation is estimating values outside the points by extending the line.


