
Challenger Limited
Investor Day 23 May 2017

Investor proposition Investor Day
Brian Benari
Managing Director and Chief Executive Officer

3
Investor proposition Brian Benari – Managing Director and Chief Executive Officer
Retirement income policy update Jeremy Cooper – Chairman, Retirement Income
Life Chris Plater – Chief Executive, Life
Distribution, Product and Marketing Richard Howes – Chief Executive Distribution, Product and Marketing
‘Retirement Illustrator‘ demonstration and morning tea
Funds Management Ian Saines – Chief Executive, Funds Management
Wrap up and Q&A session Brian Benari – Managing Director and Chief Executive Officer
Outline Providing our customers with financial security for retirement
10:50 – 11:10
10:30 – 10:50
10:10 – 10:30
10:00 – 10:10
11:10 – 11:30
11:30 – 12:10
12:10 – 12:30

4
Investor proposition Market leader with competitive advantage
Investor Day – Investor proposition 1. Hall & Partners Open Mind Consumer Study. 2. Challenger service analysis conducted by Wealth Insights and compared to the broader market. 3. Challenger’s normalised cost to income ratio (1H17: 32.9%) is 17 percentage points lower than the average cost to income ratio for
ASX100 banks and diversified financials (includes AMP, ANZ, BEN, BOQ, BTT, CBA, IFL, MFG, MQG, NAB, PPT, WBC). 4. Normalised ROE (pre-tax) target of 18%.
FOCUSED STRATEGY
FM – boutique and co-investment model (super savings phase)
Life – dedicated retirement income focus (super spending phase)
Independent provider with broad based distribution
MARKET LEADER
TALENTED PEOPLE
RECOGNISED CAPABILITY
SUSTAINABLE SHAREHOLDER OUTCOMES WITH 18% ROE TARGET4
Highly engaged staff with shareholder alignment
Track record of delivering
Investment team talent – internal managers and boutiques
Entrenched risk management culture
Recognised consumer retirement income brand1
Rated #1 by advisers2
Award winning product manufacturer and innovator
Forming new product and distribution relationships
Leveraging technology
FM growing twice speed of Australian funds management market
Life No.1 Australian annuities provider
Scalable platform with leading cost ratio3
PROVIDING OUR CUSTOMERS WITH FINANCIAL SECURITY FOR RETIREMENT

5
Strong employee engagement Underpinning sustainable business performance
Investor Day – Investor proposition
88%
Challenger Global HighPerforming
Norm
AustralianNational Norm
5%
Challenger outperforms best-in class global benchmark
2016 score
88%
2017 score
88%
Employee engagement score (undertaken by Willis Towers Watson)
13%

Retirement income policy update Investor Day
Jeremy Cooper
Chairman, Retirement Income

7
Key points
1 Retirement income reforms well underway Clear focus on generating sustainable income streams Moving from consultation to implementation phase
2 CIPRs (MyRetirement) Framework designed to address risks retirees face Principles-based minimum product features CIPR structure emphasises role of 3rd party products
Regulatory reforms underway to enhance retirement phase
Investor Day – Retirement income policy update

8
CIPRs (MyRetirement) Framework designed to address risks retirees face
Investor Day – Retirement income policy update 1. Government discussion paper available at https://consult.treasury.gov.au.
Extract from Government discussion paper – Objectives of proposed CIPR framework1

9
Consistent with Financial System Inquiry recommendation
Proposed there would be a limited number of principles-based CIPR requirements
CIPRs (MyRetirement) Principles-based minimum product features
Investor Day – Retirement income policy update 1. Government discussion paper available at https://consult.treasury.gov.au.
Pooling longevity risk is essential to providing higher retirement incomes
1 Provide minimum level of income that exceeds account-based pension drawn at minimum rates
2 Provide a stream of broadly constant real income for life (to manage longevity risk)
3 Include a component to provide flexibility to access lump sums and/or leave a bequest
Extract from Government discussion paper1

10
CIPRs (MyRetirement) CIPR structure emphasises role of 3rd party products
Investor Day – Retirement income policy update 1. Government discussion paper available at https://consult.treasury.gov.au.
• Flexible structure to accommodate existing retail and industry arrangements
• Trustee to design, administer and offer CIPRs to members at retirement
• Trustee can partner with 3rd parties to provide individual components
• Trustee would need to satisfy product regulation process to receive safe harbour protection
• 3rd party could be required to certify CIPR meets minimum requirements
Stylistic representation of CIPR structure - from Government discussion paper1

11
CIPR (MyRetirement) How a CIPR would work in practice
Investor Day – Retirement income policy update 1. Government discussion paper available at https://consult.treasury.gov.au.
The ‘cut’ The ‘stack’ The ‘wrap’
CIPR framework • include soft-default mechanism to ease
decision making for individuals
• provide safe harbour for trustees against not meeting fiduciary obligations
CIPR product • provide broadly constant stream of income
throughout retirement
• mass-customised composite product-designed in best interests of majority of members
Providing a higher and more stable income than account-based pension drawdown at minimum rates
Providing flexibility to access ‘lumpy’ income throughout retirement from an account-based pension
A combination of ‘The Cut’ and ‘The Stack’ delivering a balance of their benefits
Examples of possible CIPRs (extract from Government discussion paper)

12
Key points
1 Retirement income reforms well underway Clear focus on generating sustainable income streams Moving from consultation to implementation phase
2 CIPRs (MyRetirement) Framework designed to address risks retirees face Principles-based minimum product features CIPR structure emphasises role of 3rd party products
Regulatory reforms underway to enhance retirement phase
Investor Day – Retirement income policy update

Life Investor Day
Chris Plater
Chief Executive, Life

14
Key points
1 Asset allocation framework Consistently applied with strong risk management
2 Asset and liability matching Sales mix drives book profile
3 Return On Equity All product categories meet 18% ROE target (pre-tax)
4 Relative value Becoming more neutral across asset classes
5 Life investment portfolio Portfolio in good shape and meeting return target
High quality investment portfolio meeting 18% ROE
Investor Day – Life

15
Asset allocation framework Consistently applied with strong risk management
Capital & Risk
Management
Asset and liability
matching (ALM)
ROE Relative
value
No change to risk management
• Strong governance framework
• Risk management entrenched in corporate culture
• Minimise unwanted risks such as interest rate, currency and inflation risks
• Same risk management framework applied for Japanese business
• Fundamental principle - assets and liabilities cash flow matched
• Managed by dedicated team
• Liability maturity profile drives asset tenor
• Investment decisions based on risk-adjusted returns
• 18% (pre-tax) return on equity target for all products
• Investment returns considered relative to base swap rates
• Illiquidity premium contributes to relative value
Investor Day – Life

16
33%
43%
55% 58% 61% 65% 64%
57% 51% 53%
50%
12%
15%
11% 11%
12% 11% 12%
14%
16% 13% 16%
31%
20%
19%
21% 18%
16% 16% 20%
23% 22% 22% 5% 3%
4%
3% 3% 2% 3% 3% 7% 8% 8% 19% 18% 12%
7% 6% 6% 5% 5% 4% 4% 4%
10%
20%
30%
40%
50%
60%
70%
80%
90%
100%
FY07 FY08 FY09 FY10 FY11 FY12 FY13 FY14 FY15 FY16 Mar-17
Fixed income (IG) Fixed income (Non-IG) Property Equities and other Infrastructure
Life investment portfolio overview Driven by asset allocation framework
Investor Day – Life
• Life investment portfolio driven by asset allocation framework
• Asset mix has varied over time
• Long term track record of Life achieving 18% ROE (pre-tax) target
Life investment portfolio – last 10 years
1H17 Life ROE (pre-tax)
21.5%
10%
15%
20%
25%
30%
FY07 FY08 FY09 FY10 FY11 FY12 FY13 FY14 FY15 FY16 1H17
Life ROE (pre-tax)
Life ROE target (pre-tax)
17
1,000
2,000
3,000
4,000
5,000
6,000
7,000
<= 1year 1-3 years 3-5 years 5-15 years +15 years
Liability flows Asset Flows Non-debt asset realisations
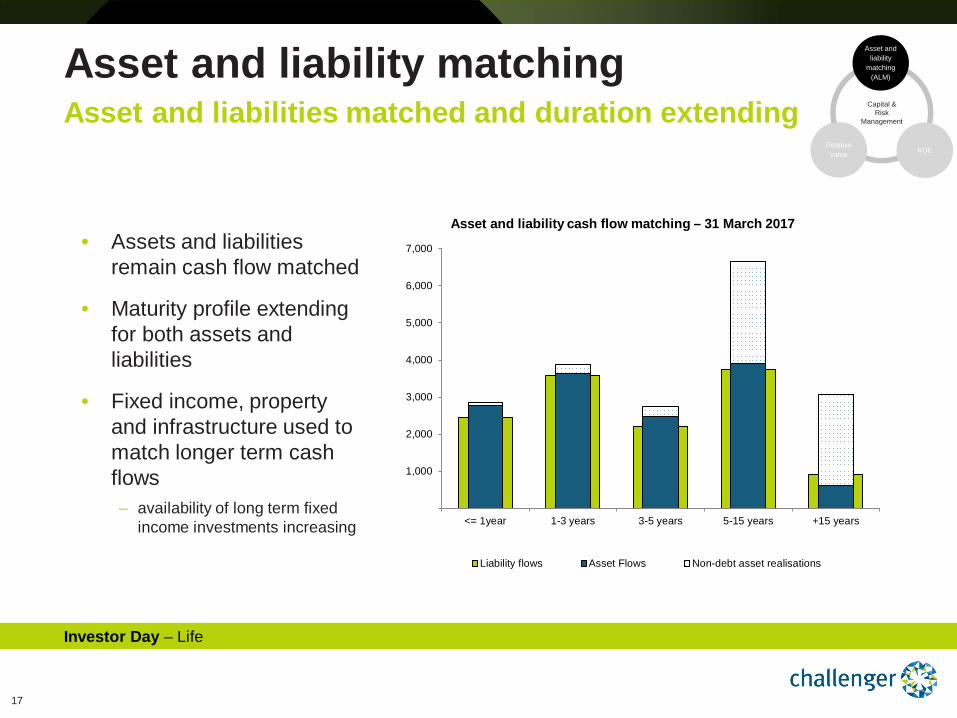
Asset and liability matching Asset and liabilities matched and duration extending
Investor Day – Life
Capital & Risk
Management
Asset and liability
matching (ALM)
ROERelative
value
• Assets and liabilities remain cash flow matched
• Maturity profile extending for both assets and liabilities
• Fixed income, property and infrastructure used to match longer term cash flows ‒ availability of long term fixed
income investments increasing
Asset and liability cash flow matching – 31 March 2017

18
Asset and liability matching Sales mix drives book profile Capital &
Risk Management
Asset and liability
matching (ALM)
ROERelative
value
Annuity sales mix moving to long term GIR sales mix moving to short term
Extending liability maturity profile GIR as portion of book has increased
10%
20%
30%
40%
50%
60%
200
400
600
800
1,000
1,200
1,400
1,600
1,800
Mar
-12
Jun-
12Se
p-12
Dec
-12
Mar
-13
Jun-
13Se
p-13
Dec
-13
Mar
-14
Jun-
14Se
p-14
Dec
-14
Mar
-15
Jun-
15Se
p-15
Dec
-15
Mar
-16
Jun-
16Se
p-16
Dec
-16
Mar
-17
$m
Term (exc. Japanese annuities)Japanese annuitiesLifetimeGuranteed Index Return (GIR)Long term annuity sales (RHS %)
1. Long term annuities represent lifetime and Japanese annuities (MS Primary fixed term annuities). Short term annuities represent domestic term annuities.
2. FY17 YTD represents 1 July 2016 to 31 March 2017.
~50%
Liability mix 31 March
2017 30 June
2016
Short term annuities1 54% 64%
Long term annuities1 32% 24%
Guaranteed Index Return (GIR) 14% 12%
Total 100% 100%
Average liabilities FY17 YTD2 FY16
Domestic annuities $9.7bn $9.0bn
Japanese annuities $0.1bn -
Total annuities $9.8bn $9.0bn
Guaranteed Index Return (GIR) $1.5bn $1.0bn
Total $11.3bn $10.0bn
~10%
Long term annuities gradually seasoning into book
Sales Liability
Investor Day – Life
GIR sales moving to shorter term

19
Return On Equity (ROE)
1. As at 31 March 2017. 2. ROE represents Life normalised ROE (pre-tax).
Product category
Domestic annuities
Japanese annuities
Institutional Guaranteed Index Return (GIR)
Product description
Amortising fixed term and lifetime annuities
Amortising fixed term annuities
Fixed term and liquid index return product
Liability mix1 83% 3% 14%
Asset allocation
Backed by fixed income and real assets
Backed by fixed income and real assets
Backed 100% by investment grade fixed income
Distribution costs
Excluded from COE margin Included in expenses
Implicit in COE margin No distribution costs incurred
Limited distribution costs
Current COE margin ~4.3% ~3.7% ~2.0%
ROE (pre-tax) 2 >18% >18% >18%
Long term track record of achieving
18% ROE
Capital & Risk
Management
Asset and liability
matching (ALM)
ROERelative
value
All product categories meeting 18% ROE target
Lower COE margin with ROE benefiting from minimal
distribution and operational costs
Lower COE margin with ROE benefiting from lower
capital intensity
Investor Day – Life

20
Relative value Becoming more neutral across asset classes
1. Expected asset risk premium represents asset return relative to the prevailing swap rate. Challenger estimates based on external data as at April 2017.
Asset risk premium – fixed income and property1
Investor Day – Life
Average +/- SD Historical range Last year Current
Capital & Risk
Management
Asset and liability
matching (ALM)
ROERelative
value
(2%)
0%
2%
4%
6%
8%
10%
12%
Investmentgradecredit
High yieldcredit
Property
Fixed income • Earning asset risk premium and illiquidity
premium (in addition to credit risk premium)
• Capital light strategy
Investment grade risk premium • Similar to last year; above long term average
High yield credit risk premium • Reduction from last year; now below long
term average
Property • Risk premium – lower than last year; above
long term average ‒ illiquidity premium captured within risk premium ‒ capital consumptive strategy
Asset allocation • Becoming more neutral between property
and fixed income asset classes

21
Fixed income and cash
66%
Property 22%
Equities and other 8%
Infrastructure 4%
meeting 18% ROE2
Life investment portfolio overview Portfolio in good shape and meeting return target
1. Credit defaults over 5 years to 31 December 2016. 2. Life meeting 18% pre-tax ROE target. 3. Properties disposed of as part of portfolio remix (October 2013 to March 2017). 4. Australian direct property portfolio as at 31 December 2016. 5. As at 31 December 2016.
Life investment portfolio $15.0bn – 31 March 2017
ABS
Corporate credit
Cash
Fixed income and cash • Investment grade typically
75% – 80% (March 2017 75%)
• Cash increased by ~$460m in early April from Challenger Capital Notes 2 issuance ‒ progressively being deployed
• Long term credit performance ‒ 8 bps of defaults over 5 years1
• No exposure to residential construction
• >90% of RMBS exposure investment grade ‒ historical default rate for Aust.
investment grade RMBS zero
• Availability of long term paper increasing ‒ ~15% of AUD corporate issuances
>10 years (less than 5% in 2015)
Property • Portfolio remix largely completed
‒ 53% of rental income from multi- tenancies (23% in 2010)
‒ properties disposed of at average 9% premium to book3
• Portfolio comprises4 ‒ office 58%
‒ retail 35%
‒ industrial 7%
• 32% of gross rental income comes from Australian government tenants5
• $0.3bn committed to new properties due to come online over next two years
Equities & other Infrastructure
• Held for diversification purposes and long term cash flows
• Combination of unlisted, listed and absolute return investments
Investor Day – Life

22
Key points
1 Asset allocation framework Consistently applied with strong risk management
2 Asset and liability matching Sales mix drives book profile
3 Return On Equity All product categories meet 18% ROE target (pre-tax)
4 Relative value Becoming more neutral across asset classes
5 Life investment portfolio Portfolio in good shape and meeting return target
High quality investment portfolio meeting 18% ROE
Investor Day – Life

Distribution, Product and Marketing Investor Day
Richard Howes
Chief Executive Distribution, Product and Marketing

24
Key points
1 Wealth industry sales process End-to-end integration requires multiple capabilities
2 Consumer and adviser brand Sales success underpinned by strong brand recognition
3 Product High quality and award winning products
4 Advice Multi-dimensional and supported by complex machinery Product integration requires significant investment
5 Challenger Independent product provider with competitive advantage
Independent product provider with competitive advantage
Investor Day – Distribution, Product and Marketing

25
Wealth industry sales process End-to-end integration requires multiple capabilities
Advice
CONSUMER AND ADVISER BRAND
PRODUCT ADVISER SUPER
TRUSTEES RESEARCH HOUSES / ASSET CONSULTANTS SALES
Established partner across complex advice system
Deep relationships
Technical capability
Highly valued products
Investor Day – Distribution, Product and Marketing
26
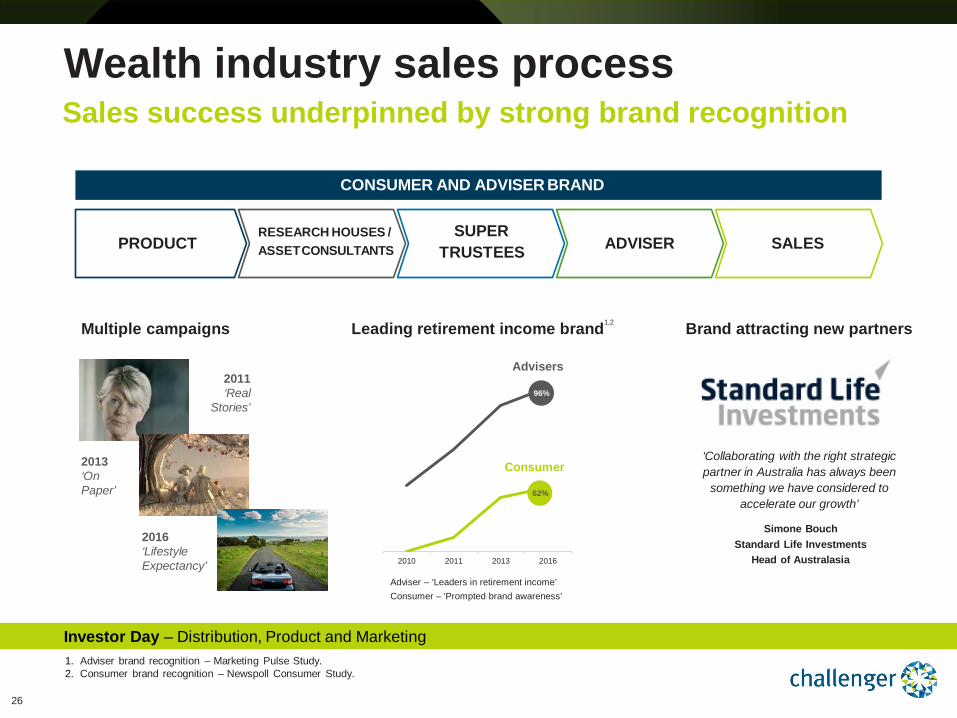
Wealth industry sales process Sales success underpinned by strong brand recognition
1. Adviser brand recognition – Marketing Pulse Study. 2. Consumer brand recognition – Newspoll Consumer Study.
Multiple campaigns Leading retirement income brand1,2 Brand attracting new partners
2011 ‘Real
Stories’
2013 ‘On Paper’
2016 ‘Lifestyle Expectancy’ 2010 2011 2013 2016
96%
62%
Advisers
Consumer
Adviser – ‘Leaders in retirement income’ Consumer – ‘Prompted brand awareness’
CONSUMER AND ADVISER BRAND
PRODUCT ADVISER SUPER
TRUSTEES RESEARCH HOUSES / ASSET CONSULTANTS SALES ADVISER
‘Collaborating with the right strategic partner in Australia has always been
something we have considered to accelerate our growth’
Simone Bouch Standard Life Investments
Head of Australasia
Investor Day – Distribution, Product and Marketing

27
500
1,000
1,500
2,000
2,500
3,000
3,500
4,000
4,500
$m
2009 2017
Colonial on platform
GIF launched
2
CarePlus launched
Liquid Lifetime launched
GPF launched
2
QSuper term launched
VicSuper on platform
Industry funds on platform
Bendigo lifetime launched
Wealth industry sales process High quality and award winning products
1. Annuity sales growth chart represents rolling 12 month quarterly annuity sales to 31 March 2017. 2. Guaranteed Income Fund (GIF) and Guaranteed Pension Fund (GPF).
Track record of product innovation1
Annuity sales increased from $0.5bn to $4bn per annum
Next wave of innovation • New retirement income rules
‒ further innovation opportunities
• Launching DLA ‒ once regulations finalised
‒ new Liquid Lifetime deferred option
‒ single premium retail product
‒ building block for CIPRs
CONSUMER AND ADVISER BRAND
PRODUCT ADVISER SUPER
TRUSTEES RESEARCH HOUSES / ASSET CONSULTANTS SALES ADVISER
Investor Day – Distribution, Product and Marketing

28
Wealth industry sales process Deep relationships with gate keepers
CONSUMER AND ADVISER BRAND
PRODUCT ADVISER SUPER
TRUSTEES RESEARCH HOUSES / ASSET CONSULTANTS SALES ADVISER
INSTITUTIONAL “Buy” Ratings
RETAIL “Buy” Ratings
58 47
‒ Public policy moving toward longevity solutions
‒ Funds can partner with 3rd parties to provide CIPRs
‒ Leveraging trustee relationships across both Funds Management and Life
Investor Day – Distribution, Product and Marketing
‒ Strong and recognised technical capability
‒ Work to include in model portfolios
‒ Ongoing ratings renewal process

29
Advice The link between product and customers
PRODUCT ADVISER SUPER
TRUSTEES RESEARCH HOUSES / ASSET CONSULTANTS SALES ADVISER
CONSUMER AND ADVISER BRAND
IMPLEMENTATION ADVICE
FORMULATION CLIENT
ENGAGEMENT
Investor Day – Distribution, Product and Marketing

30
Advice Multi-dimensional and supported by complex machinery
IMPLEMENTATION ADVISER
FORMULATION CLIENT
ENGAGEMENT
Investor Day – Distribution, Product and Marketing
Platforms Research / Investment
Governance
Licensee/ Dealer Group
IMPLEMENTATION ADVICE
FORMULATION CLIENT
ENGAGEMENT

31
Licensee / Dealer Group Challenger rated No.1 by advisers
1. Challenger annuities service level analysis conducted by Wealth Insights and compared to the broader market. 2. Professional Planner / Zenith 2015 distributor of the year. 3. Fidante Partners service level analysis conducted by Wealth Insights.
Challenger +50%
+’ve net promotor score
-’ve net promotor score Peers include Australia’s top 20 fund managers 0 2 4 6 8 10
BDMteam
Technicalservices
Image andreputation
Overalladviser
satisfaction
Challenger
Industry average
Investor Day – Distribution, Product and Marketing
OF ADVISERS PLACE BUSINESS WITH ONE
OR MORE BOUTIQUES3
24%
#1
Licensee/ Dealer Group
Adviser education
Para –planning
Fidante Partners
Distributor of the year2
Challenger 2nd highest industry net promoter score1
Challenger – capability highly rated by advisers1
Challenger rated #1 in industry
OF ADVISERS USING FIDANTE ALSO USE
CHALLENGER ANNUITIES3
36%
MEETINGS WITH ADVISERS
IN 2016
12,700

32
Challenger’s Retirement Illustrator1
Licensee / Dealer Group Para-planning process supported by market leading tools
1. Retirement illustrator images are illustrative only and represent an example for a retiree couple with $600,000 in superannuation savings on retirement (aged 65). The amounts projected are estimates only and are not guaranteed and the actual outcome may differ significantly.
• Scenario modelling to demonstrates benefit of partial annuitisation
• Supports income layering approach
• Allows comparison of income and capital values for different scenarios
Investor Day – Distribution, Product and Marketing
Provides inputs for financial advice preparation
Adviser education
Para –planning
Licensee/ Dealer Group

33
Licensee / Dealer Group Trusted partner in adviser education
Relationships with leading universities
Supporting advisers through multiple channels
UNSW Retirement Planning course UNSW Aged Care Planning course
Retirement essentials workshop
Advisory group member for retirement outcomes Lifecycle Investments course
ADVISERS RECEIVING CHALLENGER
TECH NEWS
16,000
ADVISERONLINE LOGINS
13,000
Investor Day – Distribution, Product and Marketing
ADVISER CALLS TO TECHNICAL
SERVICES IN 2016
4,500
Licensee/ Dealer Group
Adviser education
Para –planning

34
Research / Investment Governance Thought leadership influencing industry practice
Income layering – addressing retiree needs
Dedicated retirement income research capability
Investor Day – Distribution, Product and Marketing
Research / Investment
Governance
Complianceand
Governance
APL
Model portfolio

35
Research / Investment Governance Products well represented across APLs and model portfolios
1. Approved Product List (APL).
CHALLENGER AND FIDANTE
Over 650 APLs1
Investor Day – Distribution, Product and Marketing
ON APLs OF ALL MAJOR HUBS
In 190 model portfolios CHALLENGER AND FIDANTE
Research / Investment
Governance
APL
Model portfolio
Complianceand
Governance
Colonial Guidance Paper The role of annuities in retirement income planning “annuities need to be one tool in the financial adviser’s toolbox. We believe that an account based pension with a lifetime annuity or some sort of deferred lifetime annuity will be a good solution for Australian retirees”

36
Platforms
1. Following launch of AMP and BT, new platform relationships will provide access to one third of Australian superannuation industry FUM. 2. Following launch of AMP and BT, new platform relationships will provide access to two thirds of Australian financial advisers. 3. Australian super system size based on APRA annual superannuation bulletin and market share based on Strategic Insights analysis of retail managed funds. 4. Wealth Insights 2016 Adviser Market Trends Report - provider footprint (primary platform used by advisers).
Broadening access to Challenger annuities
Access to Challenger annuities via platforms
1,3 Adviser access to Challenger annuities
via platofrms2,4
• Platforms provide access to 1/3rd of superannuation FUM1
• Platforms provide access to 2/3rd of advisers2
• Annuities on platform – very positive adviser feedback
• Advisers more likely to use annuities via platforms
‒ simple to use and easy origination process
‒ advisers and clients can view portfolio in one place
Investor Day – Distribution, Product and Marketing
AMP annuities on platform expect to launch Q2 FY18 BT annuities on platform expect to launch Q3 FY18
Platforms
Technology

37
Advice process Multi-dimensional and supported by complex machinery
Platforms Research/ Investment
Governance
Licensee / Dealer Group
Adviser education
APL Para –
planning
Model portfolio
Compliance and
Governance
Technology
CLIENT ENGAGEMENT IMPLEMENTATION
ADVICE FORMULATION
Investor Day – Distribution, Product and Marketing

38
Challenger Independent product provider with competitive advantage
1. Strategic Insights. 2. Fastest active manager in terms of FUM growth (in dollars) over the last five years to 31 December 2016 – Rainmaker Roundup.
Advice
RESEARCH HOUSES /
Investor Day – Distribution, Product and Marketing
CONSUMER AND ADVISER BRAND
PRODUCT ADVISER SUPER
TRUSTEES SALES
#1 Australian annuities provider1 ‒ Annuity sales up 17% CAGR
over last 5 years
Fastest growing active manager ‒ $23bn of Fidante Partners’ net flows2
over last 5 years
‒ Multi-product super fund relationships ‒ Partnering to implement retirement solutions ‒ Research and technology support
‒ Recognised product innovator ‒ Award winning products ‒ Recommended by all major hubs
‒ Deeply embedded into advice process ‒ Market leading tools and platform integration ‒ Rated #1 by advisers
‒ Dedicated retirement income focus ‒ Australia's #1 retirement income brand ‒ Significant market position
RESEARCH HOUSES / ASSET CONSULTANTS
‒ Thought leadership influencing industry ‒ Trusted education partner ‒ Products in multiple APLs and models

Funds Management Investor Day
Ian Saines
Chief Executive, Funds Management

40
Key points
Leading model building on successful track record
Investor Day – Funds Management
1 Funds Management overview Fastest growing Australian active fund manager Leading model has driven persistent growth
2 Managers diversified across life cycle stages Provides diversification of earnings Providing future capacity and growth prospects
3 Fidante Partners boutique manager panel Ardea Investment Management WaveStone Capital Lennox Capital Partners
4 Fidante Partners Europe Investing to replicate successful model offshore

41
Funds Management Fastest growing Australian active fund manager1
1. Consolidated FUM for Australian Fund Managers – Rainmaker Roundup. Fastest active manager in terms of FUM growth (dollars) over the last five years to 31 December 2016.
2. Consolidated FUM for Australian Fund Managers – Rainmaker Roundup.
Investor Day – Funds Management
50
100
150
200
250
300
June
200
8 =
100
Challenger Australian Funds Management market
Challenger FUM growth compared to market2
Benefiting from system growth ‒ super savings to double over 10 years
Leading business model ‒ allows managers to do what they do best ‒ highly regarded support platform
Business highly scalable ‒ ability to add new strategies ‒ sharing infrastructure with Life Company
Proven distribution model ‒ FUM growth proves effectiveness ‒ developing global distribution footprint
1
Leading model with strong track record of success
FUM growth significantly outperforming market
2
3
4
Sale of Kapstream $5.4bn derecognised

42
Managers diversified across life cycle stages
• Break-even profitability
• Build investment story and track record
• Attract initial flows • Limited capital
invested
• Growing profitability
• Boutique brand recognition
• Diversifying client base • Investment performance
very important • Access retail platforms • Manage capacity and
growth profile
• High profitability
• Significant operating leverage
• Maintain investment track record
• Optimise FUM mix and margins
• Develop new growth strategies
• Boutique succession planning
Incubation
Growth
Established
Providing future capacity and growth prospects
4 boutique managers
Investor Day – Funds Management

43
Lennox Capital Partners James Dougherty Principal, Portfolio Manager Established Lennox Capital Partners in 2017 Prior to Lennox Capital Partners, James was lead portfolio manager of the Macquarie Small Companies Fund
Fidante Partners boutique principals Panel discussion
Ardea Investment Mgt Ben Alexander Principal, Portfolio Manager Co-founded Ardea Investment Management in 2008 Prior to Ardea Investment Management, Ben led the Credit Suisse Asset Management Australia Fixed Income business
WaveStone Capital Catherine Allfrey Principal, Portfolio Manager Co-founded WaveStone Capital in 2006 Prior to WaveStone Capital, Catherine was a portfolio manager at Colonial First State Global Asset Management
Investor Day – Funds Management

44
Ardea Investment Management Absolute return, multi-strategy, fixed income manager
Capturing inefficiencies in the fixed income market
• Established 2008
• FUM $7.5 billion1 across a number of different fixed income strategies
• Principals have worked together since early 2000s
2 4 6 8 10
Govt Inflation(May 2009)
Real Outcome(Aug 2011)
Real Outcome Plus(Mar 2013)
Inception p.a.
Target
Fixed income
and cash markets
Inflation markets
Derivative markets
ARDEA
Investment universe
Historical performance2 (%)
1. As at 30 April 2017. 2. Government Inflation target is the Bloomberg Australian Bond Government Inflation Index 0+; Real Outcome and Real Outcome
Plus target is CPI.
• Uniquely combines deep expertise in fixed income and cash, derivative and inflation markets
Investor Day – Funds Management
1.0
2.0
3.0
4.0
5.0
6.0
7.0
8.0
Mar 09 Mar 10 Mar 11 Mar 12 Mar 13 Mar 14 Mar 15 Mar 16 Mar 17
FUM ($bn)

45
WaveStone Capital Active, high conviction investment manager Investing in quality growth companies with sustainable competitive advantage
• Commenced partnership with Fidante in 2008
• FUM $2.7 billion1
• Principals’ 20+ years experience and have worked together since 1998
• Fastest growing Australian equity manager (over last 5 years)2
Historical performance3 (%)
1. As at 31 March 2017 2. Rainmaker Roundup – December 2016. Measured as FUM growth over last five years. 3. Returns are net of all fees. Target benchmark – S&P/ASX300 Accumulation Index for the Australian Share Fund & Dynamic
Australian Equity Fund. Target benchmark for the Absolute Return Fund is the RBA cash rate.
2 4 6 8 10 12
Absolute ReturnFund
(Sep 2006)
Dynamic AustralianEquity Fund(Jul 2009)
Australian ShareFund
(Feb 2014)
Inception p.a.
Target benchmark
Investor Day – Funds Management
Investment process
FUM ($bn)
0.5
1.0
1.5
2.0
2.5
3.0
Mar 09 Mar 10 Mar 11 Mar 12 Mar 13 Mar 14 Mar 15 Mar 16 Mar 17

46
Lennox Capital Partners Specialist Australian small companies manager
Active fundamental investment approach
• Established March 2017
• Founding principals previously managed the Macquarie Australian Small Companies Fund (since 2011)
• Top quartile performance track record – 11% p.a. outperformance over 5 years1
• Proven style-agnostic philosophy investing in both value and growth stocks
5 10 15 20 25
5 years (pa)
3 years (pa)
1 year
Total FundReturns
BenchmarkReturns
Investor Day – Funds Management
Macquarie Australian Small Companies Fund historical performance1 (%)
Investment process
1. Macquarie Australian Small Companies Fund Gross performance as at 31 January 2017. The benchmark is the S&P/ASX Small Ordinaries Accumulation index. The track record reflects the actual performance of the Macquarie Australian Small Companies Fund. James Dougherty was lead portfolio manager on this Fund from 1 January 2012 to 27 January 2017. Liam Donohue was co-portfolio manager on this Fund from 1 July 2015 to 25 January 2017. While both had primary responsibility for the Fund over these specified time periods, they were part of the broader 10 person Macquarie Australian Fundamental Equity team. The Australian Fundamental Equity team utilises a unique team-based investment approach which aims to consistently deliver returns above the benchmark through stock selection. As part of the Australian Fundamental Equity team, James and Liam were also able to leverage the broader 27 person Macquarie Australian Equity team (which managed $13 billion in funds as at 31 December 2016) including capabilities across (but not limited to) quantitative screening, risk management and portfolio construction.

47
Fidante Partners Europe Investing to replicate successful model offshore
Extending global distribution and product footprint • Strong demand from Australian clients for global product • Alternatives is a rapidly growing investment category • Fidante model highly regarded by asset consultants and clients
Fidante Partners Europe • Proven distribution capability in UK, Nordics and USA • Credible platform to attract and grow new managers • Looking to add further boutiques to platform
Investor Day – Funds Management
Fidante Partners Europe Cathy Hales Global Head of Fidante Partners Cathy joined Fidante Partners in 2011 and relocated to London in 2016. Prior to joining Challenger, Cathy held senior executive roles both in Australia and offshore with RREEF, Deutsche Bank, Macquarie, Colonial First State and BT Australia
Fidante Europe FUM acquired through Dexion acquisition ($bn)
up ~140% since
acquisition 0.5
1.0
1.5
2.0
Sep-15 Mar-16 Sep-16 Mar-17

48
Key points
1 Funds Management overview Fastest growing Australian active fund manager Leading model has driven persistent growth
2 Managers diversified across life cycle stages Provides diversification of earnings Provides future capacity and growth prospects
3 Fidante Partners boutique manager panel Ardea Investment Management WaveStone Capital Lennox Capital Partners
4 Fidante Partners Europe Investing to replicate successful model offshore
Leading model building on successful track record
Investor Day – Funds Management

Wrap up and Q&A session Investor Day
Brian Benari
Managing Director and Chief Executive Officer

50
Wrap up
1 Retirement income policy update Regulatory reforms underway to enhance retirement phase
3 Life High quality investment portfolio meeting 18% ROE (pre-tax)
2 Distribution, Product and Marketing Independent product provider with competitive advantage
4 Funds Management Leading model building on successful track record
5 Challenger investor proposition Market leader with competitive advantage Reconfirm FY17 Life COE guidance – mid-point of $620m to $640m range
Providing our customers with financial security in retirement
Investor Day – Wrap up

Investor Day Q&A session

52
This presentation was prepared for the purpose of a briefing to equity analysts and certain wholesale investors on 23 May 2017.
The material in this presentation is general background information about Challenger Limited activities and is current at the date of this presentation. It is information given in summary form and does not purport to be complete. It is not intended to be relied upon as advice to investors or potential investors and does not take into account the investment objectives, financial situation or needs of any particular investor. These should be considered with professional advice when deciding if an investment is appropriate.
Past performance is not an indication of future performance.
Any forward looking statements included in this document are by nature subject to significant uncertainties, risks and contingencies, many of which are outside the control of, and are unknown to, Challenger, so that actual results or events may vary from those forward looking statements, and the assumptions on which they are based.
While Challenger has sought to ensure that information is accurate by undertaking a review process, it makes no representation or warranty as to the accuracy or completeness of any information or statement in this document.
Important note


