Page 1Central Referral Point – Data Report 2016-17
Central Referral Point
Data Report 2016-17
JusticeVictims Services
Page 2 Central Referral Point – Data Report 2016-17
Note: Data for this annual report was extracted from the Central Referral Point (CRP) throughout 2016/17. The CRP is a live data collection platform and NSW Police Force (NSWPF) and other agencies continue to make contributions throughout the reporting period. Data is subject to change due to deletion and backdating of referrals by NSWPF, ongoing data corrections/modifications by users, as well as the timing of extraction.
Produced by Victims Services, NSW Department of Justice
Further copies may be obtained from
Victims Services Locked Bag 5118 Parramatta NSW 2124
P: 1800 633 063 F: 02) 8688 9632 E: [email protected] W: www.victimsservices.justice.nsw.gov.au
September 2017
© State of New South Wales through Victims Services, Department of Justice, September 2017. This work may be freely reproduced for personal, educational and government purposes. Permission must be received from the Department for all other uses.
Alternative formats of this information are available.
This document has been prepared by Victims Services for general information purposes. While every care has been taken in relation to its accuracy, no warranty is given or implied. Further, recipients should obtain their own independent advice before making any decisions that rely on this information. (VS•10/2017)
JusticeVictims Services
Page 3Central Referral Point – Data Report 2016-17
Contents
Safer Pathway ................................................................................................................................................................ 4
Central Referral Point referrals 2016-2017 ............................................................................................................ 5
Background ............................................................................................................................................................... 5
1. Safer Pathway Referrals 1 July 2016 – 30 June 2017 .................................................................................. 6 1.1 Gender of DFV victims .................................................................................................................................... 6 1.2 Referrer risk rating ............................................................................................................................................ 7 1.3 Safer Pathway Safety Action Meeting (SAM) sites .................................................................................... 8 1.4 Relationship type ............................................................................................................................................ 11 1.5 Age of victims .................................................................................................................................................. 13 1.6 Older victims .................................................................................................................................................... 14 1.7 Incident type .................................................................................................................................................... 15 1.8 Referrals by Local Area Commands (LAC) ...............................................................................................16 1.9 Indigenous ........................................................................................................................................................20 1.10 Reasons for closure .......................................................................................................................................21
2. Non-Safer Pathway Referrals 1 July 2016 – 30 June 2017 .......................................................................22 2.1 Referrer risk rating ..........................................................................................................................................22 2.2 Referrals received by month ........................................................................................................................24 2.3 Relationship type ............................................................................................................................................24 2.4 Age of victims ..................................................................................................................................................26 2.5 Older victims ....................................................................................................................................................27 2.6 Incident type ....................................................................................................................................................27 2.7 Referrals by Local Area Commands (LAC) ...............................................................................................28 2.8 Indigenous ........................................................................................................................................................32 2.9 Reasons for close ...........................................................................................................................................33
Page 4 Central Referral Point – Data Report 2016-17
Safer PathwaySafer Pathway is a key element of the Domestic and Family Violence (DFV) Blueprint for Reform (the Blueprint). Safer Pathway commenced in September 2014, and will operate state-wide by the end of 2018. Safer Pathway aims to provide a consistent, coordinated and collaborative, cross-agency response to all victims of domestic and family violence in NSW.
Domestic violence is an act of violence between persons in a domestic relationship as defined in the Crimes (Domestic and Personal) Violence Act 2007. Domestic relationships can include intimate relationships and family relationships.
A domestic relationship includes:
• married and de facto couples
• boyfriends and girlfriends
• LGBTI couples
• long term residents in the same residential facility
• carers
• relatives
• for Aboriginal people, extended family or kin
Domestic violence is complex and can include:
• physical abuse
• intimidation
• stalking
• sexual assault
• verbal abuse and/or threats
• psychological abuse
• threats to harm others, and/or causing harm to pets
• threats to damage property or actually damaging property
• financial deprivation and social isolation
• coercive control
This data report provides a snap shot of the Safer Pathway program in 2016/17, using data extracted from the Central Referral Point (CRP).
Safer Pathway consists of a number of tools and services aimed at providing streamlined, consistent support to those impacted by domestic and family violence, including:
• the Domestic Violence Safety Assessment Tool (DVSAT)
• the CRP
• Local Coordination Points (LCP)
• Safety Action Meetings (SAM), and
• Information Sharing provisions under Part 13a of the Crimes (Domestic and Personal Violence) Act 2007.
Women’s Domestic Violence Court Advocacy Services (WDVCAS) host LCPs across NSW for female victims, and five NGOs, known as Local Support Services (LSS), host LCPs across NSW for male victims.
LCPs are being progressively rolled out across the state. As at March 2017, LCPs and associated SAMs are fully operational in 27 Safer Pathway sites. Refer to Table 1 for a list of SAM sites as they became operational. If a LCP is not yet operational in a particular area, victims are referred to their local LCP. Refer to Part 2 Non-Safer Pathway Referrals 1 July 2016 – 30 June 2017.
Page 5Central Referral Point – Data Report 2016-17
Central Referral Point referrals 2016-2017
Background
A referral in the context of Safer Pathway refers to an individual incident of domestic and family violence. The majority of referrals come from the NSW Police Force.
Police are required to complete a Domestic Violence Safety Assessment Tool (DVSAT) with the victim of every DFV incident reported to them. Based on the DVSAT, a victim can be assessed as either ‘at threat’ or ‘at serious threat’ of further harm due to DFV.
Police are required to enter the completed DVSAT and key information about each victim, including name, address and contact details, into the Police computer system, Web-COPS. Web-COPS then sends the information to the CRP, which sends a referral for each victim to the nearest specialist DFV service.
A very small number of referrals come from local court registrars. These referrals are made when a DFV victim makes a private application for an Apprehended Domestic Violence Order (ADVO) at a local court in NSW.
The CRP is an online referral platform managed by Victims Services, Department of Justice.
The CRP receives referrals for people who have experienced an incident of domestic or family violence (DFV), and sends these referrals to the specialist DFV service closest to where each victim lives. The aim of the CRP is to connect DFV victims with specialist services in a timely manner.
In the CRP ‘referrer risk rating’ means the level of threat to a victim’s safety identified by Police or local court registrars.
DFV CRP referrals* in 2016/2017 = 132,070
• Total female referrals: 94,912
• Total male referrals: 37,158
* Referrals include Safer Pathway and Non-Safer Pathway
Page 6 Central Referral Point – Data Report 2016-17 Safer Pathway
Saf
er P
athw
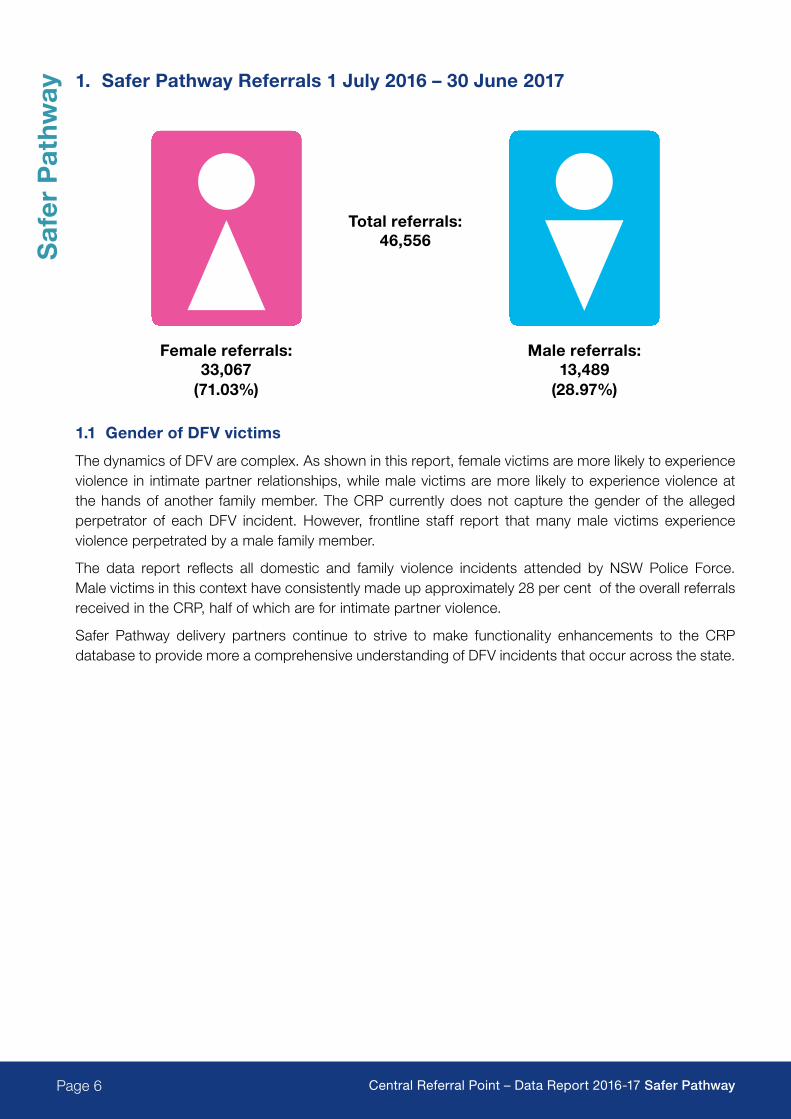
ay1. Safer Pathway Referrals 1 July 2016 – 30 June 2017
Total referrals: 46,556
Female referrals: Male referrals: 33,067 13,489 (71.03%) (28.97%)
1.1 Gender of DFV victims
The dynamics of DFV are complex. As shown in this report, female victims are more likely to experience violence in intimate partner relationships, while male victims are more likely to experience violence at the hands of another family member. The CRP currently does not capture the gender of the alleged perpetrator of each DFV incident. However, frontline staff report that many male victims experience violence perpetrated by a male family member.
The data report reflects all domestic and family violence incidents attended by NSW Police Force. Male victims in this context have consistently made up approximately 28 per cent of the overall referrals received in the CRP, half of which are for intimate partner violence.
Safer Pathway delivery partners continue to strive to make functionality enhancements to the CRP database to provide more a comprehensive understanding of DFV incidents that occur across the state.
Page 7Central Referral Point – Data Report 2016-17 Safer Pathway
Safer P
athway
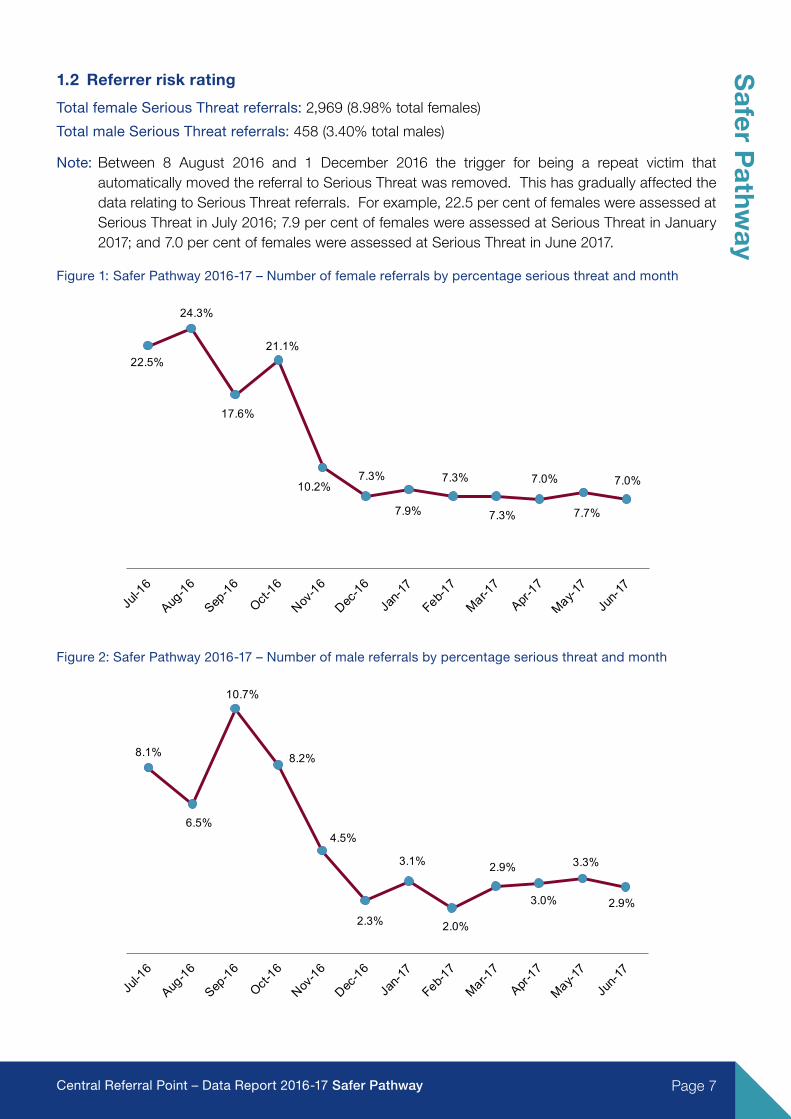
1.2 Referrer risk rating
Total female Serious Threat referrals: 2,969 (8.98% total females)
Total male Serious Threat referrals: 458 (3.40% total males)
Note: Between 8 August 2016 and 1 December 2016 the trigger for being a repeat victim that automatically moved the referral to Serious Threat was removed. This has gradually affected the data relating to Serious Threat referrals. For example, 22.5 per cent of females were assessed at Serious Threat in July 2016; 7.9 per cent of females were assessed at Serious Threat in January 2017; and 7.0 per cent of females were assessed at Serious Threat in June 2017.
Figure 1: Safer Pathway 2016-17 – Number of female referrals by percentage serious threat and month
22.5%
24.3%
17.6%
21.1%
10.2%7.3%
7.9%
7.3%
7.3%
7.0%
7.7%
7.0%
Figure 2: Safer Pathway 2016-17 – Number of male referrals by percentage serious threat and month
8.1%
6.5%
10.7%
8.2%
4.5%
2.3%
3.1%
2.0%
2.9%
3.0%
3.3%
2.9%
Page 8 Central Referral Point – Data Report 2016-17 Safer Pathway
Saf
er P
athw
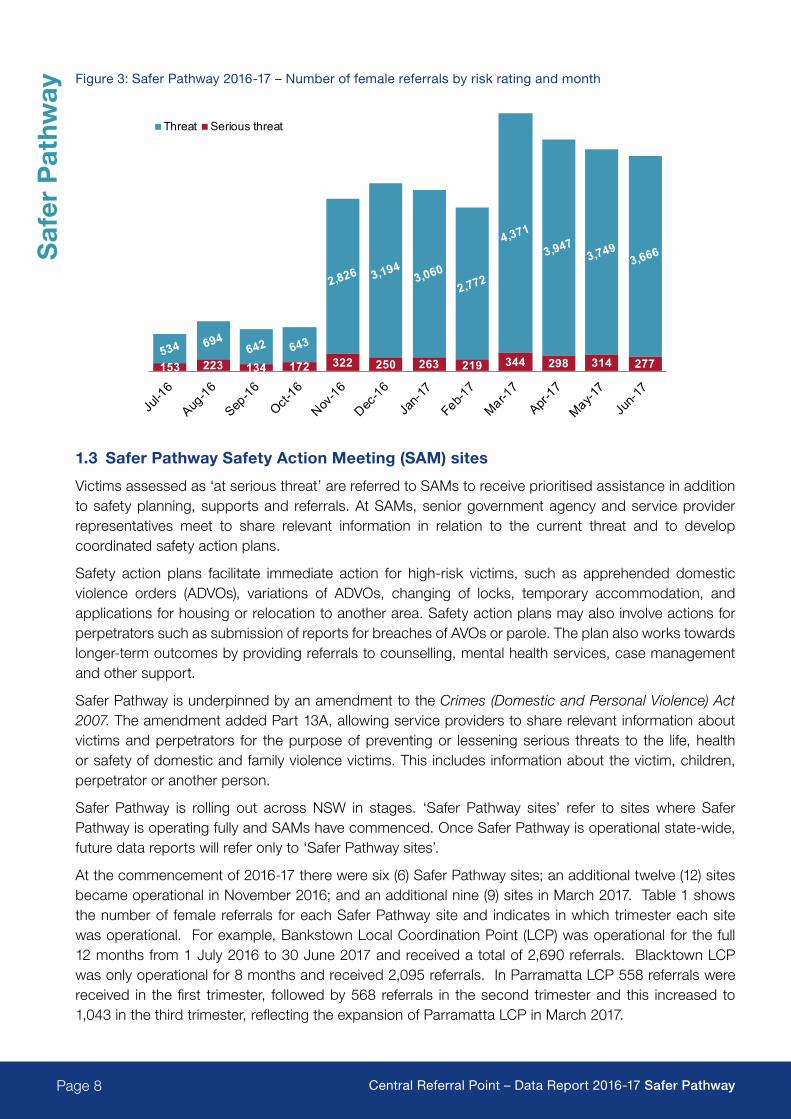
ayFigure 3: Safer Pathway 2016-17 – Number of female referrals by risk rating and month
153 223 134 172 322 250 263 219 344 298 314 277
Threat Serious threat
1.3 Safer Pathway Safety Action Meeting (SAM) sites
Victims assessed as ‘at serious threat’ are referred to SAMs to receive prioritised assistance in addition to safety planning, supports and referrals. At SAMs, senior government agency and service provider representatives meet to share relevant information in relation to the current threat and to develop coordinated safety action plans.
Safety action plans facilitate immediate action for high-risk victims, such as apprehended domestic violence orders (ADVOs), variations of ADVOs, changing of locks, temporary accommodation, and applications for housing or relocation to another area. Safety action plans may also involve actions for perpetrators such as submission of reports for breaches of AVOs or parole. The plan also works towards longer-term outcomes by providing referrals to counselling, mental health services, case management and other support.
Safer Pathway is underpinned by an amendment to the Crimes (Domestic and Personal Violence) Act 2007. The amendment added Part 13A, allowing service providers to share relevant information about victims and perpetrators for the purpose of preventing or lessening serious threats to the life, health or safety of domestic and family violence victims. This includes information about the victim, children, perpetrator or another person.
Safer Pathway is rolling out across NSW in stages. ‘Safer Pathway sites’ refer to sites where Safer Pathway is operating fully and SAMs have commenced. Once Safer Pathway is operational state-wide, future data reports will refer only to ‘Safer Pathway sites’.
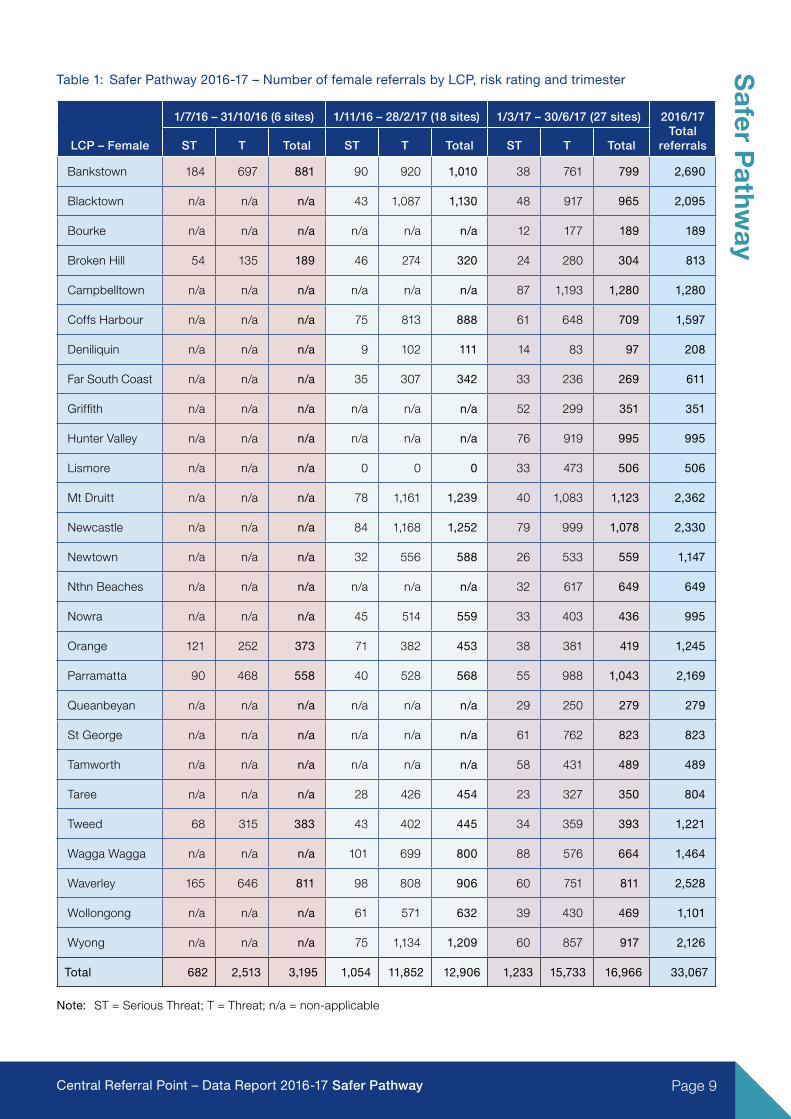
At the commencement of 2016-17 there were six (6) Safer Pathway sites; an additional twelve (12) sites became operational in November 2016; and an additional nine (9) sites in March 2017. Table 1 shows the number of female referrals for each Safer Pathway site and indicates in which trimester each site was operational. For example, Bankstown Local Coordination Point (LCP) was operational for the full 12 months from 1 July 2016 to 30 June 2017 and received a total of 2,690 referrals. Blacktown LCP was only operational for 8 months and received 2,095 referrals. In Parramatta LCP 558 referrals were received in the first trimester, followed by 568 referrals in the second trimester and this increased to 1,043 in the third trimester, reflecting the expansion of Parramatta LCP in March 2017.
Page 9Central Referral Point – Data Report 2016-17 Safer Pathway
Safer P
athway
Table 1: Safer Pathway 2016-17 – Number of female referrals by LCP, risk rating and trimester
LCP – Female
1/7/16 – 31/10/16 (6 sites) 1/11/16 – 28/2/17 (18 sites) 1/3/17 – 30/6/17 (27 sites) 2016/17 Total
referralsST T Total ST T Total ST T Total
Bankstown 184 697 881 90 920 1,010 38 761 799 2,690
Blacktown n/a n/a n/a 43 1,087 1,130 48 917 965 2,095
Bourke n/a n/a n/a n/a n/a n/a 12 177 189 189
Broken Hill 54 135 189 46 274 320 24 280 304 813
Campbelltown n/a n/a n/a n/a n/a n/a 87 1,193 1,280 1,280
Coffs Harbour n/a n/a n/a 75 813 888 61 648 709 1,597
Deniliquin n/a n/a n/a 9 102 111 14 83 97 208
Far South Coast n/a n/a n/a 35 307 342 33 236 269 611
Griffith n/a n/a n/a n/a n/a n/a 52 299 351 351
Hunter Valley n/a n/a n/a n/a n/a n/a 76 919 995 995
Lismore n/a n/a n/a 0 0 0 33 473 506 506
Mt Druitt n/a n/a n/a 78 1,161 1,239 40 1,083 1,123 2,362
Newcastle n/a n/a n/a 84 1,168 1,252 79 999 1,078 2,330
Newtown n/a n/a n/a 32 556 588 26 533 559 1,147
Nthn Beaches n/a n/a n/a n/a n/a n/a 32 617 649 649
Nowra n/a n/a n/a 45 514 559 33 403 436 995
Orange 121 252 373 71 382 453 38 381 419 1,245
Parramatta 90 468 558 40 528 568 55 988 1,043 2,169
Queanbeyan n/a n/a n/a n/a n/a n/a 29 250 279 279
St George n/a n/a n/a n/a n/a n/a 61 762 823 823
Tamworth n/a n/a n/a n/a n/a n/a 58 431 489 489
Taree n/a n/a n/a 28 426 454 23 327 350 804
Tweed 68 315 383 43 402 445 34 359 393 1,221
Wagga Wagga n/a n/a n/a 101 699 800 88 576 664 1,464
Waverley 165 646 811 98 808 906 60 751 811 2,528
Wollongong n/a n/a n/a 61 571 632 39 430 469 1,101
Wyong n/a n/a n/a 75 1,134 1,209 60 857 917 2,126
Total 682 2,513 3,195 1,054 11,852 12,906 1,233 15,733 16,966 33,067
Note: ST = Serious Threat; T = Threat; n/a = non-applicable
Page 10 Central Referral Point – Data Report 2016-17 Safer Pathway
Saf
er P
athw
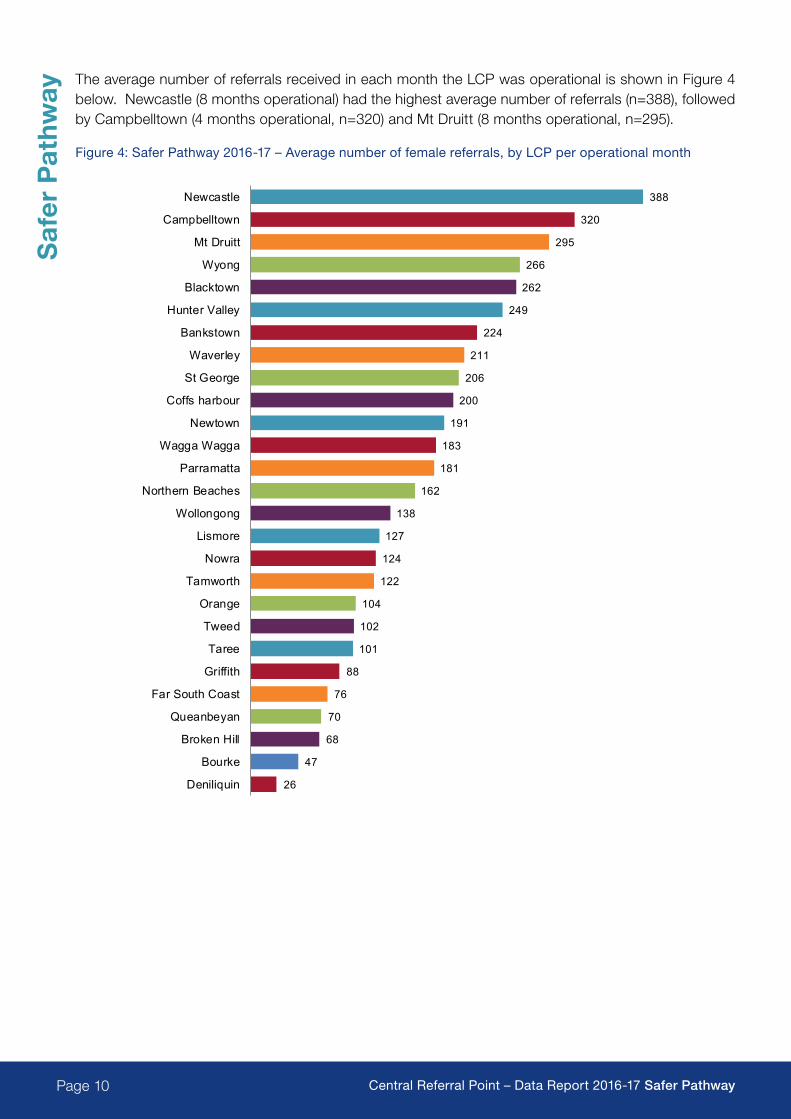
ayThe average number of referrals received in each month the LCP was operational is shown in Figure 4 below. Newcastle (8 months operational) had the highest average number of referrals (n=388), followed by Campbelltown (4 months operational, n=320) and Mt Druitt (8 months operational, n=295).
Figure 4: Safer Pathway 2016-17 – Average number of female referrals, by LCP per operational month
26
47
68
70
76
88
101
102
104
122
124
127
138
162
181
183
191
200
206
211
224
249
262
266
295
320
388
Deniliquin
Bourke
Broken Hill
Queanbeyan
Far South Coast
Griffith
Taree
Tweed
Orange
Tamworth
Nowra
Lismore
Wollongong
Northern Beaches
Parramatta
Wagga Wagga
Newtown
Coffs harbour
St George
Waverley
Bankstown
Hunter Valley
Blacktown
Wyong
Mt Druitt
Campbelltown
Newcastle
Page 11Central Referral Point – Data Report 2016-17 Safer Pathway
Safer P
athway
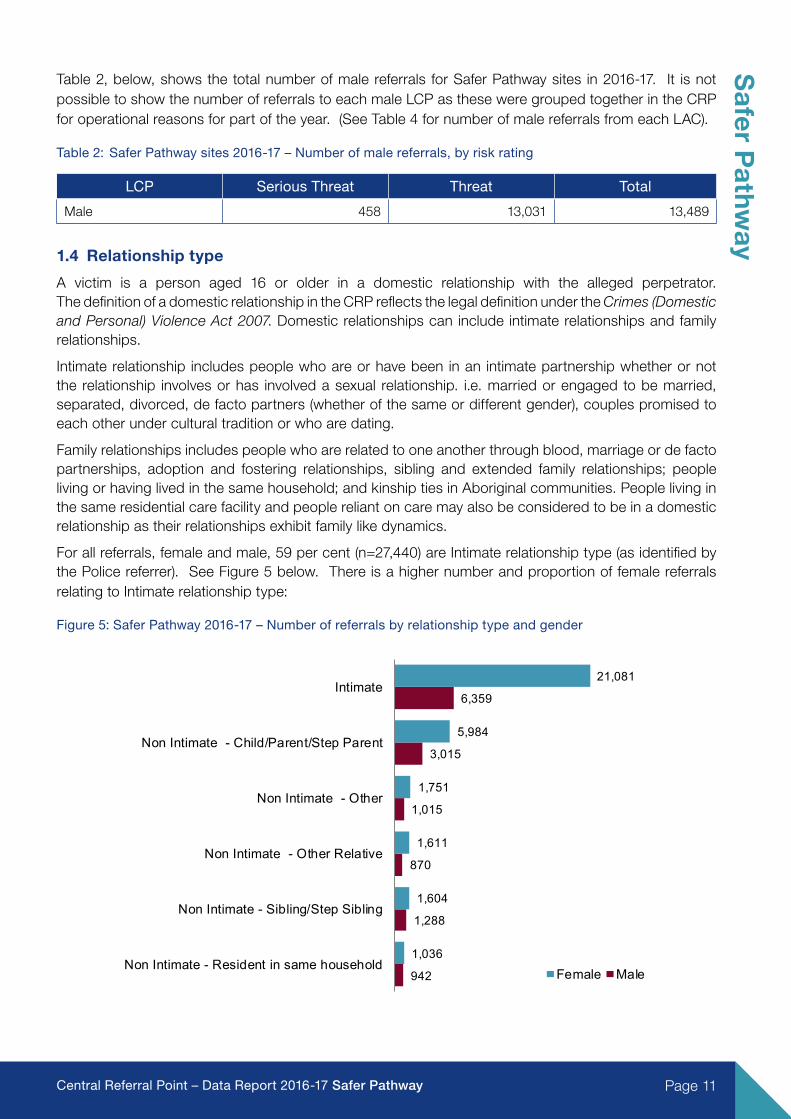
Table 2, below, shows the total number of male referrals for Safer Pathway sites in 2016-17. It is not possible to show the number of referrals to each male LCP as these were grouped together in the CRP for operational reasons for part of the year. (See Table 4 for number of male referrals from each LAC).
Table 2: Safer Pathway sites 2016-17 – Number of male referrals, by risk rating
LCP Serious Threat Threat Total
Male 458 13,031 13,489
1.4 Relationship type
A victim is a person aged 16 or older in a domestic relationship with the alleged perpetrator. The definition of a domestic relationship in the CRP reflects the legal definition under the Crimes (Domestic and Personal) Violence Act 2007. Domestic relationships can include intimate relationships and family relationships.
Intimate relationship includes people who are or have been in an intimate partnership whether or not the relationship involves or has involved a sexual relationship. i.e. married or engaged to be married, separated, divorced, de facto partners (whether of the same or different gender), couples promised to each other under cultural tradition or who are dating.
Family relationships includes people who are related to one another through blood, marriage or de facto partnerships, adoption and fostering relationships, sibling and extended family relationships; people living or having lived in the same household; and kinship ties in Aboriginal communities. People living in the same residential care facility and people reliant on care may also be considered to be in a domestic relationship as their relationships exhibit family like dynamics.
For all referrals, female and male, 59 per cent (n=27,440) are Intimate relationship type (as identified by the Police referrer). See Figure 5 below. There is a higher number and proportion of female referrals relating to Intimate relationship type:
Figure 5: Safer Pathway 2016-17 – Number of referrals by relationship type and gender
942
1,288
870
1,015
3,015
6,359
1,036
1,604
1,611
1,751
5,984
21,081
Non Intimate - Resident in same household
Non Intimate - Sibling/Step Sibling
Non Intimate - Other Relative
Non Intimate - Other
Non Intimate - Child/Parent/Step Parent
Intimate
Female Male
Page 12 Central Referral Point – Data Report 2016-17 Safer Pathway
Saf
er P
athw
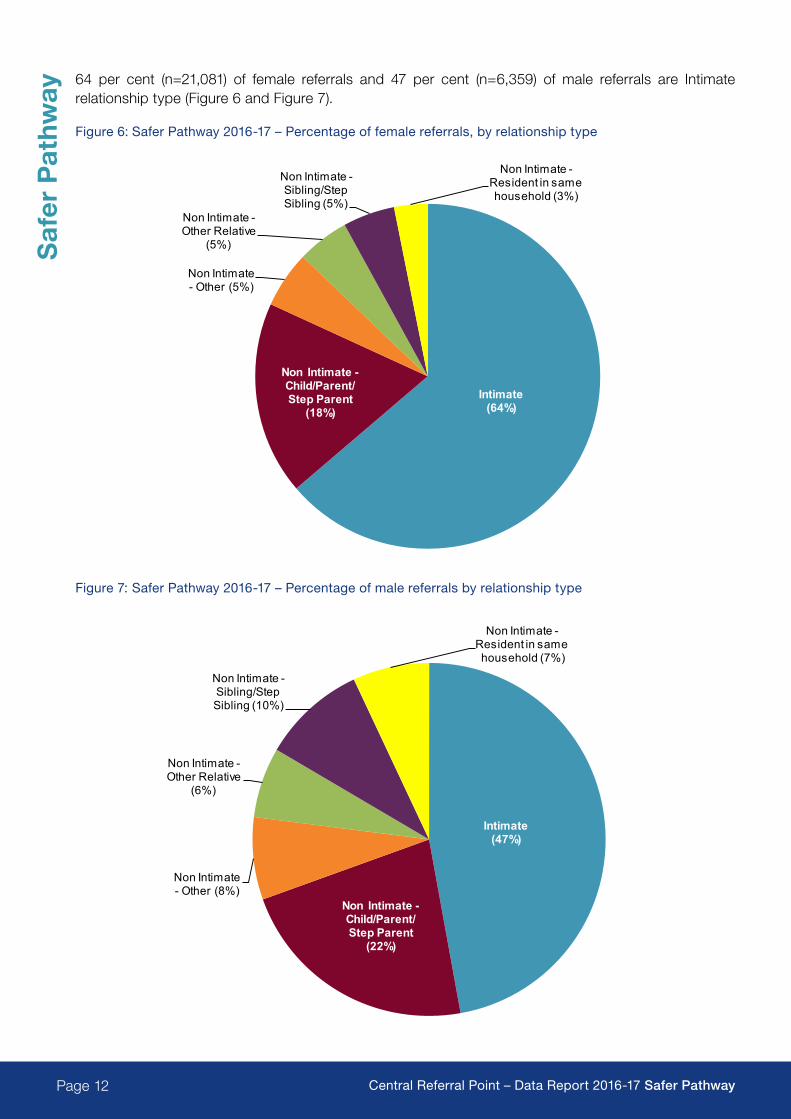
ay64 per cent (n=21,081) of female referrals and 47 per cent (n=6,359) of male referrals are Intimate relationship type (Figure 6 and Figure 7).
Figure 6: Safer Pathway 2016-17 – Percentage of female referrals, by relationship type
Intimate(64%)
Non Intimate -Child/Parent/Step Parent
(18%)
Non Intimate - Other (5%)
Non Intimate -Other Relative
(5%)
Non Intimate -Sibling/Step Sibling (5%)
Non Intimate -Resident in same household (3%)
Figure 7: Safer Pathway 2016-17 – Percentage of male referrals by relationship type
Intimate(47%)
Non Intimate -Child/Parent/Step Parent
(22%)
Non Intimate - Other (8%)
Non Intimate -Other Relative
(6%)
Non Intimate -Sibling/Step Sibling (10%)
Non Intimate -Resident in same household (7%)
Page 13Central Referral Point – Data Report 2016-17 Safer Pathway
Safer P
athway
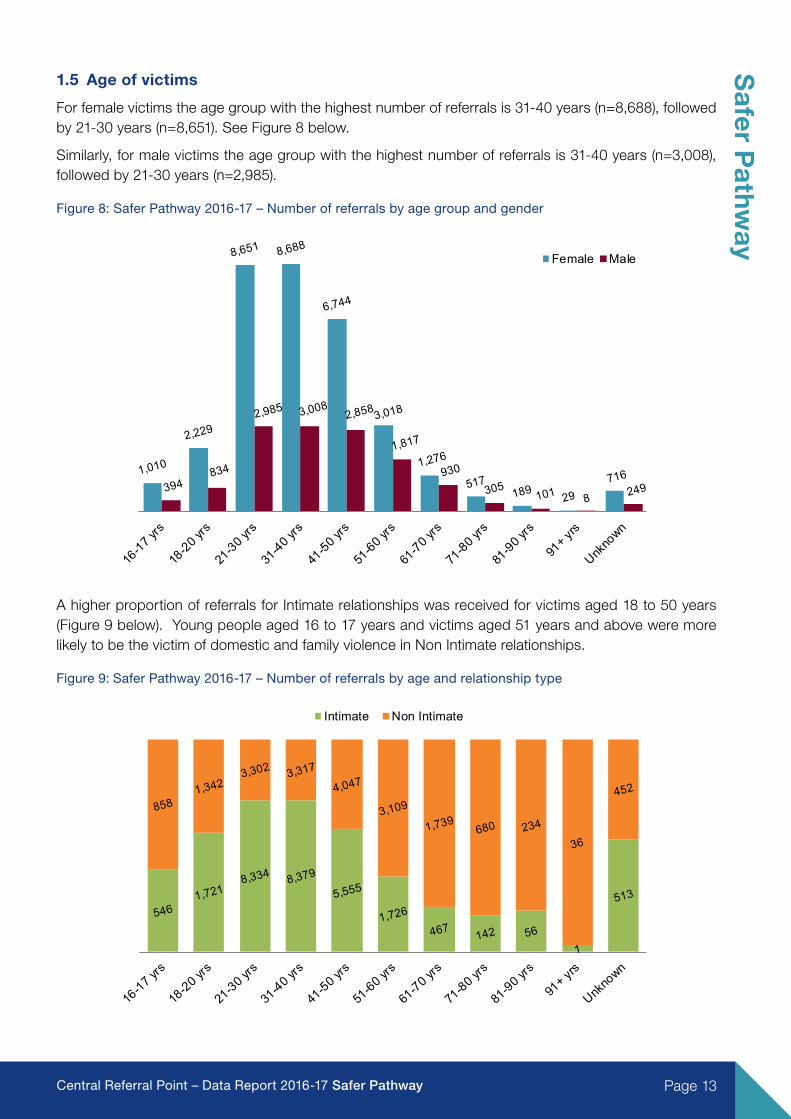
1.5 Age of victims
For female victims the age group with the highest number of referrals is 31-40 years (n=8,688), followed by 21-30 years (n=8,651). See Figure 8 below.
Similarly, for male victims the age group with the highest number of referrals is 31-40 years (n=3,008), followed by 21-30 years (n=2,985).
Figure 8: Safer Pathway 2016-17 – Number of referrals by age group and gender
Female Male
A higher proportion of referrals for Intimate relationships was received for victims aged 18 to 50 years (Figure 9 below). Young people aged 16 to 17 years and victims aged 51 years and above were more likely to be the victim of domestic and family violence in Non Intimate relationships.
Figure 9: Safer Pathway 2016-17 – Number of referrals by age and relationship type
Intimate Non Intimate
Page 14 Central Referral Point – Data Report 2016-17 Safer Pathway
Saf
er P
athw
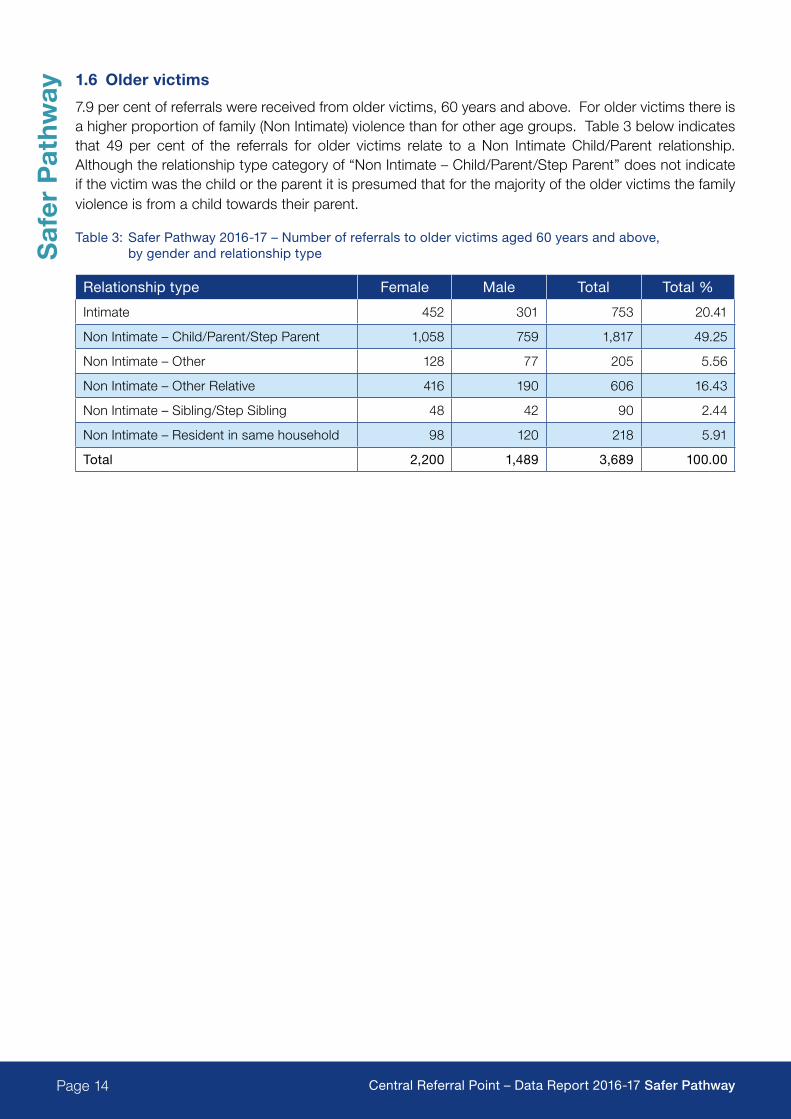
ay1.6 Older victims
7.9 per cent of referrals were received from older victims, 60 years and above. For older victims there is a higher proportion of family (Non Intimate) violence than for other age groups. Table 3 below indicates that 49 per cent of the referrals for older victims relate to a Non Intimate Child/Parent relationship. Although the relationship type category of “Non Intimate – Child/Parent/Step Parent” does not indicate if the victim was the child or the parent it is presumed that for the majority of the older victims the family violence is from a child towards their parent.
Table 3: Safer Pathway 2016-17 – Number of referrals to older victims aged 60 years and above, by gender and relationship type
Relationship type Female Male Total Total %
Intimate 452 301 753 20.41
Non Intimate – Child/Parent/Step Parent 1,058 759 1,817 49.25
Non Intimate – Other 128 77 205 5.56
Non Intimate – Other Relative 416 190 606 16.43
Non Intimate – Sibling/Step Sibling 48 42 90 2.44
Non Intimate – Resident in same household 98 120 218 5.91
Total 2,200 1,489 3,689 100.00
Page 15Central Referral Point – Data Report 2016-17 Safer Pathway
Safer P
athway
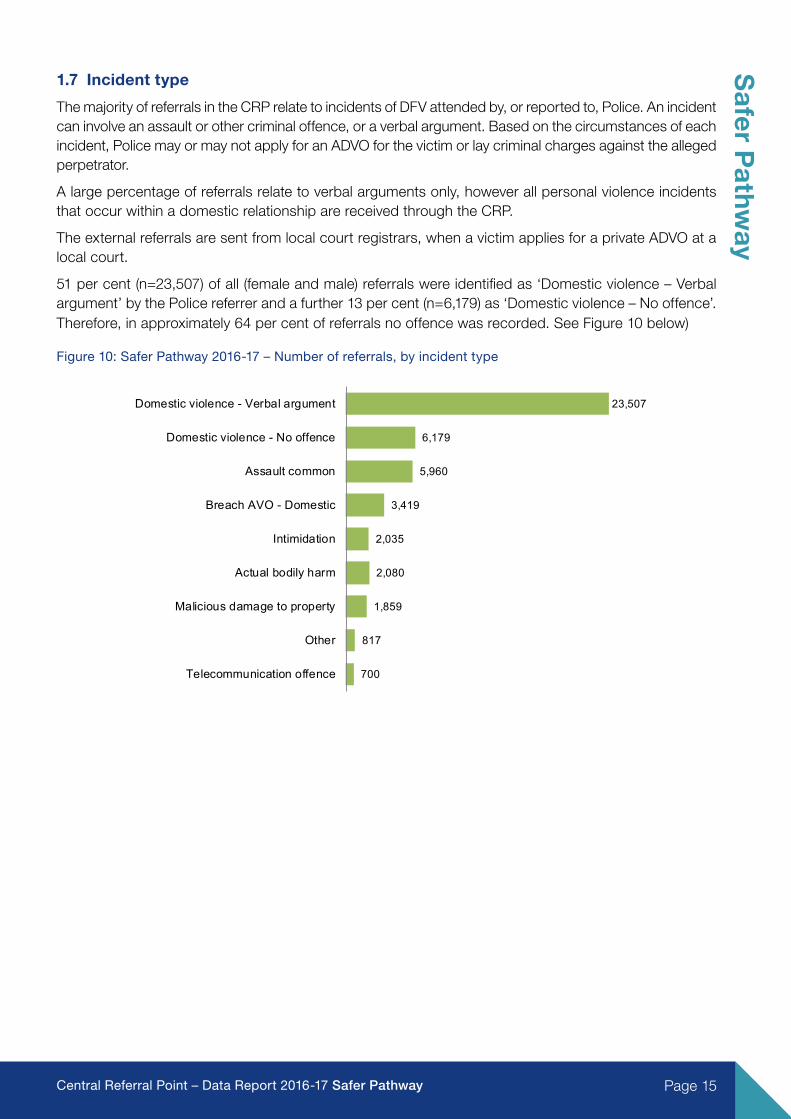
1.7 Incident type
The majority of referrals in the CRP relate to incidents of DFV attended by, or reported to, Police. An incident can involve an assault or other criminal offence, or a verbal argument. Based on the circumstances of each incident, Police may or may not apply for an ADVO for the victim or lay criminal charges against the alleged perpetrator.
A large percentage of referrals relate to verbal arguments only, however all personal violence incidents that occur within a domestic relationship are received through the CRP.
The external referrals are sent from local court registrars, when a victim applies for a private ADVO at a local court.
51 per cent (n=23,507) of all (female and male) referrals were identified as ‘Domestic violence – Verbal argument’ by the Police referrer and a further 13 per cent (n=6,179) as ‘Domestic violence – No offence’. Therefore, in approximately 64 per cent of referrals no offence was recorded. See Figure 10 below)
Figure 10: Safer Pathway 2016-17 – Number of referrals, by incident type
23,507
6,179
5,960
3,419
2,035
2,080
1,859
817
700
Domestic violence - Verbal argument
Domestic violence - No offence
Assault common
Breach AVO - Domestic
Intimidation
Actual bodily harm
Malicious damage to property
Other
Telecommunication offence
Page 16 Central Referral Point – Data Report 2016-17 Safer Pathway
Saf
er P
athw
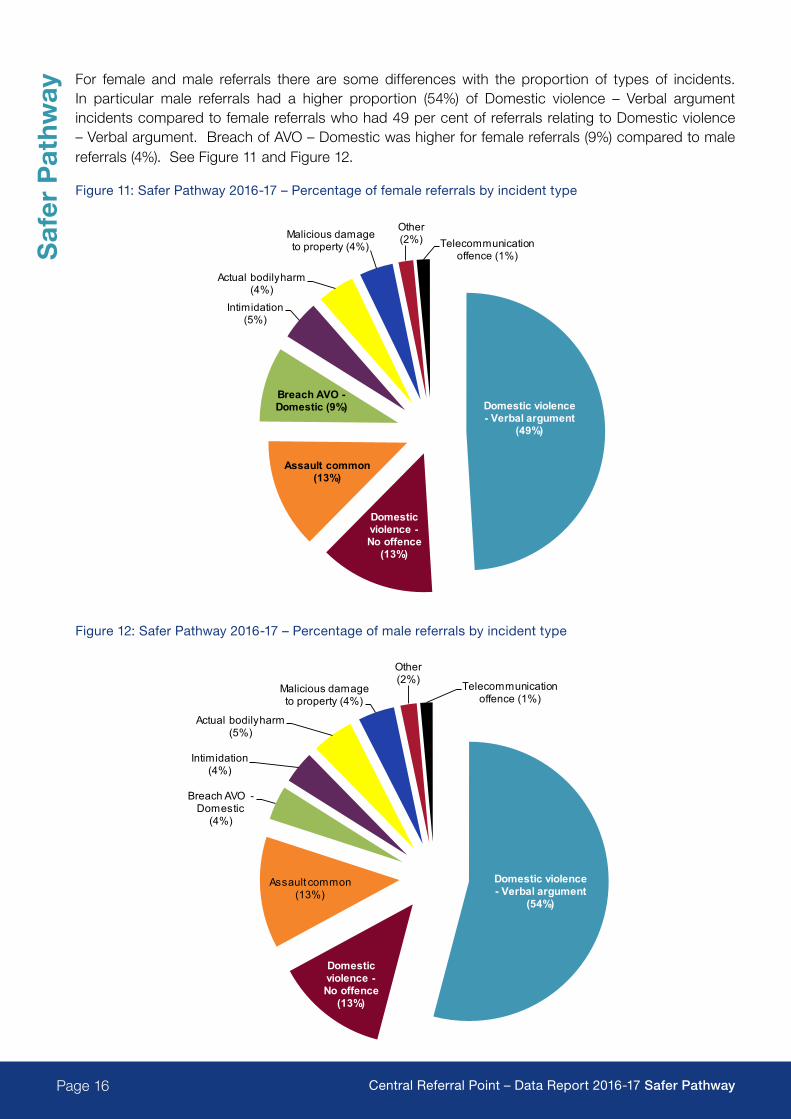
ayFor female and male referrals there are some differences with the proportion of types of incidents. In particular male referrals had a higher proportion (54%) of Domestic violence – Verbal argument incidents compared to female referrals who had 49 per cent of referrals relating to Domestic violence – Verbal argument. Breach of AVO – Domestic was higher for female referrals (9%) compared to male referrals (4%). See Figure 11 and Figure 12.
Figure 11: Safer Pathway 2016-17 – Percentage of female referrals by incident type
Domestic violence - Verbal argument
(49%)
Domestic violence -No offence
(13%)
Assault common(13%)
Breach AVO -Domestic (9%)
Intimidation(5%)
Actual bodily harm(4%)
Malicious damage to property (4%)
Other(2%) Telecommunication
offence (1%)
Figure 12: Safer Pathway 2016-17 – Percentage of male referrals by incident type
Domestic violence - Verbal argument
(54%)
Domestic violence -No offence
(13%)
Assault common(13%)
Breach AVO -Domestic
(4%)
Intimidation(4%)
Actual bodily harm(5%)
Malicious damage to property (4%)
Other(2%) Telecommunication
offence (1%)
1.8 Referrals by Local Area Commands (LAC)
Page 17Central Referral Point – Data Report 2016-17 Safer Pathway
Safer P
athway
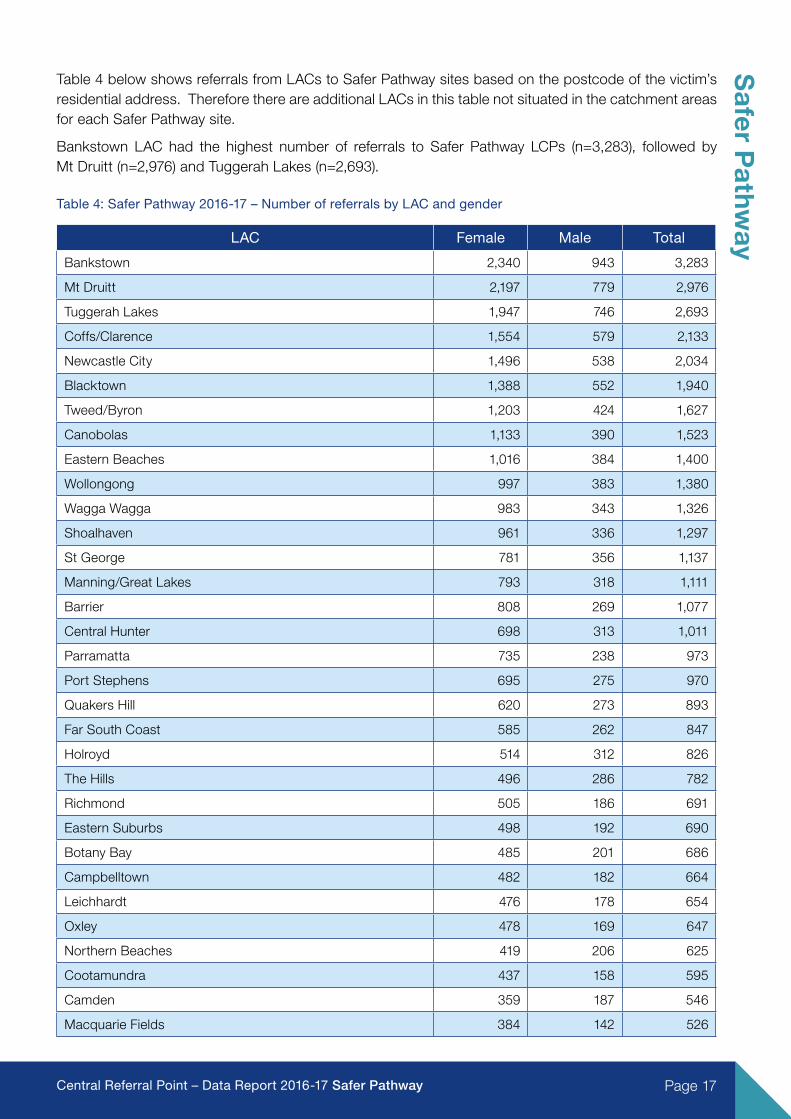
Table 4 below shows referrals from LACs to Safer Pathway sites based on the postcode of the victim’s residential address. Therefore there are additional LACs in this table not situated in the catchment areas for each Safer Pathway site.
Bankstown LAC had the highest number of referrals to Safer Pathway LCPs (n=3,283), followed by Mt Druitt (n=2,976) and Tuggerah Lakes (n=2,693).
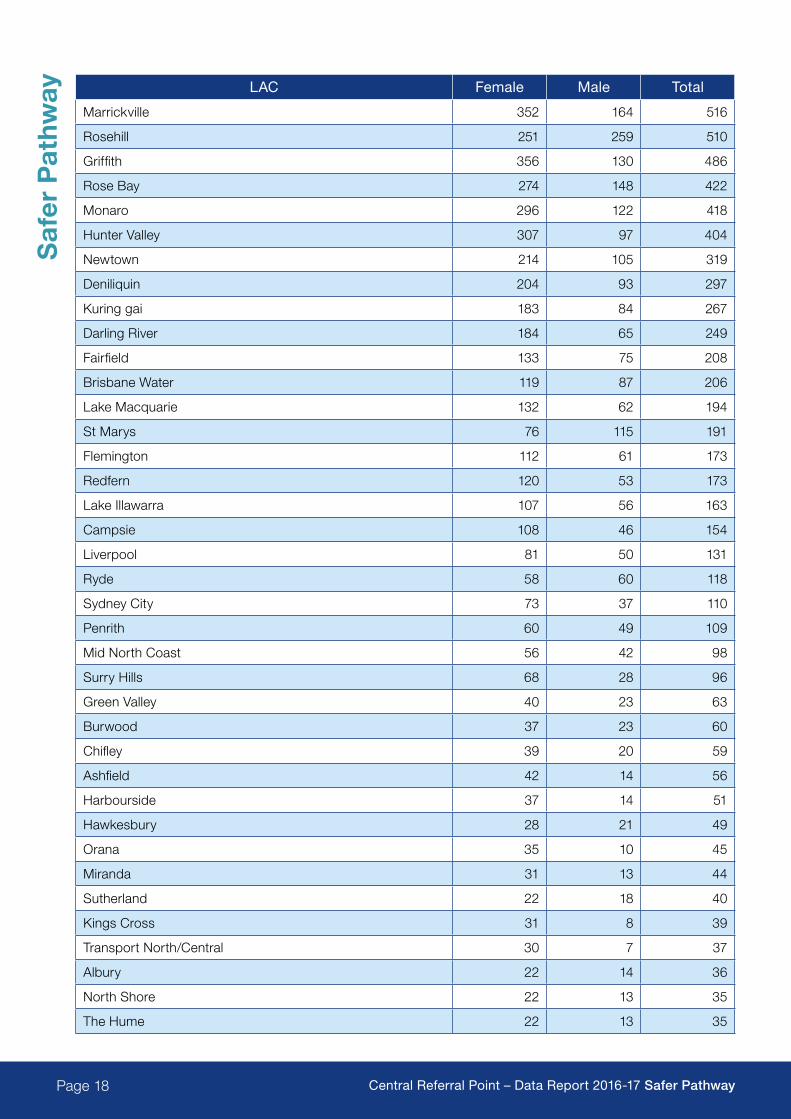
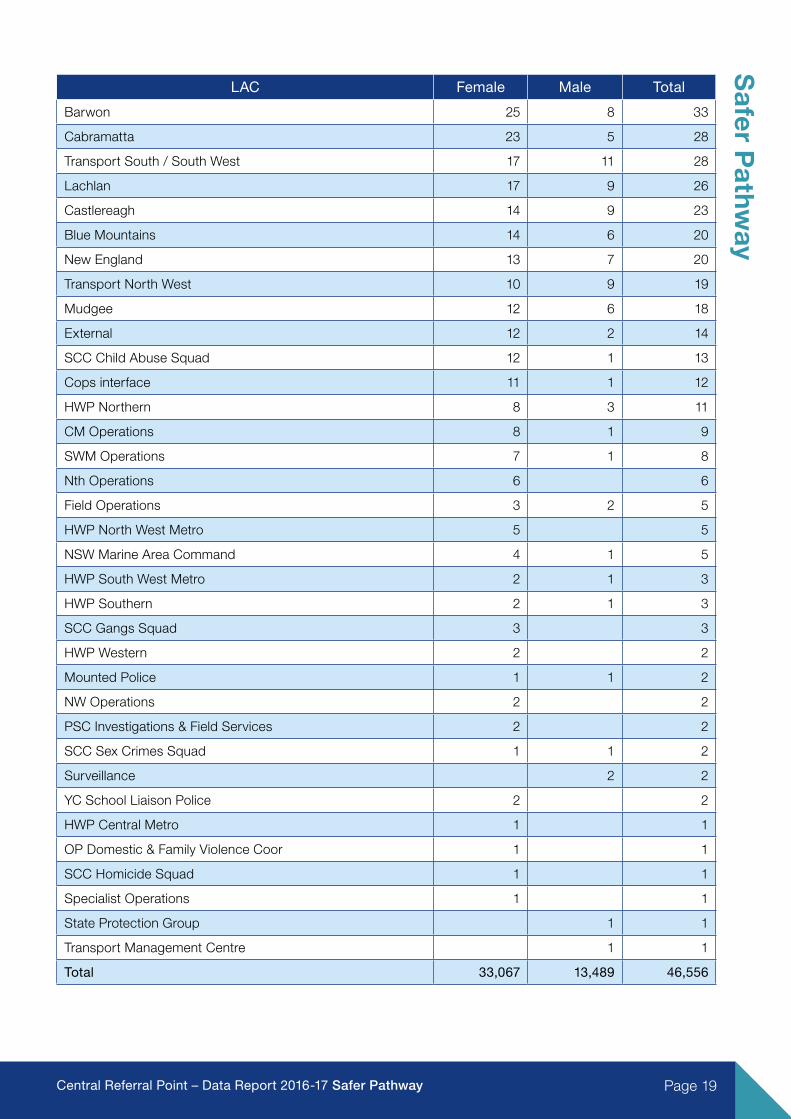
Table 4: Safer Pathway 2016-17 – Number of referrals by LAC and gender
LAC Female Male Total
Bankstown 2,340 943 3,283
Mt Druitt 2,197 779 2,976
Tuggerah Lakes 1,947 746 2,693
Coffs/Clarence 1,554 579 2,133
Newcastle City 1,496 538 2,034
Blacktown 1,388 552 1,940
Tweed/Byron 1,203 424 1,627
Canobolas 1,133 390 1,523
Eastern Beaches 1,016 384 1,400
Wollongong 997 383 1,380
Wagga Wagga 983 343 1,326
Shoalhaven 961 336 1,297
St George 781 356 1,137
Manning/Great Lakes 793 318 1,111
Barrier 808 269 1,077
Central Hunter 698 313 1,011
Parramatta 735 238 973
Port Stephens 695 275 970
Quakers Hill 620 273 893
Far South Coast 585 262 847
Holroyd 514 312 826
The Hills 496 286 782
Richmond 505 186 691
Eastern Suburbs 498 192 690
Botany Bay 485 201 686
Campbelltown 482 182 664
Leichhardt 476 178 654
Oxley 478 169 647
Northern Beaches 419 206 625
Cootamundra 437 158 595
Camden 359 187 546
Macquarie Fields 384 142 526
Page 18 Central Referral Point – Data Report 2016-17 Safer Pathway
Saf
er P
athw
ay LAC Female Male Total
Marrickville 352 164 516
Rosehill 251 259 510
Griffith 356 130 486
Rose Bay 274 148 422
Monaro 296 122 418
Hunter Valley 307 97 404
Newtown 214 105 319
Deniliquin 204 93 297
Kuring gai 183 84 267
Darling River 184 65 249
Fairfield 133 75 208
Brisbane Water 119 87 206
Lake Macquarie 132 62 194
St Marys 76 115 191
Flemington 112 61 173
Redfern 120 53 173
Lake Illawarra 107 56 163
Campsie 108 46 154
Liverpool 81 50 131
Ryde 58 60 118
Sydney City 73 37 110
Penrith 60 49 109
Mid North Coast 56 42 98
Surry Hills 68 28 96
Green Valley 40 23 63
Burwood 37 23 60
Chifley 39 20 59
Ashfield 42 14 56
Harbourside 37 14 51
Hawkesbury 28 21 49
Orana 35 10 45
Miranda 31 13 44
Sutherland 22 18 40
Kings Cross 31 8 39
Transport North/Central 30 7 37
Albury 22 14 36
North Shore 22 13 35
The Hume 22 13 35
Page 19Central Referral Point – Data Report 2016-17 Safer Pathway
Safer P
athwayLAC Female Male Total
Barwon 25 8 33
Cabramatta 23 5 28
Transport South / South West 17 11 28
Lachlan 17 9 26
Castlereagh 14 9 23
Blue Mountains 14 6 20
New England 13 7 20
Transport North West 10 9 19
Mudgee 12 6 18
External 12 2 14
SCC Child Abuse Squad 12 1 13
Cops interface 11 1 12
HWP Northern 8 3 11
CM Operations 8 1 9
SWM Operations 7 1 8
Nth Operations 6 6
Field Operations 3 2 5
HWP North West Metro 5 5
NSW Marine Area Command 4 1 5
HWP South West Metro 2 1 3
HWP Southern 2 1 3
SCC Gangs Squad 3 3
HWP Western 2 2
Mounted Police 1 1 2
NW Operations 2 2
PSC Investigations & Field Services 2 2
SCC Sex Crimes Squad 1 1 2
Surveillance 2 2
YC School Liaison Police 2 2
HWP Central Metro 1 1
OP Domestic & Family Violence Coor 1 1
SCC Homicide Squad 1 1
Specialist Operations 1 1
State Protection Group 1 1
Transport Management Centre 1 1
Total 33,067 13,489 46,556
Page 20 Central Referral Point – Data Report 2016-17 Safer Pathway
Saf
er P
athw
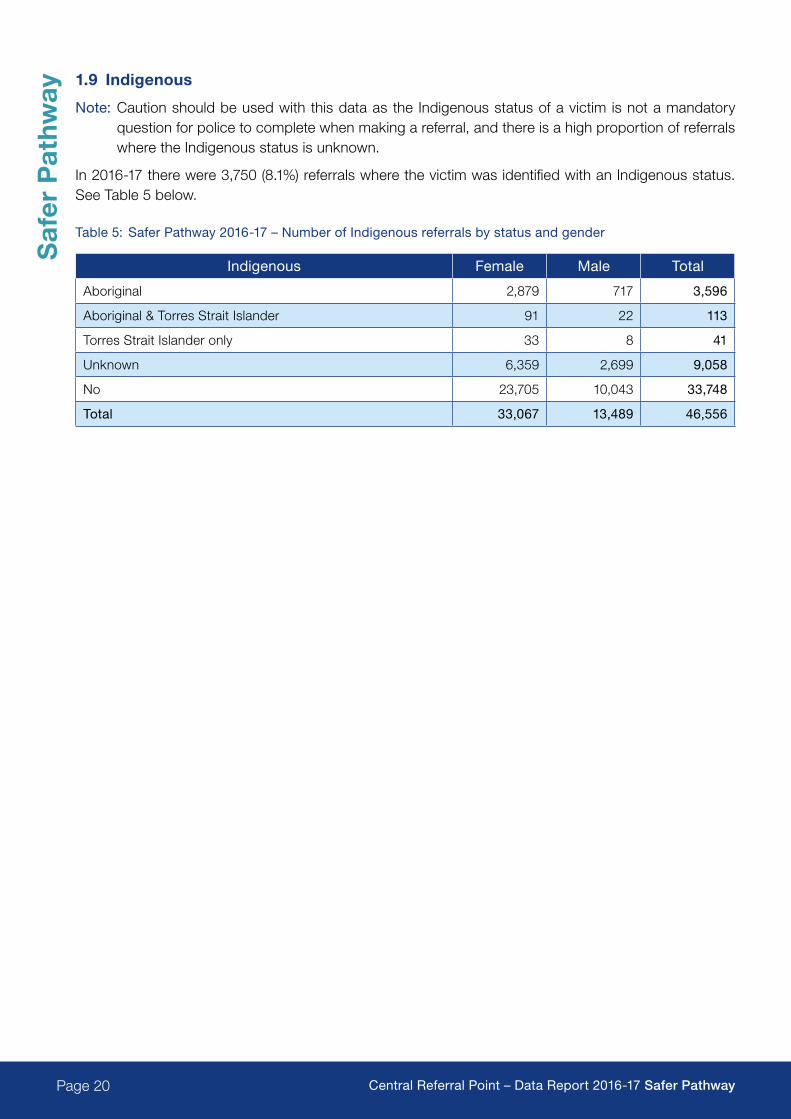
ay1.9 Indigenous
Note: Caution should be used with this data as the Indigenous status of a victim is not a mandatory question for police to complete when making a referral, and there is a high proportion of referrals where the Indigenous status is unknown.
In 2016-17 there were 3,750 (8.1%) referrals where the victim was identified with an Indigenous status. See Table 5 below.
Table 5: Safer Pathway 2016-17 – Number of Indigenous referrals by status and gender
Indigenous Female Male Total
Aboriginal 2,879 717 3,596
Aboriginal & Torres Strait Islander 91 22 113
Torres Strait Islander only 33 8 41
Unknown 6,359 2,699 9,058
No 23,705 10,043 33,748
Total 33,067 13,489 46,556
Page 21Central Referral Point – Data Report 2016-17 Safer Pathway
Safer P
athway
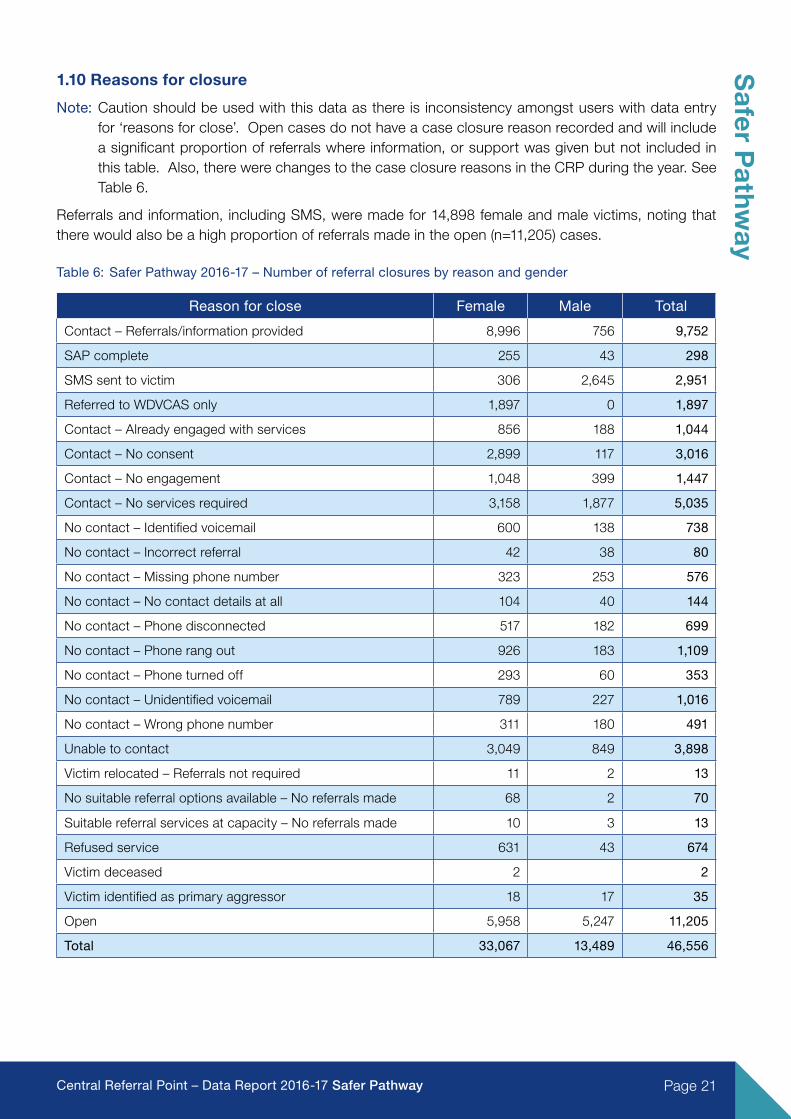
1.10 Reasons for closure
Note: Caution should be used with this data as there is inconsistency amongst users with data entry for ‘reasons for close’. Open cases do not have a case closure reason recorded and will include a significant proportion of referrals where information, or support was given but not included in this table. Also, there were changes to the case closure reasons in the CRP during the year. See Table 6.
Referrals and information, including SMS, were made for 14,898 female and male victims, noting that there would also be a high proportion of referrals made in the open (n=11,205) cases.
Table 6: Safer Pathway 2016-17 – Number of referral closures by reason and gender
Reason for close Female Male Total
Contact – Referrals/information provided 8,996 756 9,752
SAP complete 255 43 298
SMS sent to victim 306 2,645 2,951
Referred to WDVCAS only 1,897 0 1,897
Contact – Already engaged with services 856 188 1,044
Contact – No consent 2,899 117 3,016
Contact – No engagement 1,048 399 1,447
Contact – No services required 3,158 1,877 5,035
No contact – Identified voicemail 600 138 738
No contact – Incorrect referral 42 38 80
No contact – Missing phone number 323 253 576
No contact – No contact details at all 104 40 144
No contact – Phone disconnected 517 182 699
No contact – Phone rang out 926 183 1,109
No contact – Phone turned off 293 60 353
No contact – Unidentified voicemail 789 227 1,016
No contact – Wrong phone number 311 180 491
Unable to contact 3,049 849 3,898
Victim relocated – Referrals not required 11 2 13
No suitable referral options available – No referrals made 68 2 70
Suitable referral services at capacity – No referrals made 10 3 13
Refused service 631 43 674
Victim deceased 2 2
Victim identified as primary aggressor 18 17 35
Open 5,958 5,247 11,205
Total 33,067 13,489 46,556
Page 22 Central Referral Point – Data Report 2016-17 Non-Safer Pathway
No
n-S
afer
Pat
hway
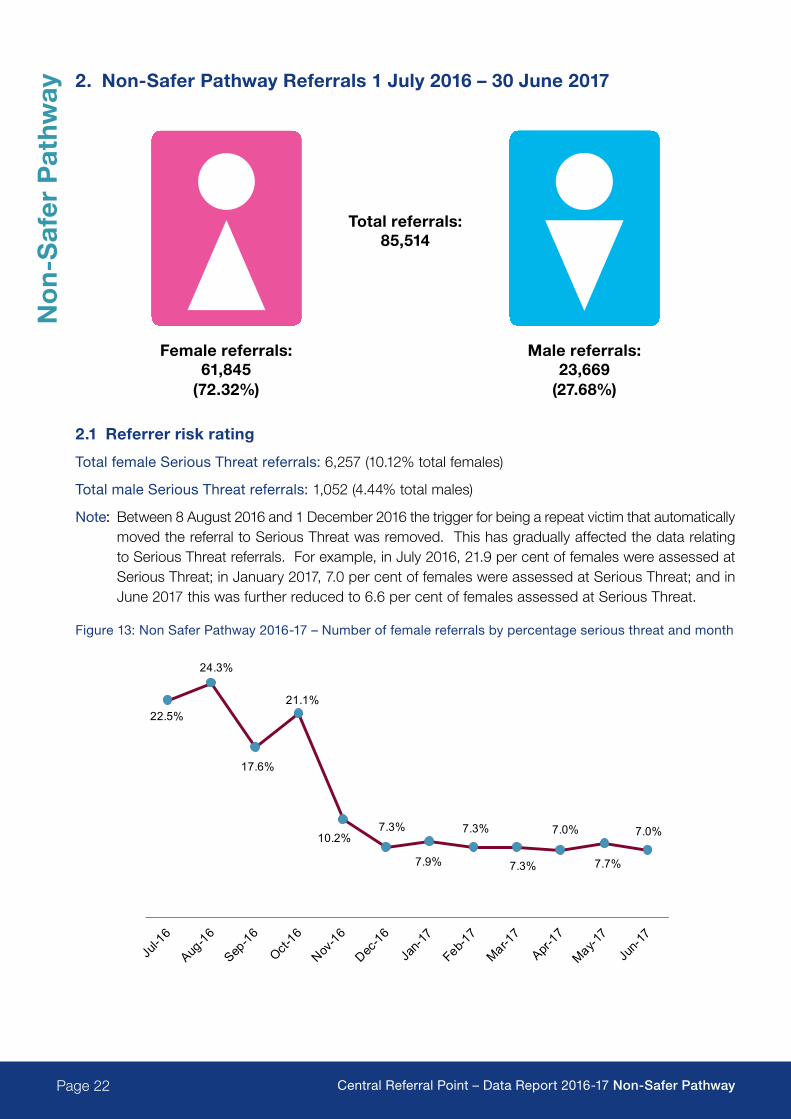
2. Non-Safer Pathway Referrals 1 July 2016 – 30 June 2017
Total referrals: 85,514
Female referrals: Male referrals: 61,845 23,669 (72.32%) (27.68%)
2.1 Referrer risk rating
Total female Serious Threat referrals: 6,257 (10.12% total females)
Total male Serious Threat referrals: 1,052 (4.44% total males)
Note: Between 8 August 2016 and 1 December 2016 the trigger for being a repeat victim that automatically moved the referral to Serious Threat was removed. This has gradually affected the data relating to Serious Threat referrals. For example, in July 2016, 21.9 per cent of females were assessed at Serious Threat; in January 2017, 7.0 per cent of females were assessed at Serious Threat; and in June 2017 this was further reduced to 6.6 per cent of females assessed at Serious Threat.
Figure 13: Non Safer Pathway 2016-17 – Number of female referrals by percentage serious threat and month
22.5%
24.3%
17.6%
21.1%
10.2%7.3%
7.9%
7.3%
7.3%
7.0%
7.7%
7.0%
Page 23Central Referral Point – Data Report 2016-17 Non-Safer Pathway
No
n-S
afer Pathw
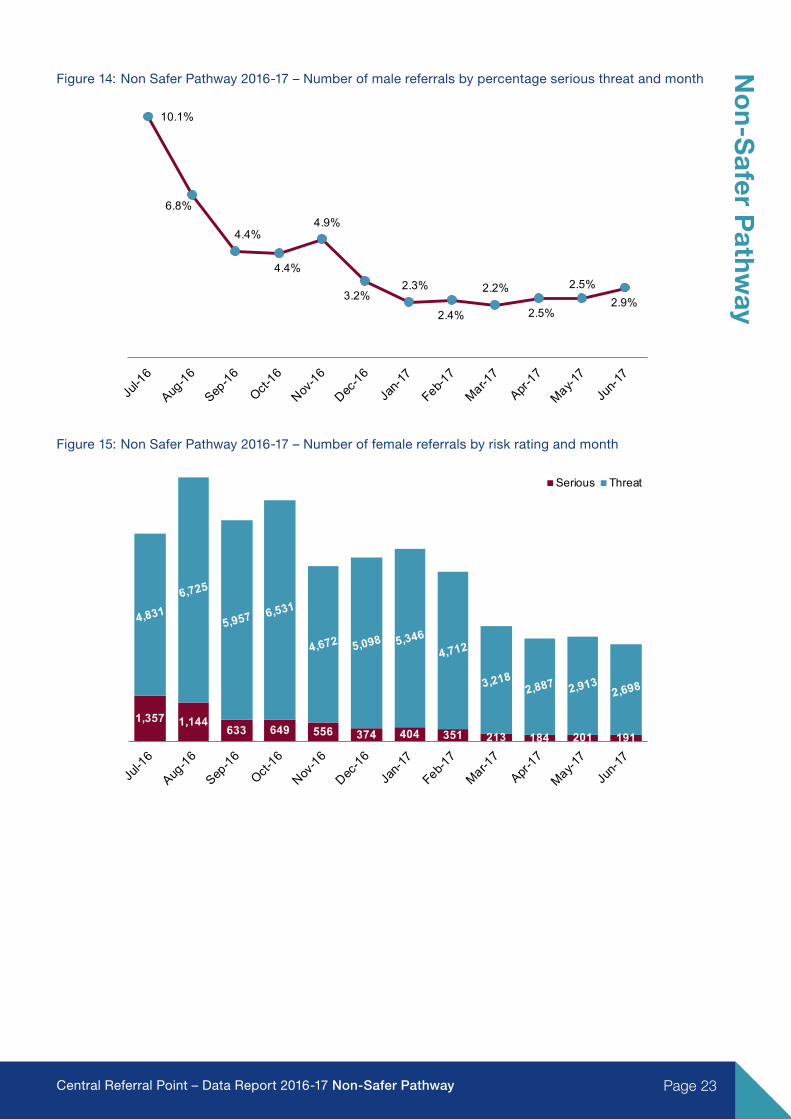
ayFigure 14: Non Safer Pathway 2016-17 – Number of male referrals by percentage serious threat and month
10.1%
6.8%
4.4%
4.4%
4.9%
3.2%2.3%
2.4%
2.2%
2.5%
2.5%2.9%
Figure 15: Non Safer Pathway 2016-17 – Number of female referrals by risk rating and month
1,357 1,144633 649 556 374 404 351 213 184 201 191
Serious Threat
Page 24 Central Referral Point – Data Report 2016-17 Non-Safer Pathway
No
n-S
afer
Pat
hway
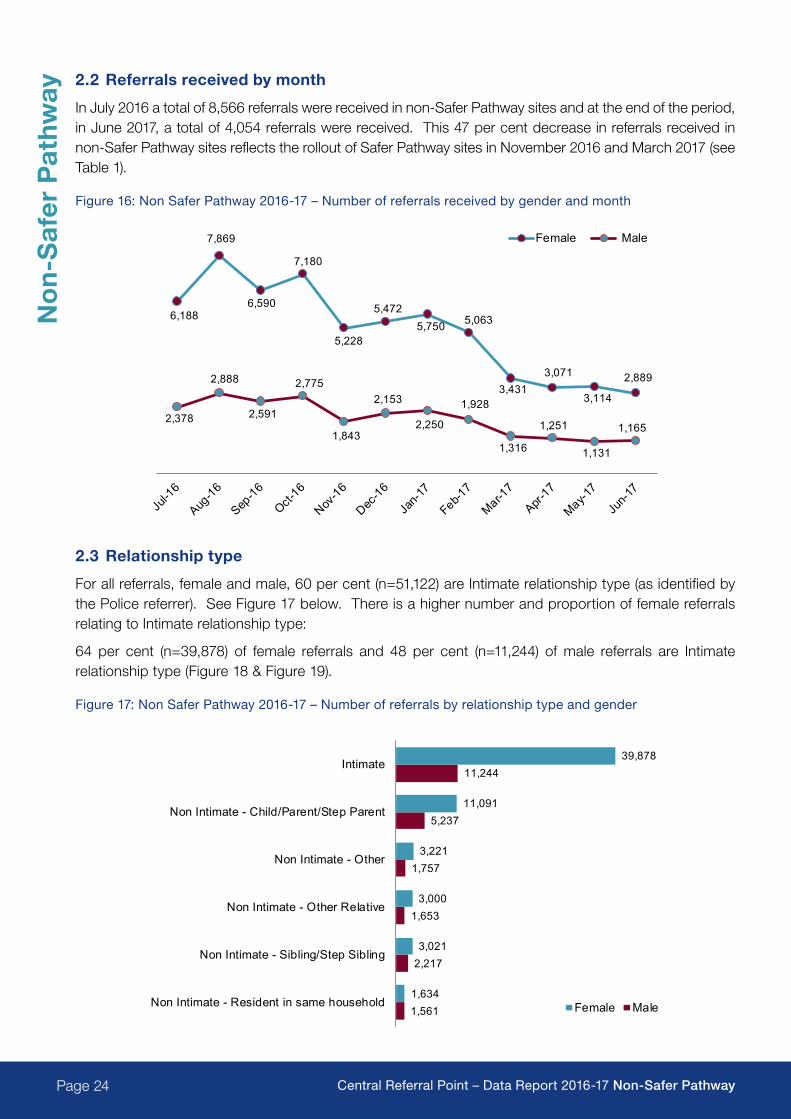
2.2 Referrals received by month
In July 2016 a total of 8,566 referrals were received in non-Safer Pathway sites and at the end of the period, in June 2017, a total of 4,054 referrals were received. This 47 per cent decrease in referrals received in non-Safer Pathway sites reflects the rollout of Safer Pathway sites in November 2016 and March 2017 (see Table 1).
Figure 16: Non Safer Pathway 2016-17 – Number of referrals received by gender and month
6,188
7,869
6,590
7,180
5,228
5,4725,750 5,063
3,4313,071
3,114
2,889
2,378
2,888
2,591
2,775
1,843
2,153
2,250
1,928
1,316
1,251
1,131
1,165
Female Male
2.3 Relationship type
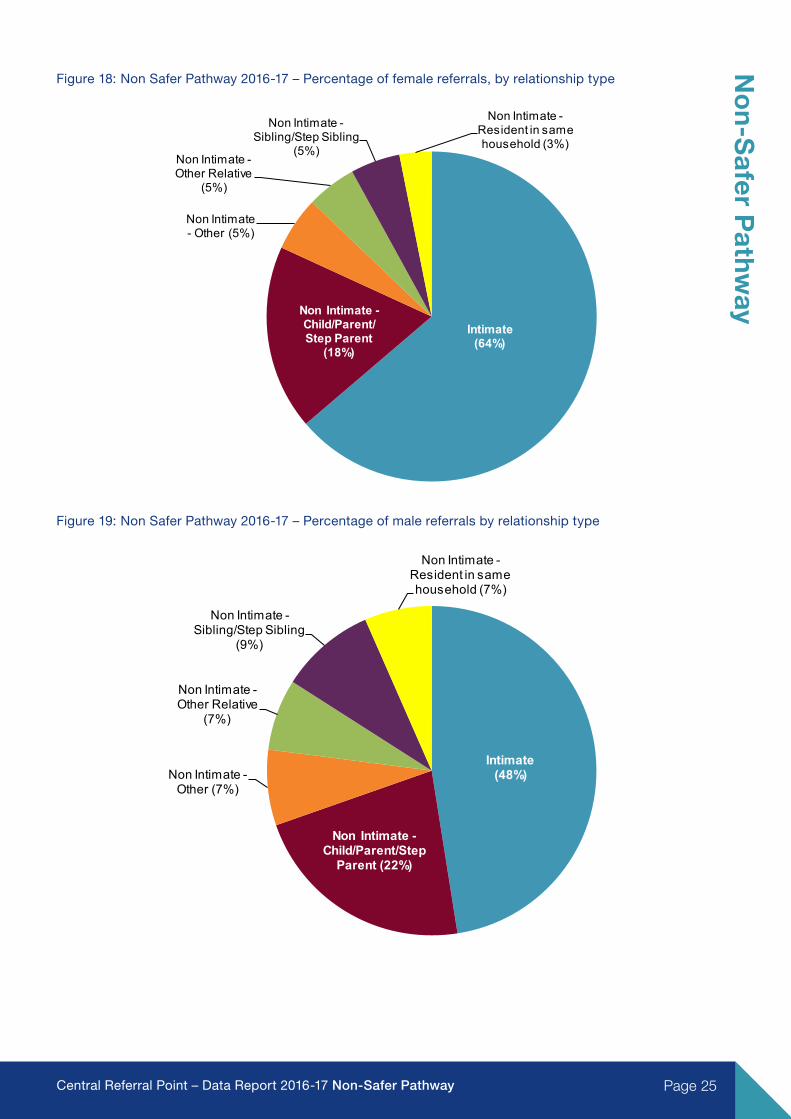
For all referrals, female and male, 60 per cent (n=51,122) are Intimate relationship type (as identified by the Police referrer). See Figure 17 below. There is a higher number and proportion of female referrals relating to Intimate relationship type:
64 per cent (n=39,878) of female referrals and 48 per cent (n=11,244) of male referrals are Intimate relationship type (Figure 18 & Figure 19).
Figure 17: Non Safer Pathway 2016-17 – Number of referrals by relationship type and gender
1,561
2,217
1,653
1,757
5,237
11,244
1,634
3,021
3,000
3,221
11,091
39,878
Non Intimate - Resident in same household
Non Intimate - Sibling/Step Sibling
Non Intimate - Other Relative
Non Intimate - Other
Non Intimate - Child/Parent/Step Parent
Intimate
Female Male
Page 25Central Referral Point – Data Report 2016-17 Non-Safer Pathway
No
n-S
afer Pathw
ayFigure 18: Non Safer Pathway 2016-17 – Percentage of female referrals, by relationship type
Intimate(64%)
Non Intimate -Child/Parent/Step Parent
(18%)
Non Intimate - Other (5%)
Non Intimate -Other Relative
(5%)
Non Intimate -Sibling/Step Sibling
(5%)
Non Intimate -Resident in same household (3%)
Figure 19: Non Safer Pathway 2016-17 – Percentage of male referrals by relationship type
Intimate(48%)
Non Intimate -Child/Parent/Step
Parent (22%)
Non Intimate -Other (7%)
Non Intimate -Other Relative
(7%)
Non Intimate -Sibling/Step Sibling
(9%)
Non Intimate -Resident in same household (7%)
Page 26 Central Referral Point – Data Report 2016-17 Non-Safer Pathway
No
n-S
afer
Pat
hway
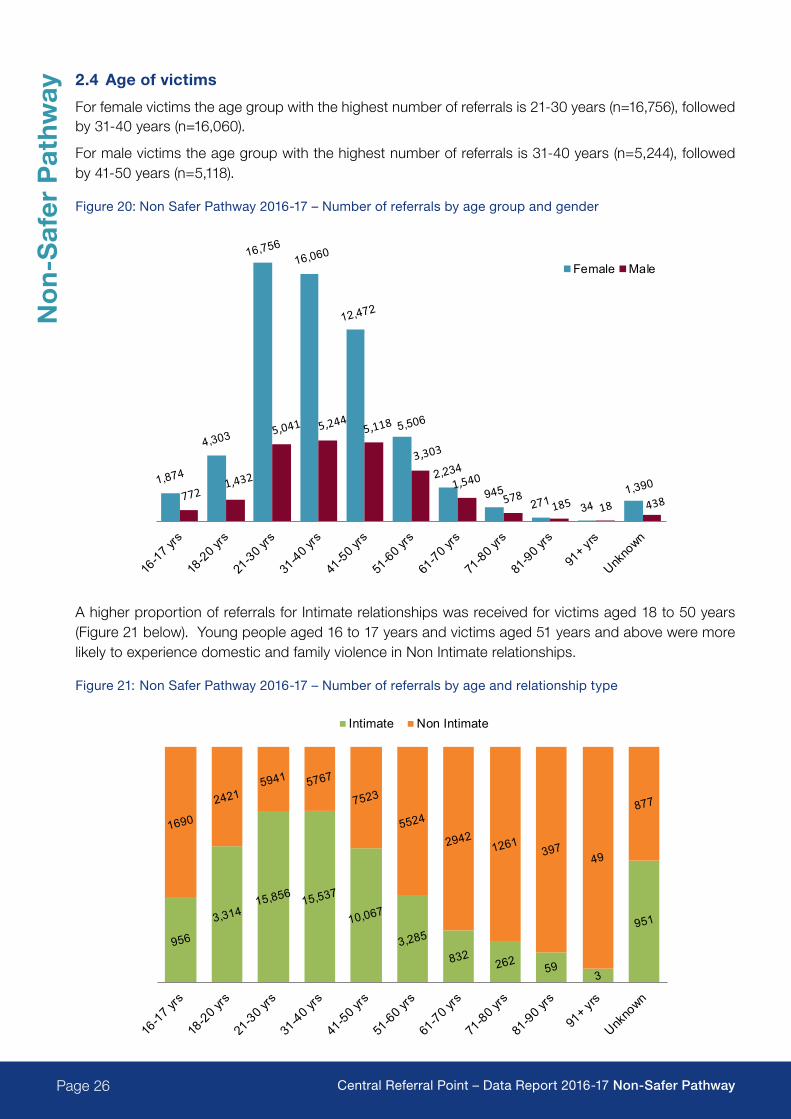
2.4 Age of victims
For female victims the age group with the highest number of referrals is 21-30 years (n=16,756), followed by 31-40 years (n=16,060).
For male victims the age group with the highest number of referrals is 31-40 years (n=5,244), followed by 41-50 years (n=5,118).
Figure 20: Non Safer Pathway 2016-17 – Number of referrals by age group and gender
Female Male
A higher proportion of referrals for Intimate relationships was received for victims aged 18 to 50 years (Figure 21 below). Young people aged 16 to 17 years and victims aged 51 years and above were more likely to experience domestic and family violence in Non Intimate relationships.
Figure 21: Non Safer Pathway 2016-17 – Number of referrals by age and relationship type
Intimate Non Intimate
Page 27Central Referral Point – Data Report 2016-17 Non-Safer Pathway
No
n-S
afer Pathw
ay2.5 Older victims
7.5 per cent of referrals were received from older victims, 60 years and above (see Table 7). For older victims there is a higher proportion of family (Non Intimate) violence than for other age groups. Figure 22 below indicates that 48 per cent of the referrals for older victims relate to a Non Intimate Child/Parent relationship. Although the relationship type category of “Non Intimate – Child/Parent/Step parent” does not indicate if the victim was the child or the parent it is presumed that for the majority of the older victims the family violence is from a child towards their parent.
Table 7: Non Safer Pathway 2016-17 – Number of referrals of older victims aged 60 years and above, by relationship type and gender
Relationship type Female Male Total Total %
Intimate 817 524 1,341 20.91
Non Intimate – Child/Parent/Step Parent 1,813 1,252 3,065 47.79
Non Intimate – Other 217 170 387 6.03
Non Intimate – Other Relative 721 334 1,055 16.45
Non Intimate – Sibling/Step Sibling 128 77 205 3.20
Non Intimate – Resident in same household 160 201 361 5.63
Total 3,856 2,558 6,414 100.00
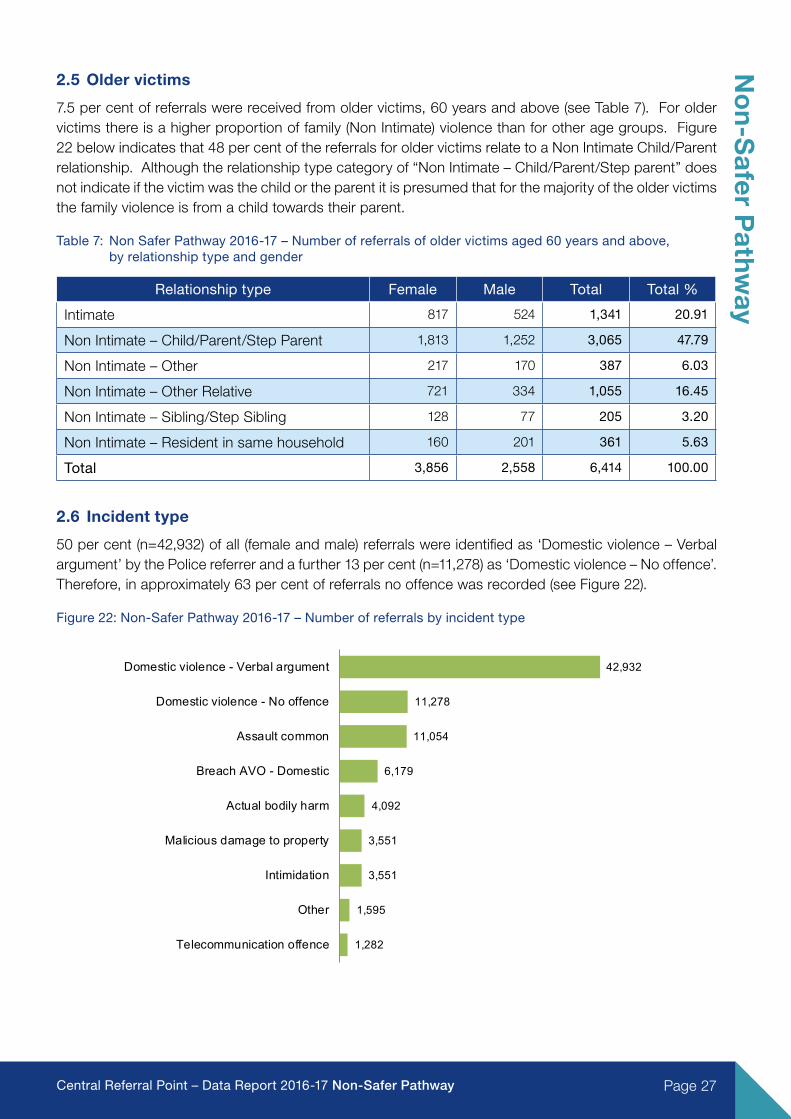
2.6 Incident type
50 per cent (n=42,932) of all (female and male) referrals were identified as ‘Domestic violence – Verbal argument’ by the Police referrer and a further 13 per cent (n=11,278) as ‘Domestic violence – No offence’. Therefore, in approximately 63 per cent of referrals no offence was recorded (see Figure 22).
Figure 22: Non-Safer Pathway 2016-17 – Number of referrals by incident type
42,932
11,278
11,054
6,179
4,092
3,551
3,551
1,595
1,282
Domestic violence - Verbal argument
Domestic violence - No offence
Assault common
Breach AVO - Domestic
Actual bodily harm
Malicious damage to property
Intimidation
Other
Telecommunication offence
Page 28 Central Referral Point – Data Report 2016-17 Non-Safer Pathway
No
n-S
afer
Pat
hway
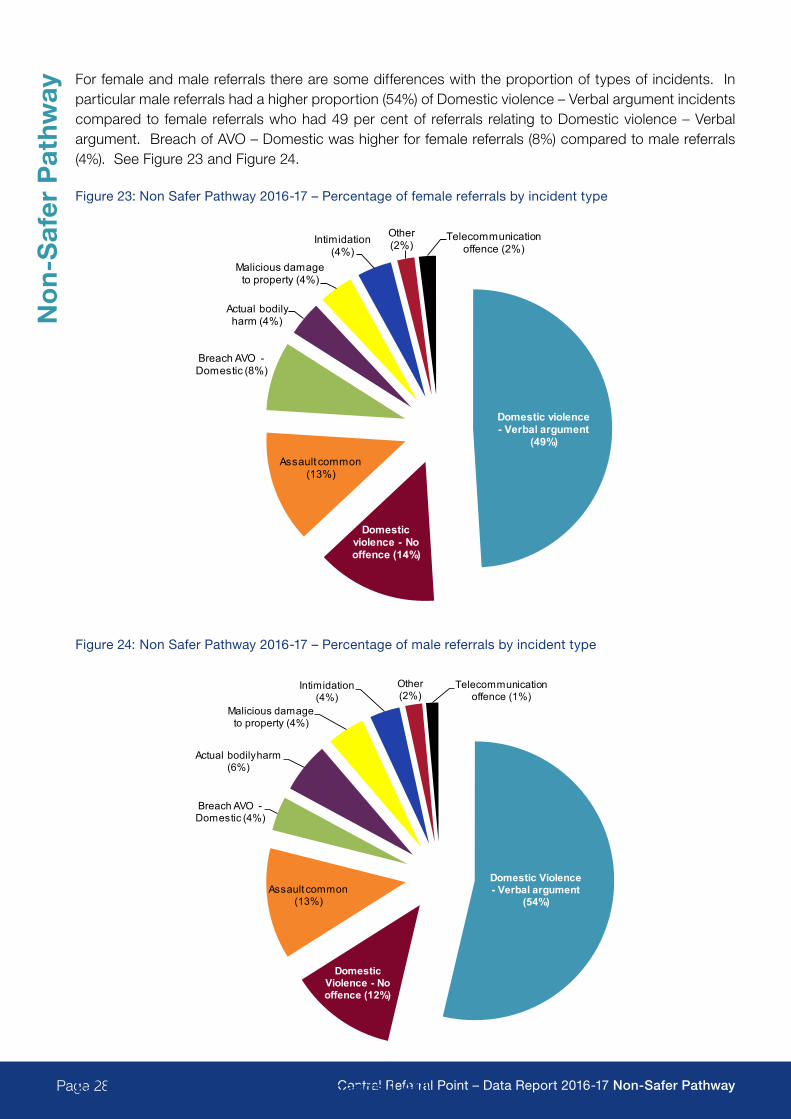
For female and male referrals there are some differences with the proportion of types of incidents. In particular male referrals had a higher proportion (54%) of Domestic violence – Verbal argument incidents compared to female referrals who had 49 per cent of referrals relating to Domestic violence – Verbal argument. Breach of AVO – Domestic was higher for female referrals (8%) compared to male referrals (4%). See Figure 23 and Figure 24.
Figure 23: Non Safer Pathway 2016-17 – Percentage of female referrals by incident type
Domestic violence - Verbal argument
(49%)
Domestic violence - No offence (14%)
Assault common (13%)
Breach AVO -Domestic (8%)
Actual bodily harm (4%)
Malicious damage to property (4%)
Intimidation(4%)
Other (2%)
Telecommunication offence (2%)
Figure 24: Non Safer Pathway 2016-17 – Percentage of male referrals by incident type
Domestic Violence - Verbal argument
(54%)
Domestic Violence - No offence (12%)
Assault common(13%)
Breach AVO -Domestic (4%)
Actual bodily harm(6%)
Malicious damage to property (4%)
Intimidation(4%)
Other(2%)
Telecommunication offence (1%)
2.7 Referrals by Local Area Commands (LAC)
Page 29Central Referral Point – Data Report 2016-17 Non-Safer Pathway
No
n-S
afer Pathw
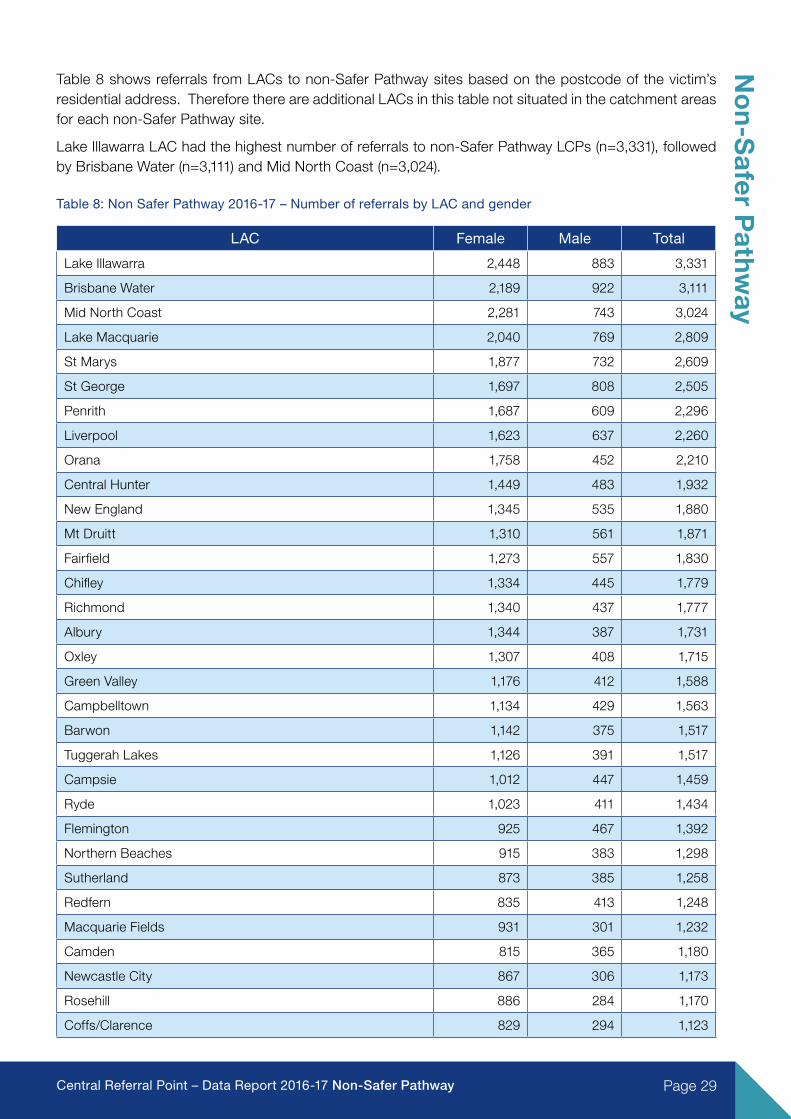
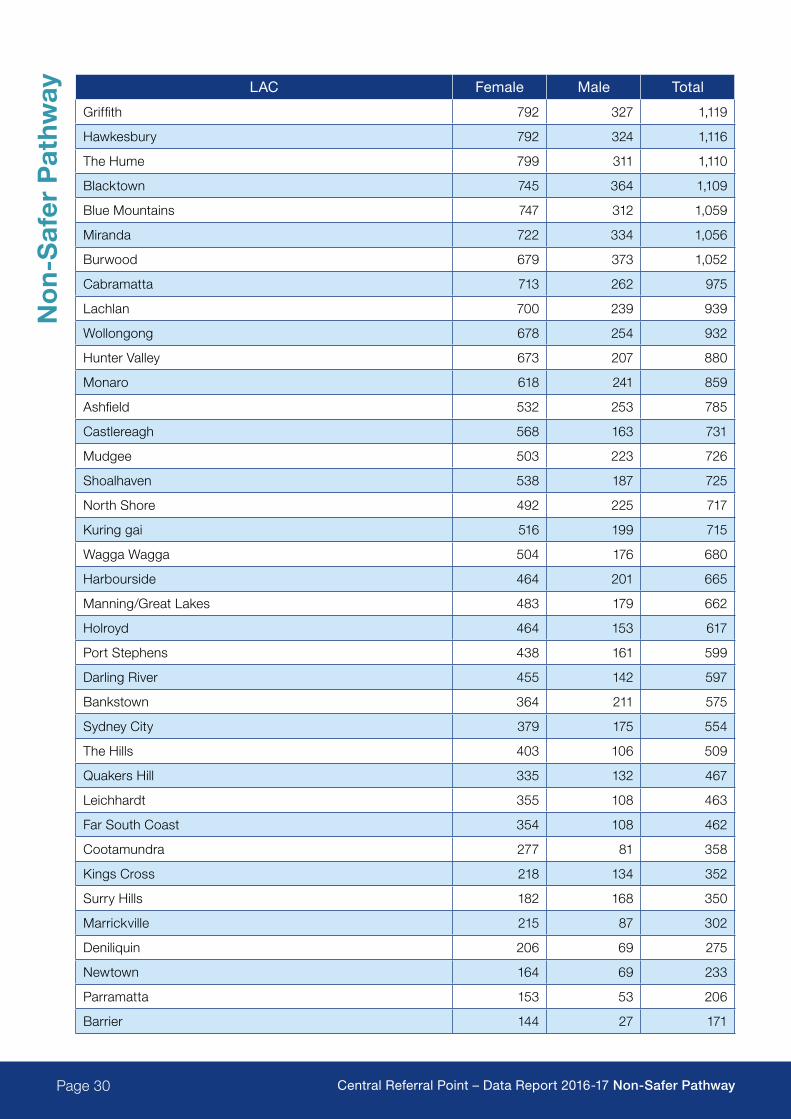
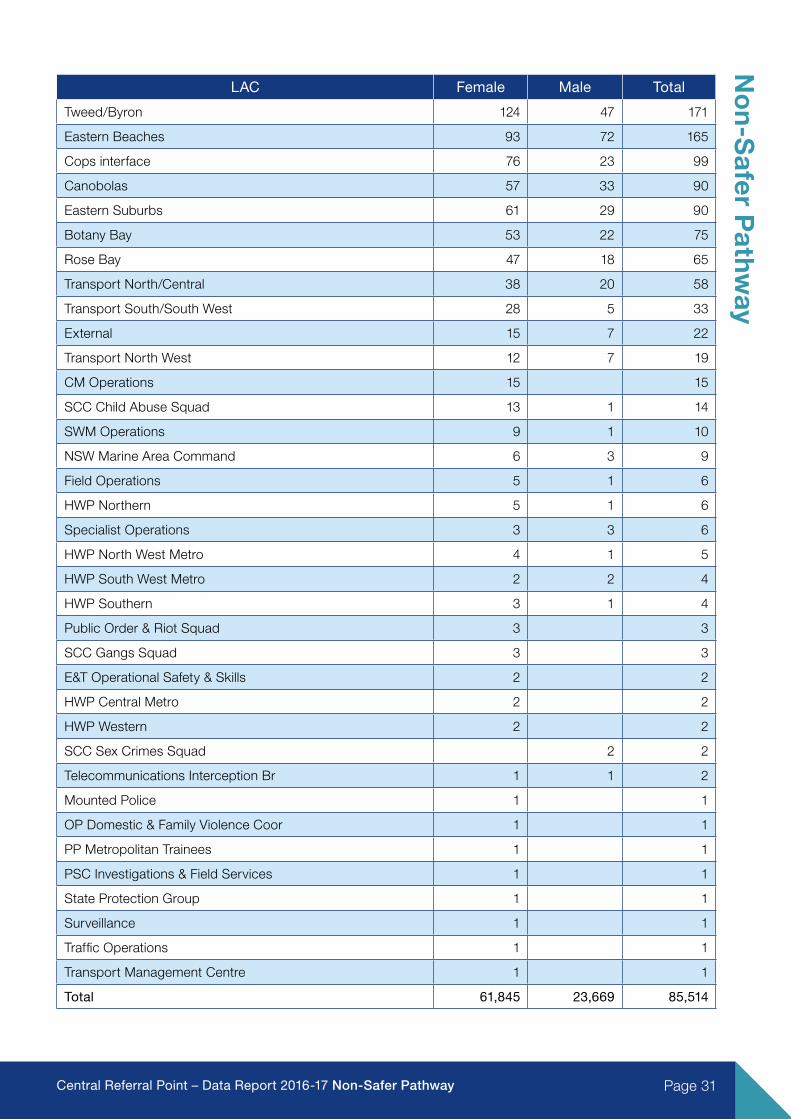
ayTable 8 shows referrals from LACs to non-Safer Pathway sites based on the postcode of the victim’s residential address. Therefore there are additional LACs in this table not situated in the catchment areas for each non-Safer Pathway site.
Lake Illawarra LAC had the highest number of referrals to non-Safer Pathway LCPs (n=3,331), followed by Brisbane Water (n=3,111) and Mid North Coast (n=3,024).
Table 8: Non Safer Pathway 2016-17 – Number of referrals by LAC and gender
LAC Female Male Total
Lake Illawarra 2,448 883 3,331
Brisbane Water 2,189 922 3,111
Mid North Coast 2,281 743 3,024
Lake Macquarie 2,040 769 2,809
St Marys 1,877 732 2,609
St George 1,697 808 2,505
Penrith 1,687 609 2,296
Liverpool 1,623 637 2,260
Orana 1,758 452 2,210
Central Hunter 1,449 483 1,932
New England 1,345 535 1,880
Mt Druitt 1,310 561 1,871
Fairfield 1,273 557 1,830
Chifley 1,334 445 1,779
Richmond 1,340 437 1,777
Albury 1,344 387 1,731
Oxley 1,307 408 1,715
Green Valley 1,176 412 1,588
Campbelltown 1,134 429 1,563
Barwon 1,142 375 1,517
Tuggerah Lakes 1,126 391 1,517
Campsie 1,012 447 1,459
Ryde 1,023 411 1,434
Flemington 925 467 1,392
Northern Beaches 915 383 1,298
Sutherland 873 385 1,258
Redfern 835 413 1,248
Macquarie Fields 931 301 1,232
Camden 815 365 1,180
Newcastle City 867 306 1,173
Rosehill 886 284 1,170
Coffs/Clarence 829 294 1,123
Page 30 Central Referral Point – Data Report 2016-17 Non-Safer Pathway
No
n-S
afer
Pat
hway LAC Female Male Total
Griffith 792 327 1,119
Hawkesbury 792 324 1,116
The Hume 799 311 1,110
Blacktown 745 364 1,109
Blue Mountains 747 312 1,059
Miranda 722 334 1,056
Burwood 679 373 1,052
Cabramatta 713 262 975
Lachlan 700 239 939
Wollongong 678 254 932
Hunter Valley 673 207 880
Monaro 618 241 859
Ashfield 532 253 785
Castlereagh 568 163 731
Mudgee 503 223 726
Shoalhaven 538 187 725
North Shore 492 225 717
Kuring gai 516 199 715
Wagga Wagga 504 176 680
Harbourside 464 201 665
Manning/Great Lakes 483 179 662
Holroyd 464 153 617
Port Stephens 438 161 599
Darling River 455 142 597
Bankstown 364 211 575
Sydney City 379 175 554
The Hills 403 106 509
Quakers Hill 335 132 467
Leichhardt 355 108 463
Far South Coast 354 108 462
Cootamundra 277 81 358
Kings Cross 218 134 352
Surry Hills 182 168 350
Marrickville 215 87 302
Deniliquin 206 69 275
Newtown 164 69 233
Parramatta 153 53 206
Barrier 144 27 171
Page 31Central Referral Point – Data Report 2016-17 Non-Safer Pathway
No
n-S
afer Pathw
ayLAC Female Male Total
Tweed/Byron 124 47 171
Eastern Beaches 93 72 165
Cops interface 76 23 99
Canobolas 57 33 90
Eastern Suburbs 61 29 90
Botany Bay 53 22 75
Rose Bay 47 18 65
Transport North/Central 38 20 58
Transport South/South West 28 5 33
External 15 7 22
Transport North West 12 7 19
CM Operations 15 15
SCC Child Abuse Squad 13 1 14
SWM Operations 9 1 10
NSW Marine Area Command 6 3 9
Field Operations 5 1 6
HWP Northern 5 1 6
Specialist Operations 3 3 6
HWP North West Metro 4 1 5
HWP South West Metro 2 2 4
HWP Southern 3 1 4
Public Order & Riot Squad 3 3
SCC Gangs Squad 3 3
E&T Operational Safety & Skills 2 2
HWP Central Metro 2 2
HWP Western 2 2
SCC Sex Crimes Squad 2 2
Telecommunications Interception Br 1 1 2
Mounted Police 1 1
OP Domestic & Family Violence Coor 1 1
PP Metropolitan Trainees 1 1
PSC Investigations & Field Services 1 1
State Protection Group 1 1
Surveillance 1 1
Traffic Operations 1 1
Transport Management Centre 1 1
Total 61,845 23,669 85,514
Page 32 Central Referral Point – Data Report 2016-17 Non-Safer Pathway
No
n-S
afer
Pat
hway
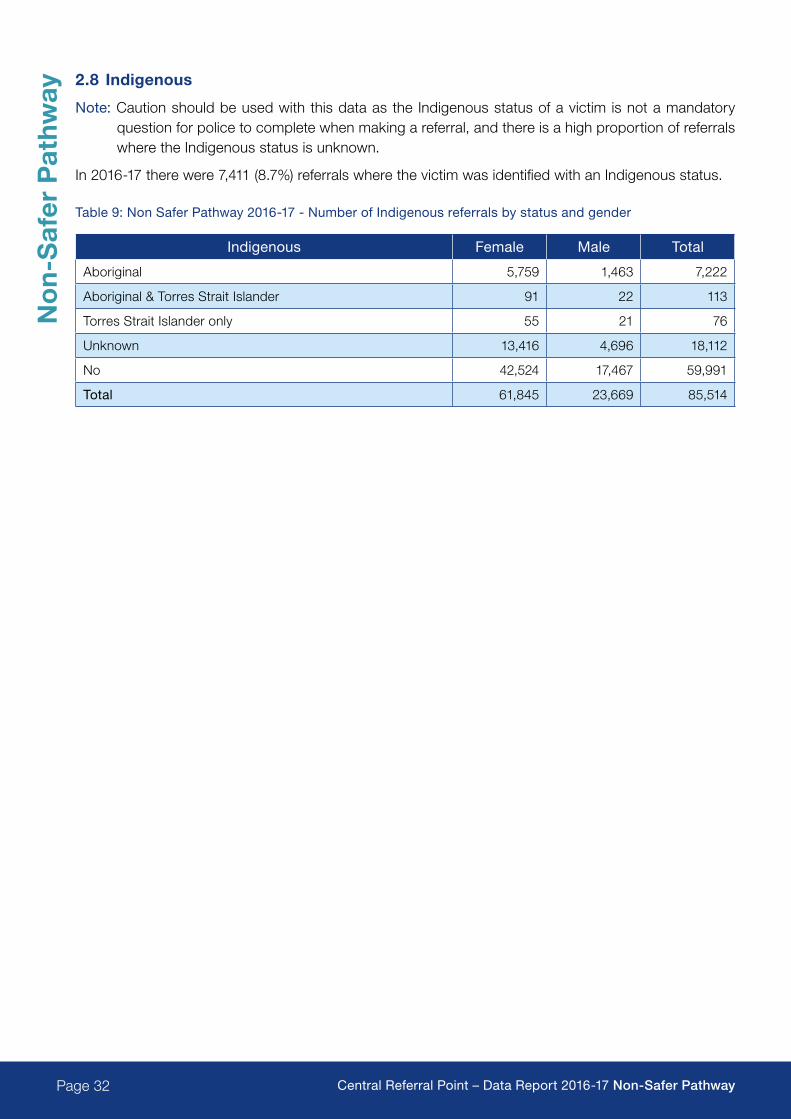
2.8 Indigenous
Note: Caution should be used with this data as the Indigenous status of a victim is not a mandatory question for police to complete when making a referral, and there is a high proportion of referrals where the Indigenous status is unknown.
In 2016-17 there were 7,411 (8.7%) referrals where the victim was identified with an Indigenous status.
Table 9: Non Safer Pathway 2016-17 - Number of Indigenous referrals by status and gender
Indigenous Female Male Total
Aboriginal 5,759 1,463 7,222
Aboriginal & Torres Strait Islander 91 22 113
Torres Strait Islander only 55 21 76
Unknown 13,416 4,696 18,112
No 42,524 17,467 59,991
Total 61,845 23,669 85,514
Page 33Central Referral Point – Data Report 2016-17 Non-Safer Pathway
No
n-S
afer Pathw
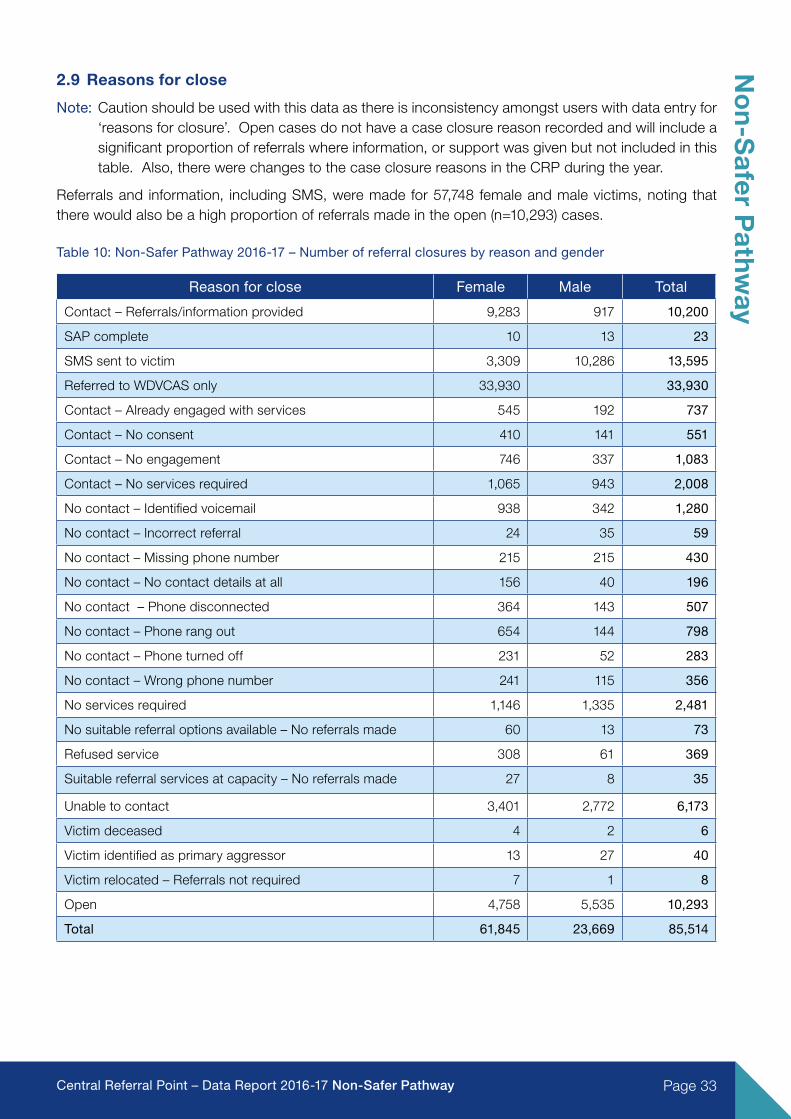
ay2.9 Reasons for close
Note: Caution should be used with this data as there is inconsistency amongst users with data entry for ‘reasons for closure’. Open cases do not have a case closure reason recorded and will include a significant proportion of referrals where information, or support was given but not included in this table. Also, there were changes to the case closure reasons in the CRP during the year.
Referrals and information, including SMS, were made for 57,748 female and male victims, noting that there would also be a high proportion of referrals made in the open (n=10,293) cases.
Table 10: Non-Safer Pathway 2016-17 – Number of referral closures by reason and gender
Reason for close Female Male Total
Contact – Referrals/information provided 9,283 917 10,200
SAP complete 10 13 23
SMS sent to victim 3,309 10,286 13,595
Referred to WDVCAS only 33,930 33,930
Contact – Already engaged with services 545 192 737
Contact – No consent 410 141 551
Contact – No engagement 746 337 1,083
Contact – No services required 1,065 943 2,008
No contact – Identified voicemail 938 342 1,280
No contact – Incorrect referral 24 35 59
No contact – Missing phone number 215 215 430
No contact – No contact details at all 156 40 196
No contact – Phone disconnected 364 143 507
No contact – Phone rang out 654 144 798
No contact – Phone turned off 231 52 283
No contact – Wrong phone number 241 115 356
No services required 1,146 1,335 2,481
No suitable referral options available – No referrals made 60 13 73
Refused service 308 61 369
Suitable referral services at capacity – No referrals made 27 8 35
Unable to contact 3,401 2,772 6,173
Victim deceased 4 2 6
Victim identified as primary aggressor 13 27 40
Victim relocated – Referrals not required 7 1 8
Open 4,758 5,535 10,293
Total 61,845 23,669 85,514

Page 34 Central Referral Point – Data Report 2016-17

Page 35Central Referral Point – Data Report 2016-17


