Download - Cells and Energy Pigments and Photosynthesis
9
Pigments and Photosynthesis
LEARNING OBJECTIVES1. Apply the procedure of paper chromatography in the separation of the pho-
tosynthetic pigments of plants and relate the pigments to their photosyn-
thetic ability.
2. Discuss how experimentation with the Hill reaction provides evidence of the
operation of the light reactions.
3. Design and implement an experimental procedure to determine factors
that affect the rate of photosynthesis in an organism.
4. Analyze and interpret experimental data from the Hill reaction.
INTRODUCTIONPhotosynthesis is the process by which light energy is converted to chemical
bond energy. Autotrophic organisms are responsible for primary production,
and photosynthesis is the process by which such production is affected. In
terrestrial communities, plants are the most significant photosynthetic organ-
isms. In aquatic communities, phytoplankton contribute the most to primary
production.
Photosynthesis comprises numerous vital and complex reactions that take place
in the cells of organisms capable of carrying out this process. The process can
be summarized with this chemical equation:
6CO2 + 12H
2O + Light energy → C
6H
12O
6 + 6O
2 + 6H
2O
Cells and Energy
Lab
2NOT FOR DISTRIBUTION - FOR INSTRUCTORS USE ONLY

10 Cells and Energy
The stomata (small openings in the epidermis of the plant) allow CO2 and H
2O to
leave the plant and O2 to enter the plant. Guard cells surround the stomata and con-
trol the opening and closing of the stomata. When guard cells take on water, they
pull apart and allow gas exchange to occur and water vapor to escape. See Figure 6.
Figure 6. Guard cells surrounding stomata.
CELLULAR STRUCTURESBefore considering the molecules that are involved in the photosynthetic reactions,
let’s examine the cellular structures in which these molecules are contained. Most
photosynthetic organisms are eukaryotic, and the photosynthetic reactions take
place in cytoplasmic organelles known as chloroplasts. Although photosynthetic
eukaryotes such as plants and algae are more common, photosynthetic bacteria are
also abundant. Since bacteria are prokaryotic, their cells do not contain organelles,
but they do have membrane layers organized into thylakoids that perform functions
analogous to chloroplasts.
The chloroplast houses the photosynthetic process in eukaryotic cells. In each
chloroplast, a double membrane surrounds a fluid-filled compartment known as
the stroma. Enzymes, electron carriers, and numerous other molecules essential
to photosynthesis are dissolved in this fluid. Also within the stroma are abundant
thylakoids. Each thylakoid is a tiny membranous vesicle containing photosynthetic
pigments and electron carriers. These thylakoids are organized in stacks known
as grana (singular = granum). Different photosynthetic reactions take place in the
grana and the stroma. See Figure 7.
NOT FOR DISTRIBUTION - FOR INSTRUCTORS USE ONLY

11Pigments and Photosynthesis
Palisade layercontainingchloroplasts
Spongy layer
Cuticle
Upper epidermis
Lower epidermis
Cross section of leaf
Chloroplast
Stomata
©Hayden-McNeil, LLC
Granum
Stroma
Thylakoid
Figure 7. Leaf cross section and chloroplast.
PHOTOSYNTHETIC REACTIONSThe total process of photosynthesis comprises two major series of reactions. These
two series are known as the light reactions and the dark reactions (or light-indepen-
dent reactions). This terminology emphasizes the form of energy required to drive
these different reactions. The light reactions require light energy in order to take
place. The dark reactions can and do take place in the dark—but they also take
place in the light. “Dark” is used to emphasize that these reactions do not require
light energy in order to take place—but they also take place in the light. They do
require specific forms of chemical energy that are produced in the light reactions.
Accordingly, the light reactions must begin and produce this appropriate chemical
energy before the dark reactions will take place.
LIGHT REACTIONS AND PHOTOSYNTHETIC PIGMENTS
The light reactions take place in the membranes of chloroplast thylakoids. These
reactions are possible because the embedded pigment molecules absorb the energy
of sunlight. Each pigment is capable of absorbing specific wavelengths of light en-
ergy in the visible spectrum.
Photosynthetic pigments are classified functionally as primary and accessory. The
primary pigment is that molecule that is capable of giving up an excited electron
such that light energy is converted to chemical bond energy. In eukaryotes and
some bacteria, the single primary pigment is a type of chlorophyll designated as
chlorophyll a. In other groups of photosynthetic bacteria, the primary pigment is
a bacteriochlorophyll that performs a similar function. When these pigment mol-
ecules absorb sufficient energy of the appropriate wavelengths, they release high-
energy electrons that drive the light reactions.
NOT FOR DISTRIBUTION - FOR INSTRUCTORS USE ONLY

12 Cells and Energy
There are several accessory pigments in both eukaryotic and prokaryotic cells.
Whereas chlorophyll a is a green pigment, the accessory pigments may also be green
(chlorophyll b), or they may appear blue-green, yellow, orange, or brown. The famil-
iar yellow and orange hues of autumn foliage are produced by those accessory pig-
ments known as carotenoids. These pigments absorb wavelengths other than those
absorbed by chlorophyll a, and thus increase the organism’s total capacity for light
absorption. You should be able to identify these pigments in the chromatogram
you will be doing today. Through a process known as electron resonance, accessory
pigments transfer their absorbed energy to the primary pigment. This transferred
energy excites the primary pigment (chlorophyll a), which then gives up a high-
energy electron. By both direct absorption of light and transferred energy, the chlo-
rophyll a is capable of driving the light reactions. As the light reactions take place
in the thylakoids of the chloroplast, they produce chemical energy in the forms of
NADPH and ATP that drive the dark reactions in the stroma. See a summary of the
light reactions below (Figure 8).
NADP+
ADP
+ Pi
O2
H2O
CH2O(sugar)
Light
NADPH
CO2
ATP
LIGHT
REACTIONS
LightLight
P680
P700
H2O
2e-
2e-
1/2O2
2H+
2H+
H++
Primaryacceptor
Pq
Cytochromecomplex
Primaryacceptor
Fd
NADP+
reductase
Pc
2e-
2e-
Electron flowprovides energy for chemiosmotic synthesis of
ATP
NADPH
NADP+
+
+
Photosystem I
Photosystem II
En
erg
y o
f e
lectr
on
s
Splitting of waterreleases oxygen
1
2 3
6
4
Electron transport chain
Electron transport chain
©Hayden-M
cNeil, LLC
Figure 8. Light reactions.
NOT FOR DISTRIBUTION - FOR INSTRUCTORS USE ONLY

13Pigments and Photosynthesis
DARK REACTIONS AND FORMATION OF GLUCOSE
These dark reactions are commonly called the Calvin cycle. This name refers to
the physiologist Melvin Calvin, who first described these reactions in the 1940s and
1950s. The function of the Calvin cycle is to produce glucose, the carbohydrate that
incorporates energy initially harvested from sunlight. The glucose molecules will
be used in many ways in the cells. For example, glucose is the starting point for the
synthesis of numerous other sugars that are involved in metabolism. Hundreds of
glucose molecules may be bonded to one another to form carbohydrate polymers,
such as starch, that serve as energy storage. Other polymers of glucose, such as
cellulose, are major structural molecules in cells. For every 6CO2 molecules used
to create a carbohydrate in the Calvin cycle, 18 ATP and 12 NADPH molecules are
needed from the light reactions. See Figure 9.
NADP+
ADP
+ Pi
O2
H2O
CH2O(sugar)
Light
NADPH
CO2
ATP
LIGHT
REACTIONS
©Hayden-McNeil, LLC
Reg
en
era
tion
of R
uB
P
Red
uctio
n
Carbon Fixation
6 moleculesof CO2
12
6
12 molecules of3-phosphoglycerate
C C C P
12
12 molecules of1,3-bisphosphoglycerate
C C C PP
6
6 molecules of RuBP
C C C C C PP
12
12 molecules of G3P
C C C P10
10 molecules of G3P
C C C P
2
2 molecules of G3P
Glucose and other products
C C C P
C
12 ATP
12 ADP
NADPH
12 NADP+
12
+ 12 P i
6 ATP
6 ADPCALVIN CYCLE
Figure 9. Calvin cycle.
NOT FOR DISTRIBUTION - FOR INSTRUCTORS USE ONLY

14 Cells and Energy
ACTIVITY 1: PAPER CHROMATOGRAPHYChromatography is a procedure for separating dissolved substances from one an-
other. A solution is made up of a solvent and one or more solutes. In plants, the
solvent is water, and there are many kinds of solutes, such as sugars, mineral ions,
amino acids, and pigments. We will use chromatography to separate different plant
pigments. In chromatography, the solutes are separated from one another accord-
ing to both their solubility (or lack of solubility) in different liquids and their ad-
sorption to an inert material.
As the name suggests, paper (cellulose) is the inert adsorbent used in paper chro-
matography. The solution is applied as a narrow band approximately 2 cm from
the lower edge of the strip or sheet of paper. This is identified as the origin of the
chromatogram. The chromatographic paper is placed in a glass chromatography
jar. This jar contains the solvent system that will be used to separate the solutes in
the applied solution. The origin should be above the surface of the solvent, or it will
dissolve into the solvent in the bottom of the jar. The jar is sealed to maintain an
internal atmosphere that is saturated with solvent molecules.
The solvent immediately begins to move up the paper. The solvent front can be
observed as a wet boundary on the paper. As the solvent front passes through the
origin, some of the pigment solutes will be dissolved in this moving solvent system.
Depending upon both the degree of solubility of the solute in this solvent and the
affinity of the solute for cellulose, the solute will be carried upward a certain dis-
tance on the paper. If several solutes in the unknown solution have different affini-
ties and solubilities, then they will be deposited at different sites on the paper. In
this manner, it is possible to separate these unidentified solutes from one another.
The chloroplasts of most plants contain several different photosynthetic pigments,
one primary pigment (chlorophyll a) and several accessory pigments (varies accord-
ing to species). The purpose of the following activity will be to use paper chroma-
tography to separate and identify the photosynthetic pigments contained within the
chloroplasts of a magnolia leaf.
Caution: The 9 ether:1 acetone solvent used in this procedure is flammable and
quite noxious. The chromatography jars should be kept on the side counter or in
a fume hood at all times. Do not move the jars. Used solvent should remain in the
chromatography jars or properly collected in a waste jar by the lab instructor.
PROCEDURE
1. Obtain a sheet of chromatography paper. Hold the paper by its edges so that dirt
and oil from your fingers will not get on the paper. Fold the paper lengthwise
to form a crease in the paper. This will help reinforce the rigidity of the paper.
2. Obtain a fresh magnolia leaf from the side counter.
3. Place the leaf bottom-side down on the chromatography paper.
NOT FOR DISTRIBUTION - FOR INSTRUCTORS USE ONLY
15Pigments and Photosynthesis
4. Place a ruler parallel to the bottom of the chromatography paper on top of the
magnolia leaf. One side of the ruler should run parallel 2 cm above the bottom
of the paper.
5. Using the edge of a coin or the tip of blunt forceps, rub 2–3 smooth, continu-
ous lines across the leaf such that it leaves a solid green mark on the paper
underneath. Press firmly but not too hard—you do not want to tear the leaf. The
pigment line must be above the solvent level in the chromatography chamber.
6. Prepare a chromatography chamber with enough 9:1 ether:acetone solvent to
completely cover the bottom of the chamber by about 1 cm. This step may have
been done for you.
7. Place the pigmented chromatogram into the chamber and close the lid of the
chamber. The origin must not be submerged in the solvent. Consult the lab
instructor if the solvent level is not correct. Do not move the chamber once the
paper is in place.
8. Allow the chromatogram to develop long enough for the solvent front to come
within 2–3 cm of the top of the paper.
9. Remove the chromatogram from the chamber and allow it to air dry near an
open window or in a fume hood. Replace the lid on the chromatography jar.
10. Once dry, turn off the room lights and shine the UV lamp on your chromato-
gram.
11. Do not dispose of the solvent in the jar. It should be reused by the next labora-
tory section.
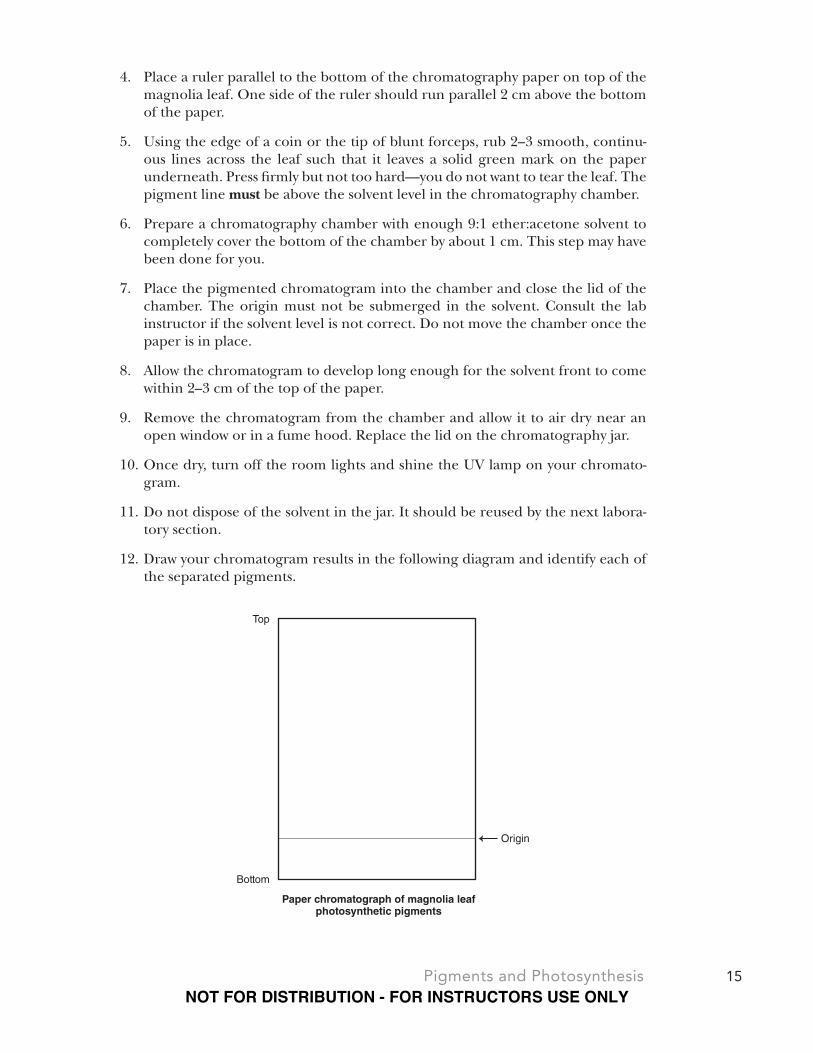
12. Draw your chromatogram results in the following diagram and identify each of
the separated pigments.
Origin
Paper chromatograph of magnolia leafphotosynthetic pigments
Top
Bottom
NOT FOR DISTRIBUTION - FOR INSTRUCTORS USE ONLY
16 Cells and Energy
ACTIVITY 2: LIGHT REACTION MEASUREMENTS
THE HILL REACTION
In 1937, the English biochemist Robert Hill demonstrated that when isolated chlo-
roplasts were illuminated, artificial electron acceptors were chemically reduced. As
recognition of his pioneering work, this use of isolated chloroplasts continues to be
designated as the Hill reaction. In these oxidation–reduction reactions, oxygen gas
(O2) also was produced. Hill’s work was significant in providing the initial descrip-
tion of the light reactions of photosynthesis. Experiments based on this earlier work
are useful in developing an understanding of the light reactions of photosynthesis.
In our experiment, we will isolate chloroplasts from spinach leaves such that we
may use these organelles in our study of the Hill reaction. After we have isolated the
chloroplasts, we will carefully break open these organelles in order to expose the
internal thylakoids. When we illuminate these exposed thylakoids, the chlorophyll
a molecules will release excited electrons. By using an artificial electron acceptor,
dichlorophenol indole phenol (DPIP), we will be able to detect the activity of the
light reactions. DPIP intercepts electrons before they are transferred to natural elec-
tron carriers in the thylakoid membranes. As the blue DPIP accepts electrons, it is
reduced chemically to a colorless form. By monitoring this color change under vary-
ing experimental conditions, we can study the effects of light quality on the rate of
photosynthesis. You will be measuring transmittance, which will increase over time
if photosynthesis is occurring. The faster the DPIP changes from blue to colorless,
the steeper your upward slope will be.
PROCEDURE
1. Expose the spinach to light (light prime) for 15–30 minutes. Leave the spinach
in a plastic bag. Place the bag of spinach in the light of a lamp behind a heat
sink. The spinach must look fresh. Limp spinach will not undergo photosynthe-
sis.
2. Loosely fill the blender with the light-primed spinach until it is about 3/4 full.
Pour 0.5 M cold sucrose into the blender cup until the blender cup is about 1/2
full with liquid.
3. Blend the spinach with three short bursts of 10 seconds each.
4. Pour the blended mixture through a double layer of cheesecloth into a large
beaker.
5. Fill two screw-top test tubes with the filtered suspension. Cover two of the tubes
with foil and label “Thylakoids.” Place these on ice.
These first five steps may have already been performed for you so that the samples are ready to be used when you come into lab.
NOT FOR DISTRIBUTION - FOR INSTRUCTORS USE ONLY
17Pigments and Photosynthesis
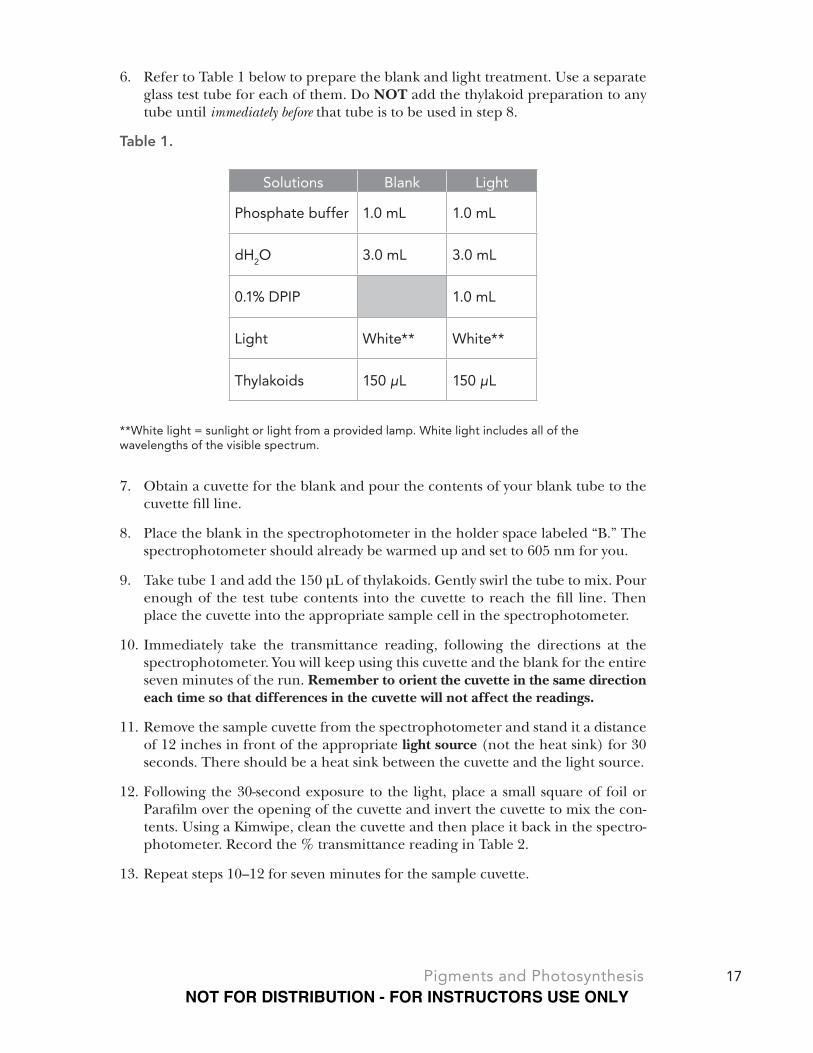
6. Refer to Table 1 below to prepare the blank and light treatment. Use a separate
glass test tube for each of them. Do NOT add the thylakoid preparation to any
tube until immediately before that tube is to be used in step 8.
Table 1.
Solutions Blank Light
Phosphate buffer 1.0 mL 1.0 mL
dH2O 3.0 mL 3.0 mL
0.1% DPIP 1.0 mL
Light White** White**
Thylakoids 150 μL 150 μL
**White light = sunlight or light from a provided lamp. White light includes all of the wavelengths of the visible spectrum.
7. Obtain a cuvette for the blank and pour the contents of your blank tube to the
cuvette fill line.
8. Place the blank in the spectrophotometer in the holder space labeled “B.” The
spectrophotometer should already be warmed up and set to 605 nm for you.
9. Take tube 1 and add the 150 μL of thylakoids. Gently swirl the tube to mix. Pour
enough of the test tube contents into the cuvette to reach the fill line. Then
place the cuvette into the appropriate sample cell in the spectrophotometer.
10. Immediately take the transmittance reading, following the directions at the
spectrophotometer. You will keep using this cuvette and the blank for the entire
seven minutes of the run. Remember to orient the cuvette in the same direction
each time so that differences in the cuvette will not affect the readings.
11. Remove the sample cuvette from the spectrophotometer and stand it a distance
of 12 inches in front of the appropriate light source (not the heat sink) for 30
seconds. There should be a heat sink between the cuvette and the light source.
12. Following the 30-second exposure to the light, place a small square of foil or
Parafilm over the opening of the cuvette and invert the cuvette to mix the con-
tents. Using a Kimwipe, clean the cuvette and then place it back in the spectro-
photometer. Record the % transmittance reading in Table 2.
13. Repeat steps 10–12 for seven minutes for the sample cuvette.
NOT FOR DISTRIBUTION - FOR INSTRUCTORS USE ONLY

18 Cells and Energy
List three factors that could possibly affect photosynthesis rate.
1. _________________________________________________________________
2. _________________________________________________________________
3. _________________________________________________________________
NOW DESIGN YOUR OWN EXPERIMENT Use the space below to write up your experimental question (hypothesis and pre-
diction) and mini protocol. Your TA will let you know what types of treatments
are available. You will need to run two additional experiments with two different
variables. Before beginning your experiment, your group will need to get your TA’s
approval. Be prepared to explain why you chose these treatments. What is the main
idea your experiment is testing and what do you expect your results to be?
Hypothesis:
Experimental Design:
14. Working with one sample/cuvette at a time, perform steps 7–12 for your two
treatments. Remember to add the thylakoids just before you start a new treat-
ment.
Do not dispose of the samples in your cuvettes until the end of the experiment.
Do the samples in each cuvette look different from when you started the experi-
ment? __________
Do the samples in the cuvettes from different treatments look different from each
other? __________
Explain why or why not for each sample. What specifically was causing this? And
explain why or why not when you are comparing your two treatments.
NOT FOR DISTRIBUTION - FOR INSTRUCTORS USE ONLY
19Pigments and Photosynthesis
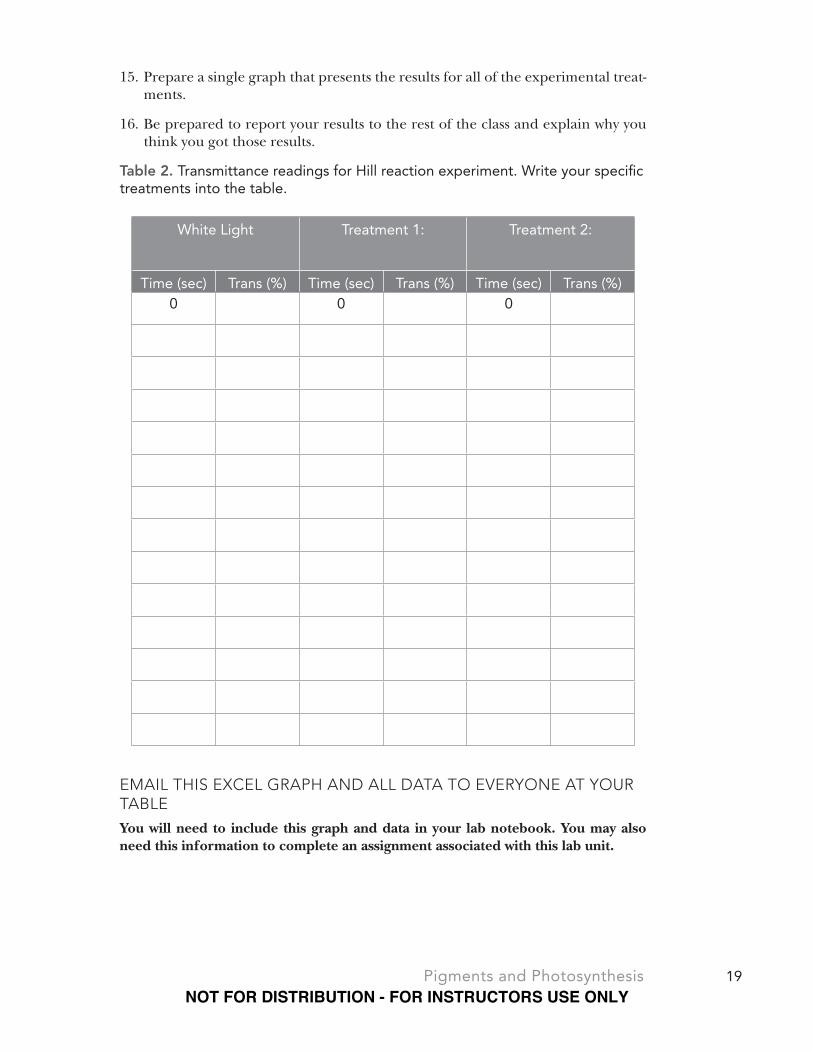
15. Prepare a single graph that presents the results for all of the experimental treat-
ments.
16. Be prepared to report your results to the rest of the class and explain why you
think you got those results.
Table 2. Transmittance readings for Hill reaction experiment. Write your specific treatments into the table.
White Light Treatment 1: Treatment 2:
Time (sec) Trans (%) Time (sec) Trans (%) Time (sec) Trans (%)0 0 0
EMAIL THIS EXCEL GRAPH AND ALL DATA TO EVERYONE AT YOUR TABLE You will need to include this graph and data in your lab notebook. You may also
need this information to complete an assignment associated with this lab unit.
NOT FOR DISTRIBUTION - FOR INSTRUCTORS USE ONLY

20 Cells and EnergyNOT FOR DISTRIBUTION - FOR INSTRUCTORS USE ONLY
PIGMENTS AND PHOTOSYNTHESIS
Name
Date Section
DISCUSSION QUESTIONS
21Pigments and Photosynthesis
1. One of the pigments in your chromatogram should fluoresce. Which pigment
would this be? Why do we see fluorescence with the UV light?
2. How did the Hill reaction provide evidence for the light reaction processes?
NOT FOR DISTRIBUTION - FOR INSTRUCTORS USE ONLY

22 Cells and Energy
3. Based on your graph, which treatment was most effective at driving photosyn-
thesis? What would account for the differences in your three treatments? Were
there any surprising results and can you explain them?
White Light:
Treatment 1:
Treatment 2:
ACKNOWLEDGEMENTSLabquest Manual, Vernier http://www2.vernier.com/manuals/labquest2_user_
manual.pdf
NCSU, Biological Sciences, 2016. BIO 183 Introductory Biology II Laboratory
Manual, Hayden-McNeil Publishing: Plymouth, MI
NOT FOR DISTRIBUTION - FOR INSTRUCTORS USE ONLY


