

San Bernardino County Stormwater Program Order R8-2010-0036
Comprehensive Bacteria Reduction Plan
Revised
June 28, 2011
Submitted to:
California Regional Water Quality Control Board, Santa Ana Region
Submitted by:
San Bernardino County Flood Control District

i
Heading 1 (Section Number) Heading 1 (Section Title) Heading 1 (Section Number) Heading 1 (Section Title) Heading 1 (Section Number) Heading 1 (Section Title) Heading 1 (Section Number) Heading 1 (Section Title) Heading 1 (Section Number) Heading 1 (Section Title) Table of Contents
Section 1 – Background and Purpose.................................................................. 1-1
1.1 Regulatory Background ...................................................................... 1-1
1.2 Santa Ana River Watershed Basin Plan .............................................. 1-2
1.2.1 Existing Basin Plan Requirements ...................................................... 1-2
1.2.2 Proposed Amendments to the Basin Plan.......................................... 1-2
1.3 Middle Santa Ana River Bacterial Indicator TMDL............................ 1-3
1.4 San Bernardino County MS4 Permit...................................................1-4
1.5 Comprehensive Bacterial Indicator Reduction Plan ......................... 1-5
1.5.1 Purpose and Requirements.................................................................. 1-5
1.5.2 Applicability .......................................................................................... 1-8
1.5.3 Compliance with Urban Wasteload Allocation................................. 1-8
1.5.4 CBRP Conceptual Framework ............................................................. 1-8
1.5.5 CBRP Development Process ................................................................ 1-9
1.5.6 CBRP Roadmap..................................................................................... 1-9
Section 2 – CBRP Implementation Program ........................................................ 2-1
2.1 CBRP Implementation Steps ..............................................................2-1
2.2 CBRP Program Elements ....................................................................2-3
2.3 Implementation Schedule ................................................................. 2-8
2.4 Compliance and Iterative/Adaptive Management Strategies........... 2-9
Section 3 – Compliance Analysis......................................................................... 3-1
3.1 Introduction........................................................................................ 3-1
3.1.1 Overview of Compliance Analysis.......................................................3-2
3.2 Baseline Dry Weather Flow and Bacterial Indicator Data .................3-2
3.2.1 DWF Sources to MS4 ...........................................................................3-2
3.2.2 Bacteria Concentrations.......................................................................3-5
3.2.3 Relative Source Contribution ..............................................................3-7
3.3 Criteria for demonstrating Compliance ............................................ 3-8
3.4 Bacterial indicator Reduction from the MS4 .................................... 3-8
3.4.1 Controllability ...................................................................................... 3-8
3.4.2 Gap Analysis for Bacterial Indicators................................................. 3-8
3.5 Water Quality Benefit Estimates ...................................................... 3-10
3.5.1 CBRP Activity ...................................................................................... 3-10
3.5.2 San Bernardino County MS4 Permittee Compliance...................... 3-12
3.5.3 Role of Inspection Program in Achieving Compliance................... 3-14
Section 4 – Wet Weather Condition Program ..................................................... 4-1

Contents Continued
ii
List of Attachments
Attachment A TMDL Implementation
Attachment B Watershed Characterization
Attachment C CBRP Implementation Program Details
Attachment D Existing Urban Source Control Program
Attachment E Implementation Schedule
Attachment F Glossary
Attachment G References
List of Tables
1-1 MSAR Bacterial Indicator TMDL requirements applicable to portions of
San Bernardino County............................................................................................................... 1-6
2-1 Relationship between Implementation Steps and Actions and Required
CBRP Elements ............................................................................................................................2-4
3-1 Available Data for Characterization of DWF and Bacterial Indicators in
Areas Draining to Watershed-Wide Compliance Sites ...........................................................3-3
3-2 Baseline DWF and Bacterial Indicator concentrations in Areas that Drain to
Watershed-Wide TMDL Compliance Monitoring Sites..........................................................3-6
3-3 Relative Contribution to Bacterial Indicator Water Quality Objective Exceedances
from MS4 DWFs..........................................................................................................................3-9
3-4 Approximate Level of CBRP Activity Implementation Needed to Achieve Target E.Coli
Reduction .................................................................................................................................... 3-11
3-5 Table 3-5. Estimate of Irrigated Area Addressed by Potential Water Agency
Implementation of Outdoor Water Conservation BMPs Planned for Compliance with
20x2020 Requirements .............................................................................................................. 3-11
List of Figures
2-1 Key Implementation Actions...................................................................................................... 2-1
2-2 Typical Capital Improvement Project (CIP) Process for Local Permittee Projects ..............2-4
2-3 CBRP Implementation Schedule ............................................................................................. 2-10
2-4 CBRP Implementation Strategy ............................................................................................... 2-11
3-1 Estimated Relative DWF Contributions to Watershed-Wide Compliance Sites ..................3-4
3-2 Estimated Relative Sources of Bacterial Indicators at Watershed-wide Compliance
Locations......................................................................................................................................3-7

Contents
Continued
iii
List of Acronyms BMPs Best Management Practices
BPS Bacterial Prioritization Score
CAP Compliance Assistance Program
CBRP Comprehensive Bacteria Reduction Plan
CII Commercial, Industrial, and Institutional
COPS Community Oriented Policing Services
CUWCC California Urban Water Conservation Council
CWA Clean Water Act
CWP Center for Watershed Protection
DWF Dry Weather Flow
EPA Environmental Protection Agency
IDDE Illicit Discharge Detection and Elimination
IEUA Inland Empire Utilities Agency
LID Low Impact Development
mL Milliliters
MS4 Municipal Separate Storm Sewer System
MSAR Middle Santa Ana River
MST Microbial Source Tracking
MWD Metropolitan Water District
NPDES National Pollutant Discharge Elimination System
OCWD Orange county Water District
POTWs Publicly-owned Treatment Works
QAPP Quality Assurance Project Plan
RCFC&WCD Riverside County Flood Control and Water Conservation District
REC-1 Water Contact Recreation
REC-2 Non-Contact Recreation
RWQCB Regional Water Quality Control Board
SAR Santa Ana River
SAWPA Santa Ana Watershed Protection Authority
SBCFCD San Bernardino County Flood Control District
SCAG Southern California Association of Governments
SWQSTF Stormwater Quality Standards Task Force
TMDL Total Maximum Daily Load
UAA Use Attainability Analysis
USEP Urban Source Evaluation Plan
USGS United States Geological Study
UWMP Urban Water Management Plan
WAP Watershed Action Plan
WBIC Weather-based Irrigation Controller
WQMP Water Quality Management Plan

Contents Continued
iv
This page intentionally left blank.

1-1
Section 1 Background and Purpose
The Santa Ana Regional Water Quality Control Board (RWQCB) adopted a Municipal Separate
Storm Sewer System (MS4) permit for San Bernardino County on January 29, 2010 that requires
the development of a Comprehensive Bacteria Reduction Plan (CBRP). The CBRP is a long term
plan designed to achieve compliance with dry weather condition (April 1 – October 31)
wasteload allocations for bacterial indicators established by the Middle Santa Ana River
(MSAR) Bacterial Indicator Total Maximum Daily Load (TMDL) (“MSAR Bacterial Indicator
TMDL”). This document fulfills this MS4 permit requirement. The following sections provide
the regulatory background, purpose, and framework of the CBRP.
1.1 Regulatory Background The 1972 Federal Water Pollution Control Act and its amendments comprise what is commonly
known as the Clean Water Act (CWA). The CWA provides the basis for the protection of all
inland surface waters, estuaries, and coastal waters. The federal Environmental Protection
Agency (EPA) is responsible for ensuring the implementation of the CWA and its governing
regulations (primarily Title 40 of the Code of Federal Regulations) at the state level.
California‘s Porter-Cologne Water Quality Control Act of 1970 and its implementing
regulations establish the Santa Ana Regional Water Quality Control Board (RWQCB) as the
agency responsible for implementing CWA requirements in the Santa Ana River Watershed.
These requirements include adoption of a Water Quality Control Plan (“Basin Plan”) to protect
inland freshwaters and estuaries. The Basin Plan identifies the beneficial uses for waterbodies
in the Santa Ana River watershed, establishes the water quality objectives required to protect
those uses, and provides an implementation plan to protect water quality in the region
(RWQCB 1995, as amended).
The CWA requires the RWQCB to routinely monitor and assess water quality in the Santa Ana
River watershed. If this assessment indicates that beneficial uses are not met in a particular
waterbody, then the waterbody is found to be impaired and placed on the state’s impaired
waters list (or 303(d) list1). This list is subject to EPA approval; the most recent EPA-approved
303(d) list for California is the 2006 list2.
Waterbodies on the 303(d) list require development of a TMDL. A TMDL establishes the
maximum amount of a pollutant that a waterbody can receive (from both point and nonpoint
sources) and still meet water quality objectives.
1 303(d) is a reference to the CWA section that requires the development of an impaired waters list. 2 The State Water Resources Control Board recently completed its 2010 303(d) List. This list is
currently under review by the EPA.

Section 1 • Background and Purpose
1-2
1.2 Santa Ana River Watershed Basin Plan The Basin Plan designates beneficial uses (including recreational uses) for surface waters in the Santa Ana
River watershed (RWQCB 1995, as amended) (see Table 3-1 of the Basin Plan). The following sections
describe existing and potential future Basin Plan requirements that are relevant to this CBRP.
1.2.1 Existing Basin Plan Requirements
The recreational uses applicable to waterbodies in the MSAR watershed include Water Contact
Recreation (REC-1) and Non-Contact Recreation (REC-2). These are currently defined in the Basin Plan as
follows:
� REC-1 - Waters that are used for recreational activities involving body contact with water where
ingestion of water is reasonably possible. These uses may include, but are not limited to,
swimming, wading, water-skiing, skin and scuba diving, surfing, whitewater activities, fishing,
and use of natural hot springs.
� REC-2 - Waters that are used for recreational activities involving proximity to water, but not
normally involving body contact with water where ingestion of water would be reasonably
possible. These uses may include, but are not limited to, picnicking, sunbathing, hiking,
beachcombing, camping, boating, tidepool and marine life study, hunting, sightseeing, and
aesthetic enjoyment in conjunction with the above activities.
To evaluate whether these recreational uses are protected in a given waterbody, the Basin Plan
(Chapter 4) currently relies on fecal coliform3 as a bacterial indicator for the potential presence of
pathogens. Fecal coliform present at concentrations above certain thresholds are believed to be an
indicator of the potential presence of fecal pollution and harmful pathogens, thus increasing the risk of
gastroenteritis in recreational bathers exposed to the elevated levels. Section 4 of the Basin Plan specifies
the following water quality objectives for protection of recreational uses:
� REC-1 - Fecal coliform: log mean less than 200 organisms/100 mL based on five or more
samples/30-day period, and not more than 10 percent of the samples exceed 400 organisms/ 100
mL for any 30-day period.
� REC-2 - Fecal coliform: average less than 2000 organisms/100 mL and not more than 10 percent of
samples exceed 4000 organisms/100 mL for any 30-day period
1.2.2 Proposed Amendments to the Basin Plan
The RWQCB is currently considering replacing the REC-1 bacterial indicator water quality objectives for
fecal coliform with E. coli objectives. EPA published revised bacterial indicator guidance in 1986 (EPA
1986) that recommended the adoption of E. coli as the freshwater bacterial indicator for pathogens. This
guidance was based on epidemiological studies that found that the positive correlation between E. coli
concentrations and the frequency of gastroenteritis was better than the correlation between fecal
coliform concentrations and gastroenteritis.
The RWQCB is considering this Basin Plan revision through the work of the Stormwater Quality
Standards Task Force (SWQSTF). Since 2003, RWQCB staff and members of the SWQSTF (which
3 Fecal coliform and E. Coli are a group of bacteria considered by the Regional Board as bacterial indicators for pathogens. Within this CBRP, references to fecal
coliform and E. Coli should be considered equivalent to the term bacterial indicators.

Section 1 • Background and Purpose
1-3
includes representatives from the Santa Ana Watershed Protection Authority [SAWPA]; the counties and
cities of Orange, Riverside, and San Bernardino; Orange County Coastkeeper; Inland Empire
Waterkeeper; among others) have been engaged in the implementation of a workplan that is evaluating
both recreational uses and associated water quality objectives. The key proposed amendments, relevant
to this MSAR Bacterial Indicator TMDL that are expected to be adopted by the RWQCB in fall 2011
include:
� Clarification of the definition of REC-1 waters;
� Deletion of the current fecal coliform objectives for REC-1 and REC-2 beneficial uses;
� Adoption of geometric mean E. coli objectives for REC-1 waters based on EPA (1986) guidance;
� Sub-categorization of REC-1 waters into classes and establishment of a class-specific method for
assessing E. coli data in the absence of sufficient data to calculate a geometric mean;
� For waters designated only REC-2 (only after approval of a Use Attainability Analysis [UAA] that
removes the presumptive REC-1 use), establishment of an antidegradation-based bacterial
indicator water quality objective; and
� Temporary suspension of recreational uses during high flow conditions in freshwater streams.
The Basin Plan amendment includes several UAAs to modify presumptive REC-1 uses in the MSAR
watershed. These UAAs and proposed recreational use changes include:
� Cucamonga Creek – Reach 1, confluence with Mill Creek (at Hellman Street) upstream to 23rd
Street in Upland, California; remove both REC-1 and REC-2 uses.
� Temescal Creek – Reach 1, from approximately 100 feet downstream of Cota Street
(33°53’29.904”N, 117°34’12.432”) to the Arlington Drain confluence; remove REC-1 use.
� Temescal Creek – Reach 2, from the confluence with Arlington Drain (33° 52' 51.204"N, 117° 33'
15.732"W) to approximately 1,400 feet upstream of Magnolia Avenue (33° 52' 1.992"N, 117° 31'
30.108"W); remove REC-1 and REC-2 uses.
1.3 Middle Santa Ana River Bacterial Indicator TMDL Water quality data collected in 1994 and 1998 from waterbodies in the MSAR watershed showed
exceedances of fecal coliform bacterial indicator water quality objectives. Based on these data and
potential impacts to recreational uses, the RWQCB recommended that the following waterbodies be
placed on the 303(d) list:
� Santa Ana River, Reach 3 – Prado Dam to Mission Boulevard
� Chino Creek, Reach 1 – Santa Ana River confluence to beginning of hard lined channel south of
Los Serranos Road
� Chino Creek, Reach 2 – Beginning of hard lined channel south of Los Serranos Road to
confluence with San Antonio Creek
� Mill Creek (Prado Area) – Natural stream from Cucamonga Creek Reach 1 to Prado Basin
� Cucamonga Creek, Reach 1 – Confluence with Mill Creek to 23rd Street in City of Upland
Section 1 • Background and Purpose
1-4
� Prado Park Lake
As noted above, waterbodies on the 303(d) list are subject to the development of a TMDL. Accordingly,
on August 26, 2005 the RWQCB adopted Resolution No. R8-2005-0001, amending the Basin Plan to
incorporate bacterial indicator TMDLs for the above-listed waterbodies in the watershed (i.e., MSAR
Bacterial Indicator TMDL) (RWQCB 2005). The TMDLs adopted by the RWQCB were subsequently
approved by the State Water Resources Control Board on May 15, 2006, by the California Office of
Administrative Law on September 1, 2006, and by EPA Region 9 on May 16, 2007. The EPA approval date
is the TMDL effective date.
The MSAR Bacterial Indicator TMDL established wasteload allocations for urban MS4 and confined
animal feeding operation discharges and load allocations for agricultural and natural sources. The
wasteload and load allocations were established for both fecal coliform and E. coli:
� Fecal coliform: 5-sample/30-day logarithmic mean (or geometric mean) less than 180 organisms/
100 mL and not more than 10 percent of the samples exceed 360 organisms/100 mL for any 30-day
period.
� E. coli: 5-sample/30-day logarithmic mean (or geometric mean) less than 113 organisms/100 mL
and not more than 10 percent of the samples exceed 212 organisms/100 mL for any 30-day period.
The urban discharger requirements are listed as tasks in the TMDL, with Tasks 1.2, 3, 4.1, 4.3, 4.5, and 6
having relevance to this CBRP for Riverside County (Table 1-1). Other tasks included in the TMDL either
address urban discharges associated with San Bernardino County or other agricultural discharge
requirements.
1.4 San Bernardino County MS4 Permit The San Bernardino County MS4 program operates under a National Pollutant Discharge Elimination
System (NPDES) MS4 permit issued by the Regional Board (Order No. 2010-0036, NPDES No.
CAS618036). This permit regulates discharges to and from MS4 facilities within the Santa Ana River
watershed in San Bernardino County. The permittees covered by this permit include the San Bernardino
County Flood Control District (SBCFCD), San Bernardino County and the following Cities: Big Bear Lake,
Chino, Chino Hills, Colton, Fontana, Grand Terrace, Highland, Loma Linda, Montclair, Ontario, Rancho
Cucamonga, Redlands, Rialto, San Bernardino, Upland, and Yucaipa. The SBCFCD is the Principal
Permittee; the remaining jurisdictions are the Co-Permittees.
The Regional Board issued its first MS4 permit to San Bernardino County MS4 in 1990. This permit
focused primarily on program development, which included establishment of the Drainage Area
Management Plan (replaced in 2002 by the MSWMP) and implementation of public education and staff
training on stormwater quality concerns.
Since the issuance of that permit, the MS4 program has gradually evolved from a very basic stormwater
management program into a complex program with many requirements that go beyond the program as
originally established. The second-term permit, which began in 1996, focused on continued program
development, implementation, and reporting. Under this permit, program reporting requirements
increased significantly, which required increased staff and financial resources. To address the increased
reporting requirements, permittees developed an electronic data collection and management system for
the MS4 Area-wide Program. The system provided for more consistent reporting among the permittees
and provided a standardized approach for preparation of the required MS4 Annual Report.

Section 1 • Background and Purpose
1-5
The third-term permit, issued in 2002, increased the focus of the permit on program implementation and
required more prescriptive data reporting to document program accomplishments. These requirements
led to the development of the MS4 Solution Database, which documents well the extent to which
program requirements are implemented throughout the County. It was during this period that the
Regional Board began the adoption of TMDLs that included wasteload allocations applicable to urban
stormwater discharges. Although the 2002 MS4 permit did not include specific TMDL implementation
programs, the MS4 permittees actively participated in the development and implementation of these
TMDLs.
The Regional Board adopted the fourth term MS4 permit on January 29, 2010. This permit contains many
new requirements that will further increase the complexity and costs associated with the management of
urban discharges in the permitted area. In addition, for the first time the MS4 permit explicitly includes
TMDL implementation requirements applicable to waterbodies in San Bernardino County for which
TMDLs are effective, specifically Big Bear Lake (nutrients) and the MSAR Bacterial Indicator TMDL. The
development of this CBRP is a MS4 permit requirement associated with implementation of the MSAR
Bacterial Indicator TMDL. The CBRP is designed to provide a comprehensive plan for attaining the MS4
permit’s water quality based effluent limits for the MSAR TMDL by integrating existing control programs
and efforts with new permit mandates and other additional activities necessary to address controllable
urban sources of bacterial indicators.
1.5 Comprehensive Bacterial Indicator Reduction Plan This section provides information on the requirements for CBRP development and the applicability of the
plan to urban discharges in the San Bernardino County area. In addition, information is provided on the
general framework of this plan and the process associated with its development.
1.5.1 Purpose and Requirements
The findings section of the San Bernardino County MS4 permit describes the purpose of the
CBRP:
� Section II.F.13.c.vi - Based on the results of pre-compliance evaluation monitoring (Pre-
compliance evaluation monitoring is monitoring conducted prior to the TMDL compliance date
to assess the effectiveness of BMPs [Best Management Practices] implemented in reducing
pollutant(s) of concern by the compliance date) it has been determined that the short-term
solutions discussed above are not expected to achieve the WLAs [wasteload allocations] by the
compliance dates. This Order requires the MSAR permittees to develop a long-term plan (a
comprehensive bacteria reduction plan, CBRP) designed to achieve compliance with the WLAs
by the compliance dates.
� Section II.F.13.c.vii - If necessary, the CBRP will be updated based on an evaluation of the
effectiveness of the BMPs implemented. In the absence of an approved CBRP the WLAs become
the final numeric water quality-based effluent limit that must be achieved by the compliance
dates.

Section 1 • Background and Purpose
1-6
Table 1-1. MSAR Bacterial Indicator TMDL requirements applicable to portions of San Bernardino County.
Task Subtask Required Activity Schedule/Status
Task 1 – Review/ Revise
Existing Waste Discharge
Requirements
Task 1.1 – WDR
requirements for San
Bernardino County
MS4
Review and revise the Waste Discharge Requirements for the San
Bernardino County MS4 permit as necessary to include the appropriate
wasteload allocations, compliance schedules and or monitoring
requirements
New MS4 permit was adopted on January 29,
2010. Relevant TMDL requirements, including
the preparation of the CBRP for dry weather
were included in the permit
Task 3 - Watershed-Wide
Water Quality Monitoring
Program
NA
All named responsible parties in the TMDL shall, as a group, submit to the
Regional Board for approval a proposed watershed-wide monitoring
program that will provide data necessary to review and update the TMDL.
All parties (except U.S. Forest Service) are
implementing a Regional Board approved
monitoring program collaboratively through
the MSAR Task Force (see Attachment A)
Task 4.1 - Develop and
Implement Bacterial
Indicator Urban
Source Evaluation Plan
(USEP)
Responsible parties in San Bernardino County (as named in the TMDL) shall
develop a Bacterial Indicator Urban Source Evaluation Plan. This plan shall
include steps needed to identify specific activities, operations, and
processes in urban areas that contribute bacterial indicators to MSAR
watershed waterbodies. The plan shall also include a proposed schedule for
completion of each of the steps identified. The proposed schedules can
include contingency provisions that reflect uncertainty concerning the
schedule for completion of the SWQSTF work and/or other investigations
that may affect the steps that are proposed. The USEP shall be
implemented upon Regional Board approval.
The Regional Board-approved USEP has been
implemented by the responsible parties since
2008 (see Attachment A). In addition, this
CBRP incorporates the principles/activities of
the USEP and replaces its implementation
requirements (See Attachment C).
Task 4.2 – Revise the
San Bernardino
County Municipal
Stormwater
Management Program
(MSWMP)
The Executive Office shall notify the MS4 permittees of the need to revise
the MSWMP to incorporate measures to address the results of the USEP
and/or other studies. The revised MSWMP will be implemented upon
approval by the Regional Board.
The January 29, 2010 MS4 permit includes
requirements for MSWMP revisions that are
being coordinated with TMDL implementation
Task 4 – Urban Discharges
Task 4.3 – Revise the
San Bernardino
County Water Quality
Management Plan
(WQMP)
The Executive Office shall notify the MS4 permittees of the need to revise
the WQMP to incorporate measures to address recommendations of the
SWQSTF or other investigations. The revised WQMP will be implemented
upon approval by the Regional Board.
The January 29, 2010 MS4 permit includes
requirements for WQMP revisions that are
being coordinated with TMDL implementation
and this CBRP
Task 6 – Review or Revision
of the MSAR Bacterial
Indicator TMDL
NA
Regional Board will review all data and information generated pursuant to
the TMDL requirements on an ongoing basis (at least every three years).
Based on results from the monitoring programs, special studies, modeling
analysis, SWQSTF and/or special studies, changes to the TMDL, including
revisions to the numeric targets, may be warranted.
The first Triennial Report was submitted on
February 15, 2010; additional Triennial
Reports will be prepared in 2013 and 2016 as
part of this CBRP (see Attachment E)
Section 1 • Background and Purpose
1-7
Based on these findings, the Regional Board established specific requirements for the CBRP’s content.
These requirements, found in Section V.D.2.b.i in the San Bernardino County permit, include:
Section V.D.2.b.i - The MSAR permittees shall prepare for approval by the Regional Board a CBRP
describing, in detail, the specific actions that have been taken or will be taken to achieve compliance with
the urban wasteload allocation under dry weather conditions (April 1st through October 31st ) by December
31, 2015. The CBRP must include:
a) The specific ordinance(s) adopted to reduce the concentration of indicator bacteria in urban
sources.
b) The specific BMPs implemented to reduce the concentration of indicator bacteria from urban
sources and the water quality improvements expected to result from these BMPs.
c) The specific inspection criteria used to identify and manage the urban sources most likely causing
exceedances of water quality objectives for indicator bacteria.
d) The specific regional treatment facilities and the locations where such facilities will be built to
reduce the concentration of indicator bacteria discharged from urban sources and the expected
water quality improvements to result when the facilities are complete.
e) The scientific and technical documentation used to conclude that the CBRP, once fully
implemented, is expected to achieve compliance with the urban wasteload allocation for indicator
bacteria by December 31, 2015.
f) A detailed schedule for implementing the CBRP. The schedule must identify discrete milestones to
assess satisfactory progress toward meeting the urban wasteload allocations for dry weather by
December 31, 2015. The schedule must also indicate which agency or agencies are responsible for
meeting each milestone.
g) The specific metric(s) that will be established to demonstrate the effectiveness of the CBRP and
acceptable progress toward meeting the urban wasteload allocations for indicator bacteria by
December 31, 2015.
h) MSWMP, WQMP, and Local Implementation Plans shall be revised consistent with the CBRP no
more than 180 days after the CBRP is approved by the Regional Board.
i) Detailed descriptions of any additional BMPs planned, and the time required implementing those
BMPs, in the event that data from the watershed-wide water quality monitoring program indicate
that water quality objectives for indicator bacteria are still being exceeded after the CBRP is fully
implemented.
j) A schedule for developing a CBRP needed to comply with the urban wasteload allocation for
indicator bacteria during wet weather conditions (November 1st thru March 31st) to achieve
compliance by December 31, 2025.
Section 1 • Background and Purpose
1-8
1.5.2 Applicability
The applicability of this CBRP is limited to the following:
� Bacterial Indicator Sources – The CBRP is designed to mitigate controllable urban sources of
bacterial indicators that cause non-attainment of bacterial indicator water quality objectives at the
watershed-wide compliance sites.
� Jurisdiction – Though additional responsible parties are named in the TMDL, this CBRP document
only applies to the San Bernardino County MS4 permittees named in the TMDL: SBCFCD; San
Bernardino County; the Cities of Ontario, Chino, Chino Hills, Montclair, Rancho Cucamonga,
Upland, Rialto, and Fontana.
� Hydrologic Condition – This CBRP applies only to urban discharges from the MS4 during dry
weather conditions that have the potential to impact the downstream watershed-wide TMDL
compliance monitoring site.
� Seasonal Condition - This CBRP applies only to urban discharges from the MS4 during the period
April 1st through October 31
st.
1.5.3 Compliance with Urban Wasteload Allocation
The San Bernardino County MS4 permittees have developed a CBRP that is designed to achieve compliance
with the dry season urban wasteload allocation by the compliance date of December 31, 2015. Compliance
with the wasteload allocations can be measured in several ways:
� Water quality objectives are attained at the watershed-wide compliance sites established as part of
the implementation of the TMDL (see Attachment C). If not attained, then it must be
demonstrated that bacterial indicators from controllable urban sources are not the cause of non-
attainment.
� Compliance with controllable urban source wasteload allocations demonstrated from specific MS4
facilities, e.g., sampling demonstrates that controllable urban sources discharged from MS4 outfalls
or drains are in compliance with the wasteload allocation during dry weather conditions.
� MS4 facilities, e.g., outfalls, are dry, or that flows from these MS4 outfalls are infiltrating prior to
connection with impaired waterbodies, and thus not contributing to dry weather flow (DWF) to
downstream waters.
1.5.4 CBRP Conceptual Framework
CBRP implementation relies on a step-wise approach that implements key actions to identify controllable
urban sources of bacterial indicators, evaluate and select a mitigation alternative, and, where necessary,
construct structural BMPs to mitigate controllable sources. This pragmatic approach is a direct extension of
the already RWQCB-approved watershed-wide compliance monitoring program, Urban Source Evaluation
Plan (USEP), and framework being established by the SWQSTF. Coupled with this pragmatic approach is
the incorporation of existing and relevant MS4 permit requirements. These requirements are
supplemented, where needed, to target controllable urban sources of bacterial indicators.

Section 1 • Background and Purpose
1-9
The demonstration of compliance with the MSAR Bacteria TMDL (see Section 3) assumes RWQCB
adoption of proposed Basin Plan amendments developed by the SWQSTF. These amendments establish the
following framework:
First, the bacteria objectives and related wasteload allocations should only be applied to waterbodies
designated REC-1 and the Regional Board is working closely to identify the various storm water channels
that should be reclassified as REC-2 or REC-X. This assumption governs the range of compliance
alternatives that could be proposed in the CBRP. In particular, the MSAR Permittees plan to install regional
treatment facilities where needed to ensure urban discharges comply with bacteria objectives in 303(d)
listed streams depends first on amending the Basin Plan to make clear that the same objectives are not
intended to apply in the concrete-lined flood control channels that are tributary to natural streams.
Without such clarifications, it is uncertain whether regional treatment facilities would be permitted under
federal law. The MSAR Permittees have not identified any actions that would be taken to meet bacteria
standards if the Basin Plan amendments are not approved because we know of no feasible means to assure
compliance with the wasteload allocation at each urban stormwater outfall to every flood control channel.
Second, the CBRP is designed to mitigate controllable urban sources of bacteria to the maximum extent
practicable because the MSAR Permittees lack sole authority to determine what mitigation measures will be
permitted under law. Several different federal, state and local agencies must approve the various projects
designed to achieve compliance with the urban wasteload allocation. And, there is no assurance that such
approvals can be obtained given the need to simultaneously protect other designated beneficial uses (e.g.
aquatic habitat, groundwater recharge) in the watershed. To the extent that the MSAR Permittees may be
restricted from implementing the most effective methods for reducing urban discharges of bacteria, the
only legal alternative is to select a different strategy that achieves compliance to the maximum extent
practicable. This merely represents a practical regulatory reality and is not intended to serve as an excuse
for making anything other than the best effort possible to meet water quality standards.
Third, the MSAR Permittees believe strongly that eliminating controllable discharges is, by far, the best way
to assure compliance with the urban wasteload allocation. In general, there should be little or no urban
stormwater discharges during dry weather conditions. Mass balance analysis indicates that the greatest
water quality improvement would come from focusing on the relatively small nuisance flows associated
with excess landscape irrigation and other common activities (car washing, driveway cleaning) common to
residential areas. Reducing such flows not only offers the best method for reducing bacterial loads from
controllable urban sources, it will help the MSAR Permittees comply with the conservation requirements
specified in SB x7-7 (aka "20 percent by 2020"). The fact that similar efforts are already required in the MS4
permit only increases our commitment to implement the strategy with great diligence and a stronger sense
of urgency.
Fourth, the CBRP presumes that compliance with the wasteload allocation must be demonstrated by actual
water quality monitoring data. Such data will be regularly collected at monitoring sites designated by the
Regional Board. Such locations are commonly referred to as "watershed-wide compliance sites." The MSAR
Permittees recognize that the Basin Plan and the permit require discharges to meet water quality standards
throughout the watershed regardless of which specific locations are selected for routine sampling. The text
of the CBRP uses the phrase "watershed-wide compliance sites" to distinguish these locations from other
sites, such as those that are part of the USEP, that are sampled far less frequently. The MSAR Permittees
fully expect that all water quality monitoring requirements associated with the CBRP will be reviewed and
updated on a regular basis and that the Regional Board may request new or different sampling locations
before reauthorizing the monitoring plan.

Section 1 • Background and Purpose
1-10
Without adoption of Basin Plan amendments, the estimated cost of compliance with the MSAR Bacteria
TMDL is in excess of $2 billion, which has the potential to cause significant societal economic hardship
(CDM, 2010).
1.5.5 CBRP Development Process
The CBRP was developed collaboratively by the MSAR Permittees participating in the MSAR TMDL.
Development was coordinated with the MSAR Permittees and MSAR TMDL Task Force (see Attachment A),
as needed. Activities completed include:
� July 27, 2010 – Presentation was made to the MSAR TMDL Task Force to provide a status update on
CBRP development. Presentation was posted by SAWPA on their website.
� August 18, 2010 – Presentation was made to the MSAR TMDL Task Force on the proposed CBRP
program. Presentation was posted by SAWPA on their website.
� Following submittal of a draft CBRP to the RWQCB in December 2010, San Bernardino County MS4
program conducted a parallel public review process through the Santa Ana Watershed Project
Authority. A draft CBRP was released for public review and opportunity for public comment was
provided at a MSAR TMDL Task Force meeting on March 22, 2011. Written comments were
received until March 31, 2011.
� RWQCB comments on the draft CBRP (dated March 30, 2011) were discussed with the RWQCB and
stakeholders as part of the April 21, 2011 publicly noticed SWQSTF meeting.
1.5.6 CBRP Roadmap
The CBRP is presented in two parts: (1) primary sections that provide an executive level summary of the
components, schedule, strategy, and technical basis for the CBRP; and (2) supporting attachments that
provide additional information to support the primary sections. Following is a summary of the purpose and
content of each part of the CBRP:
� Section 2 – Provides an executive level summary of the following components of the CBRP:
Implementation Steps, Program Elements, Implementation Schedule, and Compliance and
Iterative/Adaptive Management Strategies.
� Section 3 – Provides the technical basis for the conclusion that full implementation of the CBRP
will achieve compliance with the urban wasteload allocation under dry weather conditions.
� Section 4 - Provides the schedule for development of the CBRP for achieving compliance with
urban wasteload allocations under wet weather conditions.
The above sections are supported by the following attachments:
� Attachment A, TMDL Implementation – Documents the outcome of the numerous TMDL
monitoring and source evaluation activities completed to date.
� Attachment B, Watershed Characterization – Provides background information regarding the
general characteristics of the MSAR watershed, including major subwatersheds, key jurisdictions
and dominant land use.

Section 1 • Background and Purpose
1-11
� Attachment C, CBRP Program Elements – Provides additional information relevant to each of
the Program Elements summarized in Section 2.2.
� Attachment D, Existing Urban Source Control Program - Documents existing MS4 permit
activities that have been implemented by the San Bernardino County MS4 permit program.
� Attachment E, Implementation Schedule – Provides additional information regarding the
implementation schedule summarized in Section 2.3.
� Attachment F, Glossary
� Attachment G, References

Section 1 • Background and Purpose
1-12
This page intentionally left blank.
2-1
Section 2 CBRP Implementation Program
The MSAR Permittees intend to achieve compliance with the wasteload allocation using a
variety of implementation strategies, including: Evaluating the need for new water
conservation ordinances to reduce urban runoff from landscape irrigation, more rigorous
enforcement of existing ordinances to reduce water waste and control pet waste, management
of homeless encampments and other illicit discharges, enhanced septic system management,
improved street sweeping programs, and other structural BMPs designed to intercept, retain,
divert or treat controllable urban DWF during dry weather conditions. A multi-step procedure
will be used to select and implement the most appropriate control strategy for each MS4 outfall
in San Bernardino County that is tributary to an impaired waterbody.
It is important to note that the MSAR Permittee’s programs with regard to the CBRP
Implementation Steps and activities identified below are not uniform at this time. For example,
cities with water utilities (Ontario and Chino) tend to have strong irrigation management
programs, whereas MSAR Permittees without utilities may need to consider enhancing
ordinances or building stronger partnerships with local water purveyors to better manage
irrigation runoff. Specific combinations of actions necessary to address CBRP Implementation
Steps are therefore dependent on each MSAR Permittee’s current programs, available resources
and opportunities, and local sub-watershed needs. Therefore, specific actions taken by a MSAR
Permittee to address CBRP Implementation Steps will be described in more detail in the MSAR
Permittee’s Local Implementation Plans. The CBRP includes descriptions of the common
Implementation Steps that all MSAR Permittees will take to address the MSAR TMDL;
however, the level of individual action required of a Permittee will be dependent on multiple
factors that will be and are more appropriately described and addressed in the MSAR Permittee
Local Implementation Plans.
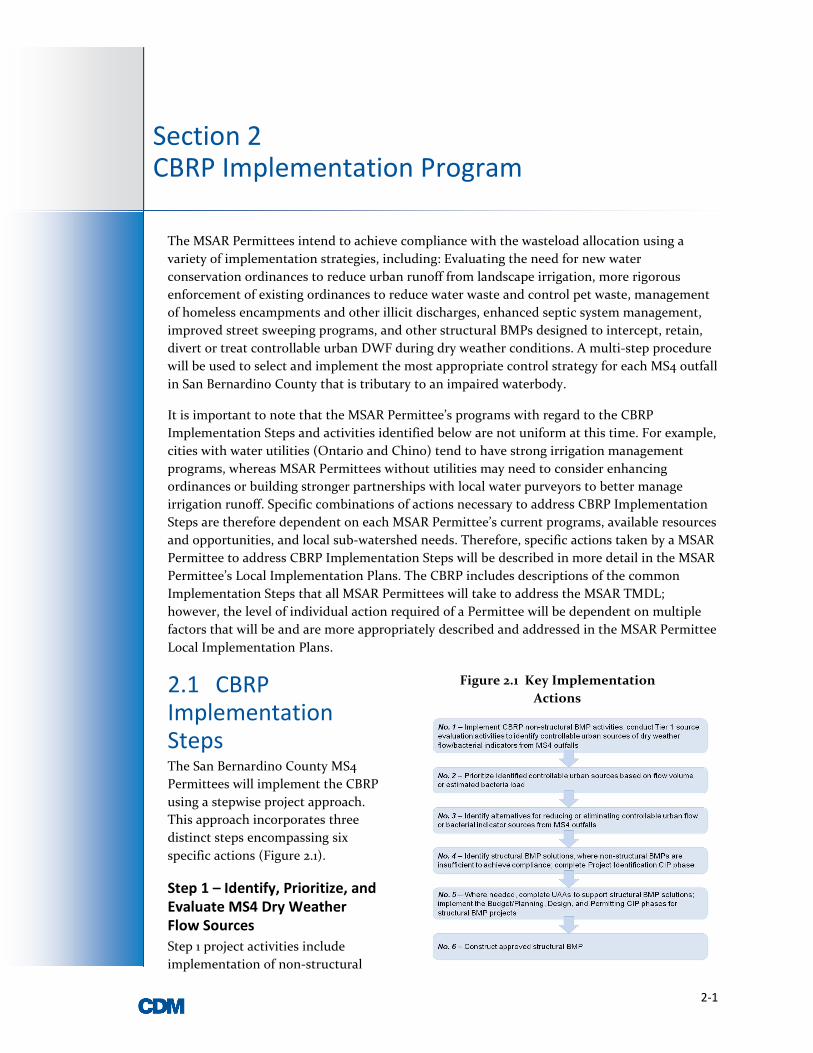
2.1 CBRP Implementation Steps The San Bernardino County MS4
Permittees will implement the CBRP
using a stepwise project approach.
This approach incorporates three
distinct steps encompassing six
specific actions (Figure 2.1).
Step 1 – Identify, Prioritize, and
Evaluate MS4 Dry Weather
Flow Sources
Step 1 project activities include
implementation of non-structural
Figure 2.1 Key Implementation
Actions

Section 2 • CBRP Implementation Program
2-2
BMPs (see CBRP Program Elements, below) and inspection activities (No. 1 – Figure 2.1). These
inspections (or urban source evaluation investigations) occur systematically in each area
draining to a watershed-wide compliance site. For each key drainage area source evaluation
activities are implemented to (a) identify controllable MS4 dry weather flow sources and their
contribution to elevated bacterial indicator concentrations; (b) prioritize controllable dry
weather flow sources for follow-up mitigation activity (No. 2 – Figure 2.1); and (c) identify
alternatives to mitigate prioritized controllable urban sources (No. 3 – Figure 2.1). Completion
of Step 1 achieves four outcomes:
(1) Prioritized list drainage areas where mitigation of dry weather flow/bacterial indicators is
deemed necessary to comply with urban wasteload allocations applicable to the MS4;
(2) For each prioritized drainage area requiring action, implementation of activities to identify
non-structural or structural BMP alternatives to mitigate controllable urban bacterial
indicator sources (No. 4 – Figure 2.1).
(3) If non-structural BMPs can mitigate the source(s), initiation of new, enhanced or more
targeted non-structural BMPs (see CBRP Program Elements, below); and
(4) If structural BMPs are needed, completion of the Project Identification phase of the local
Capital Improvement Project (CIP) process, if the project involves an individual Permittee,
or identification of the need to implement a multi-jurisdictional process for projects
involving multiple Permittees. of the MSAR Permittee’s Capital Improvement Project (CIP)
Process for projects involving individual Permittees (Figure 2.2). In addition, determination
of the need for a Use Attainability Analysis (UAA) to facilitate a structural BMP solution.
CBRP Step 1 is iterative and will occur over an extended period so that MS4 outfalls in each
drainage area can be properly prioritized, investigated and evaluated for mitigation. The
expected outcomes from Step 1 activities will be complete in all drainage areas by the first
quarter of 2015 (see CBRP Schedule, below).
Section 2 • CBRP Implementation Program
2-3
Step 2 – Evaluate and Select Structural BMP Projects
The San Bernardino County MS4 Program anticipates that structural BMPs (outfall-specific or regional)
will be required to mitigate some controllable urban sources of dry weather flow or bacterial indicators. A
prioritized list with locations for these structural BMPs is a Step 1 outcome. Under Step 2, the identified
structural BMP projects move forward in the CIP Process (No. 5 – Figure 2.1). Potential Step 2 outcomes
include:
(1) Completion of UAAs deemed necessary to support implementation of a structural BMP project.
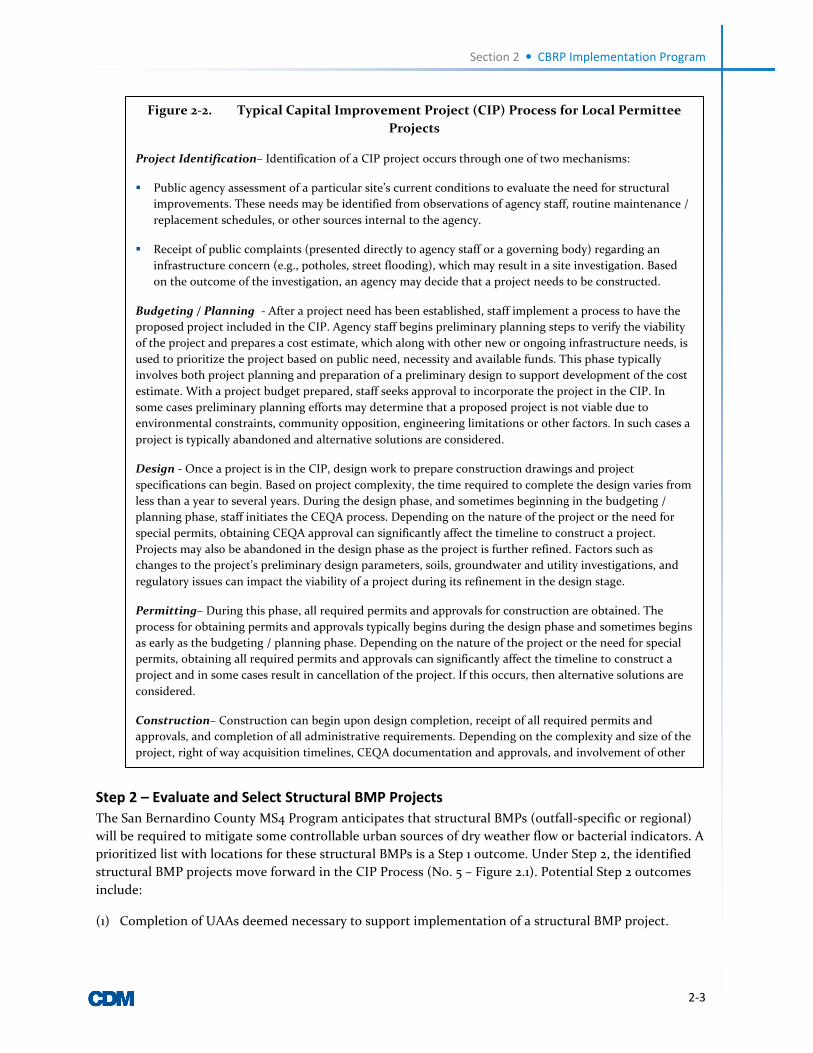
Figure 2-2. Typical Capital Improvement Project (CIP) Process for Local Permittee
Projects
Project Identification– Identification of a CIP project occurs through one of two mechanisms:
� Public agency assessment of a particular site’s current conditions to evaluate the need for structural
improvements. These needs may be identified from observations of agency staff, routine maintenance /
replacement schedules, or other sources internal to the agency.
� Receipt of public complaints (presented directly to agency staff or a governing body) regarding an
infrastructure concern (e.g., potholes, street flooding), which may result in a site investigation. Based
on the outcome of the investigation, an agency may decide that a project needs to be constructed.
Budgeting / Planning - After a project need has been established, staff implement a process to have the
proposed project included in the CIP. Agency staff begins preliminary planning steps to verify the viability
of the project and prepares a cost estimate, which along with other new or ongoing infrastructure needs, is
used to prioritize the project based on public need, necessity and available funds. This phase typically
involves both project planning and preparation of a preliminary design to support development of the cost
estimate. With a project budget prepared, staff seeks approval to incorporate the project in the CIP. In
some cases preliminary planning efforts may determine that a proposed project is not viable due to
environmental constraints, community opposition, engineering limitations or other factors. In such cases a
project is typically abandoned and alternative solutions are considered.
Design - Once a project is in the CIP, design work to prepare construction drawings and project
specifications can begin. Based on project complexity, the time required to complete the design varies from
less than a year to several years. During the design phase, and sometimes beginning in the budgeting /
planning phase, staff initiates the CEQA process. Depending on the nature of the project or the need for
special permits, obtaining CEQA approval can significantly affect the timeline to construct a project.
Projects may also be abandoned in the design phase as the project is further refined. Factors such as
changes to the project’s preliminary design parameters, soils, groundwater and utility investigations, and
regulatory issues can impact the viability of a project during its refinement in the design stage.
Permitting– During this phase, all required permits and approvals for construction are obtained. The
process for obtaining permits and approvals typically begins during the design phase and sometimes begins
as early as the budgeting / planning phase. Depending on the nature of the project or the need for special
permits, obtaining all required permits and approvals can significantly affect the timeline to construct a
project and in some cases result in cancellation of the project. If this occurs, then alternative solutions are
considered.
Construction– Construction can begin upon design completion, receipt of all required permits and
approvals, and completion of all administrative requirements. Depending on the complexity and size of the
project, right of way acquisition timelines, CEQA documentation and approvals, and involvement of other
agencies, e.g., utilities, the construction phase can take anywhere from a few months to several years.

Section 2 • CBRP Implementation Program
2-4
(2) Completion of the Budget/Planning, Design and Permitting CIP phases (see Figure 2.2) for each
structural BMP project involving an individual Permittee or implementation of the multi-
jurisdictional process to plan, design, and permit a small regional or sub-watershed treatment facility
(Table 2-1).
Similar to the Step 1 schedule, Step 2 will occur over an extended period to move each planned structural
BMP project forward to the point where the final phase can be initiated – Construction. Because Step 2
includes initiation of the CEQA process and may include establishment of multi-jurisdictional
agreements, the timeline for moving all planned structural BMPs to the point where construction can be
initiated may be lengthy. Also, as noted above, situations may occur where through the planning and
design phases a proposed project is determined to be infeasible. If that occurs, a different alternative to
mitigate the controllable urban bacterial indicator source will be sought.
Step 3 – Construct Structural BMP Projects
Step 3 focuses on construction of structural BMP projects. The schedule for construction cannot be
established at this time given MSAR Permittee’s requirements that each project move through the
Table 2-1. Estimated Timeline to Develop Small Regional or Sub-Watershed Treatment Facilities
Project Phase -
Average Time to
Complete
Project Step Activity
Local Jurisdiction Preliminary
Engineering Review
Identify project operational parameters within context of potential
joint use arrangement
Project Financial Feasibility and
Funding Source Scoping Identify project costs, land acquisition and funding mechanisms 1 - 18 months
Project Placement Review Identify placement parameters within context of potential joint use
arrangement
Pre-Application Project
Environmental Review Identify environmental requirements and project constraints
Joint Use Jurisdictional
Agreement Formation
Committee
Establish Joint Use Jurisdiction Agreement to guide project
development 2 - 18 months
Joint Use Project Development
Committee Review Final Project Concept within context of stakeholder interests
Underlying Landholder Project
Coordination
Establish final structure for landholder agreements/acquisitions and
long-term operational requirements to be included in landholder
agreements/disclosures
Joint Use Final Project Approval
Finalize construction funding mechanisms, joint use responsibilities,
operational funding mechanisms, underlying property owners rights
and responsibilities, and long-term environmental roles and
responsibilities
3 - 18 months
Joint Use Facility Project
Development Committee:
Procurement
Retain firms with appropriate engineering, environmental expertise
to design project
Joint Use Facility Project
Development Committee:
Design & Permitting
Oversee design process, review plans and environmental submittals
for compliance with project objectives
4 - 18 months
Project Bidding and Contractor
Qualification Phase
Solicit construction bids; contracts awarded only when all
environmental clearances, permits and approvals obtained and full
package submittals are signed and approved by authorizing
jurisdiction

Section 2 • CBRP Implementation Program
2-5
appropriate planning, design and permitting processes. However, as construction dates become known,
these will be reported to the RWQCB as part of the CBRP reporting process.
2.2 CBRP Program Elements The MS4 Permit established four required CBRP program elements (Section VI.D.1.c.1, MS4 Permit).
These elements, which are tools for implementing the CBRP, encompass a range of potential non-
structural and structural BMP activities:
� Element 1 - Ordinances
� Element 2 - Specific BMPs
� Element 3 - Inspection Criteria (for the purposes of the CBRP, this element includes urban source
evaluation activities)
� Element 4 - Regional Treatment (for the purposes of the CBRP, this element includes both outfall-
specific and regional structural BMP projects)
Table 2.2 summarizes the relationship among these required CBRP program elements and the three
implementation steps and associated implementation actions described above (see Figure 2-1). The
following sections summarize the key components of each CBRP program element (see Attachment C for
a detailed presentation of these elements).
Table 2.2. Relationship between Implementation Steps and Actions and Required CBRP Elements
CBRP Steps Implementation Actions
(Figure 2-1)
Relevant Required CBRP
Elements
1 Nos. 1, 2, 3, and 4 Elements 1, 2, 3
2 No. 5 Element 4
3 No. 6 Element 4
Element 1 – Ordinances
The CBRP requires the identification of specific ordinances that will be adopted during implementation
to reduce bacterial indicators in urban dry weather flow sources. Two types of ordinances have been
included in the CBRP: Water Conservation and Pathogen Control. Following is a brief statement
regarding the purpose and potential water quality benefits that may be incurred.
Water Conservation Ordinance
Purpose – Evaluate the existing water conservation ordinances to determine if adequate authority
available to manage water use to reduce dry weather flows to the MS4.
Implementation Approach – Permittees will evaluate existing ordinances and authority (including
enforcement authority) available to manage dry weather runoff from water use practices in their
respective jurisdictions. Modifications to these ordinances will be made, where appropriate. This effort
will be implemented in coordination with water purveyors and implementation of BMPs related to
irrigation or water conservation practices (see below).
Section 2 • CBRP Implementation Program
2-6
Expected Benefits – Improved water management reduces dry weather discharge to the MS4, which
reduces opportunity for the discharge to or mobilization of bacteria in the MS4. A corollary benefit is
enhanced water conservation consistent with other state policies and regulatory requirements.
Pathogen Control Ordinance
Purpose – Evaluate existing ordinances to improve management of animal wastes to control known
pathogen or bacterial indicator sources.
Implementation Approach – Permittees will evaluate existing ordinances and consider adoption of new
ordinances to implement this BMP. Based on this evaluation the Permittees will revise existing
ordinances or adopt new ordinances, as needed, to fulfill this CBRP requirement and comply with the
MS4 permit requirement to “promulgate and implement ordinances that would control known pathogen
or bacterial indicator sources such as animal wastes, if necessary”.
Expected Benefits – Establishing requirements to manage animal wastes in a manner that reduces
opportunity for bacteria contained in these wastes to be entrained in dry weather flows reduces the
potential for bacteria to be mobilized and discharged to receiving waters through the MS4
Element 2 – Specific BMPs
The CBRP requires the identification of specific BMPs that will be implemented to reduce controllable
urban sources of bacterial indicator. Selected BMPs range from programmatic activities that set the stage
for other CBRP elements (e.g., dry weather flow source evaluation activities) to specific activities that can
reduce dry weather flows or mitigate controllable urban sources of bacterial indicators. Some of the
included BMPs are also MS4 permit requirements. In addition, some of the selected BMPs may be
coordinated between San Bernardino and Riverside County to streamline the level of effort required to
implement the BMP.
Transient Camps
Purpose – Evaluate potential for transient camps to contribute bacterial indicators to MS4 dry weather
flow, and if determined necessary, develop and implement transient camp closure activities.
Implementation Approach – The MSAR Permittees will identify locations of suspected transient
encampments in receiving waters or MS4 facilities. Once identified, an investigation at one or more
locations will evaluate potential DWF water quality impacts from transient camps. If transient camps are
identified as a potential urban bacterial indicator source in DWF, MS4 Permittees will develop a model
program to address transient encampments targeted for closing because of expected water quality
impacts. As determined necessary, implement transient camp closures and follow-up activities to prevent
re-establishment of closed camps in the same locations.
Expected Benefits – Closure of transient camps in locations where it is determined that the encampment
is contributing bacterial indicators to dry weather flows eliminates a bacterial indicator source.
Illicit Discharge, Detection and Elimination Program
Purpose – The MS4 permit requires the development of an Illegal Discharge Detection and Elimination
(IDDE) program to supplement ongoing permit implementation efforts. Completion of this requirement
will enhance existing tools to reduce or eliminate dry weather flows to the MS4.

Section 2 • CBRP Implementation Program
2-7
Implementation Approach – The MSAR Permittees will complete development of this program as required
by the MS4 Permit. The program will be used to support MS4 inspection activities to reduce or eliminate
dry weather flows to the MS4 (see below).
Expected Benefits – Completion of this program provides additional tools to guide efforts to reduce or
eliminate dry weather flows to the MS4.
Street Sweeping
Purpose – Evaluate existing street sweeping programs to determine if the ongoing program can be
enhanced to further reduce presence of bacterial indicators on street surfaces.
Implementation Approach – Each MSAR Permittees will evaluate the existing street sweeping program
(e.g., method, frequency, and equipment) to determine potential to modify the program to further reduce
bacteria on street surfaces. Where opportunities exist, changes will be made to the program. If it is
determined that a change in equipment can provide water quality benefits, the MSAR Permittees will
work with their respective governing bodies to obtain funding to upgrade/replace equipment.
Expected Benefits – Reductions in bacterial indicators in MS4 outfalls (as a result of mobilization by dry
weather flows to the MS4) may occur where it is determined that enhancements to the existing street
sweeping program will further reduce bacteria present on street surfaces.
Irrigation or Water Conservation Practices
Purpose – Implementation of BMP practices that reduce potential for over-irrigation and discharge of
irrigation water to the MS4.
Implementation Approach – Each MSAR Permittee will evaluate options and minimum requirements for
implementation of irrigation and outdoor water conservation BMPs. Implementation will be closely
coordinated with the Water Conservation Ordinance activity described above and with local water
purveyor conservation programs. Based on the findings of the evaluation and in coordination with other
agencies tasked with implementation water conservation activities, the MSAR Permittees and water
purveyors will coordinate implementation of outdoor water conservation BMPs.
Expected Benefits – Improved local water management will reduce dry weather water use discharges to
the MS4, which will reduce opportunity for discharge or mobilization of bacteria as a result of MS4
discharge. A corollary benefit is enhanced water conservation consistent with other state policies and
regulatory requirements.
Water Quality Management Plan Revision
Purpose – The MS4 Permit requires updates to the MS4 Permittee’s WQMP Guidance to incorporate low
impact development (LID) practices to reduce runoff from new development and significant
redevelopment activities. This requirement is included as a BMP since implementation of LID practices
can reduce dry weather flows to the MS4, especially where they are applied to significant redevelopment
activities.
Implementation Approach – The MSAR Permittees will submit a revised WQMP Guidance to the Regional
Board for approval by July 29, 2011. Once implemented, LID practices will be applied to development
projects subject to the LID-based requirements.
Expected Benefits – For new development the benefits are expected to be mostly limited to wet weather
runoff. However, for significant redevelopment projects, the potential for reduced dry weather flows to

Section 2 • CBRP Implementation Program
2-8
the MS4 will be realized through the reconfiguration of the site to accommodate LID practices (e.g.,
runoff from irrigation can be managed to stay onsite rather than runoff to the MS4).
Septic System Management
Purpose – Evaluate potential for septic systems in the County to contribute bacterial indicators to the
MS4 during dry weather conditions.
Implementation Approach – The MSAR Permittees will develop an inventory of existing septic systems,
map the location of these facilities relative to the MS4 to evaluate potential impacts to water quality in
the MS4, conduct public education to ensure proper operation and maintenance of septic systems, and
conduct inspection and enforcement activities, where appropriate to reduce potential for septic systems
to impact water quality.
Expected Benefits – Implementation of this BMP reduces the potential for septic systems to contribute
bacterial indicators to the MS4 during dry weather conditions.
Pet Waste Management
Purpose – Implementation of BMPs that target areas where there is a high volume and concentration of
pet waste, e.g., dog parks and kennels.
Implementation Approach – Each MSAR Permittee will evaluate existing authority and programs to
manage pet waste to identify opportunities to further target BMPs to manage pet waste. Where
appropriate, MSAR Permittees will implement these BMPs. This effort will be coordinated with activities
associated with the development of a bacterial indicator control ordinance (see Element 1).
Expected Benefits –BMPs targeted specifically to pet waste management (in association with a pathogen
control ordinance) can support compliance at a local scale, where pet activities are concentrated.
Element 3 – Inspection Criteria (Urban Source Evaluation)
Purpose – Implementation of urban source evaluation activities provides the data required to determine
the potential for an MS4 outfall or drainage area to discharge controllable sources of bacterial indicators.
The results of this evaluation dictate next steps in the CBRP implementation process.
Implementation Approach – The MSAR Permittees will implement urban source evaluation activities
using a comprehensive, methodical approach that provides data to make informed decisions regarding
the potential for an MS4 outfall or group of outfalls to discharge controllable sources of bacterial
indicators. This approach relies on the following activities:
� Tier 1 Reconnaissance – Tier 1 sites are defined as locations where urban sources of dry weather
flow may directly discharge to a downstream watershed-wide compliance site. Some of the Tier 1
sites are at the same locations sampled as part of implementation of the USEP in 2007-2008.
Additional Tier 1 sites have been included, where needed, to supplement existing information.
Many of these Tier 1 locations may be dry, have minimal dry weather flow, or not be
hydrologically connected to downstream waters. However, until a reconnaissance is completed,
their potential to contribute controllable sources of bacterial indicators is unknown.
� Prioritization – Based on the findings from Tier 1 data collection activities, MS4 drainage areas
with potentially controllable urban sources of bacterial indicators will be prioritized based on
factors such as the magnitude of bacterial indicator concentrations and results from source

Section 2 • CBRP Implementation Program
2-9
tracking analyses. Areas with human sources (as compared to anthropogenic sources such as
domestic pets) will receive the highest priority for action.
� Evaluate Mitigation Alternatives – In order of priority, prioritized drainage areas will be further
evaluated to identify non-structural or structural alternatives (or some combination of both) for
mitigating controllable sources of bacterial indicators. As needed, this controllability assessment
will include reconnaissance of Tier 2 sites and the use of IDDE methods to identify and evaluate
alternatives. Tier 2 sites are tributary to Tier 1 outfalls. Tier 2 sites are predominantly locations
where underground storm drains discharge to open channels. If a Tier 2 site is determined to be a
potential contributor to non-compliance, additional inspection activities may occur to identify
the nature and source of the dry weather flow and bacterial indicators and evaluate
controllability.
� Select Mitigation Alternatives – The MSAR Permittees will select a mitigation alternative to
mitigate controllable urban bacterial indicator sources in each prioritized drainage area. If the
selected alternative involves a structural BMP, the Project Identification phase of the CIP process
is implemented to establish the project need.
Expected Benefits – This element is key to CBRP implementation as it provides the data required to make
informed decisions regarding (1) selection of BMPs to mitigate controllable urban sources of bacterial
indicators; (2) establishment of a priority, process, and schedule to implement the selected mitigation
alternative.
Element 4 – Regional Treatment (Structural Controls)
Purpose – Plan, design and construct structural BMPs to mitigate controllable urban sources of dry
weather flow and bacterial indicators. BMP projects may be regional (address controllable sources from
multiple outfalls) or outfall-specific.
Implementation Approach – It is expected that the outcomes from CBRP Step 1 implementation will result
in the identification of at least some structural BMPs to manage controllable urban bacterial indicator
sources. The potential locations for a number of structural BMPs were identified by the San Bernardino
County MS4 program as part of Phase 1 of the development of the Watershed Action Plan.. Under CBRP
Step 1 the Permittees will use this work to support evaluation of alternatives for implementing structural
BMPs to mitigate a controllable urban source.
Once a structural BMP project is identified the appropriate process for planning, design and permitting
will commence. For localized projects the CIP phases described in Figure 2-2 will guide the process.
However, if a small regional or sub-watershed treatment facility is planned, then the process described in
Table 2-1 guides the process. In addition, if a UAA is needed to ensure the success of the project, UAA
development will commence as well (see additional information, above). Completion of structural BMP
projects is subject to governing body approval, CEQA approval and funding availability. Accordingly, the
length of time from project identification to construction completion will be highly variable. Also, as
noted above, situations may occur where through the planning and design phases of a proposed project is
determined to be infeasible. If that occurs, a different alternative to mitigate the controllable urban
bacterial indicator source will be sought.
Expected Benefits – Completion of structural BMPs, where determined necessary, will mitigate
controllable urban sources of bacterial indicators.
Section 2 • CBRP Implementation Program
2-10
2.3 Implementation Schedule Figure 2-3 summarizes the CBRP implementation schedule for the various required CBRP elements. A
more detailed schedule, which includes information regarding milestones, metrics and responsibilities, is
provided in Attachment E. Color differences in the timeline for a particular activity illustrate shifts from
BMP development to BMP implementation. For example, until a structural BMP has been successfully
incorporated into the CIP or is being implemented as part of a multi-jurisdictional effort, the structural
BMP is considered in development. However, once the planning, design and permitting phases are
moving forward, the BMP is considered in the implementation phase, unless the project is determined to
be infeasible during the final planning, design and/or permitting phases.
Elements 1, 2, and 3 will be completed and fully implemented by December 31, 2015. It is expected that
Elements 1, 2 and 3 should independently attain the MS4 permit’s water quality based effluent limits for
the MSAR TMDL (See Section 3). However, Capital Projects may be more cost effective or necessary in
some cases to attain the water quality based effluent limits. Element 4 will identify structural BMPs by
December 31, 2015 believed necessary to attain the MS4 permit water quality-based effluent limits for the
MSAR TMDL. Completion of subsequent project development phases will likely occur beyond the end of
2015 (gray shaded area of Figure 2-4).
Attachment E identifies responsibilities for implementation of CBRP activities. In general:
� Elements 1 and 2 – Individual MSAR Permittees will be responsible for most of these tasks, unless
the area-wide MS4 program is identified as the lead for programmatic aspects; however, once
specific actions are required at the local level, e.g., ordinance development, responsibility shifts
to the individual MSAR Permittee.
� Element 3 – The MSAR Permittees will jointly, through partnerships with the RCFC&WCD
and/or the MSAR TMDL Task Force, implement Tier 1 and Tier 2 data collection and
identification of mitigation alternatives. Specific activities within prioritized areas will be lead by
the MSAR Permittee with jurisdiction over the targeted drainage area.
� Element 4 – All BMP activities associated with this element will be led by the MSAR Permittee or
Permittees with jurisdiction over the area targeted for a BMP.
2.4 Compliance and Iterative/Adaptive Management Strategies
The CBRP establishes a program to reduce controllable urban sources of bacterial indicators based on
currently available information. Significant uncertainties remain considering the state of science
regarding bacterial indicator management in urban environments (e.g., CREST 2007). Additionally,
bacterial indicator sources are not static; e.g. homeless encampments are transitory in nature and the
significance and magnitude of their impacts on water quality may be the function of various factors
including the economy, available social service programs and other factors beyond the MSAR Permittees
control. Similar issues impact irrigation runoff control programs, septic system management programs
and other control programs for potential urban sources of bacterial indicators. Further, the RWQCB has
indicated that it is not their goal to require the elimination of all dry weather runoff to impaired receiving
waters as this may negatively impact other beneficial uses of those receiving waters. The RWQCB prefers
a solution set that does not target the capture and elimination of other flows through the MS4 such as
rising groundwater and water transfers. If the Permittees are to maintain these baseflows through their
MS4 systems, the uncertainty of managing upstream bacterial indicator sources must be addressed.
Section 2 • CBRP Implementation Program
2-11
Therefore, the CBRP includes a compliance strategy to guide decision-making during the implementation
process, and an iterative and adaptive management strategy for making course corrections to the CBRP as
new data are collected and evaluated.
Compliance Strategy
Figure 2-4 illustrates the overall CBRP compliance strategy, consistent with the three CBRP Steps and the
Implementation Actions described above (e.g., Figure 2-1). The CBRP is designed to mitigate controllable4
urban sources of bacterial indicators that cause non-attainment of water quality objectives at the
watershed-wide compliance sites. The CBRP is not intended to address bacterial indicator impairments
attributable to non-MS4 sources (e.g., agricultural or water transfers), or sources that cannot be
accounted for, e.g., wildlife sources or sources that arise from within the impaired waterbody (per
Findings, Sections I.D, and II.E.1 of the MS4 Permit).
Figure 2-4 highlights three key decision points that occur during implementation of the compliance
strategy:
� Decision Point #1 – Distinguish between controllable urban bacterial indicator sources associated
with the MS4 and other potential non-urban sources of bacterial indicator impairment.
� Decision Point #2 – Prioritize MS4 drainage areas for establishment of mitigation alternatives where
MS4 outfalls are determined to be contributing to impairment at watershed-wide compliance sites.
� Decision Point #3 – Select mitigation alternative – non-structural or structural BMPs.
Fundamental to the compliance strategy is the development and implementation of ordinances and
specific BMPs targeted to reduce controllable urban sources of dry weather runoff and bacterial
indicators from the MS4 (Figure 2-4, Box 1). To determine whether controllable urban sources are
present, CBRP Step 1 includes comprehensive urban source evaluation activities to identify sources of dry
weather flows to the MS4, especially those that contain bacterial indicator concentrations and sources
that may cause or contribute to impairment at watershed-wide compliance sites (see Boxes 2 and 3).
The results from urban source evaluation activities lead to the first decision point in the compliance
strategy. The MSAR Permittees will evaluate the potential for MS4 to be contributing controllable sources
of bacterial indicators. Where controllable MS4 sources are identified, those areas of the MS4 remain
under the CBRP (Decision Point #1, Boxes 4 and 5). Where controllable sources are not present and the
MS4 is not the cause of impairment, those areas would be addressed outside of the CBRP (Boxes 12
through 14). Where necessary, the Permittees will work with the RWQCB to identify solutions; however,
in some cases, the RWQCB may need to work with other entities to mitigate bacterial indicator sources.
4 Controllable sources will be defined by the Basin Plan Amendment applicable to recreational uses and
objectives (see Section 1.5.4).

Section 2 • CBRP Implementation Program
2-12
This page intentionally left blank.
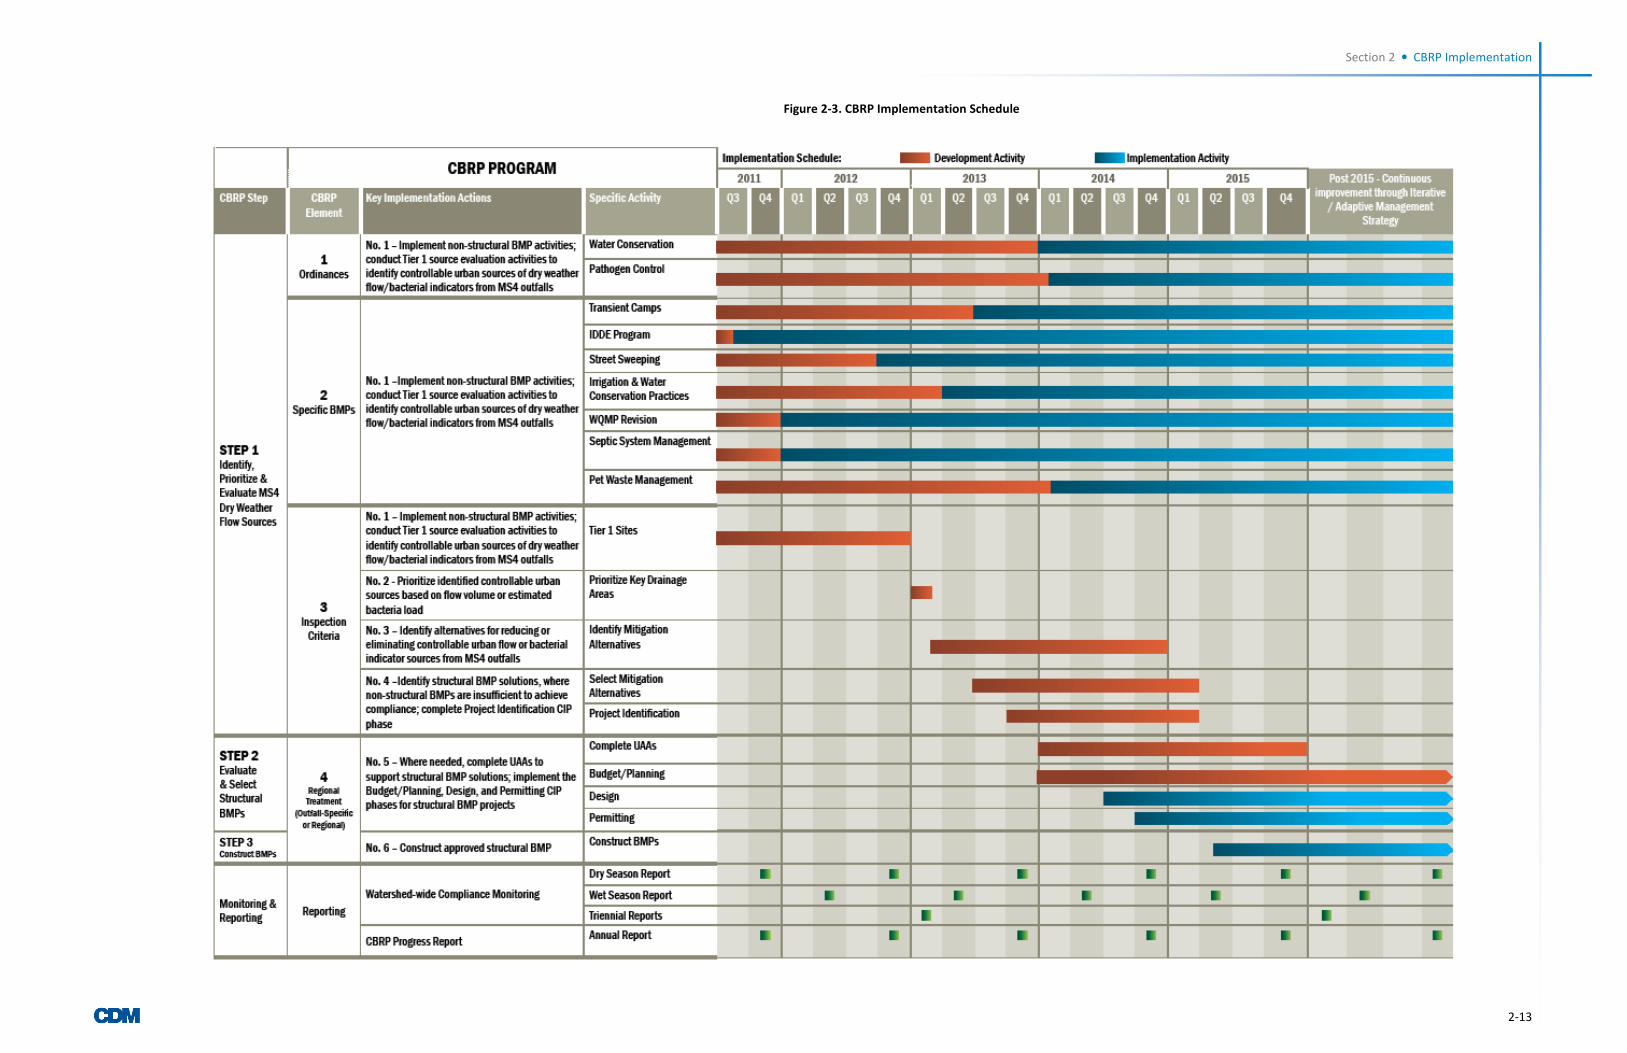
Section 2 • CBRP Implementation
2-13
Figure 2-3. CBRP Implementation Schedule
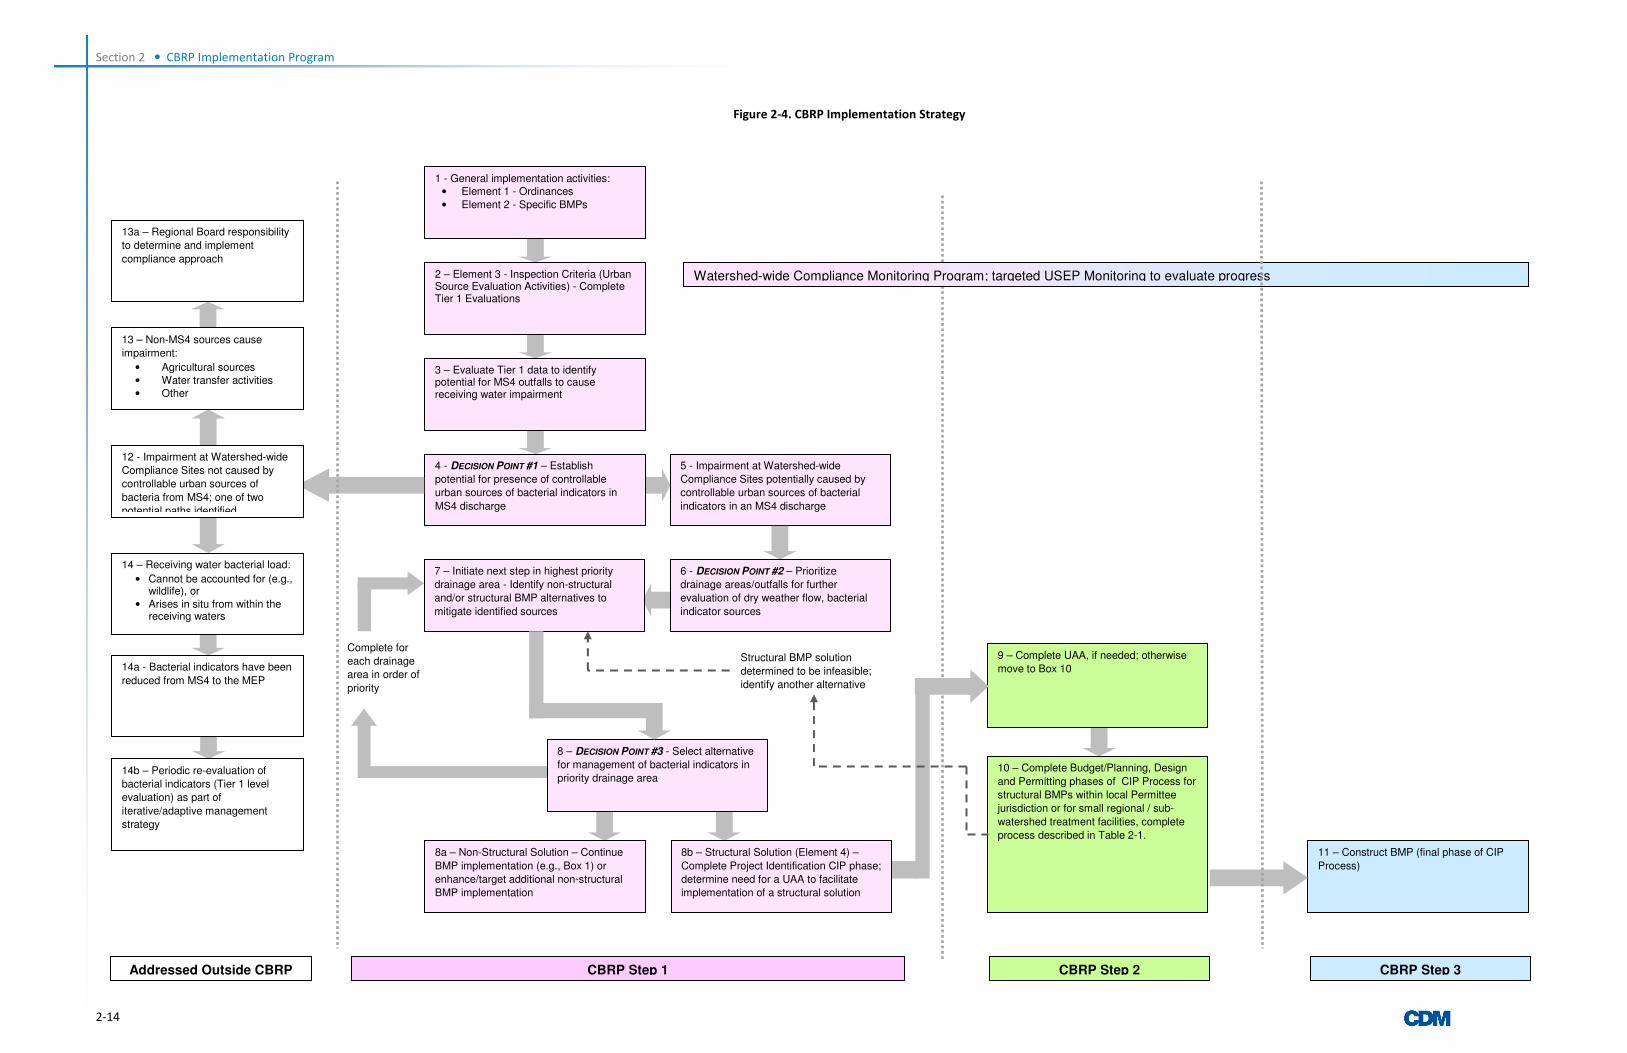
Section 2 • CBRP Implementation Program
2-14
Figure 2-4. CBRP Implementation Strategy
10 – Complete Budget/Planning, Design
and Permitting phases of CIP Process for
structural BMPs within local Permittee
jurisdiction or for small regional / sub-
watershed treatment facilities, complete
process described in Table 2-1.
11 – Construct BMP (final phase of CIP
Process)
Watershed-wide Compliance Monitoring Program; targeted USEP Monitoring to evaluate progress
CBRP Step 2 CBRP Step 3
9 – Complete UAA, if needed; otherwise
move to Box 10
5 - Impairment at Watershed-wide
Compliance Sites potentially caused by
controllable urban sources of bacterial
indicators in an MS4 discharge
7 – Initiate next step in highest priority
drainage area - Identify non-structural
and/or structural BMP alternatives to
mitigate identified sources
8b – Structural Solution (Element 4) –
Complete Project Identification CIP phase;
determine need for a UAA to facilitate
implementation of a structural solution
6 - DECISION POINT #2 – Prioritize
drainage areas/outfalls for further
evaluation of dry weather flow, bacterial
indicator sources
8a – Non-Structural Solution – Continue
BMP implementation (e.g., Box 1) or
enhance/target additional non-structural
BMP implementation
1 - General implementation activities:
• Element 1 - Ordinances
• Element 2 - Specific BMPs
2 – Element 3 - Inspection Criteria (Urban Source Evaluation Activities) - Complete Tier 1 Evaluations
4 - DECISION POINT #1 – Establish
potential for presence of controllable
urban sources of bacterial indicators in
MS4 discharge
3 – Evaluate Tier 1 data to identify potential for MS4 outfalls to cause receiving water impairment
CBRP Step 1
Complete for
each drainage
area in order of
priority
8 – DECISION POINT #3 - Select alternative
for management of bacterial indicators in
priority drainage area
Structural BMP solution
determined to be infeasible;
identify another alternative
12 - Impairment at Watershed-wide
Compliance Sites not caused by
controllable urban sources of
bacteria from MS4; one of two
potential paths identified
13 – Non-MS4 sources cause
impairment:
• Agricultural sources
• Water transfer activities
• Other
14 – Receiving water bacterial load:
• Cannot be accounted for (e.g., wildlife), or
• Arises in situ from within the receiving waters
13a – Regional Board responsibility
to determine and implement
compliance approach
14a - Bacterial indicators have been
reduced from MS4 to the MEP
14b – Periodic re-evaluation of
bacterial indicators (Tier 1 level
evaluation) as part of
iterative/adaptive management
strategy
Addressed Outside CBRP
Section 2 • CBRP Implementation Program
2-15
For MS4 drainage areas that potentially contribute impairment at a watershed-wide compliance site, the
Permittees will evaluate data from source evaluation activities to prioritize drainages areas or outfalls for
continued work. Prioritization of drainage areas/outfalls is Decision Point #2 (Box 6) and critical to
CBRP implementation in an environment with limited resources. Prioritization will consider relative
contribution and source of bacterial indicator loads. Highest priority areas are those where human
sources of bacterial indicators are present and persistent.
Starting with the highest priority drainage area, the Permittees will conduct inspections and source
evaluation activities as needed to identify and evaluate non-structural or structural BMP alternatives to
mitigate sources (Box 7). This effort leads to Decision Point #3 (Box 8) – selection of an alternative to
mitigate the source. If a non-structural solution is available, the Permittees will implement new,
enhanced, or more targeted BMPs. Where a structural solution is deemed necessary – the Permittees
complete the Project Identification phase and determine the need for a UAA to support implementation
of the structural BMP solution. Completion of the Project Identification phase establishes the project
need and directs the project towards the appropriate process for working with local governing bodies or
multi-jurisdictional stakeholders to move the project forward into planning, design and permitting (CBRP
Step 2, Boxes 9 10).
Regardless of the size of the BMP project, implementation of a structural solution under CBRP Step 2 will
require completion of the CEQA/NEPA process, and input from multiple stakeholders (e.g., regulatory
agencies, city councils, environmental advocacy groups, and water supply utilities). Accordingly, from the
time a project need is identified through completion of construction, consideration must be given to
range of regional and local issues, including, but not limited to:
� Technical feasibility to mitigate the bacterial indicator source;
� Regional water supply management plans and objectives;
� Environmental considerations (e.g., CEQA requirements to assess project impacts on issues ranging
from in-stream flow and habitat to energy and greenhouse gas emissions);
� Consideration of alternatives, including use of offset and trading strategies (e.g., a regional project in
one area could provide offsets for overall bacterial indicator reductions needed within another area);
and
� Economic feasibility, which will consider the capital cost and the long term operation and
maintenance cost (which can in some instances exceed the original construction cost over the long-
term).
Where a UAA is identified as a required element to support implementation of a structural BMP project
(Box 9), the UAA will be completed in parallel with efforts to implement the BMP. Once the UAA is
deemed complete by the RWQCB, it is expected that the RWQCB will move the UAA forward through
the basin planning process to obtain approval of the UAA.
Following completion of CBRP Step 2 activities, the project will either move forward to construction, as
funding is available; or be determined to be infeasible. Projects ready for construction are CBRP Step 3
Projects (Box 11). Projects determined to be infeasible will result in the MSAR Permittees returning to
evaluation of other potential mitigation alternatives for the bacterial indicator source (Box 7).
Section 2 • CBRP Implementation Program
2-16
Throughout all CBRP Steps, the Watershed-wide Compliance Monitoring Program will continue at the
five watershed-wide compliance sites. Sample results from these sites along with collected urban source
evaluation data provide the basis for evaluating progress towards compliance with TMDL requirements
under dry weather conditions. Periodic reporting activities will provide the mechanism for evaluating
progress and effectiveness of compliance strategy implementation. Where effectiveness evaluations
identify the need to modify the CBRP, this need will be addressed as part of the iterative and adaptive
management strategy, as described below.
Iterative and Adaptive Management Strategy
This CBRP is based on the current level of knowledge of controllable urban sources of bacterial
indicators. As the CBRP is implemented and new data are generated (especially through source
evaluation activities), it expected that this basic level of knowledge will change. Given this expectation, an
iterative and adaptive management strategy has been built into the CBRP to provide opportunities to
revise the CBRP implementation approach, where appropriate. These opportunities include the following
elements:
� Triennial Reports – The TMDL requires these reports as part of TMDL implementation. These
reports will include an evaluation of CBRP implementation including progress towards meeting
the urban wasteload allocation for dry weather conditions in the dry season. This evaluation may
include recommendations for CBRP revisions to the RWQCB regarding how new data or
programmatic requirements will be incorporated into the CBRP. Two Triennial Reports are
associated with the timeline for CBRP implementation:
- 2013 Report – This report will report on activities completed through 2012. The 2013 Report
will include recommendations for new or revised BMPs.
- 2016 Report – This report (due on February 15, 2016) will evaluate the overall effectiveness of
CBRP implementation and the status of all structural BMP projects in CBRP Steps 2 and 3.
The report will provide the means to determine the extent to which compliance with urban
wasteload allocations for dry weather conditions has been achieved. The 2016 Report will also
provide detailed descriptions of any additional BMPs planned and the schedule for
implementation in the event that water quality data (urban source evaluation activities;
watershed-wide water quality monitoring program) indicate that a reasonable potential still
exists that completed BMPs, as well as BMPs in process (e.g., structural BMPs still moving
through the CIP Process), may not result in compliance with TMDL requirements applicable
to the MS4.
� MS4 Permit Annual Reports –The MS4 permit Annual Report will include a summary of CBRP
implementation activities. This summary will replace the semi-annual USEP reports as a USEP
and MS4 permit reporting requirement. The MS4 Annual Reports will also include
recommendations to the RWQCB for modifications to the CBRP if alternative approaches or
actions are identified that will contribute to the goal to achieve compliance with urban wasteload
allocation during dry weather conditions.
Successful CBRP implementation requires timely input and decisions by the RWQCB so that new
information or outcomes (anything from completion of a UAA to interpretation of dry weather
flow/bacterial indicator data) can be quickly integrated into the decision-making process. This is
especially true for efficient implementation of the compliance strategy. Accordingly, the Principal

Section 2 • CBRP Implementation Program
2-17
Permittee will provide as much advanced notice as possible regarding the need for RWQCB approval of
decisions associated with CBRP implementation and any recommendations for CBRP modification.

3-1
Section 3 Compliance Analysis
3.1 Introduction The MS4 permit requires that the CBRP provide the scientific and technical documentation used
to conclude that the CBRP, once fully implemented, is expected to achieve compliance with the
urban wasteload allocation for indicator bacteria by December 31, 2015 (MS4 permit Section
VI.D.2.a). Compliance targets or wasteload allocations were developed for both fecal coliform
and E. coli bacterial indicators:
� Fecal coliform: 5-sample/30-day Logarithmic Mean less than 180 organisms/ 100 mL and
not more than 10 percent of the samples exceed 360 organisms/100 mL for any 30-day
period.
� E. coli: 5-sample/30-day Logarithmic Mean less than 113 organisms/100 mL and not more
than 10 percent of the samples exceed 212 organisms/100 mL for any 30-day period.
The compliance analysis presented in this section used the 5-sample/30-day logarithmic mean
for E. coli of 113 cfu/100 mL to demonstrate that this plan, once implemented, is expected to
achieve compliance with the urban wasteload allocation. This concentration-based wasteload
allocation for MS4 permittees is a target for all urban sources of flow; however, it would be nearly
impossible to monitor bacteria at all MS4 outfalls. Consequently, compliance with the bacterial
indicator TMDL is assessed at five watershed-wide compliance monitoring locations. No analysis
was done for the Prado Park Lake compliance location as there currently are no known MS4
facilities discharging DWF to the lake. This presumption will be verified during CBRP
implementation.
3.1.1 Overview of Compliance Analysis
The compliance analysis for San Bernardino County MS4 permittees showed that E. coli
concentrations at the compliance monitoring locations are higher than expected based on
measured MS4 and POTW inputs alone. Target reductions in average daily E. coli load (billion
cfu/day) to guide CBRP implementation were determined as a function of two key variables:
� The gap between current average dry season E. coli loads at the compliance monitoring
sites and the load associated with the WQO concentration for E. coli of 126 cfu/100Ml,
and
� The portion of E. coli load that is attributable to measured MS4 inputs .
The data suggest that exceedences of WQOs would continue even after achieving the target load
reduction for discharges from MS4s to Chino Creek or Cucamonga Creek. For this reason,
compliance with the TMDL is demonstrated by showing how the target load reduction could be
achieved with potential implementation of a mix of ordinance enforcement, outdoor water
conservation BMPs, and regional structural BMPs; or by implementing a rigorous inspection
program to isolate sources in small drainages, which could be evaluated for controllability. The
latter is most appropriate for the Chino Creek at Central Avenue and Mill-Cucamonga Creek at

Section 3 • Compliance Analysis
3-2
Chino-Corona Road compliance monitoring sites, where the source contribution analysis described
below shows a substantially greater load that cannot be accounted-for relative to 2007 dry season
USEP measurements at all major MS4 discharges.
3.1.2 Compliance Analysis Approach
The following sections provide detailed description of the methodology employed to demonstrate
compliance with the MSAR Bacterial Indicator TMDL WLA. The analysis involved several key
questions, including:
� What is the relative contribution of urban DWF from MS4 outfalls to receiving waterbodies?
This contribution determines the volume of DWF that is potentially controllable by the MS4
program. See Section 3.2.1.
� What are typical levels of E. coli in urban runoff during dry weather conditions?
Applying a concentration to urban DWF volumes facilitates the computation of the total daily
amount of bacterial indicators (cfu/day) that is potentially controllable by the MS4 program.
See Section 3.2.2.
� How is compliance with the wasteload allocation for MS4 permittees best demonstrated?
See Section 3.3
� To what level must E. coli (cfu/day) from urban sources of DWF from MS4 permittees be
reduced to demonstrate compliance?
This question assesses current bacterial indicator levels at the compliance monitoring
locations in relation to the wasteload allocation in the TMDL. Only the portion of the baseline
bacteria in excess of the TMDL wasteload allocation that are controllable by implementing
BMPs within MS4 systems is targeted for bacteria indicator reduction by MS4 permittees.
Section 3.4 computes this daily bacterial indicator level targeted for removal through CBRP
implementation. Other sources of bacteria to downstream compliance monitoring sites, such
as agricultural land uses, illegal discharges, transient encampments, wildlife, or environmental
growth, are not well understood. The Inspection Program is designed to provide information
to assist the permittees in developing an approach to manage these sources, determined to be
uncontrollable within MS4 systems.
� What level of implementation of proposed CBRP elements would be sufficient to achieve the
targeted daily E. coli (cfu/day) removal?
Section 3.5 discusses the water quality benefits (quantifiable and non-quantifiable) expected
from CBRP implementation.

Section 3 • Compliance Analysis
3-3
3.2 Baseline Dry Weather Flow and Bacterial Indicator Data 3.2.1 DWF Sources to MS4
Regular DWF exist in many MSAR waterbodies. Sources of DWF include:
� Effluent from publicly owned treatment works (POTWs)
� Turnouts of imported water by MWD
� Well blow-offs
� Water transfers
� Groundwater inputs
� Other authorized discharges (as defined by permit)
� Urban water waste from excess irrigation and other outdoor water uses
� Non-permitted discharges
Each of these sources of runoff has a different pathway and potential to transport bacteria to receiving
waterbodies. Thus, it is important to understand the relative role of each of these categories of DWF.
Attachment B provided an overview of dry weather hydrology in the MSAR watershed. This information
provides a basis for the compliance analysis described in this section of the CBRP. Additionally, some
sources of bacteria are not directly related to DWF inputs such as birds and other wildlife within
waterbodies, resuspension of bacteria in channel bottom sediment, air deposition, and transient
encampments.
Flow and bacterial indicator level data are available from several sources for all of the compliance monitoring
locations and most of the major tributaries to the impaired receiving waterbodies. Table 3-1 provides a
summary of the sources of data used to characterize flow and bacterial indicator water quality in the MSAR
Bacterial Indicator TMDL waterbodies and their tributaries.
Within the MSAR watershed there are many MS4 drainage areas that do not typically cause or contribute to
flow at the compliance monitoring locations. DWF at these MS4 outfalls is hydrologically disconnected from
the TMDL receiving waterbodies, by either purposefully recharging groundwater in constructed regional
retention facilities or through losses in earthen channel bottoms, where the recharge capacity of underlying
soils exceeds dry weather runoff generated in upstream drainage areas.
Flow data from these sources characterize the role of DWF from major tributaries and POTW effluent to
baseline flow at the compliance monitoring locations. For each of the compliance monitoring locations,
column 2 in Table 3-2 shows the median of DWF measurements from upstream USEP sites (major
tributaries) and POTW effluent locations in the dry season. These values are determined by summing inputs
from USEP subwatersheds and effluent from upstream POTWs. This approach ensures a balance of runoff
between inflows and outflows. The downstream flow estimates fell within expected ranges based on long-
term daily data collected at USGS gauging stations in the MSAR watershed. As expected, DWF at each of the
compliance monitoring locations consists primarily of POTW effluent (Figure 3-1)

Section 3 • Compliance Analysis
3-4
Table 3-1. Available Data for Characterization Of DWF and Bacterial Indicators in Areas
Draining to Watershed-Wide Compliance Sites
Site Flow Bacterial Indicator Concentration
Downstream: Chino Creek at
Central Ave (WW-C7)
Watershed-wide field measurements 2007-
2009 (n=82)
Watershed-wide compliance monitoring 2007-
2009 (n=82)
POTW Influent Daily effluent at IEUA Carbon Canyon WRRF
(2007 - 2008) Assumed effluent of 2.2 MPN/100 mL
Carbon Canyon Creek
Channel
SBCFCD Little Chino Creek gauge 2843
(2007-2008) USEP samples (n=19)
Chino Creek above Schaeffer U.S. Geological Survey (USGS) Gauge
11073360 (2005-2009) USEP samples at San Antonio Channel (n=19)
Downstream: Mill Creek at
Chino Corona Rd (WW-M5)
USGS Gauge at Merrill Ave 11073495 (2005-
2009)
Watershed-wide compliance monitoring at
Chino-Corona Road 2007-2009 (n=80)
POTW Influent Daily effluent at outfall 001 of IEUA RP1
WRRF (2007 - 2008) Assumed effluent of 2.2 MPN/100 mL
Lower Deer Creek (CHRIS) USEP field measurements samples at CHRIS
(n=17) USEP samples at CHRIS (n=17)
County Line Channel (CLCH) USEP field measurements samples at CLCH
(n=16) USEP samples at CLCH (n=7)
Cucamonga Creek (CUC)
above IEUA RP1 WRRF USEP field measurements at CUC (n=16) USEP samples at CUC (n=16)
Downstream: Santa Ana
River at MWD Crossing (WW-
S1)
USGS Gauge at MWD Crossing 11066460
(2005-2009)
Watershed-wide compliance monitoring at
MWD Crossing 2007-2009 (n=82)
POTW Influent Daily effluent from RIX Facility and Rialto
WWTP (2007 - 2008) Assumed effluent of 2.2 MPN/100 mL
Sunnyslope Channel (SNCH) USEP field measurements at SNCH (n=26) USEP samples at SNCH (n=17)
Box Spring Channel (BXSP) USEP field measurements at BXSP (n=26) USEP samples at BXSP (n=17)
Downstream: Santa Ana
River at Pedley Ave (WW-S4)
Sum of POTW effluent and estimated dry
weather runoff from ANZA, DAY, and SSCH
Watershed-wide compliance monitoring at
Pedley Ave 2007-2009 (n=82)
POTW Influent Daily effluent from RIX Facility, Rialto
WWTP, and Riverside WQCP (2007 - 2008) Assumed effluent of 2.2 MPN/100 mL
Anza Drain (ANZA) USEP field measurements at ANZA (n=19) USEP samples at ANZA (n=18)
Day Creek (DAY) USEP field measurements at DAY (n=13) USEP samples at ANZA (n=13)
San Sevaine Channel (SSCH) USEP field measurements at SSCH (n=13) USEP samples at ANZA (n=13)

Section 3 • Compliance Analysis
3-5
Figure 3-1. Estimated Relative DWF Contributions to Watershed-Wide Compliance Sites
Flow data was not available downstream of some portions of MS4 drainage areas; therefore it was necessary
to approximate DWF from these areas to complete a water balance for each compliance monitoring location.
However, such estimates are confounded by infiltration and rising groundwater conditions in the MSAR
watershed. Within the Chino Basin portion of the MSAR watershed, IEUA measures flow at a number of
locations to quantify groundwater recharge for water supply benefit. Flow measurements, on days when
DWF is predominantly from urban sources, suggest that DWF from urban sources occur at a rate of 100
gal/acre/day in the MSAR watershed, ranging from 20 to 280 gal/acre/day (see Attachment B for summary of
field measured flows). This is consistent with DWF generation rates developed to support the City of Los
Angeles Integrated Resources Plan (2004), which estimated DWF rates from urban watersheds ranging from
zero to 300 gal/acre/day. Thus, it was reasonable to use a rate of 100 gal/acre/day to approximate urban
sources of DWF from “other MS4 areas” that may be contribute some DWF to a TMDL waterbody. The USEP
flow measurements indicated that some tributaries have significantly greater DWF rates per acre of
urbanized drainage area (column 3 of Table 3-2) than would be expected solely from urban sources. In these
cases, the presence of a non-urban source was determined to be responsible for the elevated DWF rates.
Overall, the contribution of runoff during dry weather from urban sources relative to total downstream flow
is very small in all of the TMDL waterbodies. This finding suggests that E. coli in the runoff from urban
sources could be very high, assuming non-urban flows (potable water transfers, groundwater, etc.) and
POTW effluent are largely free of fecal indicator bacteria. Alternatively, wildlife, environmental growth,
recreational uses of receiving waters, or other sources could be significant contributors to impairments at
TMDL waterbodies.
0
10
20
30
40
50
60
70
80
Santa Ana River at MWD Crossing (WW-S1)
Santa Ana River at Pedley Ave (WW-S4)
Chino Creek at Central Ave (WW-C7)
Mill Creek at Chino Corona Rd (WW-M5)
Dry
We
ath
er
Flo
w (
cfs
)
Urban Sources
Non-urban Sources
POTW Effluent

Section 3 • Compliance Analysis
3-6
3.2.2 Bacteria Concentrations
Attachment B summarizes the bacterial indicator concentrations observed at watershed-wide compliance
sites since 2007 and the concentrations observed during the USEP monitoring program implemented in
2007-2008. These data were used to provide baseline data for this compliance analysis.
Table 3-2. Baseline DWF and Bacterial Indicator Concentrations in Areas that Drain to
Watershed-Wide TMDL Compliance Monitoring Sites
Site
1
Hydrologically
Connected
Acres
2
Dry Weather
Flow (cfs)
3
Total Dry
Weather Flow
Generation
(gal/acre/day)
4
Dry Weather
Geometric
Mean of E. coli
(cfu/100 mL)
5
Dry Weather E.
coli (cfu/day)
SAR at MWD Crossing 10,727 73.2 149 267
POTW Influent n/a 68.7 n/a 2 4
Sunnyslope Channel 2,104 2.0 623 183 9
Box Springs Channel 4,193 1.8 279 1,686 75
Other MS4 Areas 4,430 0.9 100 600 3 10
Unaccounted-for Sources 170
SAR at Pedley Avenue 17,921 54.8 149 200
POTW Influent n/a 49.4 n/a 2 3
Anza Drain 6,335 2.6 263 492 31
Day Creek 2,759 0.5 122 577 7
San Sevaine Channel 2,489 1.3 338 320 10
Other MS4 Areas 6,338 1.0 100 600 3 14
Unaccounted-for Sources 135
Chino Creek at Central Ave 17,678 17.8 394 171
POTW Influent n/a 8.8 n/a 2 0
Carbon Canyon Creek Ch. 1,766 6.5 2,396 139 22
San Antonio Channel 5,031 0.7 91 412 7
Other MS4 Areas 10,882 1.7 100 600 3 24
Unaccounted-for Sources 117
Mill-Cucamonga Creek at
Chino-Corona Rd 5,510 30.9 877 662
POTW Influent n/a 27.1 n/a 2 1
Chris Basin (Lower Deer
Ck.) 3,091 0.8 165 868 17
County Line Channel 373 0.1 95 4,053 5
Cucamonga Creek 1,216 2.8 1,472 863 58
Other MS4 Areas 830 0.1 100 600 3 2
Unaccounted-for Sources 578
1) DWF generation up to 100 gal/acre/day is assumed to come from urban sources
2) n/a means value is not applicable
3) Geometric mean of all dry weather E. coli monitoring data from the USEP study

Section 3 • Compliance Analysis
3-7
The geometric mean of all dry weather E. coli concentrations measured at the watershed-wide compliance
locations is shown in column 4 of Table 3-3. Geometric means of dry weather E. coli concentrations at each
USEP site provide an estimate of baseline average daily dry season bacterial indicator levels from the major
subwatersheds draining to each watershed-wide compliance site (column 4 of Table 3-2). These values show
a wide range of observed E. coli concentrations, which suggests that targeted inspection and BMP
implementation, would be an effective approach for mitigating controllable bacterial indicator sources.
Bacterial indicator data was not available downstream of some portions of MS4 drainage areas; therefore it
was necessary to approximate E. coli concentrations from these areas to develop a compliance analysis for
the entire MSAR watershed. For purposes of this compliance analysis, the geometric mean of all dry weather
E. coli monitoring data from the USEP study of ~600 cfu/100 mL provides an initial estimate of bacterial
indicator levels from drainage areas that have no available data. Monitoring of DWF rate and bacterial
indicators downstream of these areas is a key component of the CBRP, and results will update this
compliance analysis once available.
3.2.3 Relative Source Contribution
Relative source contribution analyses were prepared for each of the watershed-wide compliance locations.
This analysis provided a comparison of monitored inputs of flow (Qinflow) and bacterial indicator
concentrations (Cinflow) from MS4 facilities and POTWs with downstream flow (Qcomp) and bacterial indicator
concentrations (Ccomp), as follows:
This type of analysis characterizes the relative role of different flow sources in the watershed on downstream
bacterial indicator concentrations. An important outcome of this analysis is the identification of the level of
bacterial indicators (e) at the compliance locations that cannot be explained by known flow sources within
the watershed (referred to as “unaccounted-for sources”). The presence of an unbalanced set of inputs and
outputs in relation to downstream bacterial indicator levels is not surprising, given the potential for
increases in bacteria indicator levels from illegal and illicit discharges, direct input from wildlife, air
deposition, transient encampments, environmental growth, or resuspension, or decreases in bacterial
indicator levels due to environmental decay or settling.
The relative source contribution showed high amounts of unaccounted-for bacterial indicators at all four
compliance points during DWF in the dry season. The inspection program will evaluate enhance the
characterization of unaccounted-for sources and evaluate whether some portion come from a previously
unmonitored controllable urban source. Figure 3-2 summarizes the relative contribution of bacterial
indicators from various sources based on existing data. Figure 3-2 also shows that the contribution of
bacterial indicators from POTW effluent, assuming a concentration of 2.2 cfu/100 ml is negligible.

Section 3 • Compliance Analysis
3-6
Figure 3-2. Estimated Relative Sources of Bacterial Indicators at Watershed-Wide
Compliance Locations
3.3 Criteria for Demonstrating Compliance Two alternative approaches were considered for demonstrating how implementation of the CBRP
would achieve compliance with urban source wasteload allocations:
� Alternative 1 - Demonstrate that implementation of the CBRP would result in achieving the
wasteload allocation at every outflow to a receiving waterbody. This approach can be achieved
by either:
o Reducing E. coli concentrations at flowing MS4 outfalls to 113 MPN/100 mL or;
o Eliminating DWF from the majority of urban area draining to each outfall.
While this approach may be feasible in small subwatersheds, it may be infeasible to implement
watershed-wide.
� Alternative 2 – If data demonstrate that receiving water impairment is potentially caused by the
MS4, then demonstrate sufficient reduction in controllable urban sources of bacterial indicator
loads in DWF from MS4 facilities to not cause an exceedance of the E. coli WQOs at
downstream watershed-wide compliance monitoring sites. Required bacterial indicator
reductions are determined by comparing baseline E. coli loads at the watershed-wide
compliance sites with the TMDL numeric target (product of DWF at compliance monitoring
site and E. coli concentration equal to the WQO of 126 cfu/100 mL). Figure 3-2 shows that there
are large amounts of unaccounted-for bacterial indicators in some watersheds.
The MSAR Permittees plan to use the second approach to evaluate compliance. This approach allows
for a watershed-wide assessment of bacterial water quality in downstream receiving waterbodies and
0
100
200
300
400
500
600
700
Santa Ana River at MWD Crossing (WW-S1)
Santa Ana River at Pedley Ave (WW-S4)
Chino Creek at Central Ave (WW-C7)
Mill Creek at Chino Corona Rd (WW-M5)
E. co
li(b
illio
n c
fu/d
ay)
Unaccounted-for Sources
POTW Effluent
MS4 Dry Weather Flow

Section 3 • Compliance Analysis
3-7
consideration of the relative role of MS4 sources in downstream receiving waterbody bacterial indicator
water quality.
3.4 Bacterial Indicator Reduction from the MS4 3.4.1 Controllability
The relative source contribution analysis showed that substantial unaccounted-for sources of bacterial
indicators exist in impaired waterbodies. Unaccounted-for sources make up the majority of bacterial
indicators during dry weather at the Chino Creek and Mill-Cucamonga Creek TMDL compliance
monitoring sites (see Figure 3-2). For the Santa Ana River compliance monitoring locations,
approximately two thirds of E. coli is comprised of unaccounted-for sources. For this compliance
analysis, contributions of unaccounted-for sources of bacterial indicators to the TMDL compliance
monitoring sites are not the responsibility of the MS4 permittees. The USEP data used to develop the
source contribution analysis were based on samples collected at the outlet from MS4 systems to
receiving waters; therefore, unaccounted sources of bacteria are not attributable to MS4 inputs from
areas upstream of USEP sites. However, for Tier 1 sites, the inspection program will gather updated data
and assess additional MS4 outfalls not previously monitored in the USEP, which could provide more
insight into these unaccounted-for sources and allow further refinement of MS4 contributions.
3.4.2 Gap Analysis for Bacterial Indicators
Bacterial indicator data collected from each of the watershed-wide TMDL compliance monitoring sites
provide an estimate of existing E. coli concentrations in receiving waters. The magnitude of exceedances
of the TMDL numeric target provides a basis for estimating the E. coli load removal needed from all
sources to reduce current bacterial indicator concentrations to the WQO of 126 MPN/100 mL. Table 3-3
shows the daily amount of E. coli load at each compliance monitoring site based on average of DWF and
bacterial indicator concentration (column 1). The basis for the values in Table 3-3 is geometric means of
dry weather E. coli concentrations and field measurement of flow from the 2007-2008 dry season USEP
monitoring, with a sample size of ~20 for most monitored drainages.
Concentration based TMDL numeric targets equal to the WQO of 126/cfu/100mL were converted to an
E. coli load (column 2). The difference between current E. coli loads at the compliance monitoring sites
(column 1) and the TMDL numeric target load (column 2) is the total bacterial indicator reduction
needed to achieve compliance (column 3). The portion of the current bacterial indicator load at the
compliance monitoring sites attributable to measured MS4 sources is shown as a percentage in column
4 (see Table 3-2 for details). This relative source contribution is applied to the total reduction needed in
column 3 to approximate a target E. coli reduction for MS4 sources (column 5).
Two conditions are apparent from comparing the bacterial indicators coming from the MS4 with the
bacterial indicator reduction needed to achieve compliance:
� E. coli load measured from all upstream MS4 discharges (Table 3-2, column 5) is less than the
load reduction that would reduce bacteria to the numeric targets (Table 3-3, column 3). This
makes it impossible to attain the water quality objective even if MS4 discharges were
eliminated. Available data show this condition exists in both the Mill-Cucamonga and Chino
Creek watersheds. The recommended course of action is then to determine whether the
unaccounted source of bacteria is from a controllable non-urban source (e.g. agriculture, dairy
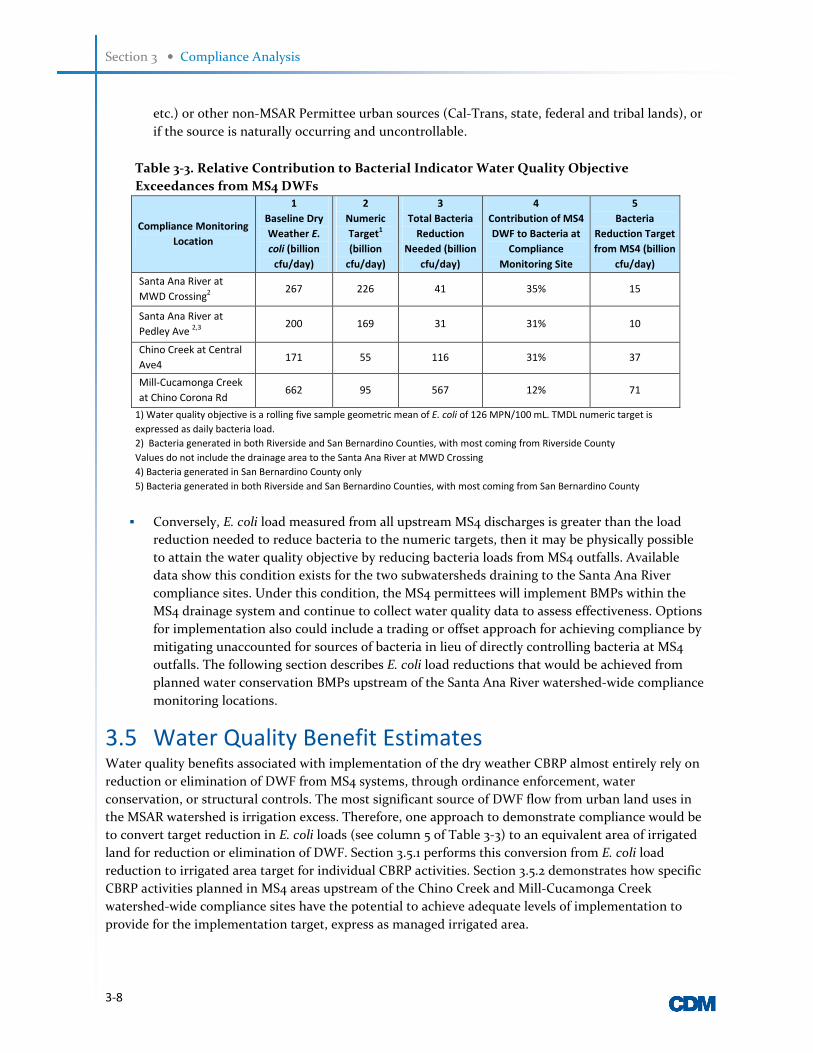
Section 3 • Compliance Analysis
3-8
etc.) or other non-MSAR Permittee urban sources (Cal-Trans, state, federal and tribal lands), or
if the source is naturally occurring and uncontrollable.
� Conversely, E. coli load measured from all upstream MS4 discharges is greater than the load
reduction needed to reduce bacteria to the numeric targets, then it may be physically possible
to attain the water quality objective by reducing bacteria loads from MS4 outfalls. Available
data show this condition exists for the two subwatersheds draining to the Santa Ana River
compliance sites. Under this condition, the MS4 permittees will implement BMPs within the
MS4 drainage system and continue to collect water quality data to assess effectiveness. Options
for implementation also could include a trading or offset approach for achieving compliance by
mitigating unaccounted for sources of bacteria in lieu of directly controlling bacteria at MS4
outfalls. The following section describes E. coli load reductions that would be achieved from
planned water conservation BMPs upstream of the Santa Ana River watershed-wide compliance
monitoring locations.
3.5 Water Quality Benefit Estimates Water quality benefits associated with implementation of the dry weather CBRP almost entirely rely on
reduction or elimination of DWF from MS4 systems, through ordinance enforcement, water
conservation, or structural controls. The most significant source of DWF flow from urban land uses in
the MSAR watershed is irrigation excess. Therefore, one approach to demonstrate compliance would be
to convert target reduction in E. coli loads (see column 5 of Table 3-3) to an equivalent area of irrigated
land for reduction or elimination of DWF. Section 3.5.1 performs this conversion from E. coli load
reduction to irrigated area target for individual CBRP activities. Section 3.5.2 demonstrates how specific
CBRP activities planned in MS4 areas upstream of the Chino Creek and Mill-Cucamonga Creek
watershed-wide compliance sites have the potential to achieve adequate levels of implementation to
provide for the implementation target, express as managed irrigated area.
Table 3-3. Relative Contribution to Bacterial Indicator Water Quality Objective
Exceedances from MS4 DWFs
Compliance Monitoring
Location
1
Baseline Dry
Weather E.
coli (billion
cfu/day)
2
Numeric
Target1
(billion
cfu/day)
3
Total Bacteria
Reduction
Needed (billion
cfu/day)
4
Contribution of MS4
DWF to Bacteria at
Compliance
Monitoring Site
5
Bacteria
Reduction Target
from MS4 (billion
cfu/day)
Santa Ana River at
MWD Crossing2
267 226 41 35% 15
Santa Ana River at
Pedley Ave 2,3
200 169 31 31% 10
Chino Creek at Central
Ave4 171 55 116 31% 37
Mill-Cucamonga Creek
at Chino Corona Rd 662 95 567 12% 71
1) Water quality objective is a rolling five sample geometric mean of E. coli of 126 MPN/100 mL. TMDL numeric target is
expressed as daily bacteria load.
2) Bacteria generated in both Riverside and San Bernardino Counties, with most coming from Riverside County
Values do not include the drainage area to the Santa Ana River at MWD Crossing
4) Bacteria generated in San Bernardino County only
5) Bacteria generated in both Riverside and San Bernardino Counties, with most coming from San Bernardino County
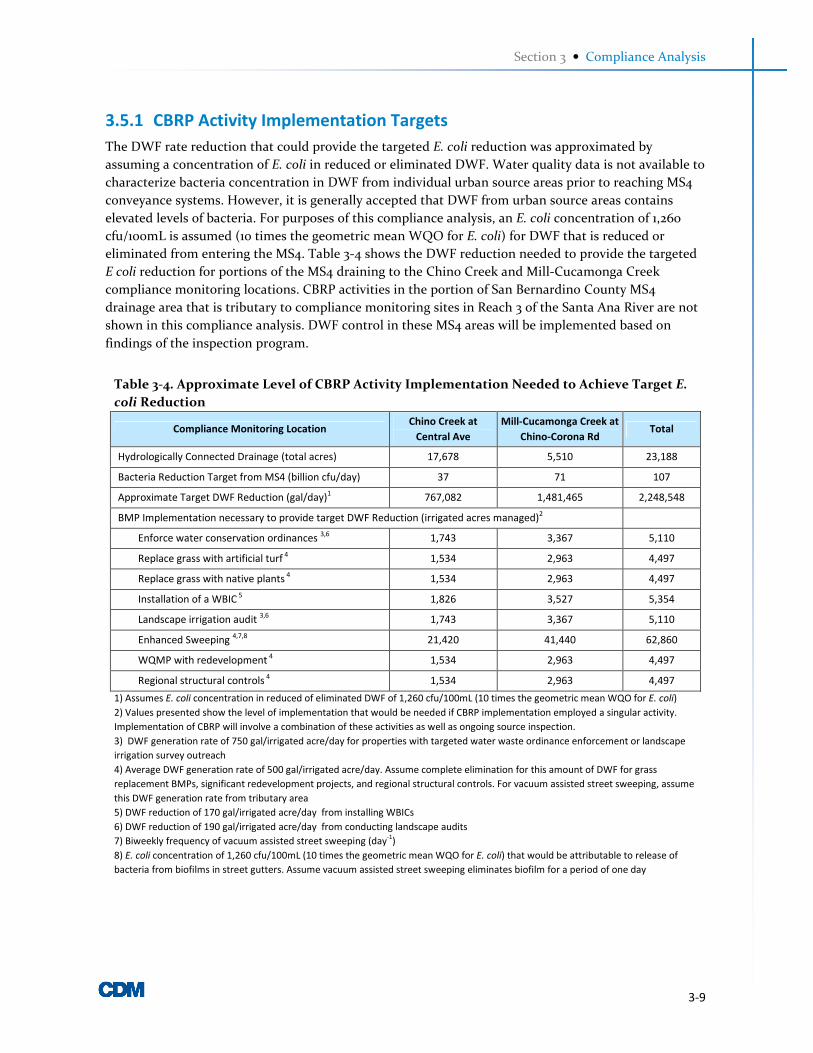
Section 3 • Compliance Analysis
3-9
3.5.1 CBRP Activity Implementation Targets
The DWF rate reduction that could provide the targeted E. coli reduction was approximated by
assuming a concentration of E. coli in reduced or eliminated DWF. Water quality data is not available to
characterize bacteria concentration in DWF from individual urban source areas prior to reaching MS4
conveyance systems. However, it is generally accepted that DWF from urban source areas contains
elevated levels of bacteria. For purposes of this compliance analysis, an E. coli concentration of 1,260
cfu/100mL is assumed (10 times the geometric mean WQO for E. coli) for DWF that is reduced or
eliminated from entering the MS4. Table 3-4 shows the DWF reduction needed to provide the targeted
E coli reduction for portions of the MS4 draining to the Chino Creek and Mill-Cucamonga Creek
compliance monitoring locations. CBRP activities in the portion of San Bernardino County MS4
drainage area that is tributary to compliance monitoring sites in Reach 3 of the Santa Ana River are not
shown in this compliance analysis. DWF control in these MS4 areas will be implemented based on
findings of the inspection program.
Table 3-4. Approximate Level of CBRP Activity Implementation Needed to Achieve Target E.
coli Reduction
Compliance Monitoring Location Chino Creek at
Central Ave
Mill-Cucamonga Creek at
Chino-Corona Rd Total
Hydrologically Connected Drainage (total acres) 17,678 5,510 23,188
Bacteria Reduction Target from MS4 (billion cfu/day) 37 71 107
Approximate Target DWF Reduction (gal/day)1 767,082 1,481,465 2,248,548
BMP Implementation necessary to provide target DWF Reduction (irrigated acres managed)2
Enforce water conservation ordinances 3,6
1,743 3,367 5,110
Replace grass with artificial turf 4
1,534 2,963 4,497
Replace grass with native plants 4
1,534 2,963 4,497
Installation of a WBIC 5
1,826 3,527 5,354
Landscape irrigation audit 3,6
1,743 3,367 5,110
Enhanced Sweeping 4,7,8
21,420 41,440 62,860
WQMP with redevelopment 4
1,534 2,963 4,497
Regional structural controls 4
1,534 2,963 4,497
1) Assumes E. coli concentration in reduced of eliminated DWF of 1,260 cfu/100mL (10 times the geometric mean WQO for E. coli)
2) Values presented show the level of implementation that would be needed if CBRP implementation employed a singular activity.
Implementation of CBRP will involve a combination of these activities as well as ongoing source inspection.
3) DWF generation rate of 750 gal/irrigated acre/day for properties with targeted water waste ordinance enforcement or landscape
irrigation survey outreach
4) Average DWF generation rate of 500 gal/irrigated acre/day. Assume complete elimination for this amount of DWF for grass
replacement BMPs, significant redevelopment projects, and regional structural controls. For vacuum assisted street sweeping, assume
this DWF generation rate from tributary area
5) DWF reduction of 170 gal/irrigated acre/day from installing WBICs
6) DWF reduction of 190 gal/irrigated acre/day from conducting landscape audits
7) Biweekly frequency of vacuum assisted street sweeping (day-1
)
8) E. coli concentration of 1,260 cfu/100mL (10 times the geometric mean WQO for E. coli) that would be attributable to release of
bacteria from biofilms in street gutters. Assume vacuum assisted street sweeping eliminates biofilm for a period of one day
Section 3 • Compliance Analysis
3-10
The types of CBRP activities, described in Section 2 and Attachment C, that will be employed to reduce
or eliminate DWF from entering the MS4 have different effectiveness, therefore levels of
implementation needed to provide the full target DWF reduction are variable. Table 3-4 shows the level
of implementation that would be needed for each CBRP activity if it were to be used for the full DWF
reduction target. Except for enhanced use of vacuum assisted street sweeping, levels of implementation
shown in Table 3-4 do not vary substantially. This analysis indicates that E. coli reduction targets may
be achieved by water waste ordinance enforcement, water conservation BMPs, or structural BMPs
managing roughly 5,000 acres of irrigated area. It is important to note that compliance will be continue
to be measured by water quality monitoring data collected at the watershed-wide compliance
monitoring sites.
The basis used to quantify DWF generation and potential runoff reduction effectiveness of water
conservation BMPs is from a recent study conducted by Metropolitan Water District of Orange County
and Irvine Ranch Water District. The study evaluated the effectiveness of WBICs and landscape
irrigation system audits for residential runoff reduction during dry weather (Jakubowski, 2008). Several
key findings of this study provide estimates of DWF reduction that were used to quantify benefits of
increased use of water conservation BMPs in the MSAR watershed, including:
� Dry weather flow measurements downstream of a residential neighborhood showed
approximately 500 gal/irrigated acre/day . This rate is used to approximate the runoff reduction
benefit of replacing grass lawns with artificial turf or native plants (i.e. no expected runoff
following BMP implementation).
� Education and outreach reduced DWF by ~190 gal/irrigated acre/day. This rate is used to
approximate the runoff reduction from education and outreach BMPs, including an on-site
irrigation audit, and water waste enforcements.
� Installation of a weather based irrigation controller on a large portion of the urban landscape
provided DWF reduction of 170 gal/irrigated acre/day.
Lastly, the effectiveness of street sweeping was quantified by estimating the E. coli load that would not
be picked up as DWF contacts street gutters if biofilm and other bacteria habitats were effectively
removed. Assuming that the release of E. coli from biofilms and other habitats in street gutters is
responsible for adding 1,260 cfu/100 mL of E. coli to DWF as it flows to the MS4, then the target flow for
treatment (not reduction) would be equivalent to other CBRP activities that target DWF from
individual properties. However, the frequency of street sweeping is an important consideration.
Following a sweeping, biofilms and other habitats for bacteria will begin to buildup within the street
gutter. Accordingly, it was assumed that street sweeping is effective at removing sources of bacteria
from gutters for a period of 24 hours. Taking this assumption, a bi-weekly street sweeping program
would need to provide treatment for 14 times the irrigated area as the other proposed CBRP activities, as
shown in Table 3-4.
3.5.2 San Bernardino County MS4 Permittee Compliance
It would be impossible to use just one CBRP activity to address the full E. coli load reduction target that
would address the portion of controllable bacteria from MS4s needed to demonstrate compliance with
the TMDL. The following sections describe several actions that will reduce E. coli loads during the dry
season in Chino and Cucamonga Creeks.

Section 3 • Compliance Analysis
3-11
Outdoor Water Conservation BMPs
Urban water management plans (UWMPs) for water purveyors serving areas within the MS4 drainages
responsible for most urban DWF in Chino and Cucamonga Creeks incorporate outdoor water use
conservation BMPs that will also provide DWF reduction benefits (drafts of 2010 UWMPs for Cities of
Chino and Ontario, and Monte Vista Water District). The Water Conservation Bill of 2009 sets new
performance requirements for gross per capita water demand (GPCD), with the primary goal of
reducing statewide water use by 20 percent by 2020. Water agencies throughout the State of California
are planning to implement a combination of recycled water use and water conservation BMPs to meet
their respective urban water use targets for GPCD. By the year 2015, water agencies must show 50
percent progress toward achieving the final 2020 urban water use target GPCD. Estimates of the
targeted irrigated area for outdoor water conservation BMPs by each water agency within the MS4
drainages responsible for most urban DWF in Chino and Cucamonga Creeks are summarized in Table
3-5. These estimates show that potential outdoor water conservation BMPs could provide most of the
target E. coli load reduction by 2020 and about half of the target by 2015. This analysis is subject to
change as the water agencies develop their respective programs aimed to reduce urban per capita water
demand. MS4 permittees will collaborate with the water agencies to support use of outdoor water use
conservation approaches to meeting the new 20 percent by 2020 requirements.
Mill Creek Wetland Project
One regional facility is planned for implementation within San Bernardino County at the downstream
end of the concrete lined section of Cucamonga Creek. This project would capture a portion of DWF
from the entire watershed to the Mill-Cucamonga Creek at Chino-Corona Road (WW-M5) compliance
monitoring site, and therefore has the potential to provide reduction in bacterial indicators. The project
would divert DWF from the concrete lined channel to a debris basin northwest of the Chino-Corona
Bridge over Mill-Cucamonga Creek and then under Chino Corona Road into a series of basins
(Stephenson and Susilo 2009). The basins would be operated as free surface wetlands during dry
weather to provide a hydraulic residence time of seven days. The treated DWF would then be
discharged back to Mill-Cucamonga Creek, about 0.5 miles downstream of Chino-Corona Road. During
Table 3-5. Estimate of Irrigated Area Addressed by Potential Water Agency Implementation
of Outdoor Water Conservation BMPs Planned for Compliance with 20x2020 Requirement
Agency 2020
Population1
Current
(GPCD)1
2020 Urban Water
Use Target
(GPCD)1
Projected Outdoor
Water Use Savings
(AFY)2
Targeted
Outdoor Water
Demand (AFY)3
Approximate
Irrigated Area
(acres)4,5
City of Ontario 246,304 240 198 1,400 13,500 2,000
Monte Vista
Water District 56,555 229 190 400 3,900 600
City of Chino 84,806 237 189 1,300 13,300 1,900
Total 3,100 30,800 4,500
1) Source: Draft 2010 Urban Water Management Plans (UWMPs) for listed water agencies.
2) Assumes 70 percent of per capita demand reduction not achieved by new recycled water use comes from conservation BMPs that
target outdoor water waste.
3) Water conservation savings of 20 percent is assumed for outdoor water conservation BMPs
4) Irrigation demand of 55 in/yr based on CIMIS Station 44 at UC Riverside
5) Excess irrigation water use factor of 1.5 for implementation actions targeting top users

Section 3 • Compliance Analysis
3-12
wet weather, water level rise within the basins would result in the basins functioning as extended
detention or wet ponds. The DWF that would be diverted is not yet determined, and will be influenced
by the need to maintain existing habitat areas within Mill-Cucamonga Creek, between Hellman Avenue
and ~0.5 miles downstream of Chino-Corona Road.
Preliminary estimates of E. coli load reduction potential for the Mill Creek Wetland project were
developed based on an assumed removal effectiveness of 50 percent. This removal efficiency is
conservative relative to literature values, which suggest removal in excess of 85 percent in several well-
designed systems (SAWPA, 2009). If designed to treat approximately 7 cfs of DWF, this project could
provide downstream E. coli load reduction of the MS4 target of 71 billion cfu/day.
The City of Ontario will fund a portion of this project through fees for the ~3,000 acre, New Model
Colony development, located within the upstream drainage area. The project team is currently
preparing grant proposals for the remaining funds needed to implement the proposed project concept.
In addition to identifying funding, implementation of this project is subject to CEQA as well as other
potential regulatory constraints.
Redevelopment
Redevelopment in the MSAR watershed prior to the December 31, 2015 compliance date may occur in
0.5 percent of the hydrologically connected MS4 drainage area. (23,200 urban acres * 0.005 = 116 acres of
redevelopment). Assuming 30 percent of land cover on properties that will be redeveloped had been
irrigated, then the CBRP benefit of implementing updated development planning requirements is 35
acres of irrigated area. This estimate is low relative to historical development rates, but redevelopment
in the 2010-2015 time-period is expected to be reduced due to economic factors.
Other Activities
The CBRP also includes other recommended specific BMPs that have the potential to reduce bacterial
indicator levels from urban DWF (see Attachment C). While these BMPs have been included to address
potential urban bacterial indicator sources, the ability to quantify water quality benefits is greatly
limited. For example, transient camps may be an important bacterial indicator source in certain areas,
but the benefits of mitigation are unknown since studies have not been done to evaluate the water
quality impacts of such camps under dry weather conditions. Given such limitation, the water quality
benefits were not quantified. However, the potential reductions in bacterial indicator levels that will be
achieved from implementing these BMPs provide an additional margin of safety toward achieving urban
wasteload allocation by the compliance date.
3.5.3 Role of Inspection Program in Achieving Compliance
The inspection program involves rigorous monitoring of flow, bacterial indicators, and human sources
of fecal bacteria indicators (using human Bacteroides markers) at key locations in the MS4. The purpose
of conducting such monitoring activities is to identify smaller portions of MS4 drainage areas that may
be responsible for a disproportionate amount of bacterial indicators (referred to as a “hot spot”). The
temporal variability of available bacteria indicator levels from downstream monitoring sites (from both
the USEP study and watershed-wide compliance monitoring) suggests that in some drainage areas,
urban sources may be contributing to increases in downstream bacterial indicator levels. However,
because of the high percentage of unaccounted-for sources of bacterial indicators apparent in the

Section 3 • Compliance Analysis
3-13
system, to what degree the MS4 is a contributor to elevated bacterial indicator levels needs to be
evaluated.
The inspection program provides a means to identify urban sources and target mitigation activities. For
instance, an MS4 outfall may be determined to be consistently dry or to contain a lower E. coli level
than expected. If so, there would be no need to implement upstream BMPs for the purposes of reducing
bacterial indicators. At the same time, the inspection program could identify drainage areas that
generate DWF and have bacterial indicators at levels greater than was assumed in this quantification
effort. Targeted BMPs within the watershed upstream would be prioritized and would likely provide
more benefit than is estimated in this compliance analysis. Accordingly, the inspection program
provides the information necessary to use an iterative adaptive watershed management approach,
which allows for the best use of resources to mitigate urban bacterial indicator sources. Moreover, data
collected under the inspection program will provide the means to improve the basis for the relative
source contribution analysis for bacterial indicators in receiving waterbodies..


Section 3 • Compliance Analysis
4-1
Section 4 Wet Weather Condition Program
The requirements for development of a dry weather condition CBRP include establishing a
schedule for developing a wet weather condition CBRP (November 1st through March 31st) to
comply with urban wasteload allocations for indicator bacteria by December 31, 2025.
The Regional Board will issue the next MS4 permit on or after January 29, 2015 when the
existing MS4 permit expires. Similar to the requirements contained in the existing MS4
permit, it is recommended that the next MS4 permit include a requirement to develop a
CBRP for wet weather conditions. Given the expected challenges associated with compliance
with wasteload allocations under wet weather conditions, the wet weather CBRP will require
more time to develop. Accordingly, the earliest a draft wet weather condition CBRP will be
submitted to the Regional Board for review will be 24 months following adoption of the next
MS4 permit.


