Climate Change Impacts in the Caribbean
Carlos FullerDeputy Director
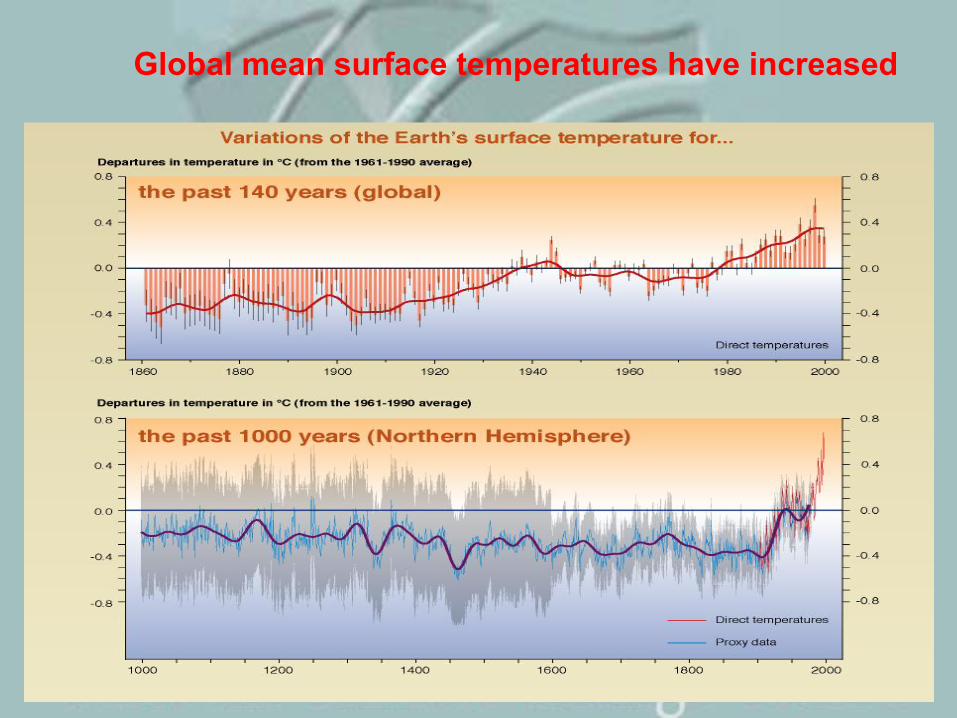
Global mean surface temperatures have increased
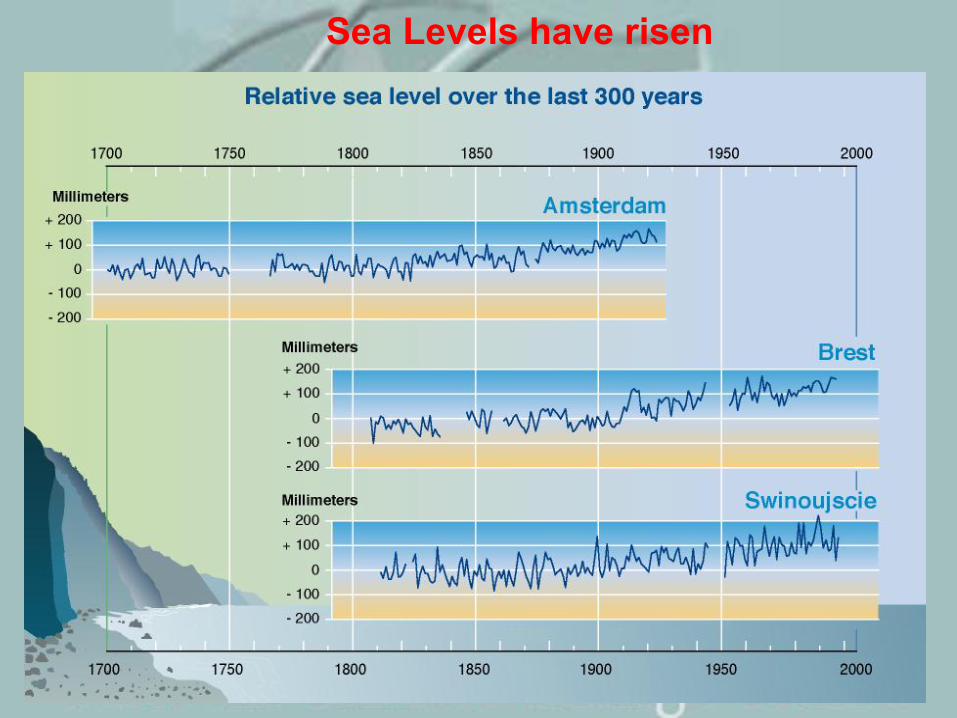
Sea Levels have risen

The Land and Oceans have warmed

Precipitation patterns have changed
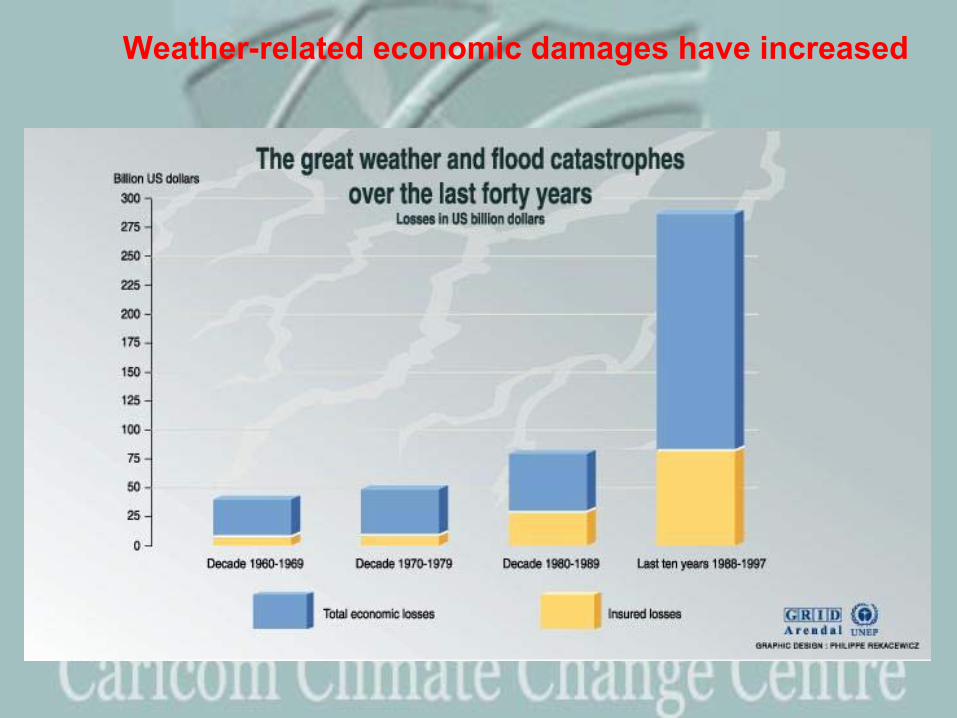
Weather-related economic damages have increased
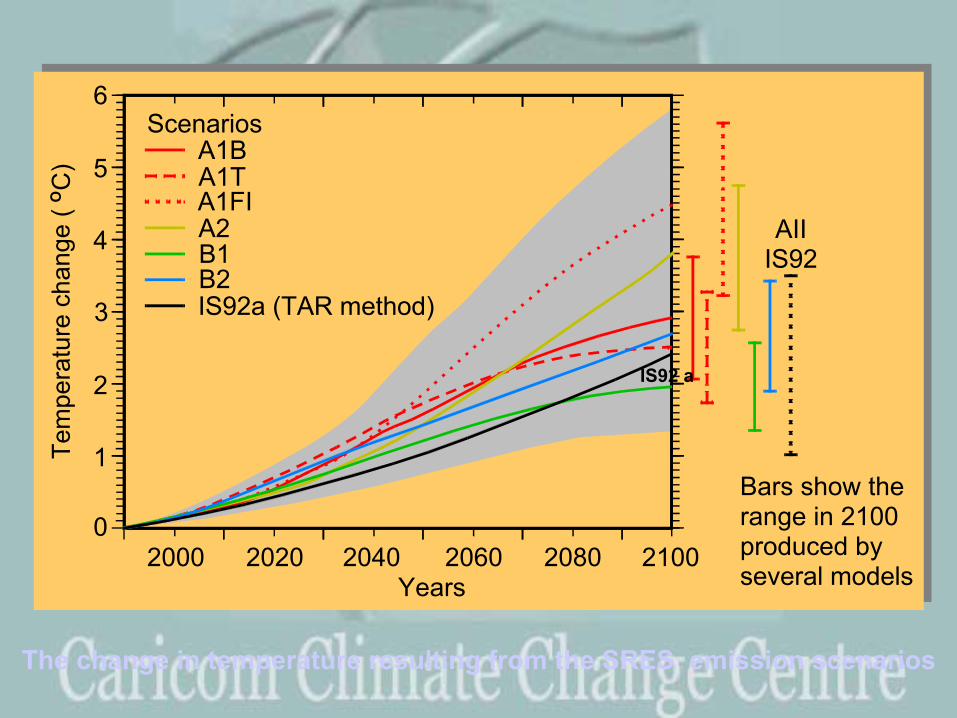
The change in temperature resulting from the SRES emission scenarios
6
5
4
3
2
1
02000 2020 2040
ScenariosA1BA1TA1FIA2B1B2IS92a (TAR method)
Tem
pera
ture
cha
nge
(OC
)
Years2060 2080 2100
AIIIS92
Bars show the range in 2100produced byseveral models
IS92 a

The projected sea level change
1.0
2000 2020 2040 2060 2080
A1BA1TA1FIA2B1B2
Sea
leve
l ris
e (m
)
Year
All SRES envelopeincluding land-iceuncertainty
0.8
0.6
0.4
0.2
0.0
Scenarios
2100
AIIIS92
Bars show therange in 2100produced by several models
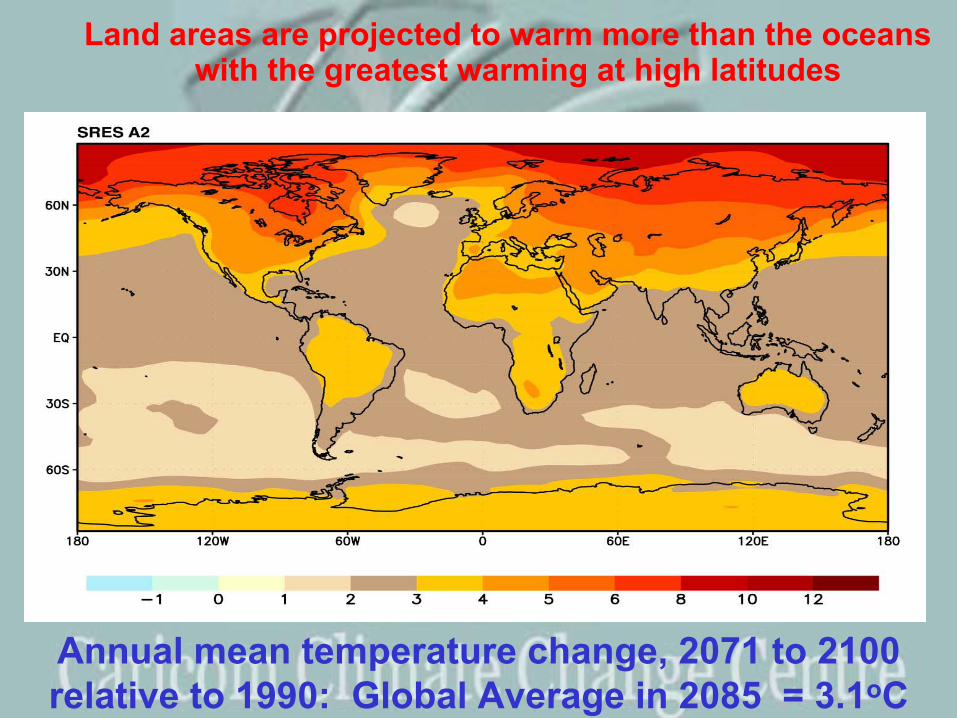
Land areas are projected to warm more than the oceans with the greatest warming at high latitudes
Annual mean temperature change, 2071 to 2100 relative to 1990: Global Average in 2085 = 3.1oC
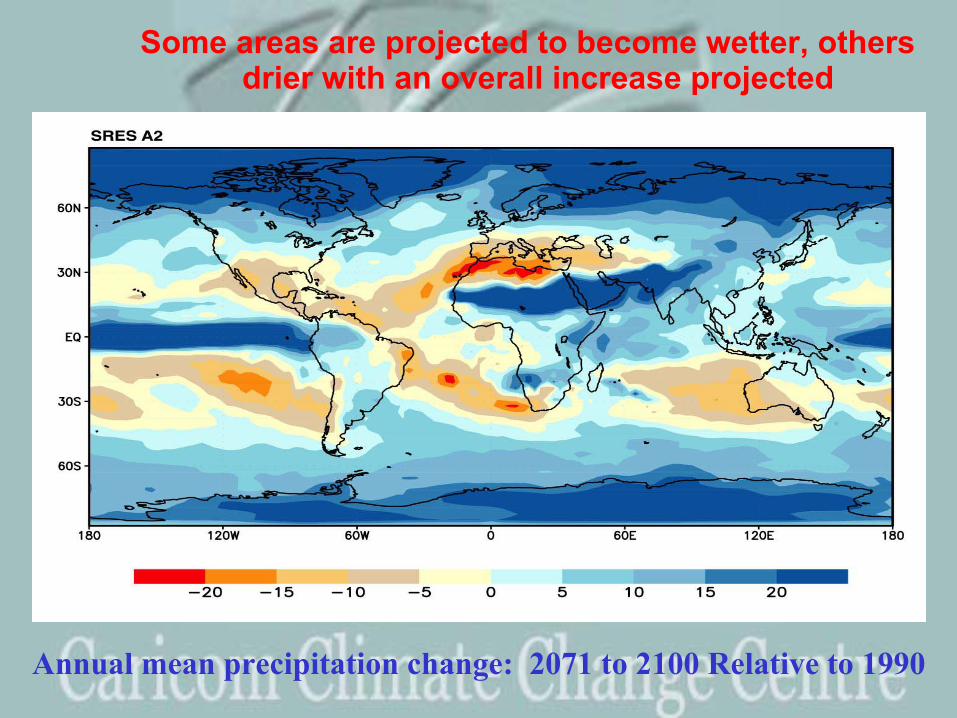
Some areas are projected to become wetter, others drier with an overall increase projected
Annual mean precipitation change: 2071 to 2100 Relative to 1990
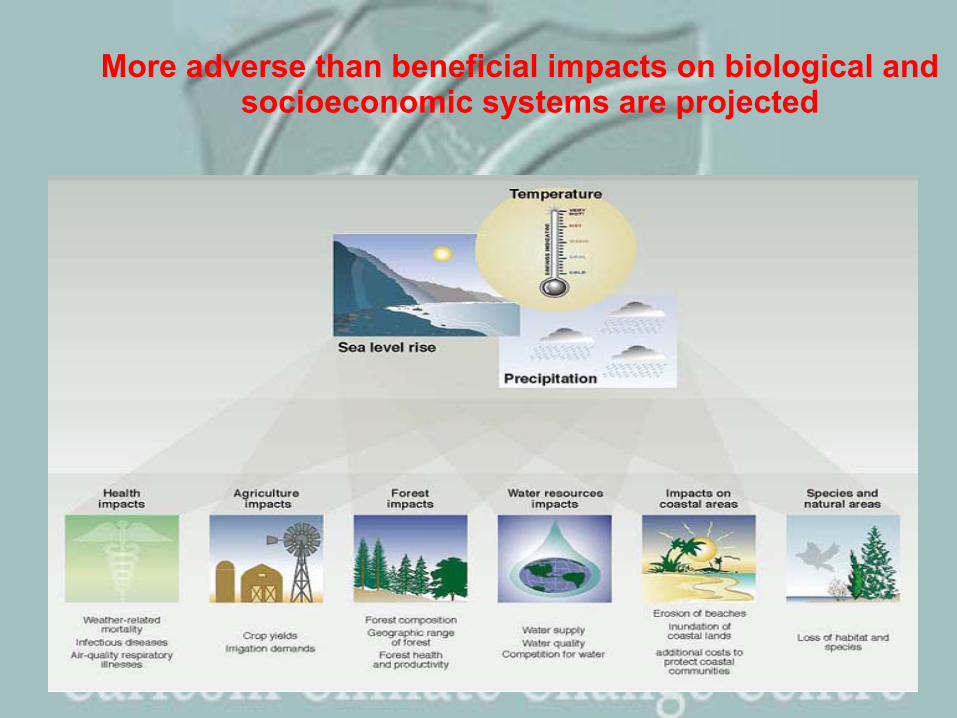
More adverse than beneficial impacts on biological and socioeconomic systems are projected
Climate in the 20th Century
● Average temperature increased by 1 degree Celsius
● Mean sea level increased by 2 mm per year

Projections in 21st Century
-49.3 to +28.9
-36.3 to +34.2
-14.2 to +13.7
Change in precipitation ( %)
0.94 – 4.180.79 – 2.450.48 – 1.06 Temp increase (degrees Celsius)
2070 - 20992040 - 20692010 - 2039
Sea level will rise by 5 mm per year
Max & Min temps increasing, cold nights decreasing
Consecutive dry days inc. while no. of heavy rainfall events inc.

Impacts
● A 0.5 m rise in sea level will result in 38% of beach loss
● 1/3 of turtle nesting habitat will be lost● Coral bleaching could become annual or bi-
annual without an increase in coral tolerance of 0.2 to 1.0 degrees Celsius
● Sea surface temp – increased incidences of ciguatera in fish
● Forest mortality of 5.2% per annum− 7 times higher than non hurricane periods

Water Security:–Salt water intrusion–Less rainfall–More evaporation
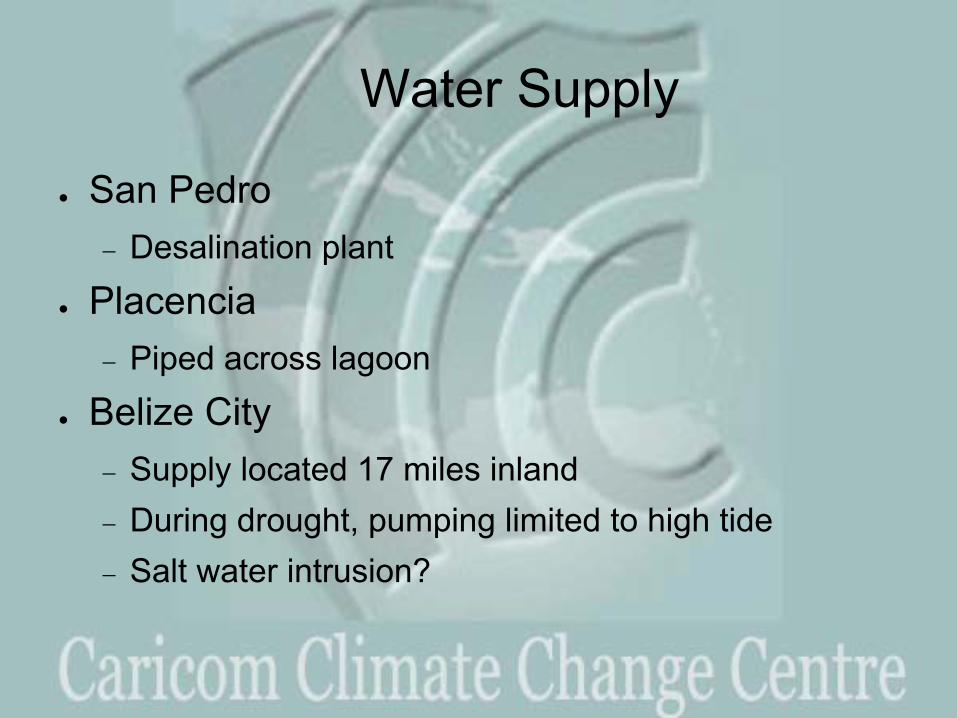
Water Supply
● San Pedro− Desalination plant
● Placencia− Piped across lagoon
● Belize City− Supply located 17 miles inland− During drought, pumping limited to high tide− Salt water intrusion?
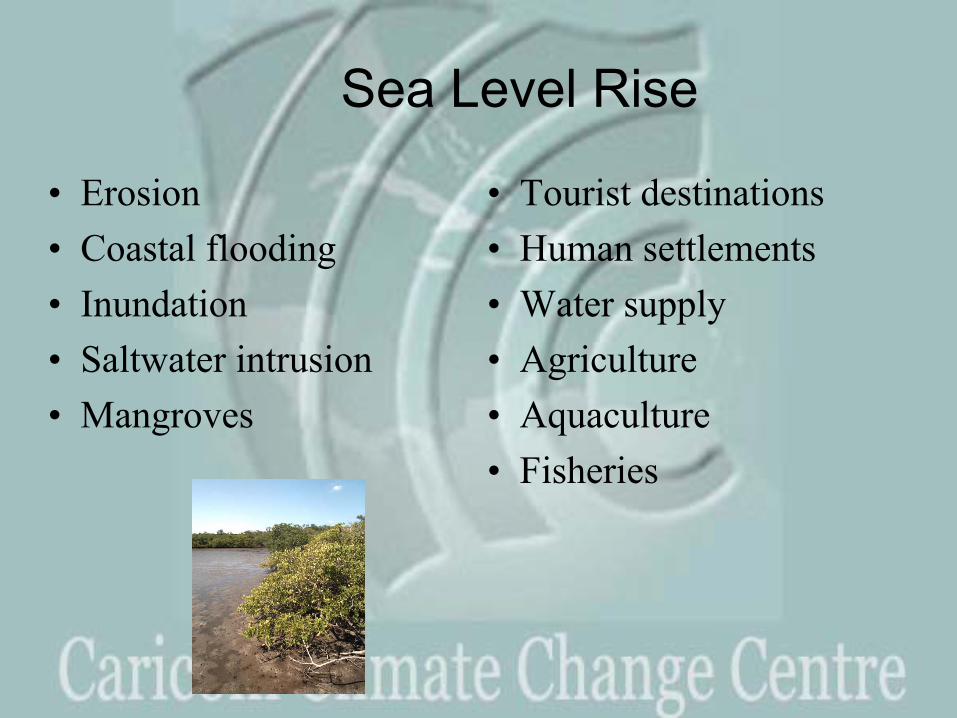
Sea Level Rise
• Erosion• Coastal flooding• Inundation• Saltwater intrusion• Mangroves
• Tourist destinations• Human settlements• Water supply• Agriculture• Aquaculture• Fisheries
AVVA Vulnerability Analysis
● Entire coastline videotaped and analyzed in 1995
● Sea level rise of 4, 30 and 50 cm.● Time periods of 25, 50 and 100 yrs.● Little impact in 25 yrs● 50-100% of beaches lost in 100 yrs

Branching coral Brain coral
coral bleaching events are expected to increase
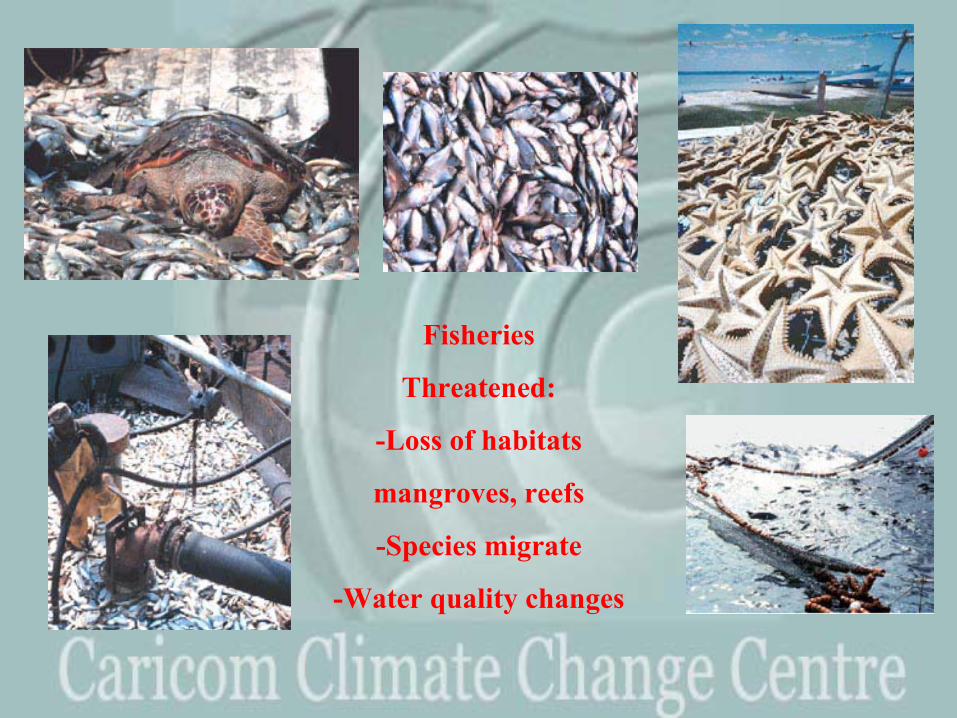
Fisheries
Threatened:
-Loss of habitats
mangroves, reefs
-Species migrate
-Water quality changes
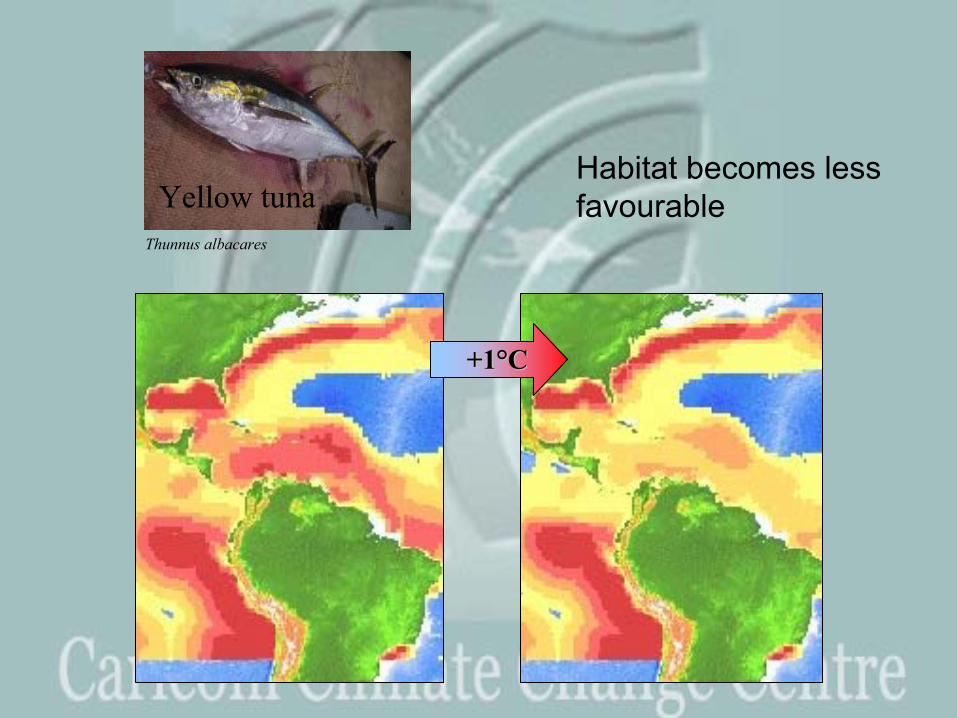
Yellow tunaThunnus albacares
Habitat becomes lessfavourable
+1+1°°CC
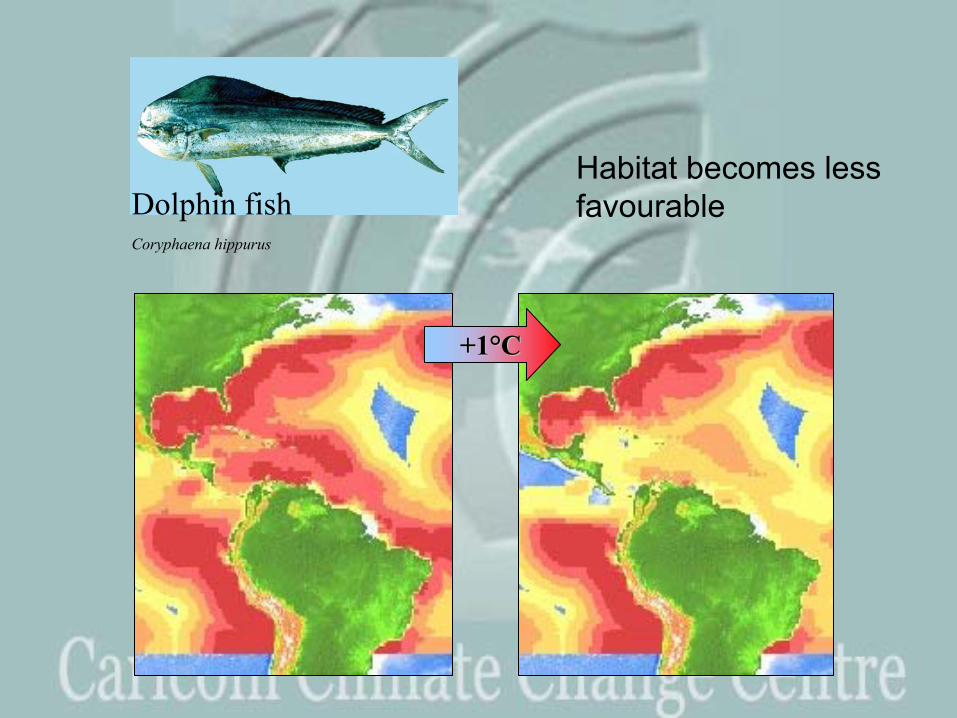
Dolphin fishCoryphaena hippurus
Habitat becomes lessfavourable
+1+1°°CC
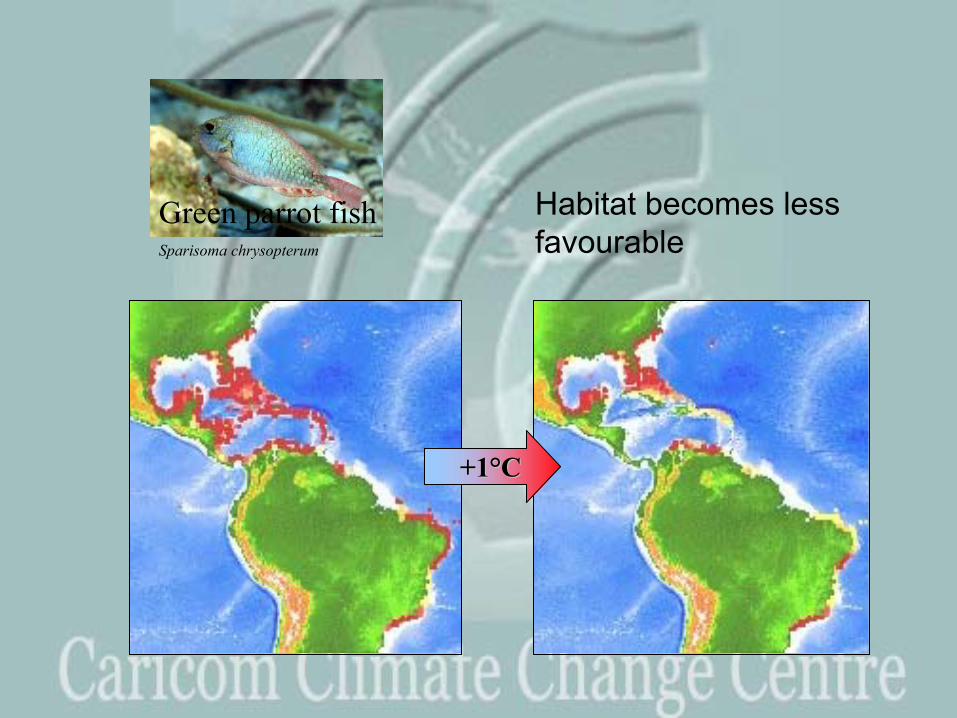
Green parrot fishSparisoma chrysopterum
Habitat becomes lessfavourable
+1+1°°CC
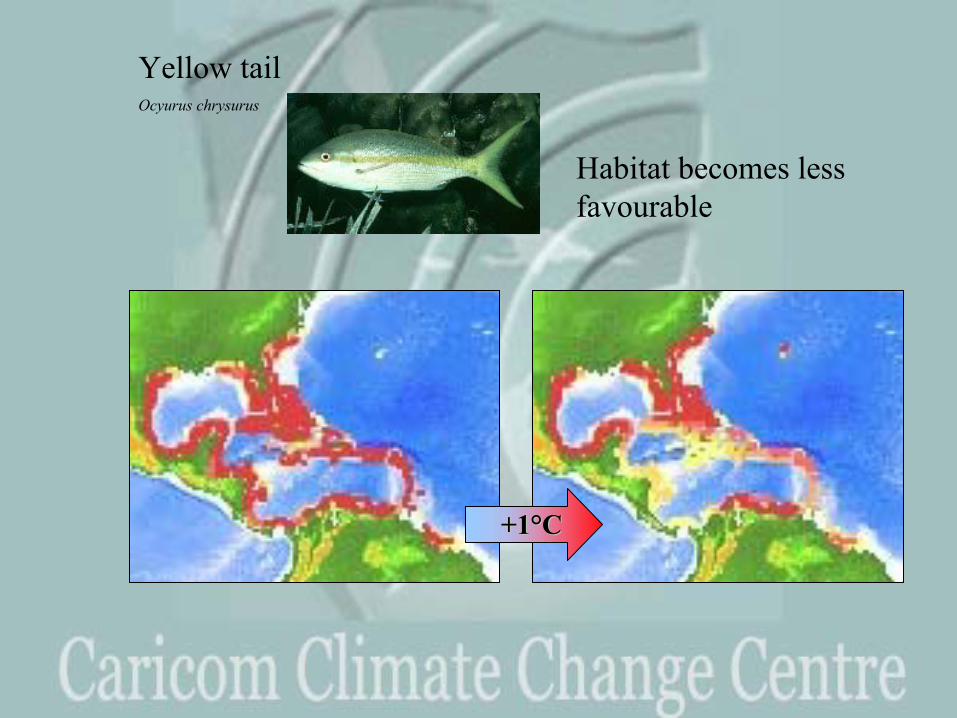
Yellow tailOcyurus chrysurus
Habitat becomes lessfavourable
+1+1°°CC
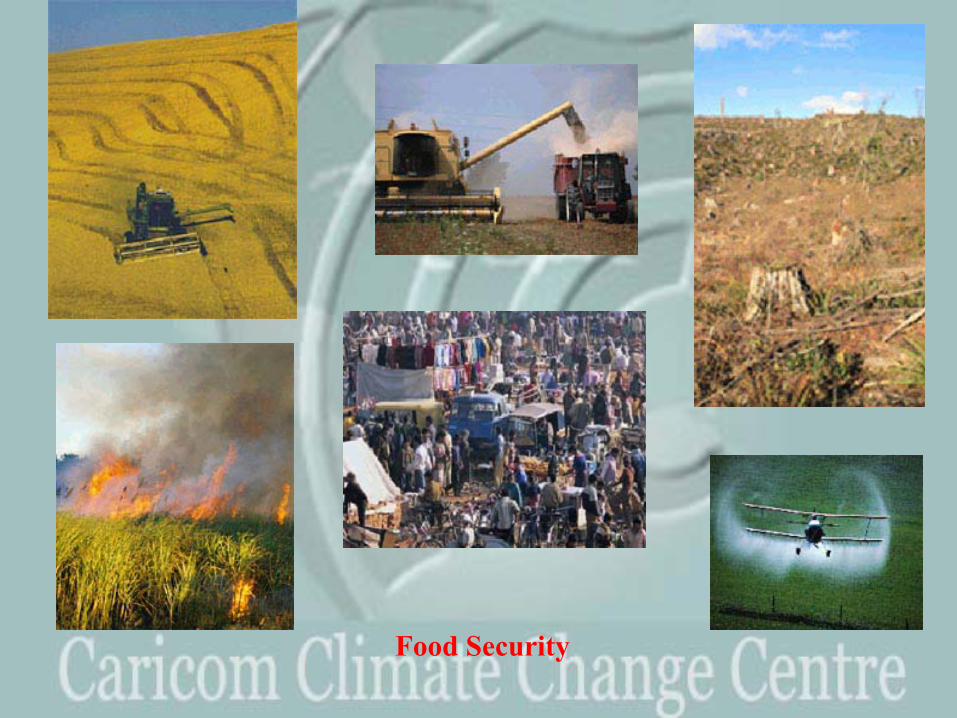
Food Security

Vulnerability Studies in Agriculture
● 1995● DSSAT● Beans, corn and rice● 1-2°C rise in temp● ± 10-20% change in precipitation
● Result: 10-20% decline in yields
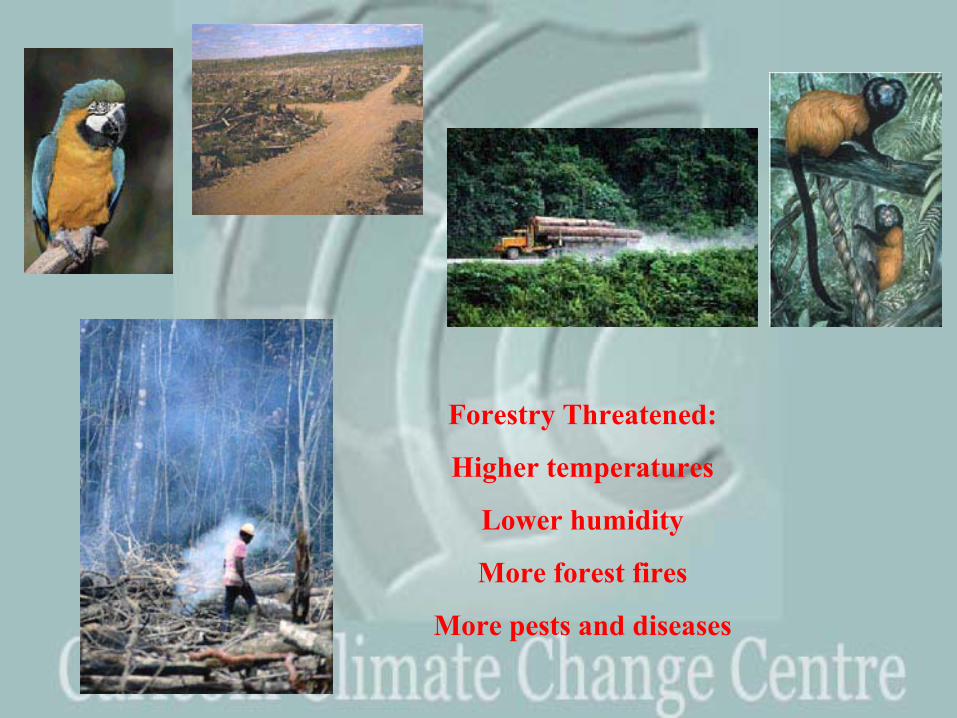
Forestry Threatened:
Higher temperatures
Lower humidity
More forest fires
More pests and diseases

Forestry
● 1999-2000● Pine bark beetle infestation● 75% of pine forest destroyed● High temperatures & high humidity● Poor management● Climate change signal?● Impacts on timber industry and biodiversity● Contributes to emissions

Loss of Biodiversity
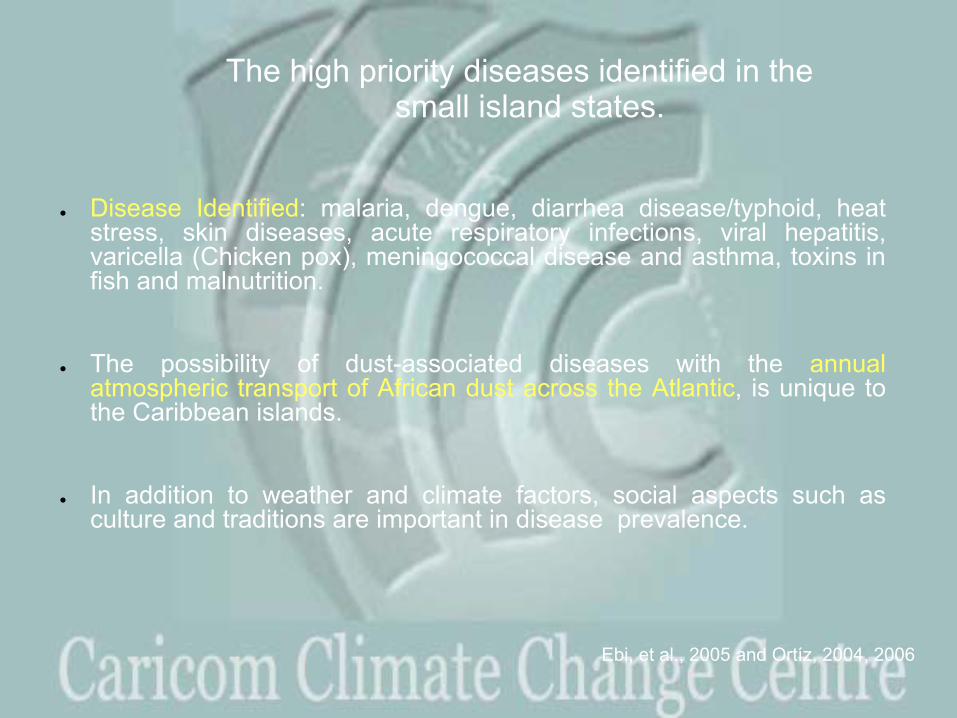
The high priority diseases identified in the small island states.
● Disease Identified: malaria, dengue, diarrhea disease/typhoid, heat stress, skin diseases, acute respiratory infections, viral hepatitis, varicella (Chicken pox), meningococcal disease and asthma, toxins in fish and malnutrition.
● The possibility of dust-associated diseases with the annual atmospheric transport of African dust across the Atlantic, is unique to the Caribbean islands.
● In addition to weather and climate factors, social aspects such as culture and traditions are important in disease prevalence.
Ebi, et al., 2005 and Ortíz, 2004, 2006

Variability and trend of average yearly UV incidence due to cloud cover and total ozone changes in Havana during theperiod 1979-1993
D o s i s U V e r y m e d i a a n u a l L a H a b a n a 1 9 7 9 - 1 9 9 3
T r e n d l in e a l ± 2 S D = - 3 1 ,0 ± 1 1 ,6
R 2 = 0 ,6 8 8 ; R = 0 ,8 2 9
3 6 0 0
3 8 0 0
4 0 0 0
4 2 0 0
4 4 0 0
4 6 0 0
1 9 7 9 1 9 8 1 1 9 8 3 1 9 8 5 1 9 8 7 1 9 8 9 1 9 9 1 1 9 9 3
Y e a r
Dos
is U
Very
(J
/m*m
)
Average annual UV increasedsignificantlyin agreementwith thetrend ofdecrease in cloud cover.This resultsare consistentwith theobservedtrends by satellite in the regionduring 1979-1998
Limitations
● Resolution of models: 400 – 125 km.● Small islands do not appear● Projections are over water not land● Very little work in downscaling● Some climatic processes are not well understood (eg.
mid-summer drought)● Insufficient information on sea surface temperature● Less scientific literature available to IPCC to prepare 4th
Assessment Report than the 3rd Assessment Report
Challenges
● Limited size, prone to natural hazards and external shocks enhance vulnerability
● Low adaptive capacity and high costs● 50% of population live within 1.5 km of coastline● International airports, roads, capitals on coast● Stresses: terms of trade, impacts of globalization,
financial crises, international conflicts, rising external debts, rapid population growth, rising poverty, political instability, unemployment, reduced social cohesion, widening gap between rich and poor

Requirements
● Downscaling of global climate models● Vulnerability assessments using objective techniques● Integrated assessment models required
− Fisheries: spawning sites, migratory patterns, habitats at various life cycles, changes in sea temperature and water quality
● Scientific work published in peer reviewed literature● National Climate Change Policies and Action Plans


