
Card Loyalty Systems Technology Analysis Abstract*
June 2013
CEB TOWERGROUP
RETAIL BANKING PRACTICE
Brian Riley Senior Research Director, Retail Banking
Vendor Assessment and Quantitative Teams
* For full copies please contact Stacy Berman at TowerGroup

2 © 2013 The Corporate Executive Board Company. All Rights Reserved.
RETAIL BANKING PRACTICE
Executive Director
Aaron Kissel
Managing Director
Jaime Roca
Senior Research Director
Brian Riley
VENDOR ASSESSMENT TEAM
Project Manager
Kevin Wu
Research Analyst
Helen McCann
QUANTITATIVE INSIGHT TEAM
Project Manager
Carolina Valencia
Research Analyst
Ed McDonald
COPIES AND COPYRIGHT
As always, members are welcome to an unlimited number of copies
of the materials contained within this handout. Furthermore, members
may copy any graphic herein for their own internal purpose. The
Corporate Executive Board Company requests only that members
retain the copyright mark on all pages produced. Please contact
your Member Support Center at
+1-866-913-6450 for any help we may provide.
The pages herein are the property of The Corporate Executive
Board Company. Beyond the membership, no copyrighted materials
of The Corporate Executive Board may be reproduced without prior
approval.
LEGAL CAVEAT
CEB TowerGroup has worked to ensure the accuracy of the information
it provides to its members. This report relies upon data obtained from
many sources, however, and CEB TowerGroup cannot guarantee the
accuracy of the information or its analysis in all cases. Furthermore, CEB
TowerGroup is not engaged in rendering legal, accounting, or other
professional services. Its reports should not be construed as professional
advice on any particular set of facts or circumstances. Members
requiring such services are advised to consult an appropriate
professional. Neither The Corporate Executive Board Company nor its
programs are responsible for any claims or losses that may arise from
a) any errors or omissions in their reports, whether caused by CEB
TowerGroup or its sources, or b) reliance upon any recommendation
made by CEB TowerGroup.

3
EXECUTIVE SUMMARY
TECHNOLOGY ANALYSIS SCOPE & METHODOLOGY
In response to feedback from our membership, CEB TowerGroup developed this technology analysis product to identify key components of a client
reporting technology investment decision and effectively compare vendor technology products. Our methodology comes from the knowledge that
investment decisions center around the benefit to the individual and enterprise of a technology rather than the feature set alone.
This analysis is tailored to reflect the needs of the end user, in this case the retail banking loyalty manager, to diagnose the technology attributes
particular to a firm, and to effectively identify card loyalty systems that align with the firm’s needs. To that end, CEB TowerGroup conducted a
series of interviews and surveys with financial services executives, industry experts, and vendors regarding card loyalty technology. The results of
this research formed the basis of our diagnostic anatomy and informed the proprietary five point rating system on which we scored individual
products.
CURRENT MARKET & FUTURE INVESTMENT
New government regulations and lower account attrition force issuers to alter their loyalty program offerings. Regulators are now focusing on
issuer profit margins and pressuring issuers to alter their traditional points-based card loyalty offerings. A reported $500 million in penalties and
fines were assessed to issuers regarding their card pricing model during one year, and simultaneously attrition rose up to 46% due to no reward
offerings or poor reward offerings. As most issuers strive to gain new clients through offering a variety of introductory reward offerings, sixty-four
percent of issuers view card loyalty technology as high value space to invest.
Issuers must increase the usage of mobile and internet channels to improve account acquisition. Due to the fast growth in mobile and internet
usage, CEB TowerGroup expects internet-based credit card applications to outpace all other channels and account for 39% of new account
acquisitions. Mobile channel communication offers high ROI since CEB TowerGroup expects consumers to reach an all-time high of $35,000 million
in online transactions by 2015.
Investment in card loyalty systems is expected to increase 4% a year globally until 2017. The highest growth will be in the North American
region as increased demand for retail banking services forces investment. As firms invest in new card loyalty systems, innovative firms will
incorporate data analytics reporting capability for its consumers and users, as well as improved data content management capability, for the
highest ROI on their system.
© 2013 The Corporate Executive Board
Company. All Rights Reserved.
CEB TOWERGROUP RETAIL BANKING PRACTICE

4
EXECUTIVE SUMMARY
VENDOR LANDSCAPE AND RANKINGS
Card loyalty systems increase transaction volume, control attrition, and differentiate issuers’ products. The selection process centered around those vendors with
mature products, globally recognized innovation, and multiple large-scale installations with major financial services institutions. In particular this report looks at
both regional and global client reporting systems that support both client and advisor-facing report generation. Many vendors featured in this report have
significant experience supporting client reporting for capital markets, however, for inclusion, all solutions must have active wealth management clients.
This technology analysis includes both merchant funded and traditional based technology programs. We ranked solely the merchant funded programs that
include Cardlytics, Comarch, Kobie Marketing, and Welcome Real-time. We profiled but did not rank the traditional points-based vendors that include
Connexions Loyalty, Maritz, SAP, and TIBCO Loyalty Labs.
By combining our qualitative and quantitative data from interviews with industry experts, financial institutions and vendors, CEB TowerGroup identified 23
attributes that define a “best-in-class” card loyalty system. These attributes are grouped into four categories that highlight a firm’s user and enterprise needs.
Vendor rankings are based on our proprietary five point rating methodology that scores each product on the 23 “best-in-class” attributes. The top vendors
were designated as best-in-class performers based on their composite scores in each of the technology categories below.
BEST-IN-CLASS TECHNOLOGY CATEGORIES
Retail banking executives investing in card loyalty technology should use the Diagnostic Anatomy on page 23 to select the vendor that best aligns with their firm’s
business objectives and investment needs.
CUSTOMER INTERFACE includes those attributes that provide the user with intuitive control and flexibility over the user interface.
Leaders include Cardlytics’ Transaction-Driven Marketing and Kobie’s Alchemy.
MANAGEMENT & OPERATIONS includes those attributes that address the technical implementation and reporting workflow capabilities.
Leader includes Cardlytics’ Transaction-Driven Marketing.
SECURITY & CONTROL includes those attributes that mitigate risk through the protection and limitation of data.
Leaders include Cardlytics’ Transaction-Driven Marketing and Kobie’s Alchemy.
ENTERPRISE SUPPORT includes those attributes that influence the enterprise’s tactical fit and strategic alignment with the vendor.
Leaders include Cardlytics’ Transaction-Driven Marketing and Welcome Real-time’s The Loyalty Impact: At-Store/In-Wallet.
© 2013 The Corporate Executive Board
Company. All Rights Reserved.
CEB TOWERGROUP RETAIL BANKING PRACTICE

Current Market
Future Investment
Vendor Landscape
Product Ranking
5
TECHNOLOGY ANALYSIS OVERVIEW
Mission Statement: CEB
TowerGroup technology analysis
process provides a customer-
driven, transparent, and unbiased
review designed to drive informed
business decisions.
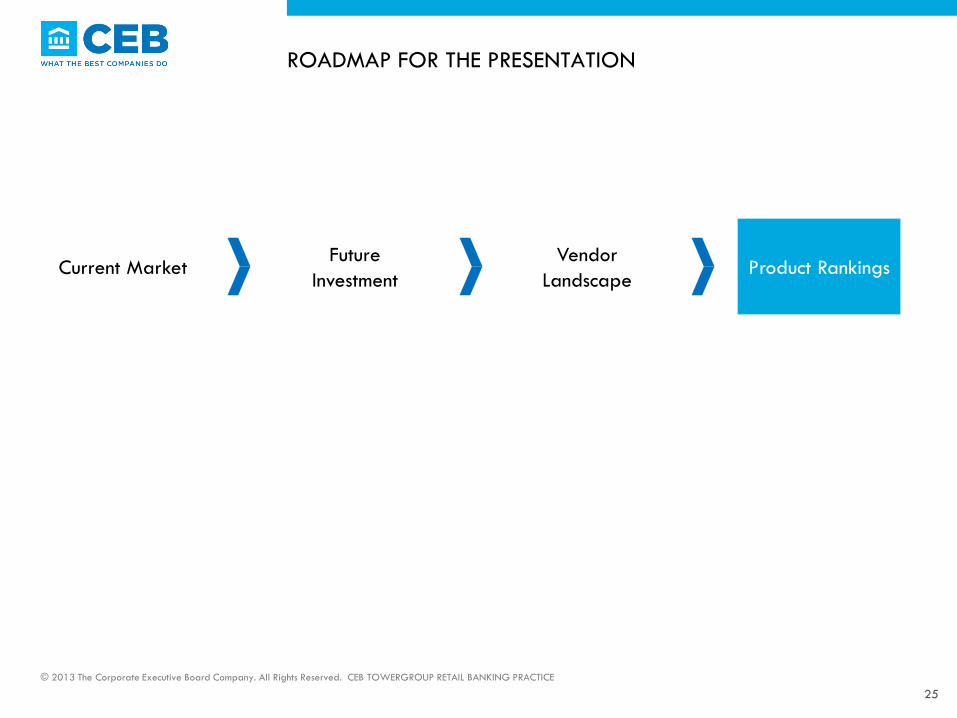
Current Market: Provides a
view of industry and customer
changes, and best practices for
technology investment and
implementation.
Future Investment: Forecasts IT
spending and identifies
emerging technologies and
innovations.
Vendor Landscape: Provides an
overview of key vendors,
product features, and market
position.
Product Rankings: Highlights
best-in-class attributes and
shows a comparative
perspective of leading
products.
Technology Analysis Presentation Roadmap
Market Drivers:
Assess changes in the
industry and customer
behavior
Spending Forecasts:
Benchmark global and
regional Card Loyalty
IT spending
List of Players: Identify
key technology firms
and their products
“Best-in-Class” Products:
See the top products
based on our anatomy
categories
Emerging Technology
Landscape:
Pinpoint emerging
technologies and
innovations
Diagnostic Anatomy:
Choose your investment
priorities with our
proprietary framework
Ranking Methodology:
Review the key
components of an
investment decision
Feature Audit:
Compare the relative
feature offerings by
vendors
Vendor Profiles:
Understand the key
differentiators between
products
© 2013 The Corporate Executive Board
Company. All Rights Reserved.
CEB TOWERGROUP RETAIL BANKING
PRACTICE

ROADMAP FOR THE PRESENTATION
© 2013 The Corporate Executive Board Company. All Rights Reserved. CEB TOWERGROUP RETAIL BANKING PRACTICE
Current Market Future
Investment
Vendor
Landscape Product Rankings
$818 $883 $1,054 $1,152 $1,104
$309 $327
$333
$393 $448
2008 2009 2010 2011 2012
MasterCard
Visa
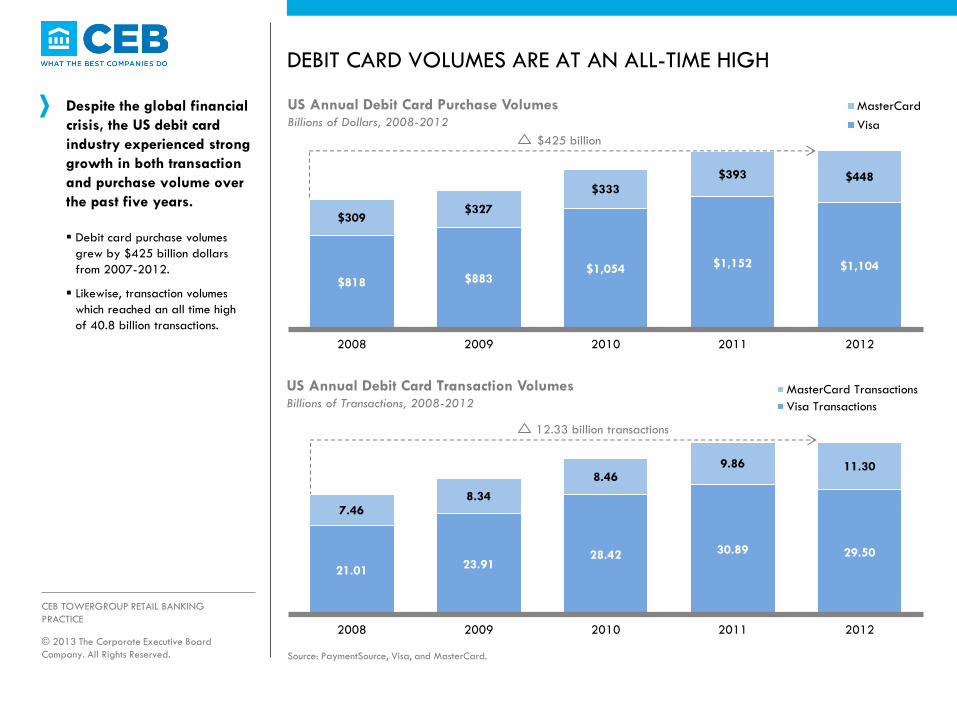
DEBIT CARD VOLUMES ARE AT AN ALL-TIME HIGH
Despite the global financial
crisis, the US debit card
industry experienced strong
growth in both transaction
and purchase volume over
the past five years.
Debit card purchase volumes
grew by $425 billion dollars
from 2007-2012.
Likewise, transaction volumes
which reached an all time high
of 40.8 billion transactions.
US Annual Debit Card Purchase Volumes Billions of Dollars, 2008-2012
$425 billion
Source: PaymentSource, Visa, and MasterCard.
21.01 23.91
28.42 30.89 29.50
7.46 8.34
8.46 9.86 11.30
2008 2009 2010 2011 2012
MasterCard Transactions
Visa Transactions
US Annual Debit Card Transaction Volumes Billions of Transactions, 2008-2012
12.33 billion transactions
© 2013 The Corporate Executive Board
Company. All Rights Reserved.
CEB TOWERGROUP RETAIL BANKING
PRACTICE
8
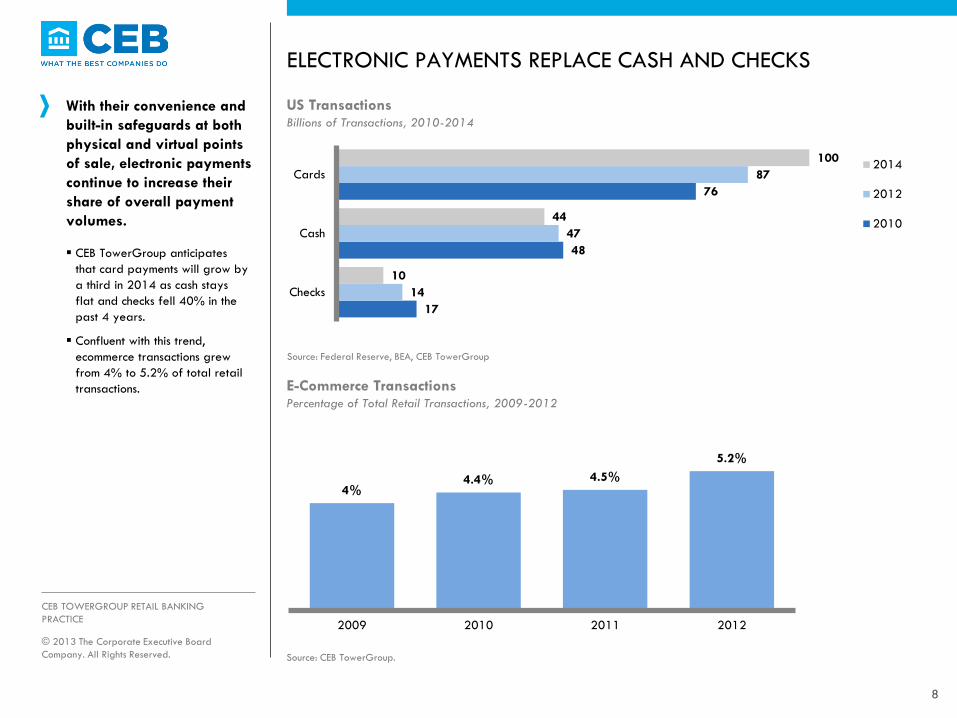
ELECTRONIC PAYMENTS REPLACE CASH AND CHECKS
With their convenience and
built-in safeguards at both
physical and virtual points
of sale, electronic payments
continue to increase their
share of overall payment
volumes.
CEB TowerGroup anticipates
that card payments will grow by
a third in 2014 as cash stays
flat and checks fell 40% in the
past 4 years.
Confluent with this trend,
ecommerce transactions grew
from 4% to 5.2% of total retail
transactions.
US Transactions Billions of Transactions, 2010-2014
Source: Federal Reserve, BEA, CEB TowerGroup
4% 4.4% 4.5%
5.2%
2009 2010 2011 2012
E-Commerce Transactions Percentage of Total Retail Transactions, 2009-2012
Source: CEB TowerGroup.
© 2013 The Corporate Executive Board
Company. All Rights Reserved.
CEB TOWERGROUP RETAIL BANKING
PRACTICE
17
48
76
14
47
87
10
44
100
Checks
Cash
Cards2014
2012
2010

9
PRESSURE FROM ALL SIDES
Regulators are taking a broad approach to the US card industry and involvement in the card pricing model.
Regulatory tenor has changed
during the past decade; from
their original attention on fair
lending and transparent
disclosures, regulators now focus
on the market power of
payment networks and issuer
profit margins.
Issuers must look at risk policies
and supporting technologies to
ensure infrastructure adapts to
legal requirements that often
demand rapid implementation.
FEDERAL REGULATOR ANTI-TRUST LITIGATION
$500 million in consumer
penalties and fines was
assessed in the first year of
operation, $150 million
more than the Consumer
Financial Protection
Bureaus’ operating budget
American Express, Capital
One, and Discover were
fined for revenue
enhancements and further
fines are expected
Latest 2012 litigation
proposal is $7.3 billion to
be paid by MasterCard
and Visa for class action
and individual cases
Although many smaller
merchants are ready to
accept the settlement and
end the seven-year battle,
larger merchants appear
unsatisfied
Government Pressures on Card Pricing Model Illustrative Three Angle Model, 2013
FINANCIAL INSTITUTION
CONGRESSIONAL
ACTIONS
US Debit card price
controls reduced large
bank revenue by $42 per
account due to the Dodd
Frank Act
Regulatory debit price
controls appear to benefit
merchants; there is no
indication that consumers
received benefit from
recent cost reductions
Source: CEB TowerGroup Research 2013.
© 2013 The Corporate Executive Board
Company. All Rights Reserved.
CEB TOWERGROUP RETAIL BANKING
PRACTICE

$36 $37 $35
$21 $22
2009 2010 2011 2012 2013
10
REGULATIONS REDUCE ABILITY TO FUND REWARD PROGRAMS
Despite the high number of
debit card transactions and
increased volume, regulatory
controls reduced debit card
revenue and the ability to
fund traditional reward
programs in credit cards.
When the Dodd-Frank Act was
implemented in Q3 2011, Debit
Card revenue plummeted by
40% from $35 per account to
$21 per account.
Due to these increased
regulatory controls, card issuers
must find alternative channels to
increase revenue, as traditional
interest revenue will decrease
by 22% after the Dodd Frank
act.
Debit Card Revenue Per Account In US Dollars, 2009-2013
Source: CEB TowerGroup.
Dodd-Frank Act (2011 Q3)
Card Issuer Revenue Percentage of Revenue, 2010 vs. 2020 (P)
Source: FDIC, Issuers, CEB TowerGroup.
© 2013 The Corporate Executive Board
Company. All Rights Reserved.
CEB TOWERGROUP RETAIL BANKING
PRACTICE
68%
10% 4%
9% 4% 5%
46%
5%
16% 16%
5%
12%
0%
10%
20%
30%
40%
50%
60%
70%
Interest Interchange Annual Fees Penalty Fees Cash AdvanceFees
Fee Services
2010 2020 (P)

11
RETAILERS CHALLENGE LOYALTY REVENUE STREAM
As merchants face intense
competition from internet
sales and reduced margins,
they partner with issuers to
generate co-branded profits.
Private label cards and co-
branded products threaten to
shift revenue from issuers and
reduce large issuer economies
of scale.
Within cards that offer loyalty
programs, 25% offer co-
branded partnership with
retailers that help reduce costs,
which is the second largest
industry partnership across all
loyalty offerings.
Co-Branded Partnerships Private Label Cards
Objective Share card issuer profits Fully own the payments function
Action Participate in joint ventures with banks Issue cards under brands owned by the
retailer
Status American Express/ Wal-Mart Bluebird
prepaid
CEB TowerGroup Retail Banking Card
Track identifies 90 US mass marketed co-
brands
Twenty percent US market growth
between 2009 and 2012 to $155 billion
$40 billion prepaid card market
Barclaycard is a major player
Co-Brand and White Label Partners Industry Partner Offers, March 2013
Retailers Industry Status 2013
42%
25%
20%
5% 4% 3% 2%
Airline Cards Retail Cards Hotel Cards Other TravelCards
Cruise LineCards
Sepcial Cards Charity Cards
Source: CEB TowerGroup “Top 10 Technology Initiatives.
Source: CEB TowerGroup CardTrack 2013.
© 2013 The Corporate Executive Board
Company. All Rights Reserved.
CEB TOWERGROUP RETAIL BANKING
PRACTICE Special Cards

45%
46%
47%
48%
49%
50%
51%
114
116
118
120
122
124
Nov-12 Dec-12 Jan-13 Feb-13 Mar-13
Cards with Intro Points
Percentage of Cards with Intro Points
12
LOWER ATTRITION FORCE ISSUERS TO TAKE ACTION
Issuers are looking to grow accounts through increasing their introductory loyalty program offerings.
Forty-six percent of account
attrition is due to lack of value
based on weak reward
programs and no reward
offerings.
To increase retention, issuers are
growing the size and value of
card rewards.
From November 2012 to March
2013, the percentage of card
programs offering introductory
points increased from less than
47% to 50%.
Primary Reasons for Account Attrition Percentage of Respondents, 2010
Intro Points Programs Number of Cards and Percentage, 2012- 2013
Source: CEB TowerGroup CardTrack 2013.
Source: CEB TowerGroup “Top 10 Technology Initiatives”.
28% Fees
18% Poor Reward Offering
28% No Rewards
26% ATM Surcharge
© 2013 The Corporate Executive Board
Company. All Rights Reserved.
CEB TOWERGROUP RETAIL BANKING
PRACTICE

13
ISSUERS NOW OFFER LOYALTY PROGRAMS
To attract a wide customer base, issuers offer a varied mix of rewards and cash back programs, each tailored to appeal to individual interests and lifestyles.
American Express, Discover,
Fidelity, and PNC have loyalty
offers, either points or cashback,
for 100% of their cards.
Barclays, Chase, and US Bank
offer loyalty programs for over
90% of their cards.
0% 10% 20% 30% 40% 50% 60% 70% 80% 90% 100%
American Express
Bank of America
Barclays
Capital One
Chase
Citi
Commerce Bank
Discover
Fidelity
Fifth Third Bank
FNBO
PNC
SunTrust
TD Bank
US Bank
USAA
Wells Fargo
Points Offers Cashback Offers No Loyalty OffersIssuer Offer Loyalty Distribution Percentage of Issuer Cards, 2013
© 2013 The Corporate Executive Board
Company. All Rights Reserved.
CEB TOWERGROUP RETAIL BANKING
PRACTICE
Source: CEB TowerGroup CardTrack 2013.

14
A GROWING TECHNOLOGY SPACE WITH HIGH POTENTIAL
Banks are making strides in
replacing and adopting card
loyalty technology where
they see high potential and
value.
One fourth of banks are
replacing their current card
loyalty system, while 22% are
adopting card loyalty
technology, and 16% are still
unsure.
Sixty-four percent of banks
place high value on card loyalty
technology.
Half of these institutions consider
card loyalty technology to be
very important.
Source: CEB TowerGroup FSI Technology Adoption Survey 2013.
50%
11% 14%
7% 11%
7%
Very Important SomewhatImportant
Unsure Neither Importantor Unimportant
SomewhatImportant
Very Unimportant
Importance of Card Loyalty Technology Percentage of Respondents, 2013
N=28 © 2013 The Corporate Executive Board
Company. All Rights Reserved.
CEB TOWERGROUP RETAIL BANKING
PRACTICE
Current Card Loyalty Technology State at
Global Banks
Percentage of Respondents, 2013
Value Perception of Card Loyalty Technology
Percentage of Respondents, 20123
25% Have It,
Replacing
22% Adopting
38% Have It,
No Planned Change
16% Low Value
28% Moderate Value
16% Unsure
64% High Value
N = 32 N = 22

15
ROADMAP FOR THE PRESENTATION
Current Market Future
Investment
Vendor
Landscape Product Rankings
© 2013 The Corporate Executive Board Company. All Rights Reserved. CEB TOWERGROUP RETAIL BANKING PRACTICE

16 © 2013 The Corporate Executive Board Company. All Rights Reserved.
EMERGING TECHNOLOGY LANDSCAPE FOR CARD LOYALTY R
OI Pote
ntial
Market-Ready In Development
Low
H
igh
Technology State
Digital Channel Technologies Operational Enhancement Technologies
• Mobile Payment Applications: allow consumer to redeem rewards and
purchase goods and services through mobile phone
• Real-Time Processing: operates transactions in present time and integrates
actions into system concurrently to ensure data is up to date
• Mobile Channel Communication: leverages a consumer’s smartphone to
communicate reward offers through SMS, email, and applications
• Data Analytics: measure the effectiveness and likelihood of offers by
forecasting models and calculating key performance indicators for
reporting quantitative metric purposes
• E-commerce Channels: enable consumers to purchase or sell products on
common integrated internet platforms
• Data Content Management Tools: aggregate essential data and content
into a easily digestible and organized format
• Social Media Integration: integrates into LinkedIn, Twitter and Facebook
to enhance institution's understanding of consumer’s preferences
• Geographic Targeting: Recognize the consumer’s primary region and
targets communications/ offers based on relevant information
DEFINITIONS
ROI Potential: Measures the relative
returns an institution can expect to
receive from an investment in the
technology
Technology State: Measures the
technology’s level of development
User Impact: Measures the level of
benefit the technology will have on
the card loyalty user
Minimal
Medium
High
User Impact
Mobile Payment
Applications
Real-Time
Processing
Mobile Channel
Communication
Data Content
Management
Tools
Geographic
Targeting E-Commerce
Channels
Social Media
Integration
Data
Analytics

17
ROADMAP FOR THE PRESENTATION
Current
Market
Future
Investment
Vendor
Landscape
Product
Rankings
© 2013 The Corporate Executive Board Company. All Rights Reserved. CEB TOWERGROUP RETAIL BANKING PRACTICE

Points-Focused Card Loyalty Solutions
Solutions supports points-focused rewards programs for
retail banks.
18
MAPPING THE VENDOR LANDSCAPE
2 0 1 0 1 9 9 0 2 0 0 0
Card Loyalty Vendor Systems
By System Release Date
Selecting Featured Card Loyalty Vendors
CEB TowerGroup identified vendors for this analysis based on expert
opinion, product maturity, size of installations, and technological innovation.
SAP CRM Loyalty
Management
Comarch Loyalty
Management
Alchemy
TIBCO Loyalty Lab
Reward
© 2013 The Corporate Executive Board Company. All Rights Reserved. CEB TOWERGROUP RETAIL BANKING PRACTICE
Merchant-Focused Card Loyalty Solutions
System supports merchant-focused rewards programs for
retail banks.
The Loyalty
Impact
Connexions
Loyalty Suite
SYNAPZE
Transaction-Driven
Marketing
1 2 3 4 5 6 7 8
9
10
11
12
13 14 15 16 17 18 19 20
21
22
23
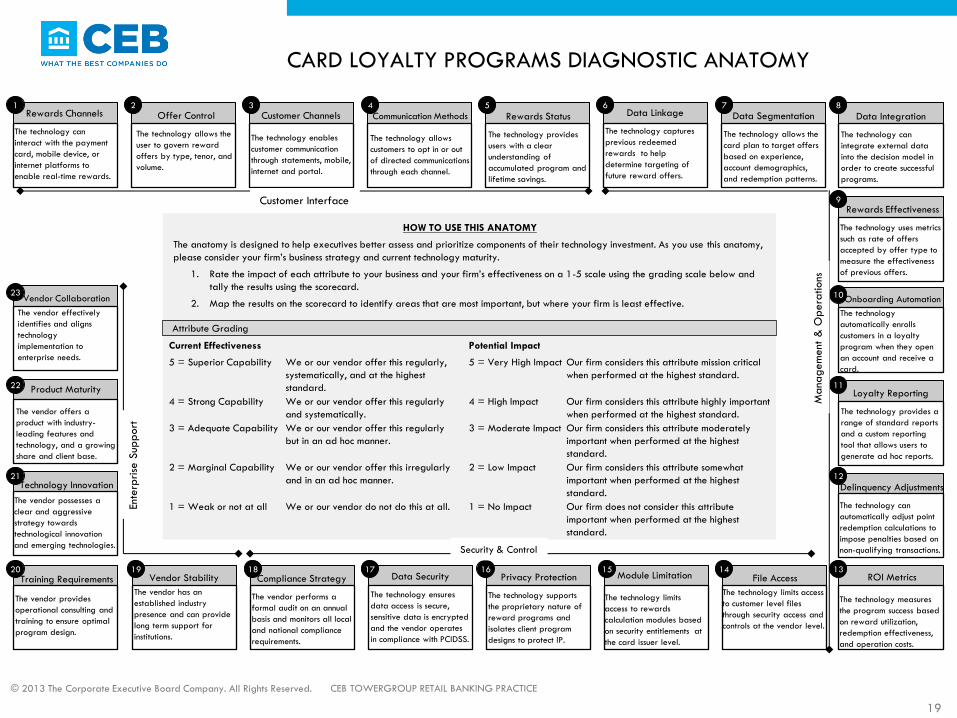
CARD LOYALTY PROGRAMS DIAGNOSTIC ANATOMY
Rewards Channels
The technology can
interact with the payment
card, mobile device, or
internet platforms to
enable real-time rewards.
Offer Control
The technology allows the
user to govern reward
offers by type, tenor, and
volume.
Customer Channels
The technology enables
customer communication
through statements, mobile,
internet and portal.
Communication Methods
The technology allows
customers to opt in or out
of directed communications
through each channel.
Rewards Status
The technology provides
users with a clear
understanding of
accumulated program and
lifetime savings.
Data Linkage
The technology captures
previous redeemed
rewards to help
determine targeting of
future reward offers.
Data Segmentation
The technology allows the
card plan to target offers
based on experience,
account demographics,
and redemption patterns.
Data Integration
The technology can
integrate external data
into the decision model in
order to create successful
programs.
Rewards Effectiveness
The technology uses metrics
such as rate of offers
accepted by offer type to
measure the effectiveness
of previous offers.
Onboarding Automation
The technology
automatically enrolls
customers in a loyalty
program when they open
an account and receive a
card.
Loyalty Reporting
The technology provides a
range of standard reports
and a custom reporting
tool that allows users to
generate ad hoc reports.
Delinquency Adjustments
The technology can
automatically adjust point
redemption calculations to
impose penalties based on
non-qualifying transactions.
ROI Metrics
The technology measures
the program success based
on reward utilization,
redemption effectiveness,
and operation costs.
File Access
The technology limits access
to customer level files
through security access and
controls at the vendor level.
Module Limitation
The technology limits
access to rewards
calculation modules based
on security entitlements at
the card issuer level.
Privacy Protection
The technology supports
the proprietary nature of
reward programs and
isolates client program
designs to protect IP.
Data Security
The technology ensures
data access is secure,
sensitive data is encrypted
and the vendor operates
in compliance with PCIDSS.
Compliance Strategy
The vendor performs a
formal audit on an annual
basis and monitors all local
and national compliance
requirements.
Vendor Stability
The vendor has an
established industry
presence and can provide
long term support for
institutions.
Training Requirements
The vendor provides
operational consulting and
training to ensure optimal
program design.
Technology Innovation
The vendor possesses a
clear and aggressive
strategy towards
technological innovation
and emerging technologies.
Product Maturity
The vendor offers a
product with industry-
leading features and
technology, and a growing
share and client base.
Vendor Collaboration
The vendor effectively
identifies and aligns
technology
implementation to
enterprise needs.
CEB TOWERGROUP RETAIL BANKING PRACTICE © 2013 The Corporate Executive Board Company. All Rights Reserved.
Current Effectiveness Potential Impact
5 = Superior Capability We or our vendor offer this regularly,
systematically, and at the highest
standard.
5 = Very High Impact Our firm considers this attribute mission critical
when performed at the highest standard.
4 = Strong Capability We or our vendor offer this regularly
and systematically.
4 = High Impact Our firm considers this attribute highly important
when performed at the highest standard.
3 = Adequate Capability We or our vendor offer this regularly
but in an ad hoc manner.
3 = Moderate Impact Our firm considers this attribute moderately
important when performed at the highest
standard.
2 = Marginal Capability We or our vendor offer this irregularly
and in an ad hoc manner.
2 = Low Impact Our firm considers this attribute somewhat
important when performed at the highest
standard.
1 = Weak or not at all We or our vendor do not do this at all. 1 = No Impact Our firm does not consider this attribute
important when performed at the highest
standard.
Attribute Grading
HOW TO USE THIS ANATOMY
The anatomy is designed to help executives better assess and prioritize components of their technology investment. As you use this anatomy,
please consider your firm’s business strategy and current technology maturity.
1. Rate the impact of each attribute to your business and your firm’s effectiveness on a 1-5 scale using the grading scale below and
tally the results using the scorecard.
2. Map the results on the scorecard to identify areas that are most important, but where your firm is least effective.
Customer Interface
Mana
gem
ent
& O
pera
tions
Security & Control
Ente
rprise
Sup
port
19

20
CARD LOYALTY SOLUTIONS SCORE CARD
Retail banking executives
should complete the
scorecard using the card
loyalty solution diagnostic
anatomy tool.
Categories Attributes Potential Impact Current Effectiveness
1. Reward Channels
Customer 2. Offer Control
Interface 3. Customer Channels
4. Communication Methods
5. Rewards Status
6. Data Linkage
7. Data Segmentation
Management & 8. Data Integration
Operations 9. Rewards Effectiveness
10. Onboarding Automation
11. Loyalty Reporting
12. Delinquency Adjustments
13. ROI Metrics
14. File Access
Security & 15. Module Limitation
Control 16. Privacy Protection
17. Data Security
18. Compliance Strategy
19. Vendor Stability
Enterprise 20. Training Requirements
Support 21. Technology Innovation
22. Product Maturity
23. Vendor Collaboration
© 2013 The Corporate Executive Board
Company. All Rights Reserved.
CEB TOWERGROUP RETAIL BANKING
PRACTICE

21
CARD LOYALTY SOLUTIONS SCORE CARD
Retail banking executives should map their attribute scores from rating their impact and effectiveness on the previous page on this matrix to identify the most important areas to their vendor selection.
Pote
ntial
Impact
5 =Very High
4 =High
3 = Moderate
2 =Low
1 =No Impact 1 =
Weak
2 =
Ma
rgina
l
3 =
Adequa
te
4 =
Stro
ng
5 =
Sup
erio
r
Current Effectiveness
© 2013 The Corporate Executive Board
Company. All Rights Reserved.
CEB TOWERGROUP RETAIL BANKING
PRACTICE

22
FEATURE AUDIT DEFINITIONS
© 2013 The Corporate Executive Board Company. All Rights Reserved. CEB TOWERGROUP RETAIL BANKING PRACTICE
Feature Definition
Summary Grouping The system provides an aging summary of outstanding unredeemed points with logical groupings.
Loyalty Campaigns The client or vendor is able to run campaigns against particular loyalty groups to help extinguish outstanding points.
Reporting Options The system allows users to create reports through report writers on the proprietary system.
Big Data Management The system can build reports with large data extracts; files are available in all standard formats on demand.
Customer Tracking The system can do reconnaissance on customer spending patterns and transactions to determine if the customer is a revolver or transactor.
Point Weighting The system can weight revenue potential by multiple point schemes from various financial services products.
Enterprise Rewards The system can provide enterprise rewards (combination of credit, debit, prepaid, checking customer loans, etc.).
Mobile Access The system has comprehensive mobile access and an internet portal.
Additional Cards The system allows customers to add cards, such as multiple cards in one household under one loyalty account, or they may use the programs separately.
Real Time The system is available in real time to provide instant opportunities.
Geographic Flexibility The system allows purchases to be made outside the issuer’s primary market and location and can easily convert into rewards.
Structure Data The system provides structured data and format on changes in spending habits.
Master File Security The system has one original cardholder master file from which all account levels can change such as mailing address and participant name.
Portal Customization The system allows customer to customize their online experience.
FIFO The system has a point redemption feature that occurs on a FIFO basis (oldest points redeem first). *should we include this since it’s MFR now?
System Integration The system has point liability data that can easily integrate into the FSI’s financial system.
Customer Portal The system has a customer portal in which customers can view and manage their loyalty points and rewards.
Service Model The vendor provides additional services and support to execute the program to its fullest.

23
FEATURE AUDIT
© 2013 The Corporate Executive Board Company. All Rights Reserved. CEB TOWERGROUP RETAIL BANKING PRACTICE
Vendor Cardlytics Transaction-
Driven Marketing
% of Vendors Offering
as Standard Feature
Summary Grouping l 75%
Loyalty Campaigns N/A 75%
Reporting Options l 100%
Big Data Management l 100%
Customer Tracking l 88%
Point Weighting N/A 63%
Enterprise Rewards l 100%
Mobile Access l 88%
Additional Cards l 88%
Real Time l 100%
Geographic Flexibility l 100%
Structure Data l 88%
Master File Security N/A 88%
Portal Customization l 88%
FIFO N/A 88%
System Integration l 75%
Customer Portal l 100%
Service Model l 75%
Standard Feature Add-on Feature Future Capability
(next 12 months)
Future Capability
(next 24 months) m m

TRANSACTION-DRIVENTM MARKETING CARDLYTICS, INC. Company Overview
Founded in 2008, Cardlytics is a privately-held IT provider that specializes in marketing and analytics for the retail,
financial services, restaurant, and entertainment industries. The company has a network of over 370 financial institution
including key partnerships with Bank of America, PNC, and Regions Bank. Cardlytics is the pioneer in the card-linked
marketing space and provides both national and local business with digital and mobile marketing options based from its
core analytics platform.
Product Overview
Transaction-DrivenTM Marketing is a merchant-funded rewards system that uses actual spend data to target individual
consumers with merchant offers. Developed in-house in 2009, the solution is currently on its fourth release. Cardlytics
partners with global loyalty management company Aimia to pursue international expansion. Through its partnership with
Aimia, Cardlytics signed a major bank in the UK and has opportunity for growth in Europe, the Americas and Asia.
Product Highlights
• Reward Offers and Widget: The solution allows customers to conveniently access all of their merchant-reward offers
through their online account and various channels of alerts. For example, when a customer signs onto his Bank of
America account online, the customer can easily view his offers underneath the relevant transaction. To view all of the
offers earned, a customer can also access a widget on their dashboard that has the total number of rewards earned,
number of new offers, and status/days left for each merchant’s reward offers.
• Performance Dashboard: Transaction-DrivenTM Marketing has a comprehensive performance dashboard that
summarizes campaigns, revenue, accounts served, and all activations. The solution aggregates all of this information for
the firm, and creates easily consumable graphs for the user. The solution also provides analytics and graphs based on
the number of redemptions, calculates the redemption rate, and then converts these redemptions into total revenue for
each campaign. To drill deeper, the user can click on the revenue graph to determine what percentage is allocated to
rewards, fees and overall revenue.
• Campaign Segmentation: To create a campaign that is targeted to the appropriate group of customers, Cardlytics
uses a Campaign Properties tool within its Transaction-DrivenTM Marketing solution to define tiers of consumers. For
example, a user can customize offers by drilling down a customer universe by defining segments based upon the a
customer’s number of transactions within the past year.
CEB TowerGroup View
Cardlytics is a relatively young company that made its mark in merchant-funded rewards with strong supporting software,
a card-focused business and exceptional consultative services. Transaction-DrivenTM Marketing received Best-in-Class in all
four categories due to its flexible user interface, abundant security and control options, and robust operational metrics. The
firm has strong and established partnerships with several top tier and regional US card issuers, such as Bank of America
and its BankAmeriDeals program.
Key Statistics
Company Type: Private
Year Founded: 2008
Headquarters: Atlanta, GA
Number of FT Employees: 250+
FY 2011 Revenue: not disclosed
0 – 4% 20-39% 60-79%
5 – 19% 40-59% 80-100%
<$1
Billion
$1-10
Billion
$10 – 50
Billion
>$50
Billion
Distribution of Clients by Asset Size
Distribution of Clients by Region
Source: CEB TowerGroup Research,
Cardlytics.
Not Disclosed
© 2013 The Corporate Executive Board
Company. All Rights Reserved.
CEB TOWERGROUP RETAIL BANKING
PRACTICE
25
ROADMAP FOR THE PRESENTATION
Current Market Future
Investment
Vendor
Landscape Product Rankings
© 2013 The Corporate Executive Board Company. All Rights Reserved. CEB TOWERGROUP RETAIL BANKING PRACTICE

26
CREATING OUR “BEST-IN-CLASS” PRODUCT RANKINGS
Customer Interface
Those attributes that
provide the user with
intuitive control and
flexibility over the user
interface.
Management &
Operations
Those attributes that
address the technical
implementation and
reporting workflow
capabilities.
Security & Control
Those attributes that
mitigate risk through the
protection and
limitation of data.
Enterprise Support
Those attributes that
influence the enterprise’s
tactical fit and strategic
alignment with the
vendor.
“Best-in-Class”
Customer Interface
“Best-in-Class”
Enterprise Support
“Best-in-Class”
Security & Control
“Best-in-Class”
Management &
Operations
ATTR
IBU
TES
Mission
Critica
l
Reward Channels
Customer Channels
Data Linkage
Data Segmentation
Loyalty Reporting
ROI Metrics
Data Security
Training
Requirements
Product Maturity
Str
ong
Priority
Communication
Methods
Rewards Status
Data Integration
Rewards
Effectiveness
Privacy Protection
Compliance Strategy
Vendor Stability
Technology
Innovation
Pro
duc
t
Diffe
rent
iato
r
Offer Control
Onboarding
Automation
Delinquency
Adjustments
File Access
Module Limitation
Vendor
Collaboration
CEB TOWERGROUP RETAIL BANKING PRACTICE
© 2013 The Corporate Executive Board Company. All Rights Reserved.
CA
TEG
OR
IES
Phase 1
Utilizing qualitative and
quantitative data, CEB
TowerGroup identified 23
attributes that define a “Best-in-
Class” Card Loyalty system, which
are grouped into four categories.
Phase 2
Recognizing that all attributes are
not equally important, CEB
TowerGroup divides them into
tiers to reflect their level of
importance as mission critical,
strong priority or differentiators.
Phase 3
Certain products are recognized
as “Best-in-Class” after scoring
each product based on its
performance at an attribute level.
Vendor Product Customer
Interface
Management &
Operations
Security &
Control
Enterprise
Support
Cardlytics Transaction-Driven
Marketing 5.0 4.8 5.0 4.6
Comarch Comarch Loyalty
Management -- -- -- --
Kobie
Marketing Alchemy -- -- -- --
Welcome
Real-time
The Loyalty Impact:
At-Store/In-Wallet -- -- -- --
27
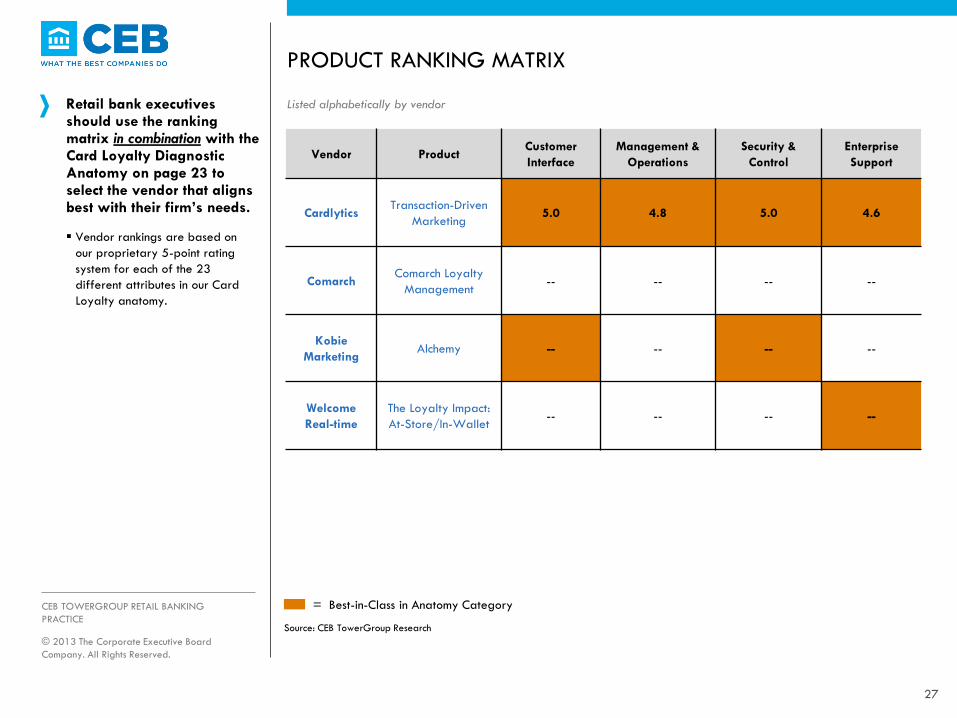
PRODUCT RANKING MATRIX
Retail bank executives should use the ranking matrix in combination with the Card Loyalty Diagnostic Anatomy on page 23 to select the vendor that aligns best with their firm’s needs.
Vendor rankings are based on
our proprietary 5-point rating
system for each of the 23
different attributes in our Card
Loyalty anatomy.
Listed alphabetically by vendor
© 2013 The Corporate Executive Board
Company. All Rights Reserved.
CEB TOWERGROUP RETAIL BANKING
PRACTICE
= Best-in-Class in Anatomy Category
Source: CEB TowerGroup Research

28
“BEST IN CLASS” ACHIEVEMENTS FOR CARDLYTICS
Cardlytics received “Best-in-
Class” recognition in
Customer Interface,
Management & Operations,
Security & Control, and
Enterprise Support.
© 2013 The Corporate Executive Board
Company. All Rights Reserved.
CEB TOWERGROUP RETAIL BANKING
PRACTICE
Category Scoring Analysis
Customer
Interface
Transaction-Driven Marketing automatically enrolls cardholders into the program when the bank
decides to turn on the solution. The system provides a simple and easily accessible opt-in and
opt-out option for customers who do not wish to participate in rewards, as well as the ability to
easily opt out of particular channels of communication such as mobile, email, and text
messaging.
Management &
Operations
Transaction-Driven Marketing allows merchants to segment offers into three categories: most
frequent, infrequent, and no customers (but high spenders). Typically, merchants partner with
Cardlytics to establish parameters for campaigns to ensure the campaign’s relevancy. When
customers log into their online or mobile banking, Cardlytics sends the matched offers and this
information allows advertisers to incite additional visits from loyal customers, new customers to
visit the store, and to transform an infrequent customer.
Security & Control
Transaction-Driven Marketing utilizes sophisticated ROI metrics based on transaction data and
merchant campaigns to measure amount of success in a given program. Cardlytics can
determine the long term value of a customer and the ROI of a campaign through measurements
such as activation rate, redemption rate, average ticket amount, gross revenue, and customer
rewards.
Enterprise Support
Founded by banking executives, Cardlytics uses actual spending data to target individual
customers with advertising offers. Cardlytics’ unique approach towards loyalty combined with
the founders’ expertise in banking results in one of the most innovative products in the industry.
Cardlytics also works with clients who have customers that already frequently use online and
mobile banking, so their client base is relatively advanced.

1 2 3 4 5 6 7 8
9
10
11
12
13 14 15 16 17 18 19 20
21
22
23
CARD LOYALTY PROGRAMS DIAGNOSTIC ANATOMY
Rewards Channels
The technology can
interact with the payment
card, mobile device, or
internet platforms to
enable real-time rewards.
Offer Control
The technology allows the
user to govern reward
offers by type, tenor, and
volume.
Customer Channels
The technology enables
customer communication
through statements, mobile,
internet and portal
channels.
Communication Methods
The technology allows
customers to opt in or out
of directed communications
through each channel.
Rewards Status
The technology provides
users with a clear
understanding of
accumulated program and
lifetime savings.
Data Linkage
The technology captures
previous redeemed
rewards to help
determine targeting of
future reward offers.
Data Segmentation
The technology allows the
card plan to target offers
based on experience,
account demographics,
and redemption patterns.
Data Integration
The technology can
integrate external data
into the decision model in
order to create successful
programs.
Rewards Effectiveness
The technology uses metrics
such as rate of offers
accepted by offer type to
measure the effectiveness
of previous offers.
Onboarding Automation
The technology
automatically enrolls
customers in a loyalty
program when they open
an account and receive a
card.
Loyalty Reporting
The technology provides a
range of standard reports
and a custom reporting
tool that allows users to
generate ad hoc reports.
Delinquency Adjustments
The technology can
automatically adjust point
redemption calculations to
impose penalties based on
non-qualifying transactions.
ROI Metrics
The technology measures
the program success based
on reward utilization,
redemption effectiveness,
and operation costs.
File Access
The technology limits access
to customer level files
through security access and
controls at the vendor level.
Module Limitation
The technology limits
access to rewards
calculation modules based
on security entitlements at
the card issuer level.
Privacy Protection
The technology supports
the proprietary nature of
reward programs and
isolates client program
designs to protect IP.
Data Security
The technology ensures
data access is secure,
sensitive data is encrypted
and the vendor operates
in compliance with PCIDSS.
Compliance Strategy
The vendor performs a
formal audit on an annual
basis and monitors all local
and national compliance
requirements.
Vendor Stability
The vendor has an
established industry
presence and can provide
long term support for
institutions.
Training Requirements
The vendor provides
operational consulting and
training to ensure optimal
program design.
Technology Innovation
The vendor possesses a
clear and aggressive
strategy towards
technological innovation
and emerging technologies.
Product Maturity
The vendor offers a
product with industry-
leading features and
technology, and a growing
share and client base.
Vendor Collaboration
The vendor effectively
identifies and aligns
technology
implementation to
enterprise needs.
CEB TOWERGROUP RETAIL BANKING PRACTICE © 2013 The Corporate Executive Board Company. All Rights Reserved.
Customer Interface
Mana
gem
ent
& O
pera
tions
Security & Control
Ente
rprise
Sup
port
29
Scoring Methodology
To arrive at a vendor ranking, CEB TowerGroup developed a proprietary scoring metric outlined by the
attributes within this anatomy that highlights the major elements of an enterprise investment decision. This
metric assumes that every element is not equally important, and therefore assigns a higher level of
importance to those attributes critical to a card loyalty solution. The remaining attributes are then divided
further into two tiers to reflect their level of importance, highlighted below.
Tier 1 Attributes –
“Mission Critical”
Tier 2 Attributes –
“Strong Priority”
Tier 3 Attributes –
“Product Differentiators”
Reward Channels
Customer Channels
Data Linkage
Data Segmentation
Loyalty Reporting
ROI Metrics
Data Security
Training Requirements
Product Maturity
Communication Methods
Rewards Status
Data Integration
Rewards Effectiveness
Privacy Protection
Compliance Strategy
Vendor Stability
Technology Innovation
Offer Control
Onboarding Automation
Delinquency Adjustments
File Access
Module Limitation
Vendor Collaboration

30
UNDERSTANDING OUR SCORING METHODOLOGY
CEB TowerGroup develops a unique and proprietary scoring methodology that highlights the key priorities for an executive’s investment decision.
Every vendor product featured
in this report is scored on each
of the 23 attributes outlined in
the Card Loyalty Diagnostic
Anatomy on a standardized 1-5
scale.
We calculate the weighted
average of a product’s attribute
scores in each of the 4
categories of the anatomy to
arrive at an overall category
score.
Sample Technology Analysis Internal Anatomy Scoring Guide
Illustrative
Anato
my
Category Customer Interface Security & Control
Attribute Title Customer Channels ROI Metrics
Attribute
Definition
The technology enables customer
communication through statements, mobile,
internet and portal channels.
The technology can determine monetary
savings of a loyalty program by providing
feedback and measuring ROI on operations,
utilization, and total offers versus redeemed.
Sco
ring M
etr
ic
5
The technology enables customer communication through
statements, mobile application, internet, and portal
channels.
The technology can determine monetary savings of a
loyalty program by providing feedback and
measuring ROI on operations, utilization, and total
offers versus redeemed, and can share this information
with its customers.
4
The technology enables customer communications through
statements, internet, portal, and mobile channels but does
not offer a mobile application.
The technology can determine monetary savings of a
loyalty program by providing feedback and measuring
ROI on operations, utilization, and total offers versus
redeemed, but cannot share this information with its
customers.
3
The technology enables customer communication through
statements, internet, and portal channels.
The technology can provide feedback on operations,
utilization, and total offers versus redeemed, but
cannot determine monetary savings and ROI
automatically.
2 The technology enables customer communication through
statements and internet channels.
The technology can provide limited feedback on
operations, utilization, and total offers versus
redeemed.
1 The technology enables customer communication through
statements only.
The technology cannot provide feedback on program
success metrics to determine the loyalty programs’
effectiveness.
Attribute Score: 5.0 3.0
© 2013 The Corporate Executive Board
Company. All Rights Reserved.
CEB TOWERGROUP RETAIL BANKING
PRACTICE


