
Capital Structure, cont.
Katharina LewellenFinance Theory II
March 5, 2003

Target Capital Structure Approach
1. Start with M-M Irrelevance
2. Add two ingredients that change the size of the pie.TaxesExpected Distress Costs
3. Trading off the two gives you the “static optimum” capital structure. (“Static” because this view suggests that a company should keep its debt relatively stable over time.)
2

Target Capital Structure Approach, cont.
VU
Leverage
Firm
val
ue
VL with tax shields, but no distress
VL with tax shields and distress
VL according to MM
Optimal capital structure
3

Implications of the “target leverage” approach
Firms should:Issue equity when leverage rises above the target level
Buy back stock (or pay dividends) when leverage falls below the target capital structure
Stock market should:React positively (or neutrally) to announcements of securities issues
4

What really happens?Stock prices drop (on average) at the announcements of equity issues
Companies are reluctant to issue equity
They follow a “pecking order” in which they finance investment:
first with internally generated fundsthen with debtand finally with equity
Willingness to issue equity fluctuates over time
Something is missing from the “target-leverage” view
5

Stock price reaction to equity issue announcements
-3.5
-3
-2.5
-2
-1.5
-1
-0.5
0
0.5
-10 -8 -6 -4 -2 0 2 4 6 8 10
Day after announcement
Cum
ulat
ive
Exce
ss R
etur
n (%
)
Average cumulative excess returns from 10 days before to 10 days after announcement for 531 common stock offerings (Asquith and Mullins (1986))
6

Sources of Funds: US Corporations 1979-97
-40
-20
0
20
40
60
80
100
120
79 80 81 82 83 84 85 86 87 88 89 90 91 92 93 94 95 96 97
% o
f tot
al fi
nanc
ing
Internal Debt Equity
7

Sources of Funds: International 1990-94
-40
-20
0
20
40
60
80
100
120
79 80 81 82 83 84 85 86 87 88 89 90 91 92 93 94 95 96 97
% o
f tot
al fi
nanc
ing
Internal Debt Equity
0
10
20
30
40
50
60
70
80
90
US Japan UK Canada France
Internal Debt Equity
8

Seasoned Equity Offerings (SEOs) 1970-96
0
20
40
60
80
100
7001 7301 7601 7901 8201 8501 8801 9101 9401 9701Date (YearMonth)
Num
ber o
f SEO
s
9

Initial Public Offerings (IPOs) 1960-99
0
20
40
60
80
100
120
140
6001 6307 6701 7007 7401 7707 8101 8407 8801 9107 9501 9807Date (YearMonth)
Num
ber o
f IPO
s
10
Incorporating These Concerns
The irrelevance of financing comes from the fact that existing shareholders (represented by managers) and new shareholders agree on the value of financial claims.
Everybody agrees on the size of the “pie”
This ensures that financial transactions have NPV = 0.
Departing from this framework:Inefficient marketsIrrational managersManagers with more information than investors
11

Managers with more information than investors- The Lemons Problem
Suppose that managers have more information about the firm than outside investors.
Managers prefer to issue equity when equity is overvaluedThus, equity issues signal to investors that equity is overvaluedThus, stock price declines at equity issues announcementsConsequently, managers avoid issuing equityIn some cases, they may even forgo positive NPV projects rather than issue equity
12

Equity financing: ExampleLet’s set aside taxes and financial distress
XYZ’s assets in place are subject to idiosyncratic risk:
New investment project:Discount rate: 10%Investment outlay: $12MSafe return next year: $22M ==> PV = 22/1.1 = $20M
NPV = -12 + 20 = $8M
Should XYZ undertake the project?
150 p=0.550 p=0.5
Assets value
13

Case 1: Managers know as much as outside investors
Suppose that XYZ has $12M in cash for investmentIf internally financed with cash, existing shareholders realize the full $8M NPV of the investment.
Suppose that XYZ does not have the cash but can issue $12M in equity
Once the project funded, the firm is worth 100 + 20 = $120MRaise $12M by selling 10% of shares (after issue)Existing shareholders get 90% * 120 = $108MTo be compared with $100M if did not investExisting shareholders gain $8M
With no information asymmetries, managers are indifferent between internal and external financing
14

Case 2: Managers know more than outside investors
150 p=0.5 150 p=150 p=0.5
Shareholders ManagersAssets value from the perspective of
Internal financingAs before, existing shareholders gain $8M
Equity financingRaise $12M by selling 10% of shares (after issue), valued by themarket at 120 (i.e., 100 + 20).Existing shareholders get 90% * (150 + 20) = $153M.Existing shareholders gain only $3M
When equity is undervalued, managers prefer to finance internally than to issue equity
15

Case 2 (cont.): How about debt financing?
With debt financing:Raise $12M and repay (1.1) * 12 = $13.2M next yearExisting shareholders get the full $8M because:
150 + (22 - 13.2)/1.1 = $158M
When equity is undervalued, managers prefer to finance with debt than equity
16

Why Is Safe Debt Better Than Equity?
Its value is independent of the information
Managers and the market give it the same value
Safe debt is fairly priced no lemon’s problem
Risky debt is somewhere “between” safe debt and equity
There is some lemon’s problem associated with risky debt but it is less severe than with equity
17

Lemon’s problem: Implications
If your assets are worth $150M, you will not want to issue equity, but will finance internally or with debt
If you choose to issue equity, investors will know that your assets must be worth only $50M
Consequently, stock price will fall when you announce an equity issue
By how much?
18
Example (cont.): Market Reaction
Recall market’s expectationsAssets are $150 (prob. = ½) or $50 (prob. = ½)So currently, assets are valued at $100
Upon seeing an equity issue, the market infers that the firm is sitting on negative info:
assets are worth only $50M
The firm’s market value drops to 50 + 20 = $70 when equity issue is announced and new equity is issued
19

Evidence on equity issue announcements
-3.5
-3
-2.5
-2
-1.5
-1
-0.5
0
0.5
-10 -8 -6 -4 -2 0 2 4 6 8 10
Day after announcement
Cum
ulat
ive
Exce
ss R
etur
n (%
)
Average cumulative excess returns from 10 days before to 10 days after announcement for 531 common stock offerings (Asquith and Mullins (1986))
20

Evidence on announcement effects
Stock price reaction to issues:Straight Debt: Little or no effectConvertible Debt: - 2% (9% of proceeds)Equity: - 3% (25% of proceeds)
Stock repurchases: +13%
21

Example (cont.): Underinvestment
Suppose investment outlay is $18M not $12M.NPV = -18 + 22/1.1 = $2M
Raising $18M requires selling 15% of sharesExisting shareholders get 85% * (150 + 20) = $144.5MThey lose $5.5M relative to $150M if did not invest.
XYZ will not issue equity to fund project.
22

Key Point: Investment Depends on Financing
Some projects will be undertaken only if funded internally or with relatively safe debt
Information asymmetries can lead companies to forgo good project
Companies with less cash and more leverage will be more prone to this underinvestment problem
Issuing safe debt is more difficult at high leverageAlso, issuing too much debt may lead to financial distress
23

Pecking Order and Capital Structure
Basic Pecking Order:Firms will use cash when availableOtherwise use debt
High cash-flow ==> No need to raise debt==> In fact, can repay some debt==> Leverage ratio decreases
Low cash-flow ==> Need to raise debt==> Reluctance to raise equity==> Leverage ratio increases
24

Key Point
If Pecking Order holds, a company’s leverage ratio results:not from an attempt to approach a target ratio;but rather from series of incremental financing decisions.
Contrary to the Target Capital Structure Approach, the Pecking Order implies that capital structure can move around a lot.
25

AIRLINES
0.00
0.10
0.20
0.30
0.40
0.50
0.60
1980 1985 1990 1995
%
Industry Leverage
26

AIRLINES
0.00
0.10
0.20
0.30
0.40
0.50
0.60
1980 1985 1990 1995
%
Industry Leverage Industry ROA
27

Target Capital Structure Approach, cont.
VU
Leverage
Firm
val
ue
VL with tax shields, but no distress
VL with tax shields and distress
VL according to MM
Optimal capital structure
28

Key Point: Timing of Equity Issues
There may be ''good'' and ''bad'' times to issue stock.
Best not to issue when lots of information asymmetry --i.e., should issue when price impact of issue is lowest.
29

Initial Public Offerings (IPOs) 1960-99
0
20
40
60
80
100
120
140
6001 6307 6701 7007 7401 7707 8101 8407 8801 9107 9501 9807Date (YearMonth)
30

Evidence on timing of equity issues
Firms tend to issue more equity in booms and less in busts
NPV of investment opportunities are higher, so firms are willing to incur the costs of issuing equity
In fact, when lots of firms are issuing, the stock price impact of an equity issue is low
Caveat: Is this because information problems are lower or because stock markets are inefficient -- i.e., systematically misprice equity?
31

Managerial Behavior and Capital Structure
So far, we assumed that managers act in the interest of shareholders.
But is it always true?
Conflicts of interests between managers and shareholders are called agency problems
32
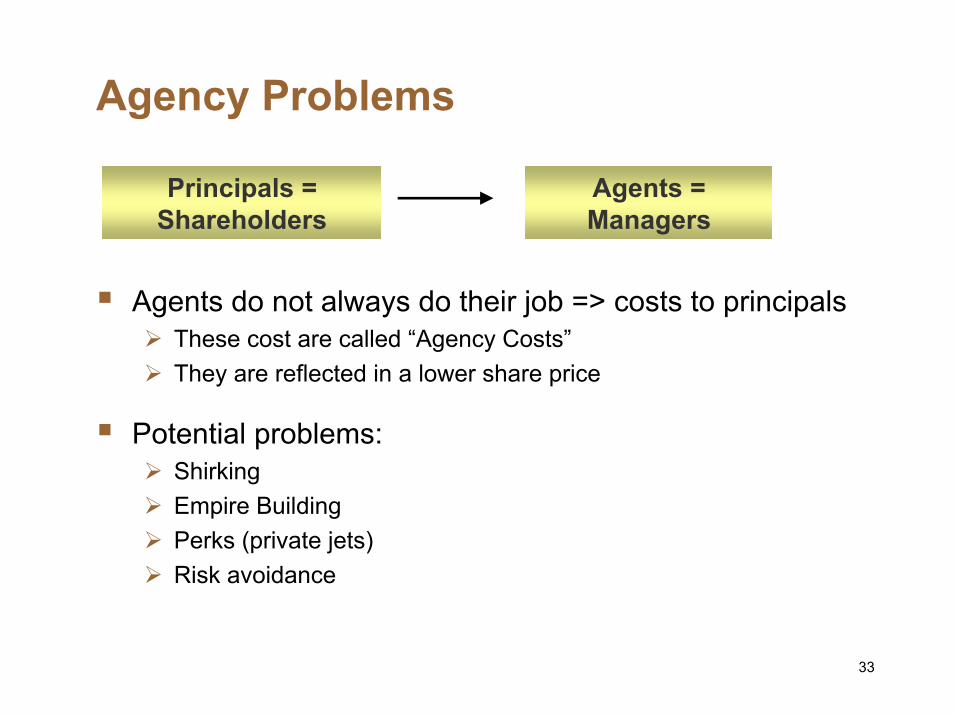
Agency Problems
Principals = Shareholders
Agents = Managers
Agents do not always do their job => costs to principalsThese cost are called “Agency Costs”They are reflected in a lower share price
Potential problems:ShirkingEmpire BuildingPerks (private jets)Risk avoidance
33

Avoiding Agency Costs
Compensation policy
Monitoring managers’ actionsIndependent directors on the BoardBanks as lendersLarge block holders
Market for Corporate Control (i.e. takeovers)
Can leverage help to avoid agency costs?
34

A Classic Agency Problem: The Free Cash Flow Problem
Free Cash Flow (FCF)Cash flow in excess of that needed to fund all positive NPV projects
Managers may be reluctant to pay out FCF to shareholdersEmpire building through unprofitable acquisitionsPet projects, prestige investments, perks
This problem is more severe for “cash cows”Firms with lots of cash (i.e., profitable firms)And few good investment opportunities
35

Example of FCF ProblemsEvidence from the Oil Industry (Jensen, 1986)
From 1973 to 1979: tenfold increase in crude oil pricesOil industry expandedOil consumption fell
The oil industry at the end of 1970sLots of excess capacityLots of cash (because of high prices)
What did managers do?
36

Example of FCF Problems (cont.)What did managers do?
They did not pay out cash to shareholders
Continued spending on exploration and development (E&D)Stock prices reacted negatively to the announcements of increases in E&D by oil companies during 1975 – 81
Invested outside of industryMobile purchased Marcor (retail)Exxon purchased Reliance Electric (manufacturing) and Vydec(office equipment)These acquisitions turned out to be least successful of the decade
37

Can leverage reduce FCF problem?
Debt = commitment to distribute cash flows in the futureIf managers cannot keep the promise to pay interest (principal),bondholders can shut down the firm
Thus, debt reduces FCF available to managersLess opportunities for managers to waist cash
How about commitment to pay dividends?Dividends also reduce FCFBut a commitment to pay dividends cannot be enforced
38

Leveraged Buyouts (LBOs)
LBO is a going-private transactionTypically, incumbent management acquires all publicly-traded sharesLBOs are often financed with debt (D/E ratios of 10 are not uncommon)
Kaplan (1989 JFE) finds in a sample of 76 LBOs:Debt / Value went from 18.8% to 87.8%42% premium paid to shareholders to go privateIn three years after the buyout
• Operating Income / TA increased by 15%• Operating Income / Sales increased by 19%• Net cash flow increased and capital expenditures decreased
Do LBOs improve efficiency through the control function of debt?
39
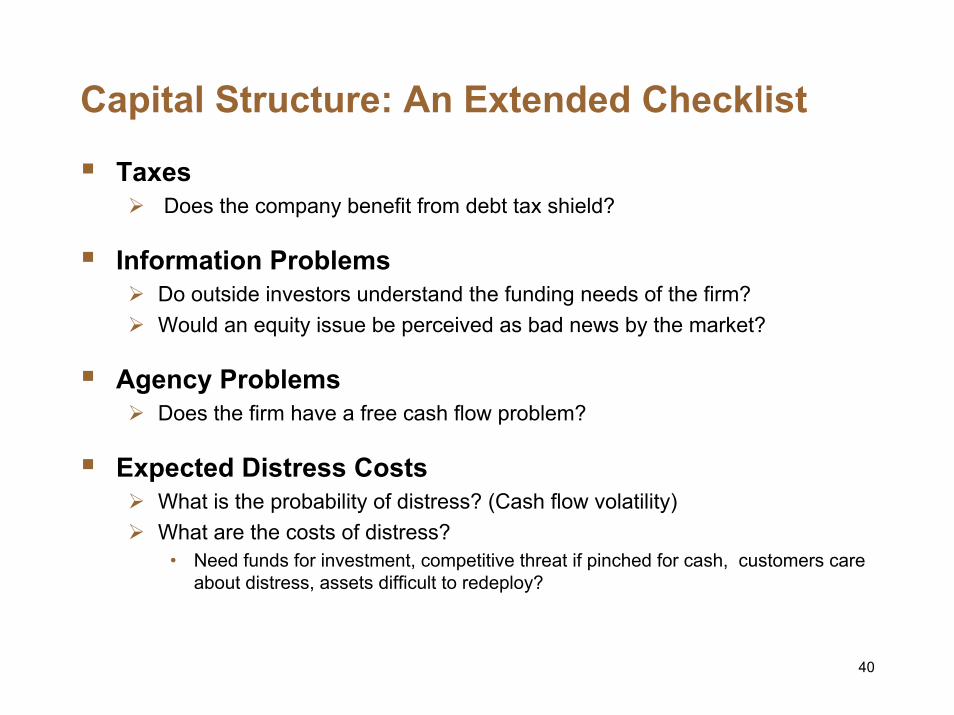
Capital Structure: An Extended Checklist
TaxesDoes the company benefit from debt tax shield?
Information ProblemsDo outside investors understand the funding needs of the firm?Would an equity issue be perceived as bad news by the market?
Agency ProblemsDoes the firm have a free cash flow problem?
Expected Distress CostsWhat is the probability of distress? (Cash flow volatility)What are the costs of distress?
• Need funds for investment, competitive threat if pinched for cash, customers care about distress, assets difficult to redeploy?
40


