
CAPITAL MARKETS OVERVIEW
ULI The State of Industrial MarketsLivingston, NJApril 2018

| 2
DISCLAIMER
Holliday Fenoglio Fowler, LP (“HFF”) and HFF Securities LP (“HFFS”) are owned by HFF, Inc. (NYSE: HF). HFF operates out of 26 offices worldwide and is a leading provider of commercial real estate andcapital markets services to the U.S. commercial real estate industry. HFF together with its affiliate HFFS offer clients a fully integrated national capital markets platform including debt placement, investmentsales, advisory services, structured finance, private equity, loan sales, and commercial loan servicing.
Forward-Looking StatementsCertain statements in this presentation are “forward-looking statements” within the meaning of the federal securities laws. Statements about our beliefs and expectations and statements containing the words“may,” “could,” “would,” “should,” “believe,” “expect,” “anticipate,” “plan,” “estimate,” “target,” “project,” “intend” and similar expressions constitute forward-looking statements. These forward-lookingstatements involve known and unknown risks, uncertainties and other factors that may cause results and performance in future periods to be materially different from any future results or performancesuggested in forward-looking statements in this presentation. Investors, potential investors and other readers are urged to consider these factors carefully in evaluating the forward-looking statements and arecautioned not to place undue reliance on such forward-looking statements. Any forward-looking statements speak only as of the date of this presentation and, except to the extent required by applicablesecurities laws, HFF (the Company) expressly disclaims any obligation to update or revise any of them to reflect actual results, any changes in expectations or any change in events. If the Company doesupdate one or more forward-looking statements, no inference should be drawn that it will make additional updates with respect to those or other forward-looking statements.
Industry and Market DataIn this presentation, we rely on and refer to information and statistics regarding economic conditions, trends, and our market in the sectors of that market in which we compete. In particular, we have obtainedgeneral industry information and statistics from certain third-party Source. We believe that these Source of information and estimates are reliable and accurate, but we have not independently verified them.
DisclaimersThe views expressed in this memo are strictly those of the undersigned author. This memo is offered solely for informational purposes only and should not be relied upon in connection with any investment orother decisions of the reader thereof. No representations or warranties are made with respect to any statements set forth in this memo and neither the undersigned nor HFF assumes any liability inconnection herewith. Prior to entering into any investment or other decision or transaction the reader should, among other things, perform its own diligence, research and analysis. The author has not andwill not receive any direct compensation for providing commentary that explicitly contributes to the reader's election to engage HFF and its associated entities for services related to and including, but notlimited to, investment sales, debt placement, advisory services, loan sales, equity placement, securities solicitation and/or loan servicing. Opinions, estimates and projections in this report constitute thecurrent judgment and belief of the author, solely, as of the date of this report. They do not necessarily reflect the opinion of HFF and are subject to change without notice. Neither the author nor HFF has anyobligation to update, modify, amend or continue publishing this report or to otherwise notify a recipient thereof in the event that any opinion, forecast or estimate set forth herein, changes or subsequentlybecomes inaccurate. Prices and availability of financial instruments are subject to change without notice. This report is provided for informational purposes only. It is not an offer or a solicitation of an offer tobuy or sell any financial instruments or commercial real estate asset, or to participate in, or develop, any particular strategy. Investment in commercial real estate assets, loans collateralized by same, or inany financial instrument herein may not be suitable for all investors and investors must make their own informed investment decisions. Stock, bond and derivative transactions can lead to losses as a result ofprice fluctuations and other factors. Past performance is not necessarily indicative of future results. Statements pertaining to beliefs, expectations and statements containing the word(s) may, could, would,should, believe, expect, anticipate, plan, estimate, target, project, intend and similar expressions constitute forward-looking statements. Forward-looking statements involve known and unknown risk,uncertainties and other factors which could cause actual results to differ materially contained in any forward-looking statements.

2 0 1 8 T H E M E S
| 4
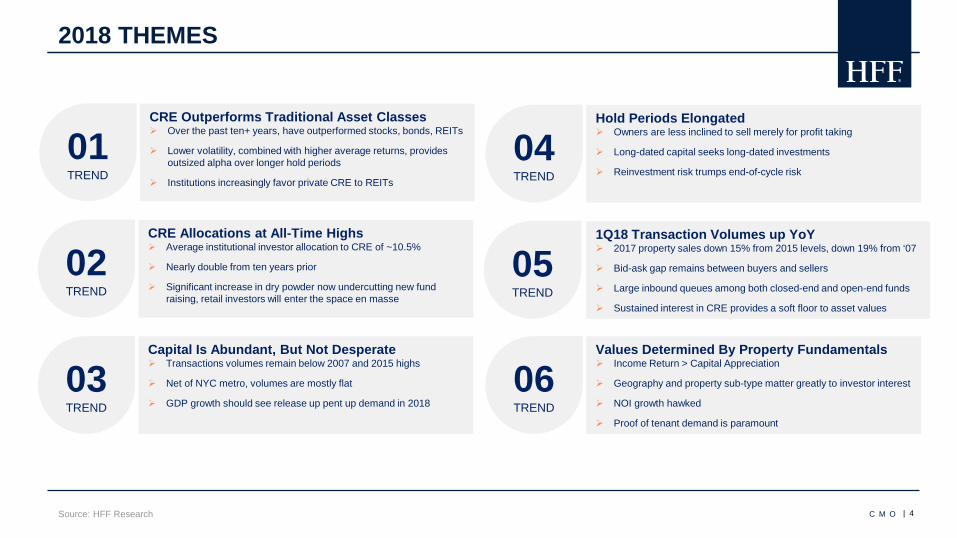
2018 THEMES
Hold Periods Elongated Owners are less inclined to sell merely for profit taking
Long-dated capital seeks long-dated investments
Reinvestment risk trumps end-of-cycle risk
CRE Outperforms Traditional Asset Classes Over the past ten+ years, have outperformed stocks, bonds, REITs
Lower volatility, combined with higher average returns, provides outsized alpha over longer hold periods
Institutions increasingly favor private CRE to REITs
01TREND
CRE Allocations at All-Time Highs Average institutional investor allocation to CRE of ~10.5%
Nearly double from ten years prior
Significant increase in dry powder now undercutting new fund raising, retail investors will enter the space en masse
02TREND
Capital Is Abundant, But Not Desperate Transactions volumes remain below 2007 and 2015 highs
Net of NYC metro, volumes are mostly flat
GDP growth should see release up pent up demand in 201803TREND
1Q18 Transaction Volumes up YoY 2017 property sales down 15% from 2015 levels, down 19% from ‘07
Bid-ask gap remains between buyers and sellers
Large inbound queues among both closed-end and open-end funds
Sustained interest in CRE provides a soft floor to asset values
04TREND
05TREND
Values Determined By Property Fundamentals Income Return > Capital Appreciation
Geography and property sub-type matter greatly to investor interest
NOI growth hawked
Proof of tenant demand is paramount
06TREND
Source: HFF Research C M O

| 5Source: HFF Research, National Council of Real Estate Investment Fiduciaries, Standard & Poors, Barclays, National Association of Real Estate Investment Trusts, NCREIF as of 4Q17
PRIVATE CRE OUTPERFORMS: Private Real Estate Values Resilient
C M O
NCREIF, 244
S&P 500, 214
Barclays, 165
NAREIT, 142
0
50
100
150
200
250
300
2005 2006 2007 2008 2009 2010 2011 2012 2013 2014 2015 2016 2017 2018
Tota
l Ret
urn
Inde
x (D
ec 2
005
= 10
0)
NCREIF S&P 500 Barclays Bond Index NAREIT

| 6
2.1%
3.2%3.7%
2.9%
4.5%5.2%
5.6%
9.6%9.1%
0%
2%
4%
6%
8%
10%
12%
1980 1985 1990 1995 2000 2005 2010 2015 2017 Actual
Port
folio
Tar
get
Allo
catio
n to
Rea
l Est
ate
INSTITUTIONAL ALLOCATIONS CONTINUE INCREASING
2018 Target Allocation10.3%
Target Real Estate Allocation of Institutional Investors
Source: Hodes Weill, Cornell University C M O

| 7Source: HFF Research, NCREIF
CORE UNLEVERED INDUSTRIAL RETURNS PROJECTED TO OUTPERFORM
C M O

| 8Source: HFF Research, NCREIF
WESTERN INDUSTRIAL RETURNS OUTPERFORMING
C M O
| 9Source: HFF Research, NCREIF
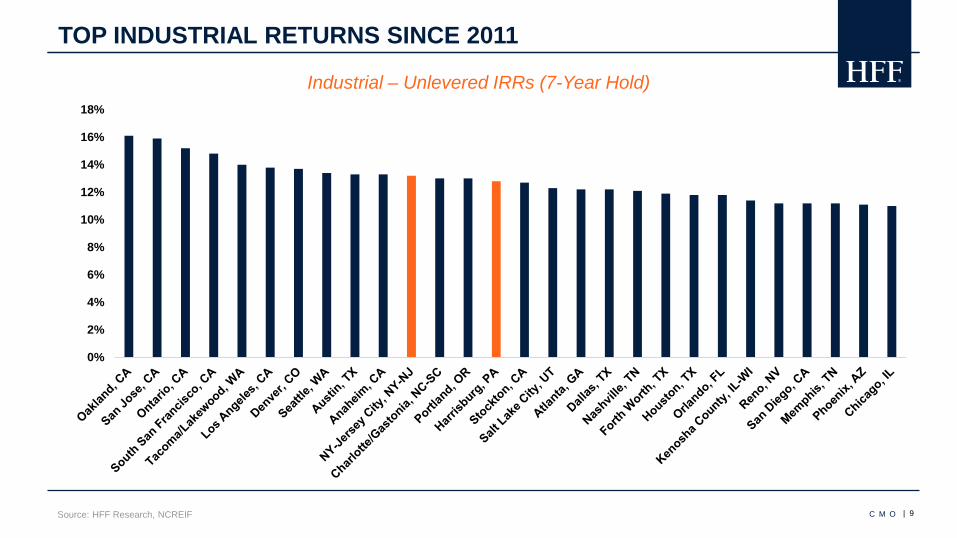
TOP INDUSTRIAL RETURNS SINCE 2011
C M O
0%
2%
4%
6%
8%
10%
12%
14%
16%
18%
Industrial – Unlevered IRRs (7-Year Hold)

T R A N S A C T I O N V O L U M E S

| 11
$68$84
$106
$160
$275$301 $294
$136
$56
$110
$170
$224$249
$314
$372 $372$359
$80 $88
$93$109
$135
$219
$371
$432
$570
$177
$72
$155
$261
$310
$378
$452
$569
$511$487
$109 $114
0.0%
0.5%
1.0%
1.5%
2.0%
2.5%
3.0%
3.5%
4.0%
4.5%
5.0%
5.5%
$0
$100
$200
$300
$400
$500
$600
2001 2002 2003 2004 2005 2006 2007 2008 2009 2010 2011 2012 2013 2014 2015 2016 2017 1Q17 1Q18
Bill
ions
Individual Portfolio Entity 10yr UST
1Q2018 TRANSACTION VOLUMES UP 5% YOY
Source: Real Capital Analytics
5%YoY
C M O

| 12
TRANSACTION PACE BASED ON GEOGRAPHY & PROPERTY TYPE
Source: HFF Research, Real Capital Analytics
If key markets are removed from the data set, national transaction volumes would only be down -1%
Hotel, retail and officedragging headline statistics
2017
VOL ($b) YOY
HOTEL 27.5 -24%
RETAIL 63.4 -18%
OFFICE 131.9 -8%
APARTMENT 150.1 -7%
DEV SITE 18.7 0%
INDUSTRIAL 72.2 20%
TOTAL 463.9 -7%
MAJOR METROS 180.3 -14%
SECONDARY MKTS 214.3 -2%
TERTIARY MKTS 67.2 0%
PORTFOLIO 109.4 -12%
SINGLE ASSET 354.5 -5%
NYC / SFO / SEA
- $21.1B(-43%)
REST OF COUNTRY
- $12.1B(-1%)
C M O
| 13
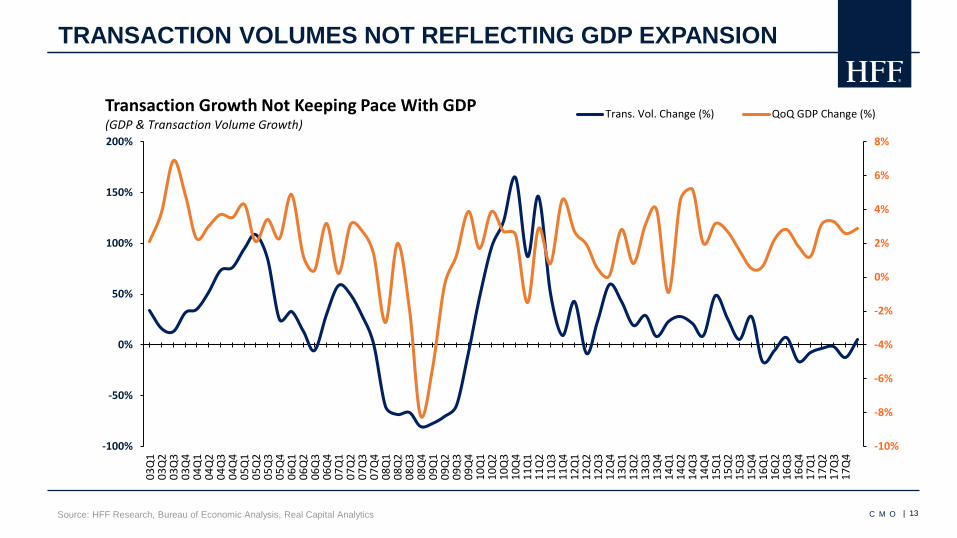
TRANSACTION VOLUMES NOT REFLECTING GDP EXPANSION
Source: HFF Research, Bureau of Economic Analysis, Real Capital Analytics C M O
-10%
-8%
-6%
-4%
-2%
0%
2%
4%
6%
8%
-100%
-50%
0%
50%
100%
150%
200%03
Q1
03Q
203
Q3
03Q
404
Q1
04Q
204
Q3
04Q
405
Q1
05Q
205
Q3
05Q
406
Q1
06Q
206
Q3
06Q
407
Q1
07Q
207
Q3
07Q
408
Q1
08Q
208
Q3
08Q
409
Q1
09Q
209
Q3
09Q
410
Q1
10Q
210
Q3
10Q
411
Q1
11Q
211
Q3
11Q
412
Q1
12Q
212
Q3
12Q
413
Q1
13Q
213
Q3
13Q
414
Q1
14Q
214
Q3
14Q
415
Q1
15Q
215
Q3
15Q
416
Q1
16Q
216
Q3
16Q
417
Q1
17Q
217
Q3
17Q
4
Transaction Growth Not Keeping Pace With GDP(GDP & Transaction Volume Growth)
Trans. Vol. Change (%) QoQ GDP Change (%)

| 14
PORTFOLIO & ENTITY DEALS FLAT YOY
Source: HFF Research, Real Capital Analytics C M O
$25 $26 $29
$59
$96
$131
$277
$41
$13
$38
$63$74
$114 $119
$175
$124$112
$24 $24
$0
$50
$100
$150
$200
$250
$300
2001 2002 2003 2004 2005 2006 2007 2008 2009 2010 2011 2012 2013 2014 2015 2016 2017 1Q17 1Q18
Bill
ions
Portfolio Entity

| 15Source: HFF Research, Real Capital Analytics
2017 WAS A RECORD BREAKING YEAR
C M O
$67.3BTotal Transaction Volume*
6.7KTotal Transactions*
+13%Vs. Previous Peak (2007)*
*Data does not include M&A transactions.

| 16Source: HFF Research, Real Capital Analytics
INDUSTRIAL VOLUME UP 34% YOY
C M O
$16 $13
$16
$25
$50 $52
$61
$27
$10
$21
$35 $38
$47 $51
$78
$60
$73
$16
$21
0%
1%
2%
3%
4%
5%
6%
$-
$10
$20
$30
$40
$50
$60
$70
$80
$90
'01 '02 '03 '04 '05 '06 '07 '08 '09 '10 '11 '12 '13 '14 '15 '16 '17 1Q17 1Q18
Bill
ions
Individual Portfolio Entity 10 Yr UST

| 17Source: HFF Research, Real Capital Analytics
INDUSTRIAL TRANSACTION VOLUME BY REGION
C M O
18%22%
37%
31%
16%
18%29%
28%
$43
$52
$58
$26
$10
$21
$34$38
$46$50
$78
$60
$73
0
10
20
30
40
50
60
70
80
"05 "06 "07 "08 "09 "10 "11 "12 "13 "14 "15 "16 "17
Bill
ions
($)
East West Midwest South
*Data includes M&A transactions.

P R I C E D I F F E R E N T I AT I O N

| 19
2017 TRANSACTION VOLUMES BY MARKET
Source: Real Capital Analytics C M O

| 20Source: HFF Research, Real Capital Analytics
MOST ACTIVE MARKETS BY TRADE VOLUME
C M O
Industrial NOI Growth

E Q U I T Y

| 22
REITS MOVE THE NEEDLE
Source: NAREIT, as of March 31, 2018 C M O
~$1.02 Tn Market Cap
Regional Malls11%
Shopping Centers
6%
Strip4%
Apartments13%
Manufactured Homes
2%
Retail21%
Residential15%
Office12%
Health Care10%
Industrial9%
Data Centers
8%
Self Storage7%
Diversified7%
Lodging/Resorts7%
Specialty4%

| 23
PUBLIC MARKETS OPEN TO REAL ESTATE
Source: NAREIT C M O
$18.8 $19.8
$25.6
$38.8 $38.2
$49.0
$36.0
$18.0
$34.7
$47.5$51.3
$73.3$77.0
$63.6$59.3
$69.6
$92.1
$23.1
$15.0
$0
$10
$20
$30
$40
$50
$60
$70
$80
$90
$100
2001 2002 2003 2004 2005 2006 2007 2008 2009 2010 2011 2012 2013 2014 2015 2016 2017 1Q17 1Q18
Billi
ons
Unsecured Common IPO Preferred Secured
35%1Q18 vs
1Q17

| 24
REITS ALSO FAVOR PRIVATE PLACEMENTS
Source: JP Morgan C M O

| 25
CHANGE IN NON-LISTED REIT FEE REPORTING
Source: HFF Research, MTS Research Advisors C M O
14.5%SALES COSTS
AV E R AGE FR ON T-E N D LOAD S
1.3%ASSET MANAGEMENT FEES
AV E R AGE ON -GO IN G FE E
0.4%PROPERTY MANAGEMENT FEES
AV E R AGE ON -GO IN G FE E
$.84

| 26
BLACKSTONE TURNS THE TIDE
Source: Robert A.Stanger & Co, Inc. C M O
$0$200$400$600$800
$1,000$1,200$1,400$1,600
Jan-15 Apr-15 Jul-15 Oct-15 Jan-16 Apr-16 Jul-16 Oct-16 Jan-17 Apr-17 Jul-17 Oct-17
Mill
ions
Rolling 12-Month Average Monthly Sales
$0
$500
$1,000
$1,500
$2,000
Jan Feb Mar Apr May Jun Jul Aug Sep Oct Nov Dec
Mill
ions
Monthly Sales Trends2015 2016 2017

| 27
OPEN & CLOSED-END FUND AUM UP 114% SINCE 2007
Source: HFF Research, National Council of Real Estate Investment Fiduciaries, Preqin C M O
~$281BILLION + AUM
Open End Funds Closed End Funds
~$469BILLION + AUM
118%INCREASESince 2007
111%INCREASESince 2007
$83 $91 $91 $110 $139$196
$262$351 $336 $306 $342
$429$474
$565$625
$703 $734 $750
$0
$100
$200
$300
$400
$500
$600
$700
$800
2000 2001 2002 2003 2004 2005 2006 2007 2008 2009 2010 2011 2012 2013 2014 2015 2016 Jun-17
Bill
ions
Closed- End Open-End

| 28
DRY POWDER EXCEEDS $175 BILLION USD
Source: HFF Research, Preqin as of 4/24/18 C M O
$26$37
$54
$70
$83 $85$94
$80
$94$89
$105 $103
$118
$133
$151
$177
$0
$20
$40
$60
$80
$100
$120
$140
$160
$180
$200
2003 2004 2005 2006 2007 2008 2009 2010 2011 2012 2013 2014 2015 2016 2017 2018
Bill
ions
113%vs 2007

| 29
PACE OF FUND RAISING SLOWS SIGNIFICANTLY
Source: HFF Research, Preqin as of 4/24/18 C M O
$14.0 $12.7
$10.5 $10.0
$28.7
$38.8
$54.6
$62.7
$72.3
$25.7$28.3
$43.6
$49.3
$71.7
$57.5
$83.6
$75.6$72.9
0
50
100
150
200
250
$0
$10
$20
$30
$40
$50
$60
$70
$80
$90
2000 2001 2002 2003 2004 2005 2006 2007 2008 2009 2010 2011 2012 2013 2014 2015 2016 2017
No. of Funds
Capi
tal R
aise
d (B
illio
ns)
Aggregate Capital Raised ($bn) No. of Funds

| 30
BUY-SIDE IS DIVERSE
Source: Real Capital Analytics, as of year-end 2017 C M O

O V E R S E A S C A P I TA L

| 32
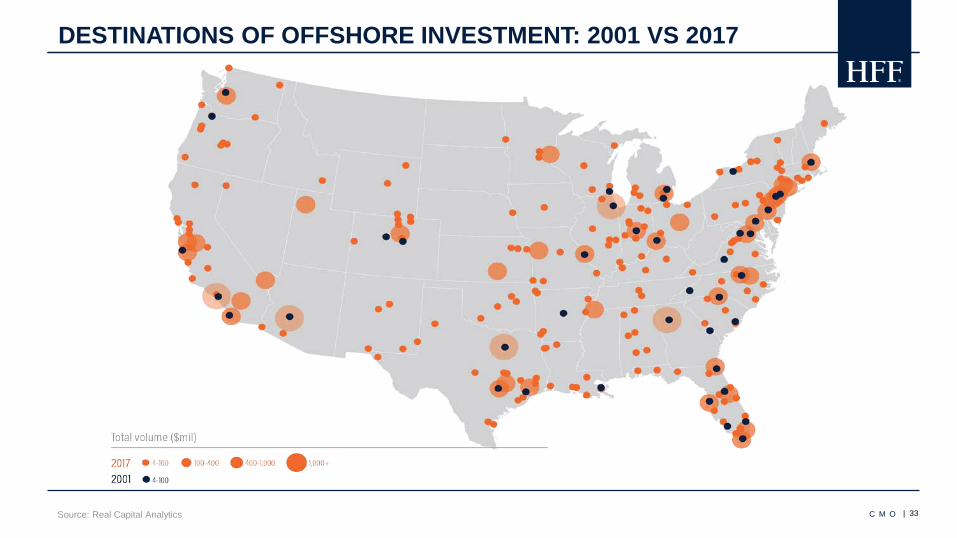
$50.5B OF FOREIGN INVESTMENT IN 2017
$4
$10 $10$16
$25
$42
$76
$17
$5
$13
$24$30
$40$43
$95
$67
$51
0%
2%
4%
6%
8%
10%
12%
14%
16%
18%
$-
$10
$20
$30
$40
$50
$60
$70
$80
$90
$100
2001 2002 2003 2004 2005 2006 2007 2008 2009 2010 2011 2012 2013 2014 2015 2016 2017
Foreign Market Share (%
)
Tota
l For
eign
Cap
ital I
nves
tmen
t $B
Asia Australia Europe MENA North America South America % Mkt Share
Source: Real Capital Analytics C M O
YE 2017
Rank Country Acquisitions ($b) YoY Change
1 Canada $14.63 18%2 Singapore $6.33 92%3 China $5.98 -65%4 Germany $4.56 -26%5 Netherlands $3.26 924%6 Japan $2.41 -11%7 South Korea $1.93 -50%8 Israel $1.61 -38%9 Hong Kong $1.57 -34%10 Norway $1.16 75%11 Switzerland $1.14 -65%12 Australia $0.98 87%13 United Kingdom $0.89 -37%14 Qatar $0.73 -77%15 Denmark $0.5916 France $0.55 -47%17 Spain $0.48 -56%18 Sweden $0.35 -24%19 Finland $0.31 624%20 Kuwait $0.29 -74%21 Chile $0.17 -40%22 Brazil $0.10 -22%23 Mexico $0.09 -36%24 Ireland $0.08 588%25 India $0.07 -22%
| 33
DESTINATIONS OF OFFSHORE INVESTMENT: 2001 VS 2017
Source: Real Capital Analytics C M O

| 34Source: AFIRE 2018 Investment Survey
FOREIGN CAPITAL FAVORS INDUSTRIAL
C M O
Industrial NOI Growth

D E B T
| 36
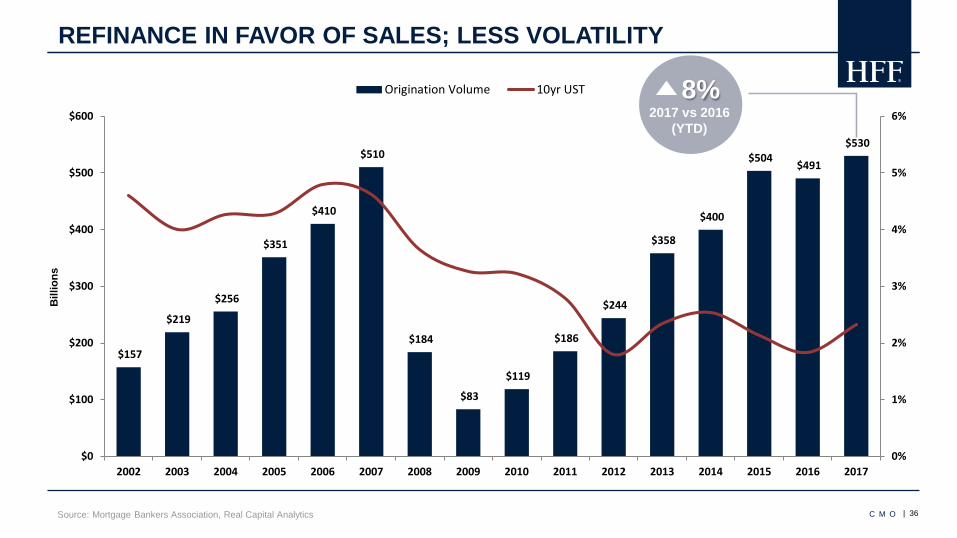
$157
$219
$256
$351
$410
$510
$184
$83
$119
$186
$244
$358
$400
$504 $491
$530
0%
1%
2%
3%
4%
5%
6%
$0
$100
$200
$300
$400
$500
$600
2002 2003 2004 2005 2006 2007 2008 2009 2010 2011 2012 2013 2014 2015 2016 2017
Bill
ions
Origination Volume 10yr UST
REFINANCE IN FAVOR OF SALES; LESS VOLATILITY
Source: Mortgage Bankers Association, Real Capital Analytics
8%2017 vs 2016
(YTD)
C M O
| 37
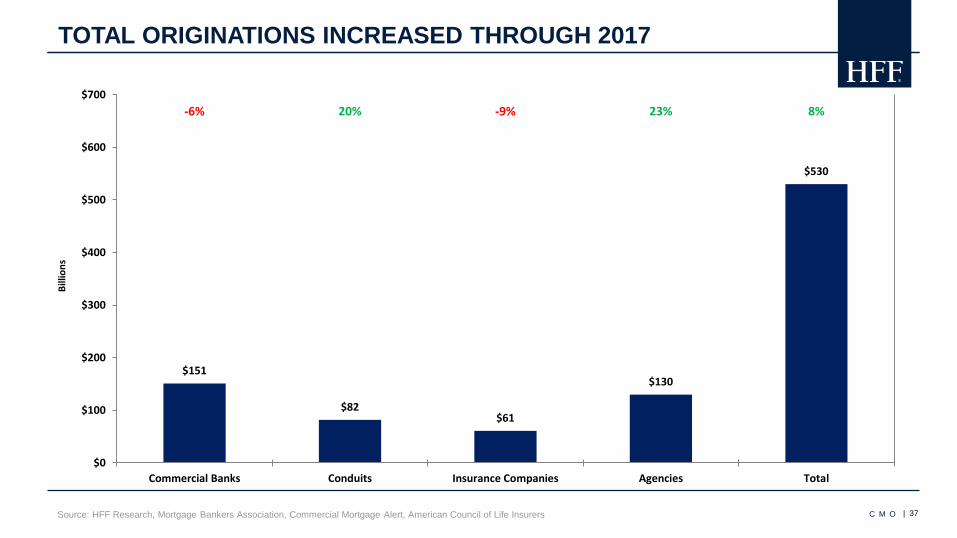
TOTAL ORIGINATIONS INCREASED THROUGH 2017
Source: HFF Research, Mortgage Bankers Association, Commercial Mortgage Alert, American Council of Life Insurers C M O
$151
$82$61
$130
$530
-6% 20% -9% 23% 8%
$0
$100
$200
$300
$400
$500
$600
$700
Commercial Banks Conduits Insurance Companies Agencies Total
Billi
ons

| 38
LENDER COMPOSITION
Source: Real Capital Analytics
18%
13%
19%
28%
25%
22%
17%
16%
3%
54%
8%
8%
9%
9%
7%
5%
6%
5%
3%
11%
6%
25%
22%
19%
19%
17%
27%
27%
31%
49%
24%
6%
10%
12%
12%
10%
12%
14%
20%
15%
10%
9%
5%
37%
43%
39%
33%
37%
31%
30%
31%
33%
53%
28%
2017
2016
2015
2014
2013
2012
2011
2010
2009
2008
2007
CMBS Financial Gov't Agency Insurance Pvt/Other Bank
C M O

| 39
HIGH-YIELD DRIVEN DEBT FUNDS RAISING CAPITAL
Source: HFF Research, Preqin as of 4/24/18 C M O
$0.4
$1.6 $1.4 $1.3
$4.4
$2.7
$4.1
$6.3
$12.2
$7.8
$4.2
$9.6
$4.3
$11.0
$16.3
$8.7
$15.4
$18.7
$5.4
0
5
10
15
20
25
30
35
40
$0
$2
$4
$6
$8
$10
$12
$14
$16
$18
$20
2000 2001 2002 2003 2004 2005 2006 2007 2008 2009 2010 2011 2012 2013 2014 2015 2016 2017 2018
Total Funds Raised
Tota
l Cap
ital R
aise
d
Aggregate Capital Raised ($bn) No. of Funds

| 40
DEBT FUNDS PRICING CREDIT RISK TIGHTLY
Source: HFF Research, HFF CapTrack C M O
0
100
200
300
400
500
600
700
800
900
1,000
45% 50% 55% 60% 65% 70% 75% 80% 85%
Cred
it Sp
read
(bps
)
Loan to Value (%)
Multihousing Office Industrial

P R I C I N G T R E N D S

| 42
SUPPLY FORECAST TO STAY LOW
Source: GreenStreet Advisors as of November 2017
New Completions as % of Existing Stock
C M O
New Completions as % of Existing Stock
Supply in some niches is starting to heat up, but the overall outlook
remains moderate

| 43
REPLACEMENT COST INFLATION LIMITING NEW SUPPLY
Source: Turner Construction, Bloomberg
REIT vs. Construction Cost Index
C M O
80
180
280
380
480
580
680
780
80
100
120
140
160
180
200
220
1996 1997 1998 1999 2000 2001 2002 2003 2004 2005 2006 2007 2008 2009 2010 2011 2012 2013 2014 2015 2016 2017 2018
NAREIT Equity REIT Index
(Indexed to 100)Tu
rner
Con
stru
ctio
n Co
st In
dex,
GDP
Def
lato
r & C
ore
CPI
(Inde
xed
to 1
00)
Construction Costs REIT Values

| 44
$1 BILLION MATURING DAILY NEXT THREE YEARS
Source: Trepp, Federal Reserve C M O
$76
$54
$39 $5
5
$58 $7
8 $96
$104 $1
36
$48
$48$5
5 $64 $7
4
$90
$105 $1
20 $132
$145
$166
$188
$205 $2
13
$211 $1
87
$159
$133
$136
$157
$178 $2
03
$225
$221
$178
$129
$86
$0
$50
$100
$150
$200
$250
$300
$350
$400
$450
2001 2002 2003 2004 2005 2006 2007 2008 2009 2010 2011 2012 2013 2014 2015 2016 2017 2018 2019 2020 2021 2022 2023 2024 2025
CMBS Banks Life Cos Other
Billi
ons
$1.06 Trillion Matures2018-2020
CMBS Peak Maturities$136.0 Billion In 2017

| 45
CLOSED-END FUNDS: 89% HOLD LESS THAN 7 YEARS
Source: Preqin C M O
3 Years or Less, 14%
3.1-5 Years, 50%
5.1-7 Years, 25%
7.1+ Years, 11%

| 46
2.84%
0%
1%
2%
3%
4%
5%
6%
7%
8%
9%
10%
2001 2002 2003 2004 2005 2006 2007 2008 2009 2010 2011 2012 2013 2014 2015 2016 2017 1Q18
CAPITALIZATION RATE SPREADS
RCA: 323 vs. 369
2.98% USTSpreads (bps)
Current vs. LT Avg.
JPM: 262 vs. 292NCREIF: 207 vs. 292
Source: Real Capital Analytics, JPMorgan, National Council of Real Estate Investment Fiduciaries, HFF Research C M O
NCREIFCap Rate
RCACap Rate
JPM ImpliedCap Rate
10 YrUST
Current UST2.98%
In 2007… Treasury – 4.4% Negative & Excessive Leverage NCREIF Cap Rate Below 10yr UST Aggressive Underwriting Metrics Total Return Composition Imbalance

| 47Source: Real Capital Analytics**, Bloomberg*
10 YEAR UST VS INDUSTRIAL CAP RATE: 2007 VS. 2018
C M O
1%
2%
3%
4%
5%
6%
7%
8%
9%
10%
'06 '07 '08 '09 '10 '11 '12 '13 '14 '15 '16 '17 '18
10yr UST* Cap Rate**
373 Basis Points

| 48
25%
20%
17%14%
13%11% 10% 9% 8%
0%
5%
10%
15%
20%
25%
30%
4% 5% 6% 7% 8% 9% 10% 11% 12% 13%
NO
I Gro
wth
Req
uire
d
Starting Capitalization Rate
CAPITALIZATION RATE SENSITIVITY ANALYSIS
Source: HFF Research C M O
NOI Growth vs. Cap Rate Movement
As you can see, these movements are non-linear. The lower a building’s original capitalization rate, the greater the movement in NOI must be in order to maintain a constant gross value.

| 49
BORROWING COST IMPACT ON VALUE
Source: Morgan Stanley Research C M O
Assumes 10 yr Term, 30 yr Amortization, 70% LTV
Annual NOI Growth Required To Maintain IRR Property Value Decline If No NOI Growth…

| 50
COMPOSITION OF TOTAL RETURN
Source: HFF Research, National Council of Real Estate Investment Fiduciaries C M O
-25%
-20%
-15%
-10%
-5%
0%
5%
10%
15%19
7919
8119
8319
8519
8719
8919
9119
9319
9519
9719
9920
0120
0320
0520
0720
0920
1120
1320
1520
17
Total Return Moderating On Lower Capital Appreciation(Components of NCREIF NPI Total Return)
Income Return Capital Appreciation
89%
51%
34% 37% 35%
-79%
-37%
52%43%
55% 51%45%
38%
60%67%
-100%
-80%
-60%
-40%
-20%
0%
20%
40%
60%
80%
100%
Income Return Nearing 75% Of Total Return(Income Return As % of Total Return)
| 51
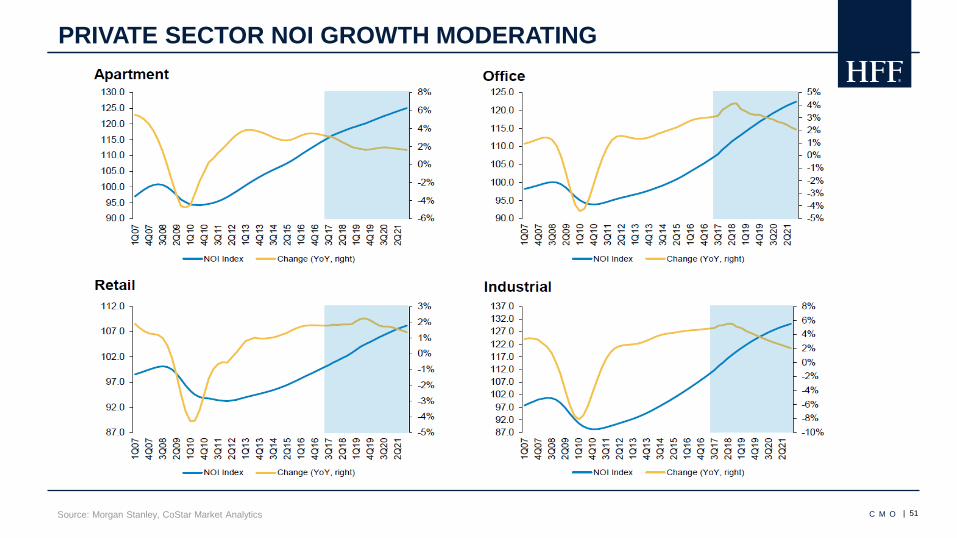
PRIVATE SECTOR NOI GROWTH MODERATING
Source: Morgan Stanley, CoStar Market Analytics C M O

| 52
MATURE NOI GROWTH CYCLE?
Source: National Council of Real Estate Investment Fiduciaries C M O
80
100
120
140
160
180
200
220
1992 1993 1994 1995 1996 1997 1998 1999 2000 2001 2002 2003 2004 2005 2006 2007 2008 2009 2010 2011 2012 2013 2014 2015 2016 2017
NO
I Gro
wth
Inde
x (J
an 1
991
= 10
0)
Double-Header or Extra Innings?(Same Store NOI Growth)
1990s NOI Growth Cycle• Lasted 8 yrs• Produced 52% NOI Growth
2000s NOI Growth Cycle• Lasted 4 yrs• Produced 17% NOI Growth
2010s NOI Growth Cycle• 7 yrs old• Has produced 37% NOI Growth

| 53Source: HFF Research, Bloomberg, as of April 24, 2018
U.S. OFFERING ATTRACTIVE YIELDS & PERFORMANCE
COUNTRY 2 YEAR 3 YEAR 5 YEAR 7 YEAR 10 YEAR 30 YEARSwitzerlandJapanNetherlandsGermanyBelgiumSwedenFranceItalySpainDenmarkUnited KingdomUnited States
COUNTRY 2 YEAR 3 YEAR 5 YEAR 7 YEAR 10 YEAR 30 YEARUnited States 2.476 2.636 2.821 2.936 2.975 3.144United Kingdom 0.859 0.903 1.200 1.341 1.537 1.942France -0.504 -0.299 0.088 0.410 0.841 1.668Germany -0.565 -0.406 -0.006 0.250 0.632 1.292Japan -0.138 -0.125 -0.098 -0.036 0.051 0.735
Bond Maturity in Years
NEGATIVE INTEREST RATE POSITIVE INTEREST RATE
C M O

I N D U S T R I A L T R E N D S

| 55Source: HFF Research, Green Street Advisors, SNL Financial
INDUSTRIAL REITS ARE OUTPERFORMING OVERALL MARKET
C M O

| 56Source: HFF Research, Real Capital Analytics, CBRE Research
CAPITAL BEING CAUTIOUS LATE IN THE CYCLE
C M O
Industrial NOI Growth

| 57Source: HFF Research
NATIONAL PRICING METRICS
C M O
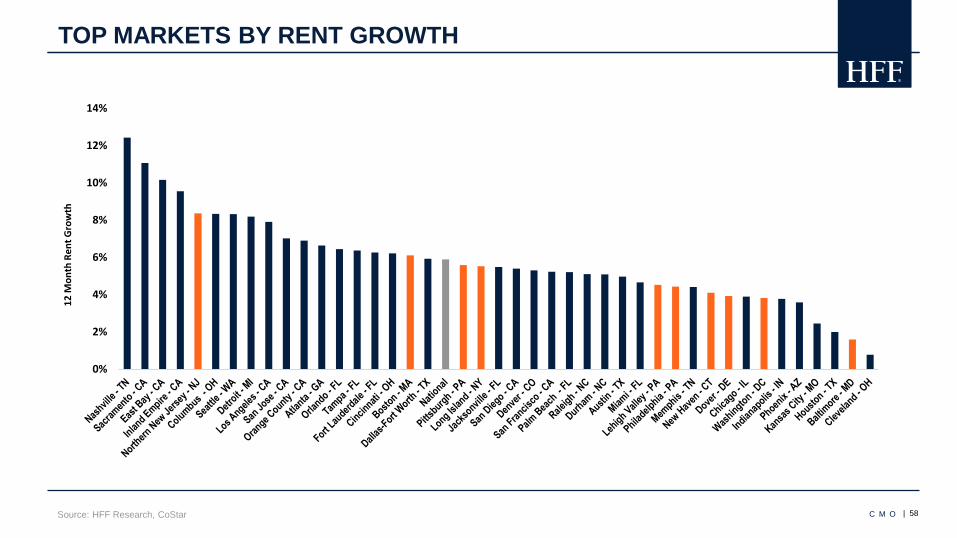
| 58Source: HFF Research, CoStar
TOP MARKETS BY RENT GROWTH
C M O
0%
2%
4%
6%
8%
10%
12%
14%
12 M
onth
Ren
t Gro
wth

| 59Source: HFF Research, NAIOP
EVOLVING CONSUMER HABITS
C M O
0%
1%
2%
3%
4%
5%
6%
7%
8%
9%
10%
2000 2001 2002 2003 2004 2005 2006 2007 2008 2009 2010 2011 2012 2013 2014 2015 2016 2017
E-Commerce Retail Sales as % of Total Sales
• Online sales at $452 billion in 2017 (17% increase year-over-year)• Forecasted to increase from 9.1% in 2017 to 25% of overall sales by 2025.
| 60Source: HFF Research, NAIOP
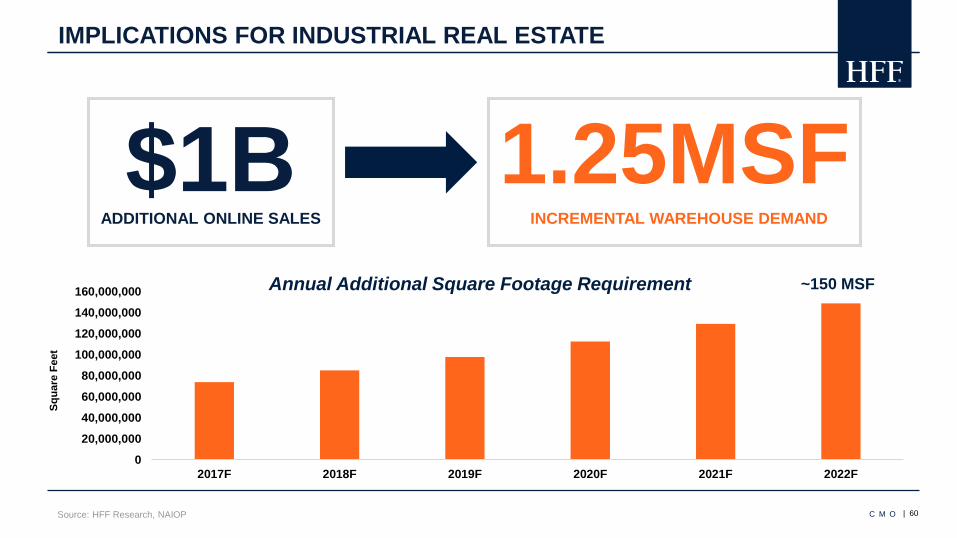
IMPLICATIONS FOR INDUSTRIAL REAL ESTATE
C M O
020,000,00040,000,00060,000,00080,000,000
100,000,000120,000,000140,000,000160,000,000
2017F 2018F 2019F 2020F 2021F 2022F
Squa
re F
eet
~150 MSFAnnual Additional Square Footage Requirement
$1BADDITIONAL ONLINE SALES
1.25MSFINCREMENTAL WAREHOUSE DEMAND

| 61Source: HFF Research, Los Angeles / Long Beach Port Tonnage Freight Report
TOP PORT SYSTEM ACTIVITY
C M O
RANK PORT TEU’S
1 Los Angeles / Long Beach 15.0M
2 New York / New Jersey 6.4M
3 Savannah 3.7M
4 Seattle / Tacoma 3.6M
5 Hampton Roads 2.6M
6 Oakland 2.4M
7 Houston 2.2M
8 Charleston 2.0M

| 62Source: HFF Research, World Shipping Organization, Panama Canal Authority
IMPACT OF PANAMA CANAL PROJECT
C M O

| 63Source: HFF Research, NAIOP
CAPITALIZING ON TRADE FLOW FROM CHINA
C M O

| 64Source: HFF Research, NAIOP
COLD STORAGE IS GAINING MOMENTUM
C M O
• Online sales at $19 billion (3% of total grocery sales) in 2017 • Forecasted to $100 billion (13%) by 2024.
36% of survey participants plan to order groceries online in 2018, up from 22% in 2017.
8%
19%22%
36%
0%
5%
10%
15%
20%
25%
30%
35%
40%
2015 2016 2017 2018
2015-2018 eGrocery Adoption
% of US consumers who grocery shopped online

| 65Source: The Washington Post
INDUSTRIAL SECTOR IMPACTED BY POTENTIAL TRADE REGULATIONS
C M O

| 66Source: The Washington Post
EXPORTS EFFECTED BY POTENTIAL TARIFFS
C M O

H F F L P . C O M
PRESENTER
Jimmy HintonManaging Director(713) [email protected]
Atlanta | Austin | Boston | Carolinas | Chicago | Denver Dallas | New Jersey | Houston | Indianapolis | Los AngelesMiami | New York | Orange County | Orlando | PhiladelphiaPhoenix | Pittsburgh | Portland | San Diego | San FranciscoSeattle | Tampa | Washington, D.C. | London


