
B U R N A B Y H O U S I N G P R O F I L E – 2 0 1 6 1
PLANNING AND BUILDINGPLANNING AND BUILDING
S e p t e m b e r 2 0 1 6
Burnaby Housing Profile – 2016

B U R N A B Y H O U S I N G P R O F I L E – 2 0 1 6 B U R N A B Y H O U S I N G P R O F I L E – 2 0 1 6
E X E C U T I V E S U M M A RY
Burnaby’s Housing Program . . . . . . . . . . . . . . . . . . . . . . . 1
Burnaby’s Housing Highlights . . . . . . . . . . . . . . . . . . . . . . 3
Looking Ahead . . . . . . . . . . . . . . . . . . . . . . . . . . . . . . . . 7
PA R T 1 - P L A N N I N G F O R H O U S I N G
1 .0 About this Report . . . . . . . . . . . . . . . . . . . . . . . . . . 13
2 .0 Housing Types: A Historical Snapshot . . . . . . . . . . . . . . 15
PA R T 2 - H O U S I N G P R I M E R
1 .0 Housing Continuum . . . . . . . . . . . . . . . . . . . . . . . . . 27
2 .0 Housing Built Form . . . . . . . . . . . . . . . . . . . . . . . . . 37
3 .0 Housing Development . . . . . . . . . . . . . . . . . . . . . . . . 43
4 .0 Housing Cost . . . . . . . . . . . . . . . . . . . . . . . . . . . . . 51
5 .0 The Role of Government . . . . . . . . . . . . . . . . . . . . . . 55
PA R T 3 - H O U S I N G P O L I C Y
1 .0 Guiding Policies . . . . . . . . . . . . . . . . . . . . . . . . . . . 67
2 .0 Community Plans . . . . . . . . . . . . . . . . . . . . . . . . . . 75
3 .0 Supporting Policies . . . . . . . . . . . . . . . . . . . . . . . . . 77
C O N T E N T S
i
B U R N A B Y H O U S I N G P R O F I L E – 2 0 1 6 B U R N A B Y H O U S I N G P R O F I L E – 2 0 1 6ii iii
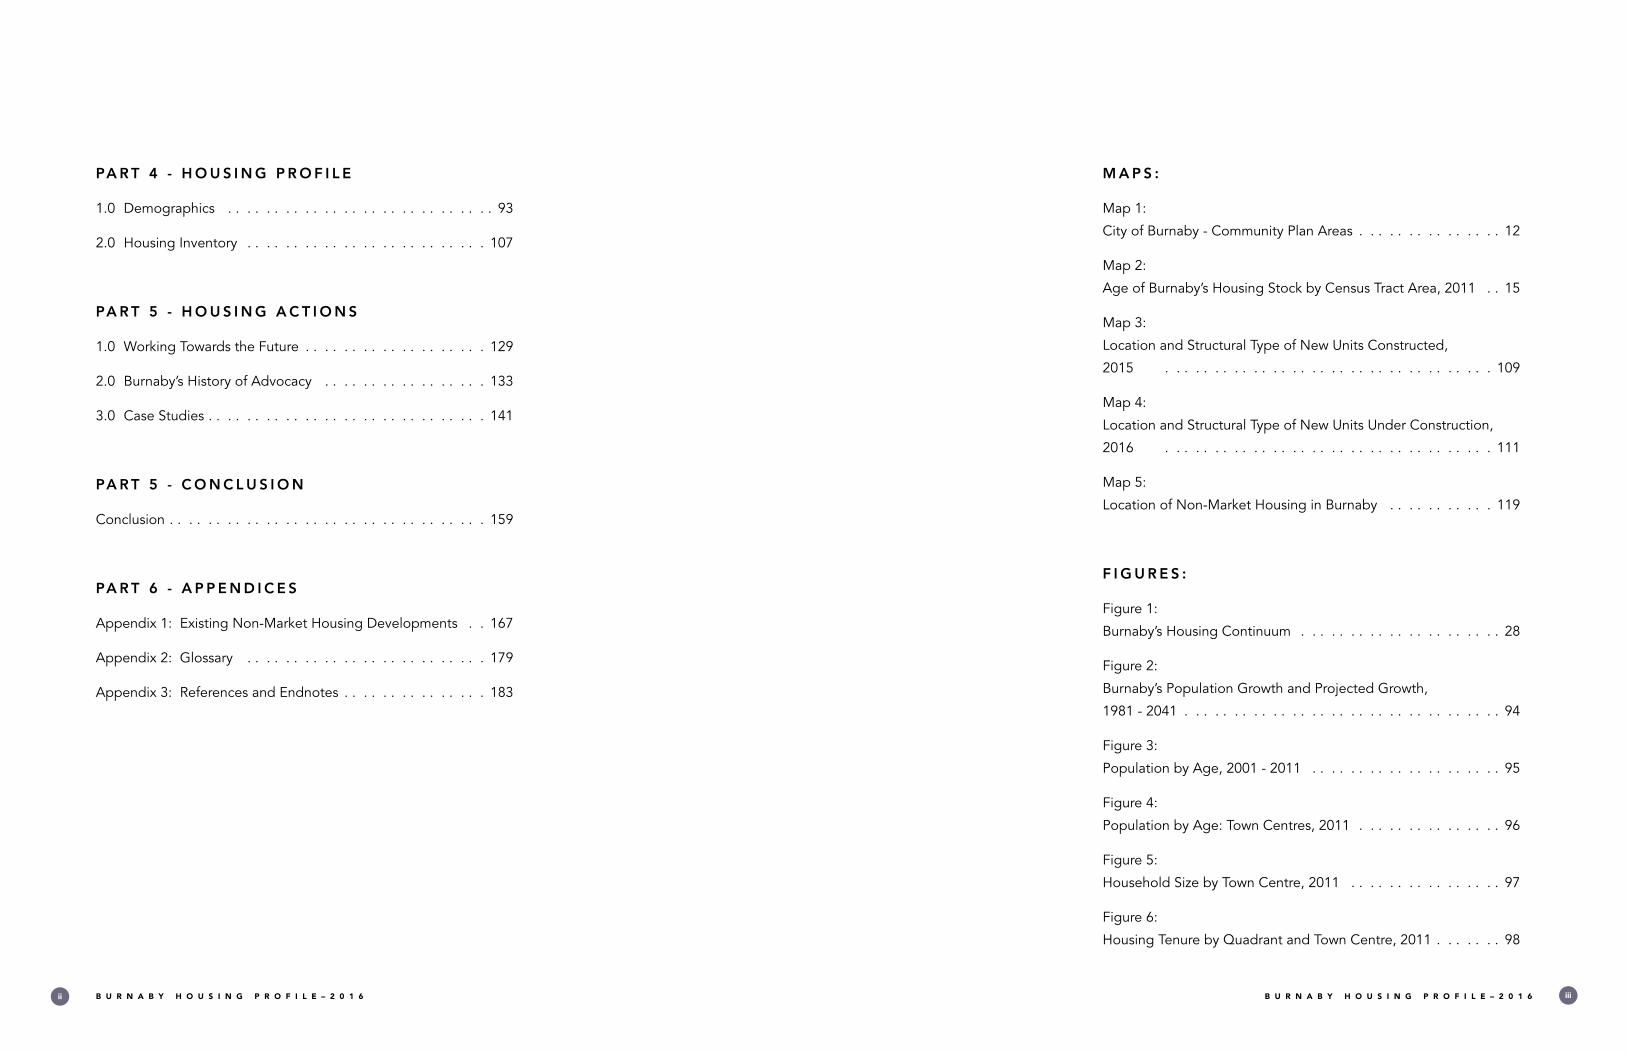
PA R T 4 - H O U S I N G P R O F I L E
1 .0 Demographics . . . . . . . . . . . . . . . . . . . . . . . . . . . . 93
2 .0 Housing Inventory . . . . . . . . . . . . . . . . . . . . . . . . . 107
PA R T 5 - H O U S I N G A C T I O N S
1 .0 Working Towards the Future . . . . . . . . . . . . . . . . . . . 129
2 .0 Burnaby’s History of Advocacy . . . . . . . . . . . . . . . . . 133
3 .0 Case Studies . . . . . . . . . . . . . . . . . . . . . . . . . . . . . 141
PA R T 5 - C O N C L U S I O N
Conclusion . . . . . . . . . . . . . . . . . . . . . . . . . . . . . . . . . 159
PA R T 6 - A P P E N D I C E S
Appendix 1: Existing Non-Market Housing Developments . . 167
Appendix 2: Glossary . . . . . . . . . . . . . . . . . . . . . . . . . 179
Appendix 3: References and Endnotes . . . . . . . . . . . . . . . 183
M A P S :
Map 1:
City of Burnaby - Community Plan Areas . . . . . . . . . . . . . . . 12
Map 2:
Age of Burnaby’s Housing Stock by Census Tract Area, 2011 . . 15
Map 3:
Location and Structural Type of New Units Constructed,
2015 . . . . . . . . . . . . . . . . . . . . . . . . . . . . . . . . . . 109
Map 4:
Location and Structural Type of New Units Under Construction,
2016 . . . . . . . . . . . . . . . . . . . . . . . . . . . . . . . . . . 111
Map 5:
Location of Non-Market Housing in Burnaby . . . . . . . . . . . 119
F I G U R E S :
Figure 1:
Burnaby’s Housing Continuum . . . . . . . . . . . . . . . . . . . . . 28
Figure 2:
Burnaby’s Population Growth and Projected Growth,
1981 - 2041 . . . . . . . . . . . . . . . . . . . . . . . . . . . . . . . . . 94
Figure 3:
Population by Age, 2001 - 2011 . . . . . . . . . . . . . . . . . . . . 95
Figure 4:
Population by Age: Town Centres, 2011 . . . . . . . . . . . . . . . 96
Figure 5:
Household Size by Town Centre, 2011 . . . . . . . . . . . . . . . . 97
Figure 6:
Housing Tenure by Quadrant and Town Centre, 2011 . . . . . . . 98

B U R N A B Y H O U S I N G P R O F I L E – 2 0 1 6 B U R N A B Y H O U S I N G P R O F I L E – 2 0 1 6iv v
Figure 7:
Median Income by Household Type, 2001 - 2011 . . . . . . . . . 99
Figure 8:
Household Income Distribution in Each Town Centre, 2011 . . 100
Figure 9:
Housing Price Index by Structure Type, 2007 - 2016 . . . . . . . 103
Figure 10:
Median Rental Rate for Purpose-built Market Rental Units,
2005 - 2015 . . . . . . . . . . . . . . . . . . . . . . . . . . . . . . . . 104
Figure 11:
New Units Constructed by Structural Type, 2011 - 2015 . . . . 108
Figure 12:
Residential Units Under Construction by Structural Type
(Building Permits Issued) . . . . . . . . . . . . . . . . . . . . . . . . 110
Figure 13:
Purpose-built Rental Units by Decade of Construction . . . . . 122
TA B L E S :
Table 1:
Government Responsibilities . . . . . . . . . . . . . . . . . . . . . . 56
Table 2:
Population Growth in the Town Centres, 2001 - 2011 . . . . . . . 95
Table 3:
Proportion of Tenant and Owner Households Spending
More Than 30% of Household Income on Housing,
2001 - 2011 . . . . . . . . . . . . . . . . . . . . . . . . . . . . . . . . 101
Table 4:
Household Income Categories . . . . . . . . . . . . . . . . . . . . 101
Table 5:
The HPI for Different Housing Structure Types in Burnaby,
July 2016 . . . . . . . . . . . . . . . . . . . . . . . . . . . . . . . . . 102
Table 6:
Median Rents for Purpose-built Rental Units By Unit Type,
2011 - 2015 . . . . . . . . . . . . . . . . . . . . . . . . . . . . . . . . 104
Table 7:
Burnaby Households Receiving Rent Supplements . . . . . . . 105
Table 8:
Metro Vancouver Homeless Count Results for Burnaby,
2005 - 2014 . . . . . . . . . . . . . . . . . . . . . . . . . . . . . . . . 106
Table 9:
Housing Stock by Structural Type, 2015 . . . . . . . . . . . . . . 107
Table 10:
New Units Constructed by Structural Type, 2011 - 2015 . . . . . 108
Table 11:
Transitional Housing Facilities in Burnaby . . . . . . . . . . . . . 113
Table 12:
Group Homes in Burnaby . . . . . . . . . . . . . . . . . . . . . . . 114
Table 13:
Long Term Care Homes in Burnaby . . . . . . . . . . . . . . . . . 114
Table 14:
Assisted Living Residences in Burnaby . . . . . . . . . . . . . . . 115
Table 15:
Supportive Housing in Burnaby . . . . . . . . . . . . . . . . . . . 116
Table 16:
Estimate of Market Rental Housing Stock, 2015 . . . . . . . . . 121
B U R N A B Y H O U S I N G P R O F I L E – 2 0 1 6 B U R N A B Y H O U S I N G P R O F I L E – 2 0 1 6vi 1
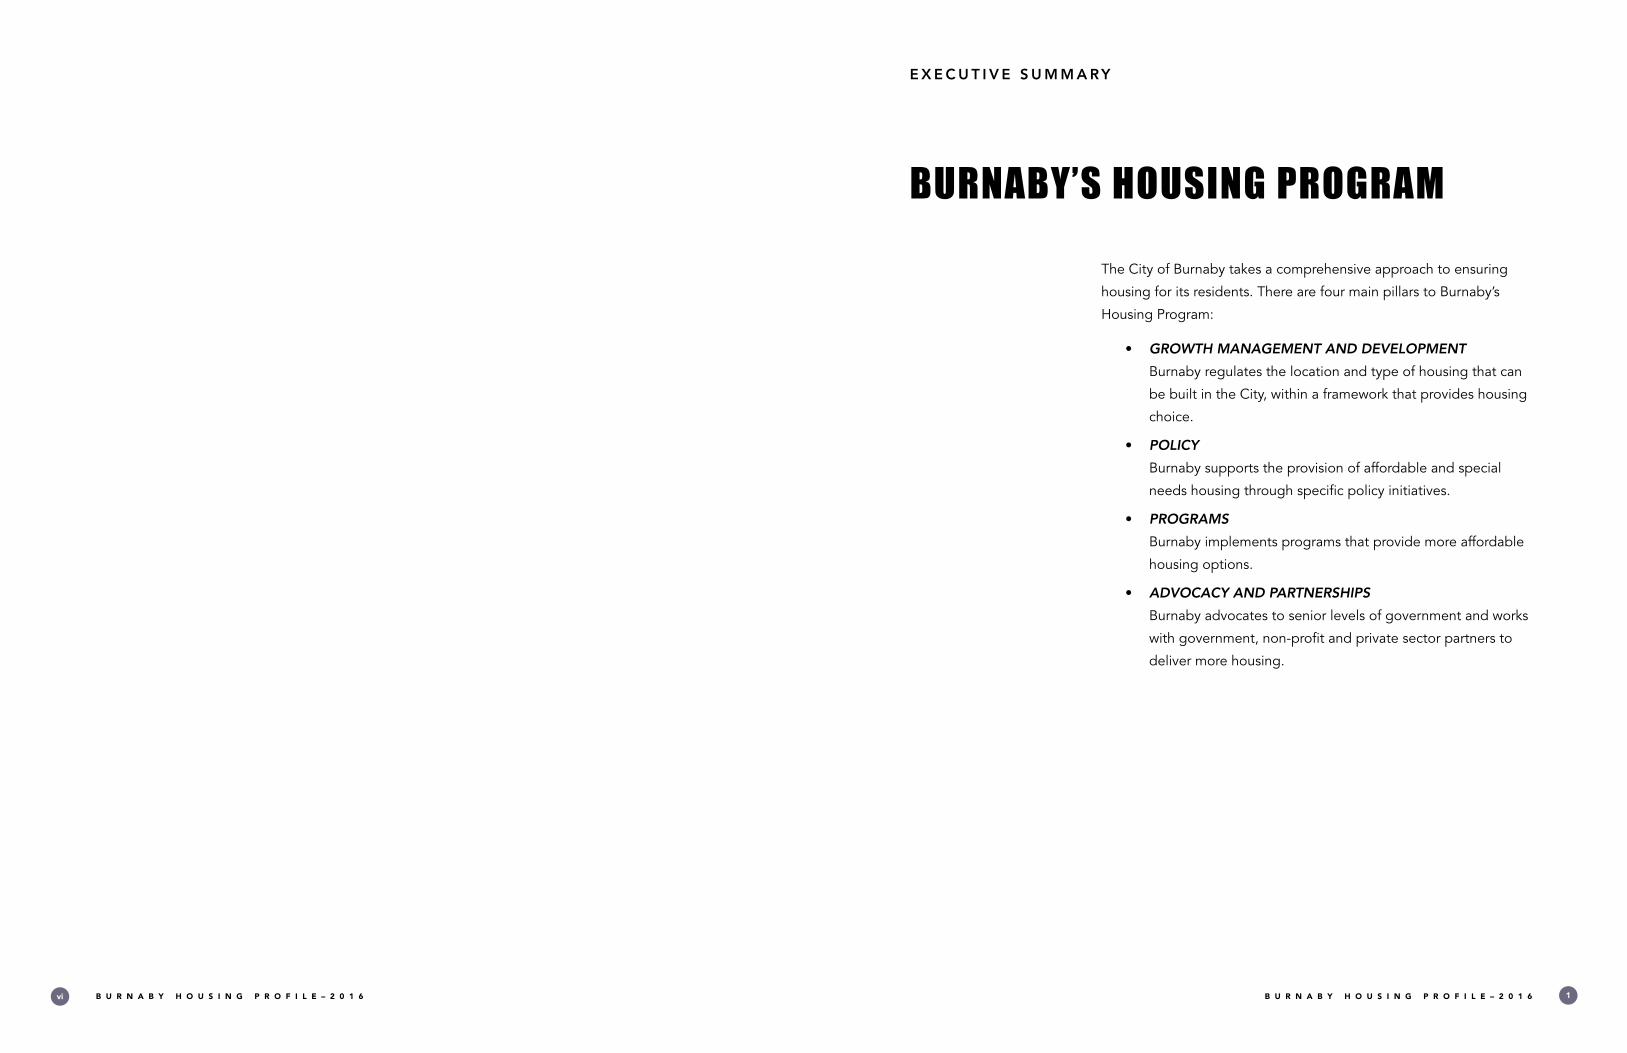
The City of Burnaby takes a comprehensive approach to ensuring
housing for its residents . There are four main pillars to Burnaby’s
Housing Program:
• GROWTH MANAGEMENT AND DEVELOPMENT
Burnaby regulates the location and type of housing that can
be built in the City, within a framework that provides housing
choice .
• POLICY
Burnaby supports the provision of affordable and special
needs housing through specific policy initiatives .
• PROGRAMS
Burnaby implements programs that provide more affordable
housing options .
• ADVOCACY AND PARTNERSHIPS
Burnaby advocates to senior levels of government and works
with government, non-profit and private sector partners to
deliver more housing .
BURNABY’S HOUSING PROGRAM
E X E C U T I V E S U M M A RY

B U R N A B Y H O U S I N G P R O F I L E – 2 0 1 6 B U R N A B Y H O U S I N G P R O F I L E – 2 0 1 62 3
BURNABY’S HOUSING HIGHLIGHTS
E X E C U T I V E S U M M A RY
Burnaby’s Housing Program has been successful in providing homes
and supporting housing affordability for Burnaby residents across the
housing continuum .
T H E H O U S I N G C O N T I N U U M
NON-MARKET HOUSING MARKET HOUSING
EMERGENCY SHELTERS
TRANSITIONAL HOUSING
HOUSINGWITH SUPPORTS
NON-MARKET RENTAL HOUSING
RENTAL HOUSING
HOME OWNERSHIP
Emergency Shelters
Extreme Weather Shelters
Temporary Housing with Supports
Community Care Facilities
• Group Homes
• Long Term Residential Care
Assisted Living
Supportive Housing
Public Housing
Non-Profit Rental Housing
Cooperative Housing
Primary Rental
• Purpose-Built
Secondary Rental
• Secondary Suites
• Rented Strata Units
• Apartments
Strata Housing
Detached Homes
Duplex and Semi-Detached Homes
TEMPORARY PERMANENT
HIGH LEVEL OF GOVERNMENT ASSISTANCE LOW
FOR RENT
A “housing continuum” is an organizing framework for understanding the range of housing needs and options. It displays
the housing types as a progression, based generally on length of stay, affordability, and income levels.
GROWTH MANAGEMENT AND
DEVELOPMENTPOLICY PROGRAMS ADVOCACY AND
PARTNERSHIPS
Burnaby has adopted
guiding policy and an
approvals process that
provides the framework
for permitting housing
and expanding housing
choice
Burnaby has adopted
policy that supports the
provision of affordable
and special needs
housing
Burnaby implements
programs that provide
more affordable housing
options
Burnaby advocates
to other levels of
government and works
with government, non-
profit and private sector
partners to deliver more
housing
Official Community Plan that sets out residential framework for growth
Regional Context Statement that supports accommodating regional growth
Social Sustainability Strategy that supports housing to meet community needs
Timely, efficient and transparent City development and building permit review process
Community Benefit Bonus Policy
Affordable Units Policy for publicly owned lands
Deferral of Development Cost Charges and Permit Fees
Fast-Track Approvals Policy
Comprehensive Development District Zoning
Rental Conversion Control Policy
Tenant Assistance Policy
Adaptable Housing Policy
Flex-Suites Policy
City Lands Program for Non-Market Housing
Housing Fund
Secondary Suites Program
Area Rezoning Process
Working with partners to develop non-market housing at Cedar Place
Support of Metro Vancouver’s Regional Affordable Housing Strategy
Through UBCM /FCM, lobbied for:
• Zoning for rental housing
• Development cost charges to replace affordable housing
• Renewal of rent subsidies and supports for social housing and cooperatives
• Better Provincial tenant assistance regulations
• Development of National and Provincial Housing Strategies
B U R N A B Y ’ S H O U S I N G P R O G R A M :

B U R N A B Y H O U S I N G P R O F I L E – 2 0 1 6 B U R N A B Y H O U S I N G P R O F I L E – 2 0 1 64 5
M A R K E T R E N TA L H O U S I N GN O N - M A R K E T H O U S I N G
3RDLargest Non-Market
Inventory in B.C.1
26Housing Cooperatives
1,900Units
4,000 +Public and Non-Profit
Housing Units
K E Y FA C T S :
5,900 + Units of Non-Market
Housing
A C T I O N S T O S U P P O R T
N O N - M A R K E T H O U S I N G A N D
L O W I N C O M E R E S I D E N T S :
• Partnership agreement with BC
Housing and private developer for
181 non-market housing units at
Cedar Place:
• 90 units of new non-market family
housing on the Southgate site
• 91 units of non-market seniors
housing on existing Cedar Place site
• Approximately $8.5 million density
bonus value
• Over $42 million accumulated to
date in the Housing Fund
• Approximately $2 million in grants
has been allocated or disbursed to
support non-market housing projects
to-date
• 19 affordable and/or special needs
housing units built
• Approximately $3.9 million density
bonus value
• Affordable Units Policy used at the
Oaklands, George Derby, Cariboo
Heights, and former Burnaby South
School sites
• 390 units of non-market housing
• Lease of City-owned lands for 7
non-profit and cooperative housing
projects
• 302 units of non-market rental units
• Request for proposals underway
for the development of non-market
housing on two City-owned sites
• 140 new non-market units are under
construction
32,000 +Market Rental Units in
Burnaby
K E Y FA C T S :
FOR RENT
46% of tenant households spend 30% or more of household income on shelter
Market rents are
8.5%
lower in Burnaby compared to 14 other
Metro Vancouver municipalities
FOR RENT
Between 2009 – 2014, the increase in
average rent was
$100
in Burnaby, which is less than the regional
average of $124
FOR RENT
A C T I O N S T O S U P P O R T
M A R K E T R E N TA L H O U S I N G
A N D R E N TA L H O U S E H O L D S :
• 559 purpose-built rental housing
units in the following stages of
development:
• 300 units at Brentwood Mall site
(under construction)
• 21 units at 3700 Hastings Street site
(undergoing rezoning)
• 238 additional units at Sussex
Avenue/Grange Street site
(undergoing rezoning)
• Secondary Suite Program adopted
in 2014 . Over 7,000 existing suites
estimated . 359 new secondary suites
have been added to the inventory .
515 more are in the building permit
approval process .
• Tenant Assistance Policy introduced
in 2015, providing stronger protection
for Burnaby renters
37% of Burnaby households rent
B U R N A B Y H O U S I N G P R O F I L E – 2 0 1 6 B U R N A B Y H O U S I N G P R O F I L E – 2 0 1 66 7
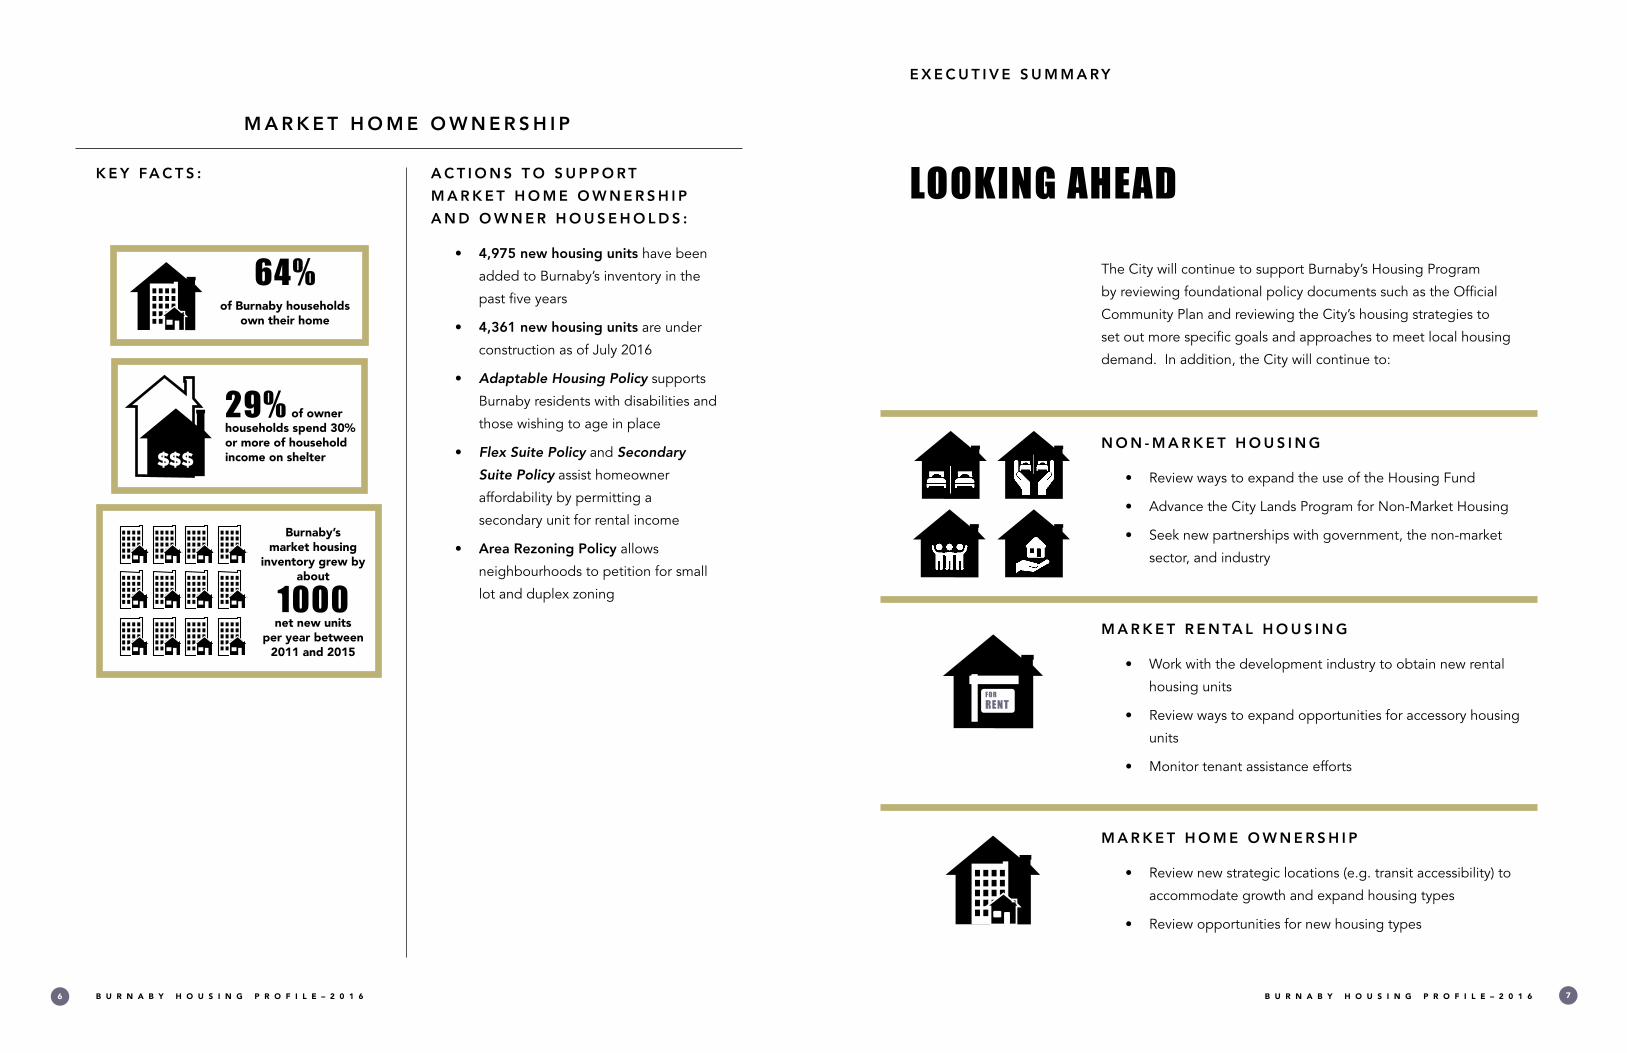
M A R K E T H O M E O W N E R S H I P
K E Y FA C T S : A C T I O N S T O S U P P O R T
M A R K E T H O M E O W N E R S H I P
A N D O W N E R H O U S E H O L D S :
• 4,975 new housing units have been
added to Burnaby’s inventory in the
past five years
• 4,361 new housing units are under
construction as of July 2016
• Adaptable Housing Policy supports
Burnaby residents with disabilities and
those wishing to age in place
• Flex Suite Policy and Secondary
Suite Policy assist homeowner
affordability by permitting a
secondary unit for rental income
• Area Rezoning Policy allows
neighbourhoods to petition for small
lot and duplex zoning
64%of Burnaby households
own their home
29% of owner households spend 30% or more of household income on shelter
Burnaby’s market housing
inventory grew by about
1000 net new units
per year between 2011 and 2015
The City will continue to support Burnaby’s Housing Program
by reviewing foundational policy documents such as the Official
Community Plan and reviewing the City’s housing strategies to
set out more specific goals and approaches to meet local housing
demand . In addition, the City will continue to:
N O N - M A R K E T H O U S I N G
• Review ways to expand the use of the Housing Fund
• Advance the City Lands Program for Non-Market Housing
• Seek new partnerships with government, the non-market
sector, and industry
M A R K E T R E N TA L H O U S I N G
• Work with the development industry to obtain new rental
housing units
• Review ways to expand opportunities for accessory housing
units
• Monitor tenant assistance efforts
M A R K E T H O M E O W N E R S H I P
• Review new strategic locations (e .g . transit accessibility) to
accommodate growth and expand housing types
• Review opportunities for new housing types
LOOKING AHEAD
E X E C U T I V E S U M M A RY
FOR RENT

B U R N A B Y H O U S I N G P R O F I L E – 2 0 1 6 B U R N A B Y H O U S I N G P R O F I L E – 2 0 1 68 9
PLANNING FOR HOUSING
PART
B U R N A B Y H O U S I N G P R O F I L E – 2 0 1 6 B U R N A B Y H O U S I N G P R O F I L E – 2 0 1 610 11
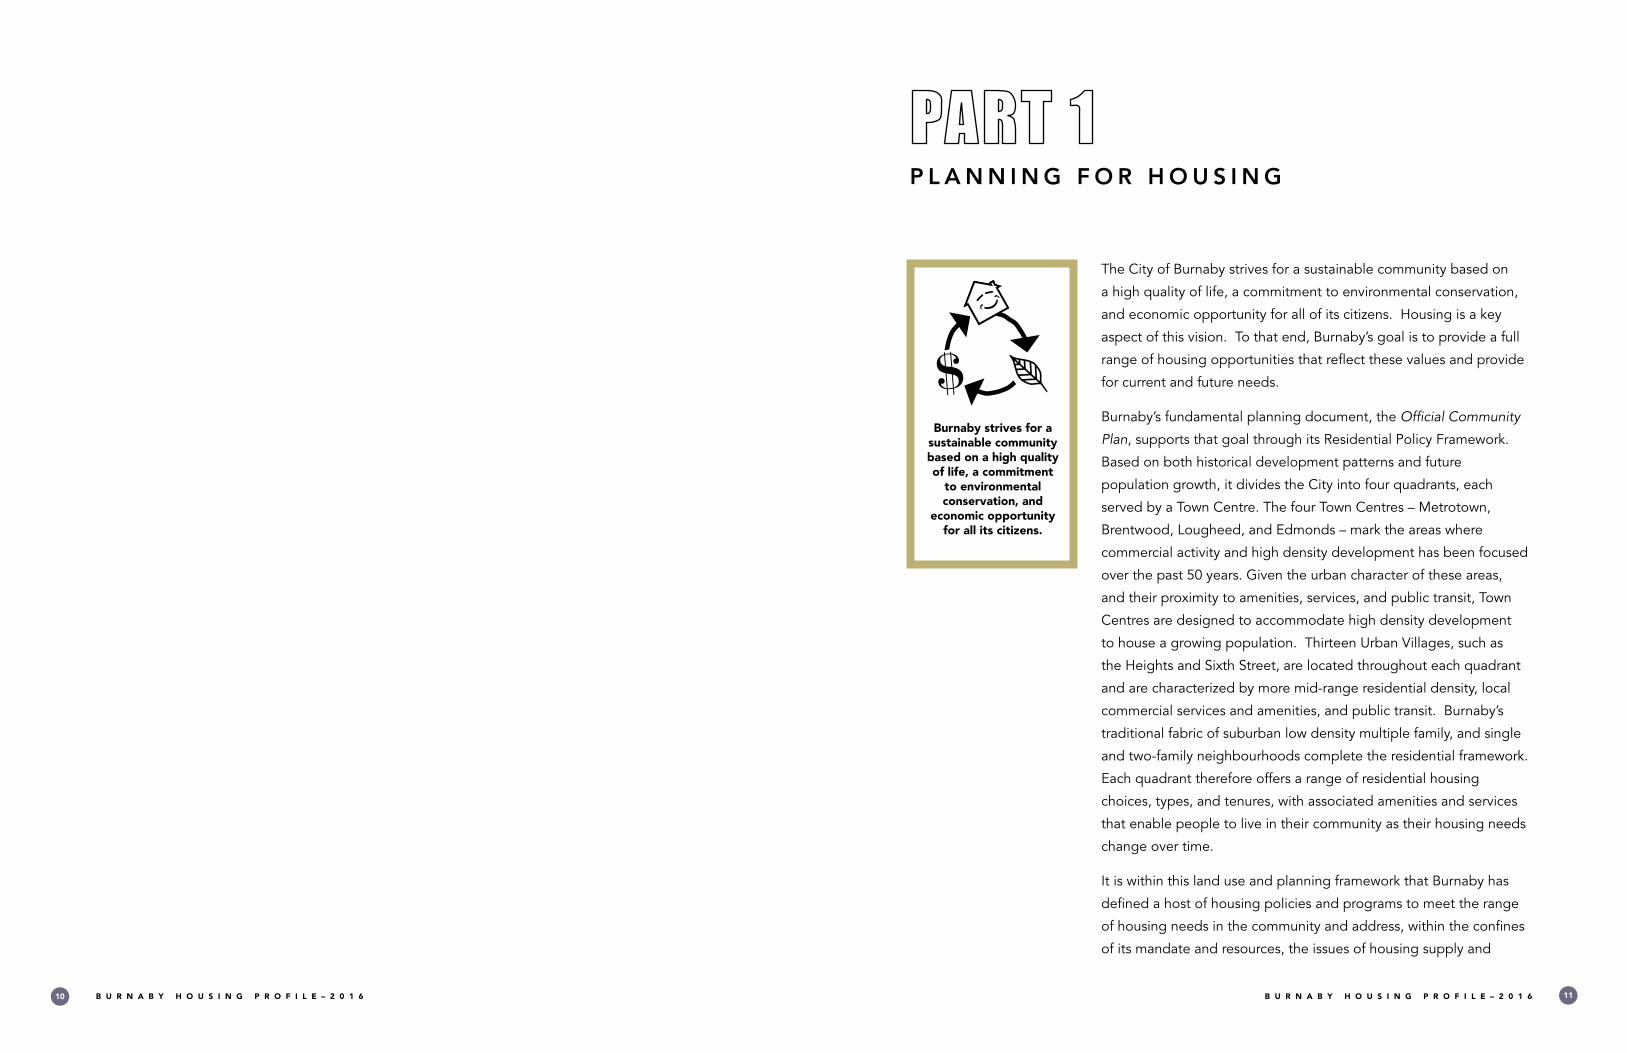
The City of Burnaby strives for a sustainable community based on
a high quality of life, a commitment to environmental conservation,
and economic opportunity for all of its citizens . Housing is a key
aspect of this vision . To that end, Burnaby’s goal is to provide a full
range of housing opportunities that reflect these values and provide
for current and future needs .
Burnaby’s fundamental planning document, the Official Community
Plan, supports that goal through its Residential Policy Framework .
Based on both historical development patterns and future
population growth, it divides the City into four quadrants, each
served by a Town Centre . The four Town Centres – Metrotown,
Brentwood, Lougheed, and Edmonds – mark the areas where
commercial activity and high density development has been focused
over the past 50 years . Given the urban character of these areas,
and their proximity to amenities, services, and public transit, Town
Centres are designed to accommodate high density development
to house a growing population . Thirteen Urban Villages, such as
the Heights and Sixth Street, are located throughout each quadrant
and are characterized by more mid-range residential density, local
commercial services and amenities, and public transit . Burnaby’s
traditional fabric of suburban low density multiple family, and single
and two-family neighbourhoods complete the residential framework .
Each quadrant therefore offers a range of residential housing
choices, types, and tenures, with associated amenities and services
that enable people to live in their community as their housing needs
change over time .
It is within this land use and planning framework that Burnaby has
defined a host of housing policies and programs to meet the range
of housing needs in the community and address, within the confines
of its mandate and resources, the issues of housing supply and
Burnaby strives for a sustainable community based on a high quality of life, a commitment
to environmental conservation, and
economic opportunity for all its citizens.
P L A N N I N G F O R H O U S I N G

B U R N A B Y H O U S I N G P R O F I L E – 2 0 1 6 B U R N A B Y H O U S I N G P R O F I L E – 2 0 1 612 13
affordability . In doing so, Burnaby takes a broad view of housing
policy and the growing need for housing supply at all pricing levels .
This document reflects this vision and provides a comprehensive look
at housing from a Burnaby perspective .
Housing is a complex topic: there are many types, forms, and styles
of housing; many tenancy and ownership models; many levels of
affordability; many housing providers; and many layers of housing
policy at all levels of government . This report explores the range
and complexities of housing in Burnaby .
Based on the most current available data, this report updates the
information presented in Housing Profile 2015, which summarized
City housing policies and programs, and provided an overview of
Burnaby’s housing inventory and population . This report also adds
new features, including a snapshot history on different housing types,
and a primer on housing issues .
This broader look provides readers with a more comprehensive
understanding of housing in Burnaby and the issues and policies that
continue to shape it .
W H AT I S I N T H I S R E P O R T ?
This report provides the following:
PART 1 - Planning For Housing
• An introduction to this report and a visual history of major
housing types in Burnaby .
PART 2 - Housing Primer:
• An overview of core housing topics, issues, and questions .
It outlines the housing continuum, built form, construction,
cost, and the roles of government in the provision of
housing .
A B O U T T H I S R E P O R T
PA R T 1
Town Centres
Urban Villages
Park And Conservation Areas
Suburban Multi-family Areas
Mixed-use Areas
Single and Two Family Areas
Capitol HillConservationArea
The Heights
BrentwoodHoldom
Capitol Hill Lochdale
Montecito
Burnaby MountainConservation Area
Forest Grove
Lake City
BrightonLougheed
CaribooHeights
GeorgeDerby
Burnaby LakeRegional Nature Park
Rayside
BurnabyLake
SportsComplex
CentralAdministrative
Area
GreentreeVillage
DiscoveryPlace
Broadview
MyrtleStreet
CascadeHeights
Metrotown
Oaklands
Royal Oak
Big Bend
Edmonds
SixthStreet Newcombe
Bainbridge
Barnet Marine Park
Simon FraserUniversity
WillingdonHeights
ChevronBufferZone
Map 1: City of Burnaby - Community Plan Areas
Source: City of Burnaby2

B U R N A B Y H O U S I N G P R O F I L E – 2 0 1 6 B U R N A B Y H O U S I N G P R O F I L E – 2 0 1 614 15
PART 3 - Housing Policy:
• A description of Burnaby’s housing policies, including
guiding policies, community plans, and supporting policies .
PART 4 - Housing Profile:
• A description of Burnaby’s demographics as they relate to
housing and Burnaby’s housing inventory .
PART 5 - Housing Actions:
• A look at on-going and future work, a history of Burnaby’s
advocacy efforts, and case studies of Burnaby’s policies in
action .
PART 6 - Conclusion:
• A short summary of Burnaby’s approach to housing, the City’s
housing achievements, and future City actions on housing .
PART 7 - Appendices:
• Appendix 1: Existing Non-Market Housing Developments
• Appendix 2: Burnaby’s Advocacy Efforts
• Appendix 3: Glossary
• Appendix 4: References and Endnotes
This report has been organized so as to present housing information
in the order it appears on the housing continuum . For example,
readers interested in market housing can read about market
housing initially in Part 2 - Section 1.2 and then skip to the related
information on market housing policy in Part 3 - Section 3.4 and
the City’s inventory in Part 4 - Section 2.2. This allows the reader to
easily find the information which they are particularly interested in .
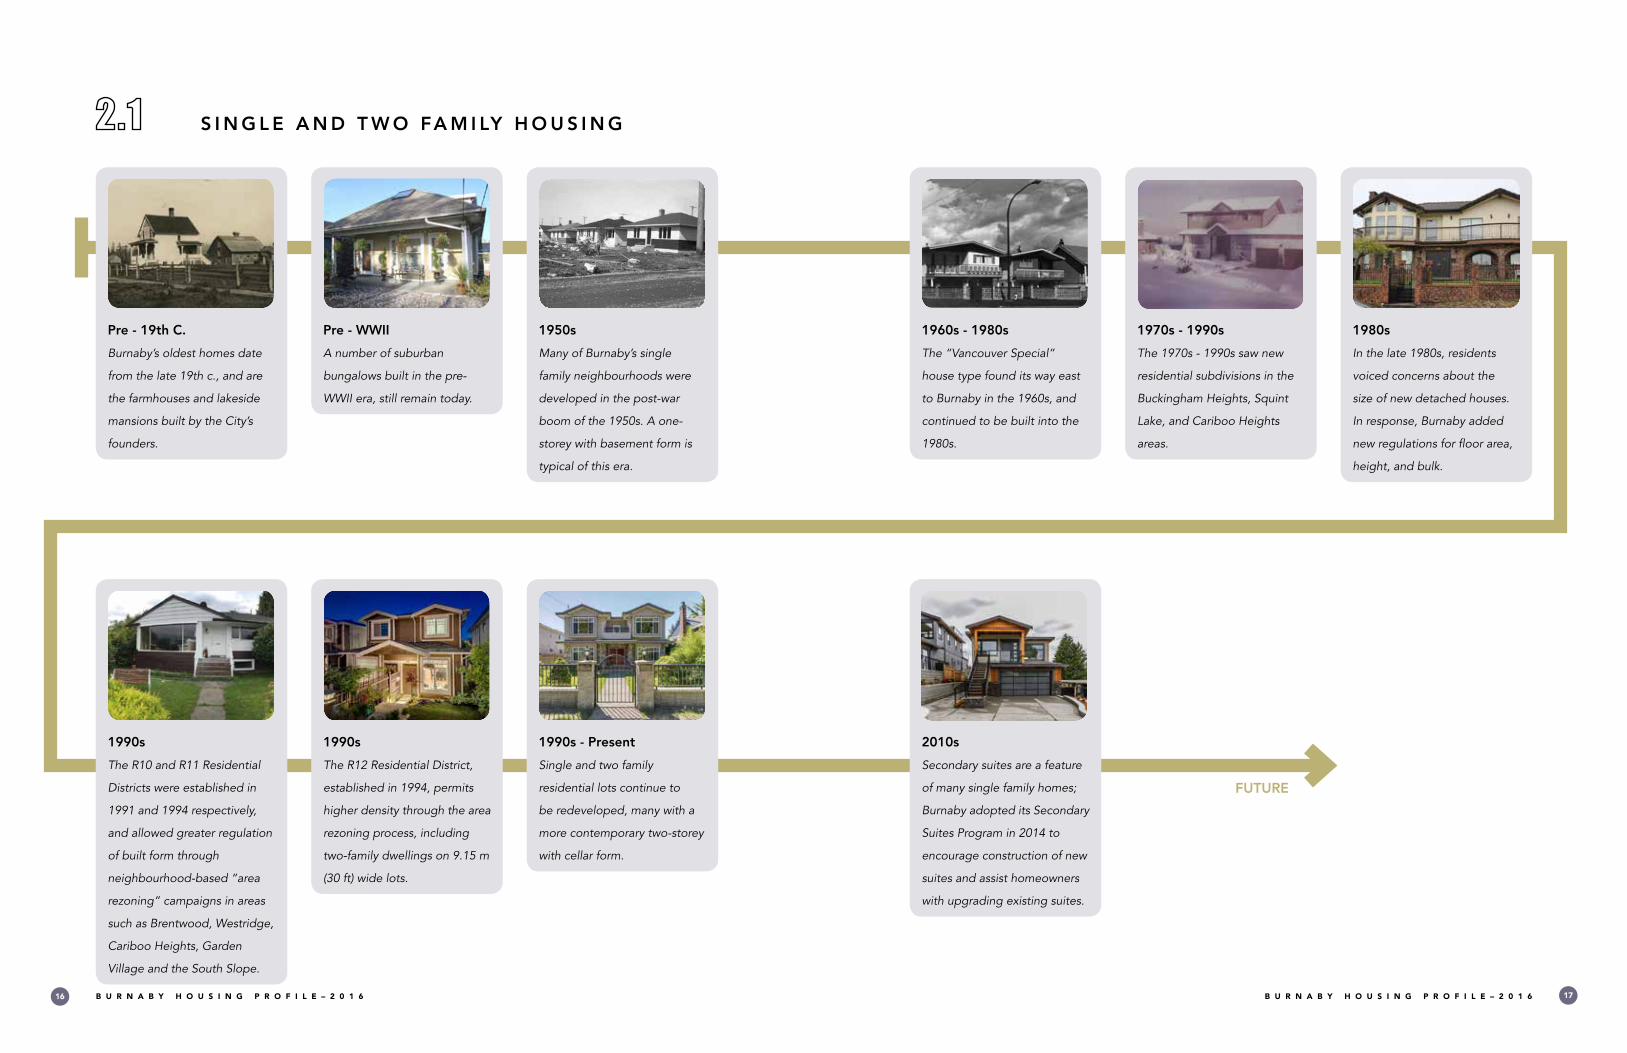
H O U S I N G T Y P E S : A H I S T O R I C A L S N A P S H O T
Burnaby’s housing stock is a product of its history . From 100 year
old farmhouses to brand new flex suites, housing types are built,
maintained, and replaced within the context of social, economic, and
cultural change in the community .
PA R T 1
DID YOU KNOW?
Over 40% of Burnaby’s
residential towers are
more than 25 years old.3
Built before 1960
1961-1980
1981-1990
1991-2000
2001-2011Source: Statistics Canada, 2011.
Map 2: Age of Burnaby’s Housing Stock by Census Tract Area, 2011
Built before 1960
1961-1980
1981-1990
1991-2000
2001-2011Source: Statistics Canada, 2011.
Source: City of Burnaby4
B U R N A B Y H O U S I N G P R O F I L E – 2 0 1 6 B U R N A B Y H O U S I N G P R O F I L E – 2 0 1 616 17
FUTURE
Pre - 19th C.
Burnaby’s oldest homes date
from the late 19th c., and are
the farmhouses and lakeside
mansions built by the City’s
founders.
Pre - WWII
A number of suburban
bungalows built in the pre-
WWII era, still remain today.
1950s
Many of Burnaby’s single
family neighbourhoods were
developed in the post-war
boom of the 1950s. A one-
storey with basement form is
typical of this era.
1960s - 1980s
The “Vancouver Special”
house type found its way east
to Burnaby in the 1960s, and
continued to be built into the
1980s.
1990s - Present
Single and two family
residential lots continue to
be redeveloped, many with a
more contemporary two-storey
with cellar form.
S I N G L E A N D T W O FA M I LY H O U S I N G
1990s
The R10 and R11 Residential
Districts were established in
1991 and 1994 respectively,
and allowed greater regulation
of built form through
neighbourhood-based “area
rezoning” campaigns in areas
such as Brentwood, Westridge,
Cariboo Heights, Garden
Village and the South Slope.
1970s - 1990s
The 1970s - 1990s saw new
residential subdivisions in the
Buckingham Heights, Squint
Lake, and Cariboo Heights
areas.
1990s
The R12 Residential District,
established in 1994, permits
higher density through the area
rezoning process, including
two-family dwellings on 9.15 m
(30 ft) wide lots.
2010s
Secondary suites are a feature
of many single family homes;
Burnaby adopted its Secondary
Suites Program in 2014 to
encourage construction of new
suites and assist homeowners
with upgrading existing suites.
1980s
In the late 1980s, residents
voiced concerns about the
size of new detached houses.
In response, Burnaby added
new regulations for floor area,
height, and bulk.
B U R N A B Y H O U S I N G P R O F I L E – 2 0 1 6 B U R N A B Y H O U S I N G P R O F I L E – 2 0 1 618 19
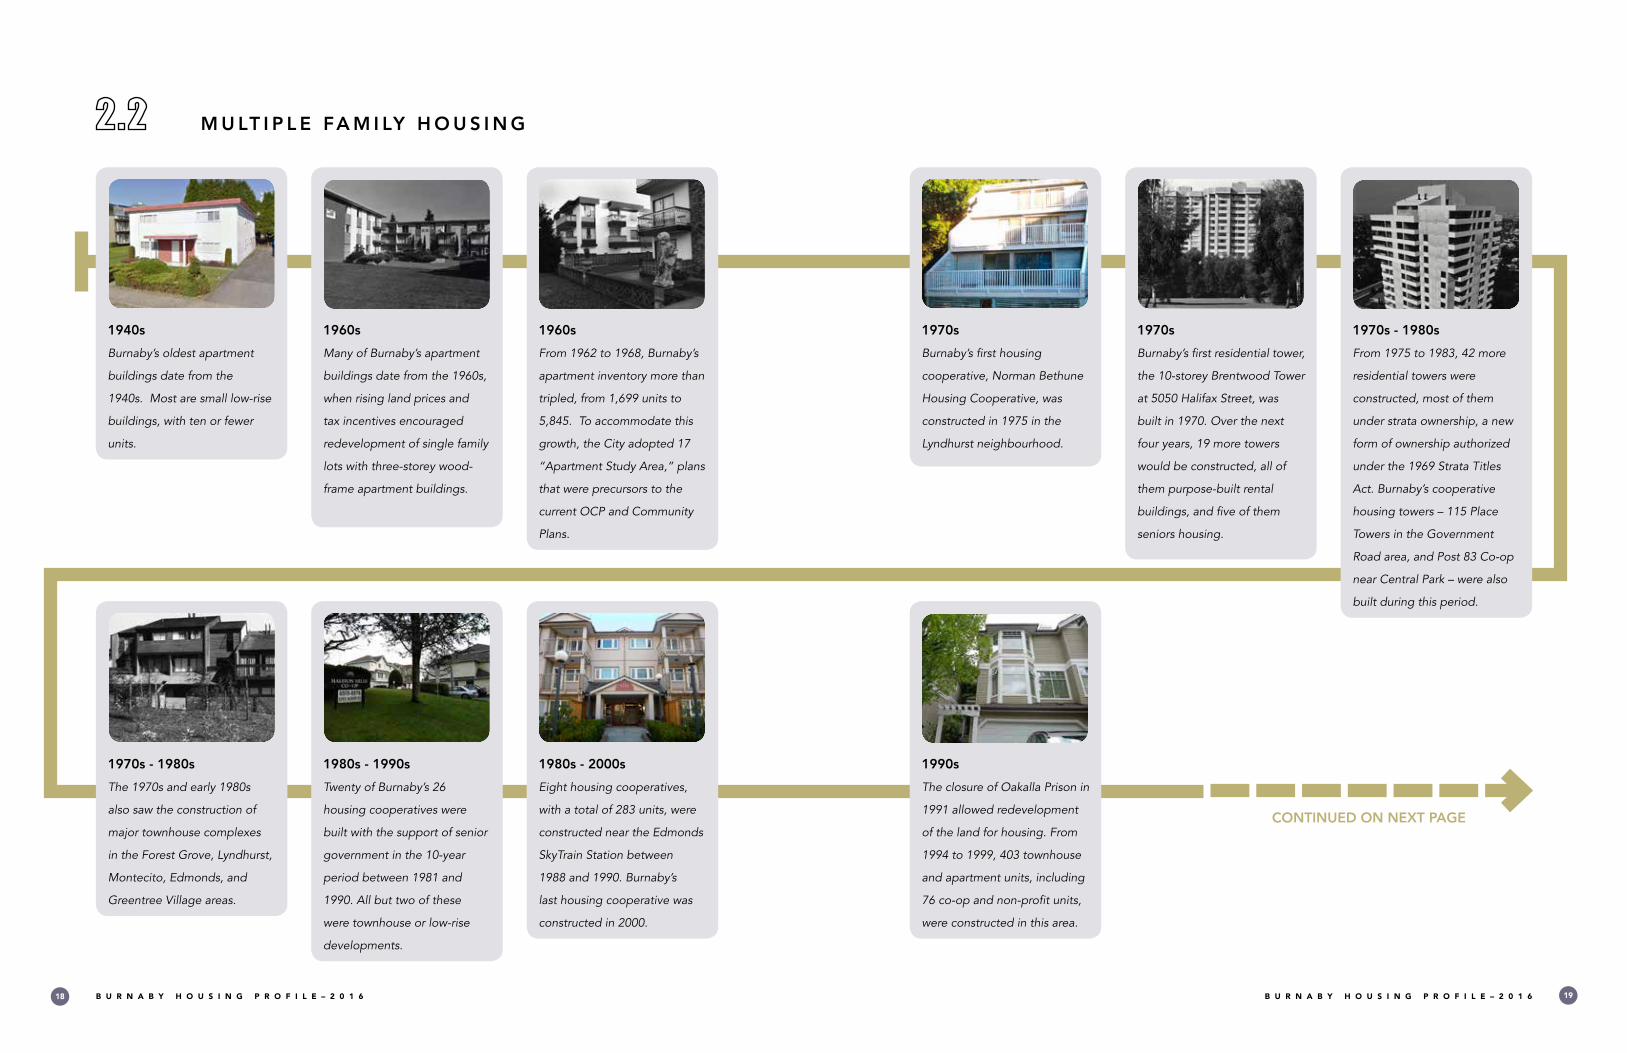
1970s
Burnaby’s first residential tower,
the 10-storey Brentwood Tower
at 5050 Halifax Street, was
built in 1970. Over the next
four years, 19 more towers
would be constructed, all of
them purpose-built rental
buildings, and five of them
seniors housing.
1960s
Many of Burnaby’s apartment
buildings date from the 1960s,
when rising land prices and
tax incentives encouraged
redevelopment of single family
lots with three-storey wood-
frame apartment buildings.
1960s
From 1962 to 1968, Burnaby’s
apartment inventory more than
tripled, from 1,699 units to
5,845. To accommodate this
growth, the City adopted 17
“Apartment Study Area,” plans
that were precursors to the
current OCP and Community
Plans.
1970s - 1980s
The 1970s and early 1980s
also saw the construction of
major townhouse complexes
in the Forest Grove, Lyndhurst,
Montecito, Edmonds, and
Greentree Village areas.
M U LT I P L E FA M I LY H O U S I N G
1940s
Burnaby’s oldest apartment
buildings date from the
1940s. Most are small low-rise
buildings, with ten or fewer
units.
1970s
Burnaby’s first housing
cooperative, Norman Bethune
Housing Cooperative, was
constructed in 1975 in the
Lyndhurst neighbourhood.
1970s - 1980s
From 1975 to 1983, 42 more
residential towers were
constructed, most of them
under strata ownership, a new
form of ownership authorized
under the 1969 Strata Titles
Act. Burnaby’s cooperative
housing towers – 115 Place
Towers in the Government
Road area, and Post 83 Co-op
near Central Park – were also
built during this period.
1990s
The closure of Oakalla Prison in
1991 allowed redevelopment
of the land for housing. From
1994 to 1999, 403 townhouse
and apartment units, including
76 co-op and non-profit units,
were constructed in this area.
1980s - 1990s
Twenty of Burnaby’s 26
housing cooperatives were
built with the support of senior
government in the 10-year
period between 1981 and
1990. All but two of these
were townhouse or low-rise
developments.
1980s - 2000s
Eight housing cooperatives,
with a total of 283 units, were
constructed near the Edmonds
SkyTrain Station between
1988 and 1990. Burnaby’s
last housing cooperative was
constructed in 2000.
CONTINUED ON NEXT PAGE

B U R N A B Y H O U S I N G P R O F I L E – 2 0 1 6 B U R N A B Y H O U S I N G P R O F I L E – 2 0 1 620 21
2000s - Present
Since 2008, most residential
tower developments have
featured townhouse units at
street level to improve City
streetscapes and provide
a human scale relationship
between the building and
public space.
2000s - Present
Three to five storey residential
development above retail
storefronts has been a popular
form of development in Urban
Village areas, such as Hastings
Street and Royal Oak.
2000s - Present
In the 2000s, the award-
winning UniverCity
development at Simon Fraser
University introduced the
flex-suites model and other
innovative and sustainable
design features. Development
of the nearly 4,350 planned
housing units continues, with
over half completed to date.
1990s - 2000s
Redevelopment in the 1990s
and 2000s added over 2,500
apartment and townhouse
units within blocks of the
Edmonds SkyTrain station.
Station Hill was redeveloped
on a “City in the Park” model,
with seven residential towers
flanked by townhouse and low-
rise units, and surrounded by
green space.
1990s
Although the earliest example
dates from 1972, construction
of residential towers in
mixed-use environments,
with commercial podiums
containing retail and restaurant
uses, has become more
popular since the late 1990s.
Some residential towers have
business offices on lower floors
or in adjacent buildings.
CONTINUED FROM
PREVIOUS PAGE
FUTURE

B U R N A B Y H O U S I N G P R O F I L E – 2 0 1 6 B U R N A B Y H O U S I N G P R O F I L E – 2 0 1 622 23
HOUSING PRIMER
PART

B U R N A B Y H O U S I N G P R O F I L E – 2 0 1 6 B U R N A B Y H O U S I N G P R O F I L E – 2 0 1 624 25
H O U S I N G P R I M E R
Housing is a term that describes many things: a class of buildings, a
basic need, a market commodity, and a government responsibility .
More importantly, it describes the places that people live – where
they eat, sleep, raise families, greet friends, and enjoy privacy
and comfort . Although this report focuses on the more objective
understandings of housing, housing is about people’s homes .
The provision of housing is both an economic activity and a social
need . The majority of housing in Burnaby, and indeed across
Canada, relies on market mechanisms such as rental, sales, and
leasing . However, the cost of market housing can be too expensive
for lower income households and populations with special housing
needs . Government programs, including the provision of public
housing, subsidies for non-profit housing, partnerships, and
regulations are used to meet the array of housing needs in the
community .
This section provides an overview of core housing topics, issues, and
questions . It outlines the types of housing, organized by the housing
continuum; the plans, legislation, and market forces that influence
housing form, construction, and cost; and the roles of government in
the regulation and provision of housing .

B U R N A B Y H O U S I N G P R O F I L E – 2 0 1 6 B U R N A B Y H O U S I N G P R O F I L E – 2 0 1 626 27
H O U S I N G C O N T I N U U M
PA R T 2
A “housing continuum” is an organizing framework for
understanding the range of housing needs and options . It displays
the housing types as a progression, based generally on length of stay
and affordability . The continuum extends from emergency shelters
and other transitional housing to housing with supports, non-market
rental housing, market rental housing, and lastly to home ownership .
The continuum generally corresponds to income levels .
The housing continuum also illustrates the distinction between
non-market and market housing . Non-market housing is made more
affordable through government or non-profit or charitable funding .
It includes most temporary housing, housing with supports, and non-
market rental housing . Market rental housing and home ownership
rely primarily on market forces including local housing supply,
demand, age, size, condition and other market factors to determine
price .
Burnaby’s Housing Continuum is illustrated in Figure 1 .
There are a range of government programs that apply to points
on the continuum, from construction and operation of shelters
and public housing, to funding for non-market rental housing, to
mortgage subsidies for home ownership .
As detailed in Part 4 - Section 2.0 and Part 7 - Appendix
1.0, Burnaby contains most housing types in the continuum . A
description of the specific housing types on the continuum is
provided in the following sub-sections . Please note that these
housing types are broadly defined, and in some cases, one or more
categories may overlap .
B U R N A B Y H O U S I N G P R O F I L E – 2 0 1 6 B U R N A B Y H O U S I N G P R O F I L E – 2 0 1 628 29
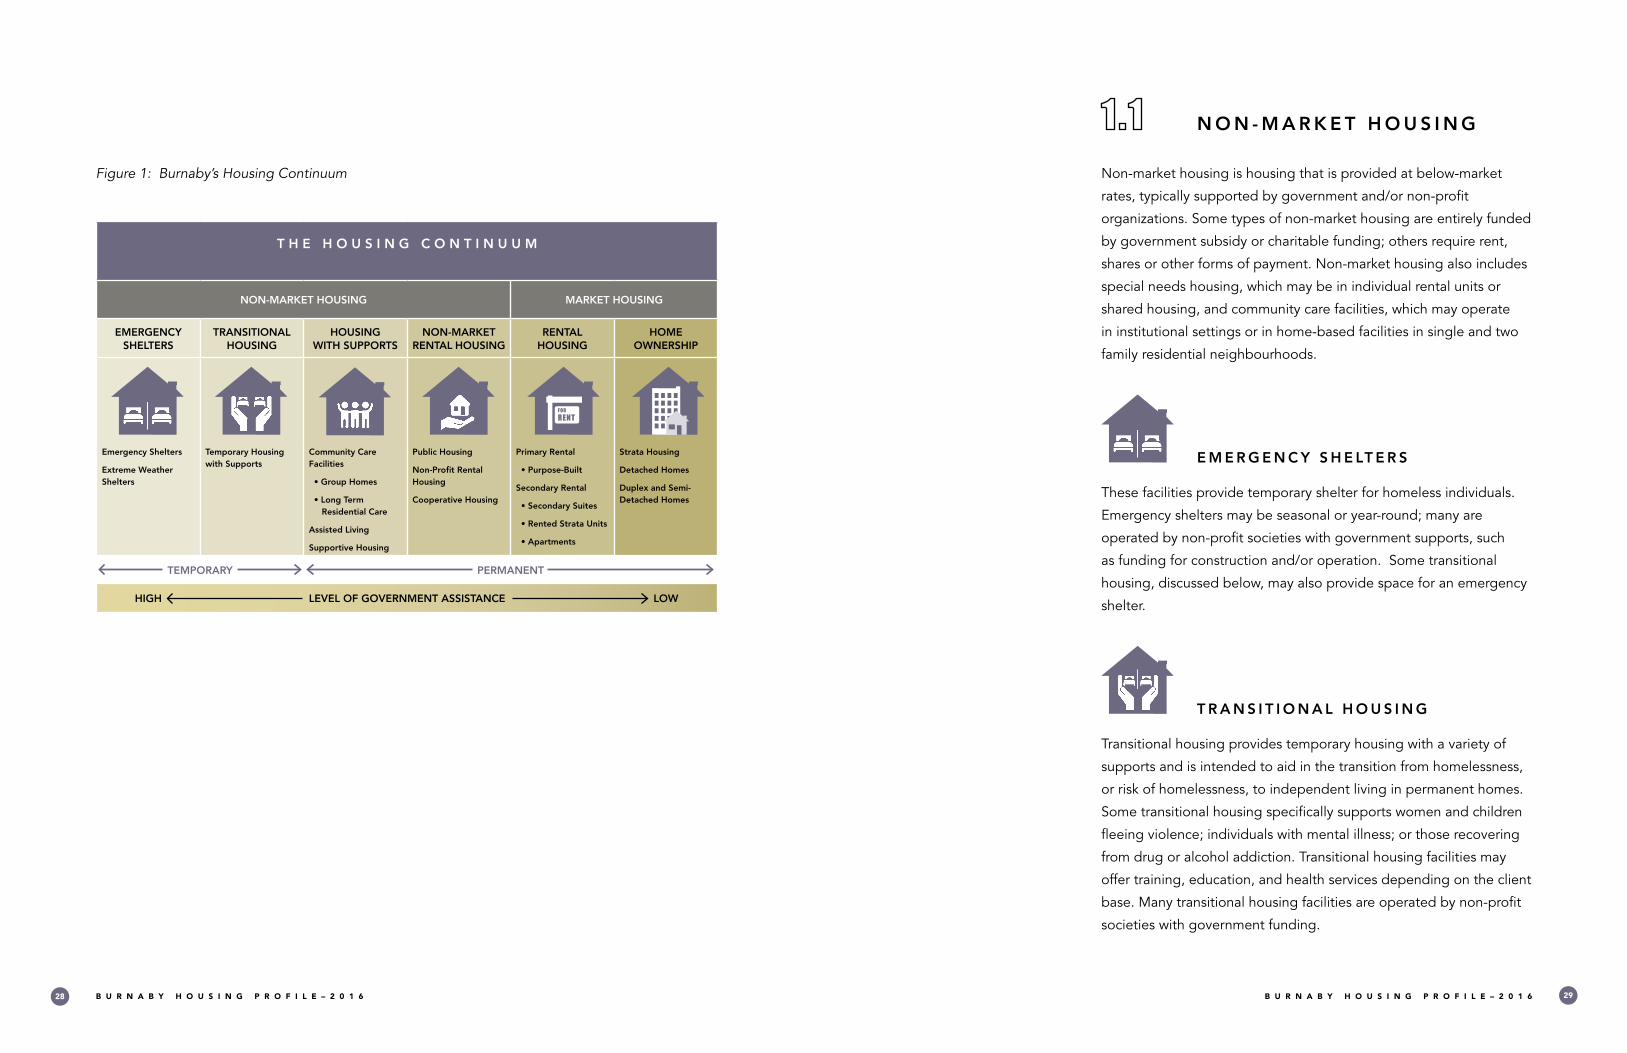
Non-market housing is housing that is provided at below-market
rates, typically supported by government and/or non-profit
organizations . Some types of non-market housing are entirely funded
by government subsidy or charitable funding; others require rent,
shares or other forms of payment . Non-market housing also includes
special needs housing, which may be in individual rental units or
shared housing, and community care facilities, which may operate
in institutional settings or in home-based facilities in single and two
family residential neighbourhoods .
E M E R G E N C Y S H E LT E R S
These facilities provide temporary shelter for homeless individuals .
Emergency shelters may be seasonal or year-round; many are
operated by non-profit societies with government supports, such
as funding for construction and/or operation . Some transitional
housing, discussed below, may also provide space for an emergency
shelter .
T R A N S I T I O N A L H O U S I N G
Transitional housing provides temporary housing with a variety of
supports and is intended to aid in the transition from homelessness,
or risk of homelessness, to independent living in permanent homes .
Some transitional housing specifically supports women and children
fleeing violence; individuals with mental illness; or those recovering
from drug or alcohol addiction . Transitional housing facilities may
offer training, education, and health services depending on the client
base . Many transitional housing facilities are operated by non-profit
societies with government funding .
N O N - M A R K E T H O U S I N G
Figure 1: Burnaby’s Housing Continuum
T H E H O U S I N G C O N T I N U U M
NON-MARKET HOUSING MARKET HOUSING
EMERGENCY SHELTERS
TRANSITIONAL HOUSING
HOUSINGWITH SUPPORTS
NON-MARKET RENTAL HOUSING
RENTAL HOUSING
HOME OWNERSHIP
Emergency Shelters
Extreme Weather Shelters
Temporary Housing with Supports
Community Care Facilities
• Group Homes
• Long Term Residential Care
Assisted Living
Supportive Housing
Public Housing
Non-Profit Rental Housing
Cooperative Housing
Primary Rental
• Purpose-Built
Secondary Rental
• Secondary Suites
• Rented Strata Units
• Apartments
Strata Housing
Detached Homes
Duplex and Semi-Detached Homes
TEMPORARY PERMANENT
HIGH LEVEL OF GOVERNMENT ASSISTANCE LOW
FOR RENT

B U R N A B Y H O U S I N G P R O F I L E – 2 0 1 6 B U R N A B Y H O U S I N G P R O F I L E – 2 0 1 630 31
H O U S I N G W I T H S U P P O R T S
Some forms of non-market housing include support services for
people with specific needs . This category of housing can range from
long-term care facilities that provide palliative care to supportive
housing residences where assistance is limited to light housekeeping,
meals, and social programs for seniors living independently . The
main types of housing in this broad classification are listed here:
• Community Care Facilities are Provincially licensed
residences that provide ongoing care to three or more
residents . Residents depend on caregivers for assistance due
to age, family circumstances, disabilities, illness or frailty .
Residents require at least three care services to help with
daily living, such as meals, mobility, supervision, medication,
grooming, or behavioural challenges . Community care
facilities include:
• Group Homes, which offer community living in
a home-based setting . In Burnaby, group homes
operate in single family homes in residential
neighbourhoods .
• Long-term Residential Care Facilities, which
provide care in an institutional setting, generally for
persons with chronic or progressive health issues,
primarily due to aging . Long-term care facilities are
located throughout Burnaby, on institutionally-zoned
properties .
• Assisted Living Residences offer seniors and/or persons
with disabilities housing, hospitality services and one or
two care services, such as help with mobility or medication .
Assisted living residences are registered with the Province,
but not licensed, as the number of care services offered to
residents is less than in a community care facility . Assisted
living residences often serve as a bridge between supportive
housing and long-term residential care .
WHAT IS SUBSIDIZED
HOUSING?
The BC Government and
Federal programs offer
subsidized housing for
low-income households
in non-market housing
developments. Rents
are geared toward
income levels, and are
kept to 30% of gross
household income,
above a set minimum
rent. Annual household
income cannot exceed
set maximums, called
“Household Income
Limits (HILs)”; for
instance, the HIL for
a subsidized two-
bedroom unit in
Burnaby is $52,000
annually.6
• Supportive Housing provides seniors and/or persons
with disabilities or other barriers with accommodation and
other supports, such as light housekeeping, meals, and
activity programs . Supportive housing does not require
Provincial licensing, as the services it provides are not
“care services .” Supportive housing may be operated by
government agencies directly, by non-profit organizations
with government assistance, or by for-profit organizations .
N O N - M A R K E T R E N TA L H O U S I N G
Non-market rental housing consists of a variety of housing
opportunities, generally in multiple family residential developments
such as townhouse complexes, low-rise apartments, or residential
towers . These developments are considered “purpose-built” rental
housing, as they are constructed with the intent of renting, not
selling, the units .
• Social Housing is a catch-all term that refers to any type of
housing that receives subsidy assistance from government
agencies . Social housing includes public housing as well as
non-profit and cooperative housing .
• Public Housing is purpose-built rental housing that is owned
and operated by a government agency . Examples of public
housing in Burnaby are Stratford Gardens in Capitol Hill area
and Cedar Place in the Southgate area, both of which are
operated by BC Housing .
• Non-profit Rental Housing is purpose-built rental housing
that is operated by non-profit organizations, usually with
government funding . These developments may serve a wide
range of populations, such as families, singles or couples,
seniors, and/or persons with disabilities . Some non-profit
housing developments were constructed under Federal
WHAT IS A CARE
SERVICE?
“Care” is a Provincial
licensing term that
refers to services
provided to persons
with specified needs.5
Under Provincial
legislation, a
“prescribed care
service” can include:
• Assistance with
activities of daily
living (e.g., eating,
mobility, personal
hygiene);
• Assistance with
medication;
• Management of
cash and property;
• Monitoring of food
intake;
• Behaviour
management; or,
• Physical and/
or psychosocial
rehabilitation.

B U R N A B Y H O U S I N G P R O F I L E – 2 0 1 6 B U R N A B Y H O U S I N G P R O F I L E – 2 0 1 632 33
and Provincial government operating agreements linked
to the length of the mortgage . Other non-profit housing
developments function without government subsidies,
and may include a mix of market and below market units .
Affordable rental housing may also be offered through a
community land trust .
• Cooperative Housing developments (“Co-ops”) are a type
of non-profit housing that is membership-based and that
provides housing to its members . Most housing co-ops were
constructed under Federal programs, and are subject to
Federally supported operating agreements that supplement
the income derived from rent and member shares to enable
the cooperative to provide subsidies to its lower income
members .
WHEN IS HOUSING
CONSIDERED
AFFORDABLE?
Housing is considered
affordable when
monthly housing costs
(including property
taxes, strata fees, and
heating costs) consume
less than 30% of gross
household income.7
Although this definition
of “affordable” is
widely used, it is noted
that many households
must, or choose, to
pay more than 30% of
their income on housing
costs.
M A R K E T H O U S I N G
Market housing includes both rental housing and home ownership,
and is priced according to market rates, based on factors such as
demand, age, size, condition, location, and what purchasers are
willing to pay . Market rates can apply to all housing types, from
detached homes in single family neighbourhoods to studio units in
high rise towers . Accessory dwellings, such as secondary suites and
flex suites, are also offered at market rates . Although market housing
can benefit from government tax incentives and mortgage supports,
and is subject to government regulation, residents and owners do
not generally receive direct government subsidy .
FOR RENT
M A R K E T R E N TA L H O U S I N G
Market rental housing encompasses a range of housing types and
affordability levels, and can be the primary purpose of a rental
building, or a secondary use of an individually owned home .
Market rents are subject to the Residential Tenancy Act, which
limits annual rent increases for existing tenancies, but otherwise
rents are set by the market based on supply, demand, age, size,
and condition of rental units, and other factors . Provision of market
rental housing is similarly subject to market considerations; in recent
years, few projects have opted to construct or retain purpose-built
rental housing given the favorable conditions for condominium
development, the lack of Federal tax incentives for rental housing,
and the challenging market conditions that affect the economic
viability of such projects .
• Primary or Purpose-built Market Rental Housing is
provided in buildings where the units are rented but not
individually owned . Most primary rental housing is purpose-
built, having been constructed with the intent of renting, not
selling, the units . Any non-strata titled building consisting of
three or more units is considered primary rental housing .

B U R N A B Y H O U S I N G P R O F I L E – 2 0 1 6 B U R N A B Y H O U S I N G P R O F I L E – 2 0 1 634 35
with informal cooperation when repair of common elements,
such as roofs, is necessary .
• Detached Home ownership applies to single family homes,
which are generally held in freehold (with no fixed term) and
fee simple (inheritable) ownership . Single family homes can
also include a secondary suite for rental purposes .
THE CHALLENGE OF MARKET RENTAL
In the 1960s-1970s, Federal tax incentives promoted the construction of market rental housing, particularly
purpose-built rental apartments.
Since the mid 1980s, when these incentives were removed, construction of purpose-built rental housing
has slowed, redevelopment has focused on the more profitable condominium market, and land values have
continued to rise.8
With the price of home ownership beyond reach for many, demand for rental housing has increased while the
existing stock has aged.
Now, much of the City’s purpose-built market rental housing stock is 50 years old. Due to their age and
condition, many of these older buildings offer more affordable rents. As these rental buildings reach the end
of their lifespans, there is a need for new purpose-built rental apartments and other affordable options.
Recently constructed purpose-built rental units and secondary suites in various locations across the City help to
fill the housing gap created through redevelopment of older buildings.
In addition, non-market rental housing, created through Federal, Provincial, and City incentive programs
provide additional housing.
However, new Federal tax incentives and funding for affordable non-market housing is needed to meet the
growing housing needs for new rental housing.
• Secondary Rental Housing is housing that is individually
owned but rented to others . This category includes detached
houses (single family or duplex), strata titled townhouse or
apartment units, and accessory rental units such as secondary
suites and flex-suites . The renting of individual rooms in a
home, to students or other “boarders and lodgers,” is also a
form of secondary rental .
H O M E O W N E R S H I P
Home ownership encompasses a range of options including strata,
leasehold, or freehold/fee simple interest in a residential property .
Although it occupies the costlier end of the housing continuum, the
affordability of home ownership can vary greatly depending on the
size and nature of the residence, the status of financing, location and
market demand, and the presence of secondary rental units .
• Strata Housing includes apartments, townhouses, and other
multiple family residential developments that are held by
a strata corporation . A strata corporation is comprised of
the owners of individual housing units (“strata lots”) who
also each own a share in the common property . Common
property includes all parts of the property that lie outside of
the individual housing units, such as roofs, hallways, outdoor
areas, lobbies, recreational facilities, other amenities, and
parking garages . Strata units may be rented depending on
the rules adopted by the strata corporation .
• Duplex Homes contain two dwelling units stacked on top
of each other, and Semi-detached Homes contain two units
located side-by-side . Most duplex and semi-detached homes
are held under “non-conforming strata” ownership, in which
each unit is maintained separately by the individual owners,

B U R N A B Y H O U S I N G P R O F I L E – 2 0 1 6 B U R N A B Y H O U S I N G P R O F I L E – 2 0 1 636 37
H O U S I N G B U I LT F O R M
PA R T 2
Housing comes in many shapes and sizes . The term “built form” is
used to describe what a building looks like, how tall it is, how much
of the property it occupies, how far it is set back from the street, and
its architectural character or style .
B U I LT F O R M S A N D D W E L L I N G T Y P E S
Housing built forms generally reflect the number of dwelling units in
a building . For instance, a detached house usually contains a single
dwelling unit, while an apartment building contains many units . In
order to regulate the density of development, most zoning bylaws
characterize housing types by the number of dwelling units they
contain, with the resulting “dwelling types” permitted in specific
zone districts . Many also specify zone districts for particular built
forms, such as townhouses or row houses .
The Burnaby Zoning Bylaw includes the following dwelling types and
built forms:
• Single Family Dwelling: A free-standing residential
structure that contains one principal dwelling unit . A single
family dwelling can also be referred to as a single-detached
dwelling, single-family residence, or a detached house or
home . A single family dwelling may contain a secondary suite
as an accessory dwelling unit . A single family dwelling may
also be operated as a group home .
• Two Family Dwelling: A residential structure that contains
two principal dwelling units, side-by-side, front to back, or
one above the other, sharing a single property with separate
entrances for each unit . Two family dwellings are referred to
as duplexes, when the units are stacked, or semi-detached
BUILDING FORM &
TENURE
“Tenure” is a term that
describes the financial
basis for occupying a
home.
Owner-occupancy and
tenancy are the basic
forms of tenure, with
variations such as strata
ownership, cooperative
housing, public housing,
and other forms of
ownership or tenancy.
Housing is often
built with a particular
tenure in mind:
owner-occupancy for
detached homes and
condominium units, and
tenancy for purpose-
built rental buildings.
However, individually
owned homes can be
rented, and in some
cases purpose-built
rental buildings can
be converted to strata
ownership.
Although it may lend
itself to either owner-
occupancy or tenancy,
building form does not
determine tenure.
B U R N A B Y H O U S I N G P R O F I L E – 2 0 1 6 B U R N A B Y H O U S I N G P R O F I L E – 2 0 1 638 39
homes, when the units are side-by-side . The built form of a
two family dwelling is usually similar to that of a single family
dwelling; however, many two-family dwellings demonstrate
a greater symmetry, and the separation between the two
halves of a semi-detached home may be more pronounced .
• Multiple Family Dwelling: A residential structure that
contains three or more dwelling units . Multiple family
dwellings include:
• Tri-plexes – A residential structure that contains three
dwelling units, side-by-side or one above the other,
with separate entrances for each unit .
• Quadra-plexes or Four-plexes – A residential structure
that contains four dwelling units, side-by-side or one
above the other or both, with separate entrances for
each unit .
• Townhouses – A row of any number of attached
residential structures, with common walls between
each house . Townhouses may have multiple floors,
are commonly located side by side, and have their
own separate entrances . A stacked townhouse is one
townhouse sitting on top of another . A row house is
similar to a townhouse, but is located on a separate
lot that is owned independently .
• Apartment Building – A residential structure with
multiple dwelling units . There can be multiple
dwelling units on each floor and multiple floors . They
typically include separate entrances to each unit via
internal hallways . Apartment buildings comprise a
wide range of built forms, from low-rise complexes to
residential towers .
• Supportive Housing Facilities and Other Institutional
Housing: These facilities provide sleeping or living units
along with dining facilities, meal service, amenities, and
WHAT IS LAND USE?
“Land use” is the
purpose for which land is
used, or intended to be
used. “Use” in this sense
can mean any activity or
development.9
Some common land
use categories include
recreation, conservation,
residential use, industrial
use, commercial use,
and institutional use.
Developments are
considered “mixed-
use” when one or more
land use categories are
combined on one site or
in a building.
Burnaby’s land use
policy is outlined in
the Official Community
Plan and associated
Community Plans (area-
specific plans). These
plans describe Burnaby’s
land use categories
and policies. They also
include generalized maps
that indicate suitable
locations for different
land uses.
The ability to designate
land use is a Provincial
power that is delegated
to local governments
under the Local
Government Act.
varying levels of care and assistance to residents . Many
housing facilities have an apartment-style built form,
although some may require more institutional designs . As
noted above, smaller scale housing, such as group homes,
may operate in a single family dwelling .
Built form can also be described by building heights:
• Low-Rise: A structure between 1 and 4 storeys in height .
• Mid-Rise: A structure between 4 and 12 storeys in height .
• High-Rise: A structure of 12 storeys or more in height .
WHAT IS ZONING?
“Zoning” is the division of land into different districts, or “zones,” that are subject to specific land use and
development regulations.10
Zoning regulations are compiled in a Zoning Bylaw, which includes detailed development regulations and a
zoning map that outlines the location of each zone district.
Detached homes are typically permitted in different zone districts than apartments and townhouses. Most
zoning bylaws permit detached homes in “Residential” or “R” zones (for example, R1 Residential District) and
apartments and townhouses in “Multiple Family Residential” or “RM” zones (for example, RM5 Residential
District). Generally, density increases with numbering, with R1 Districts requiring the largest residential lot
sizes and RM1 Districts permitting the smallest number of units per hectare.
Each zone district permits specific land uses and establishes development standards, such as maximum
building height and floor area, minimum building setbacks from property lines, and the amount of off-street
parking required. Every property in Burnaby is located in a zone district.
Zoning bylaws are enacted by local governments, whose zoning powers are governed by Provincial legislation.
B U R N A B Y H O U S I N G P R O F I L E – 2 0 1 6 B U R N A B Y H O U S I N G P R O F I L E – 2 0 1 640 41
H O W D O E S T H E C I T Y R E G U L AT E A N D
I N F L U E N C E B U I LT F O R M ?
The City regulates residential uses and their built form through the
Official Community Plan, the Burnaby Zoning Bylaw, and the BC
Building Code:
• Official Community Plan: The City’s Official Community
Plan (OCP) provides a high level framework that establishes
where residential development can occur and, more broadly,
what forms it can take . The OCP also establishes Community
Plan areas, with more detailed plans that shape development
within those areas .
• Burnaby Zoning Bylaw: The City’s Zoning Bylaw provides
specific regulations for use and built form . It defines
permitted uses, lot areas and coverage, height, setbacks,
open space requirements, density, and parking requirements .
• BC Building Code: The BC Building Code is the Provincial
regulation that governs how new construction, building
alterations, repairs and demolitions are completed . This
code establishes minimum requirements for safety, health,
accessibility, fire and structural protection of buildings, as
well as energy and water efficiency . The City administers the
application of the BC Building Code .
The City also influences the built form and design of individual
units through policies such as the Adaptable Housing Policy which
encourages the provision of dwelling units that provide additional
space and features that enable the units to be easily adapted to
meet the needs of someone with permanent or temporary mobility
issues . In addition, throughout the development process, the City
encourages applicants to provide a mix of unit sizes, tenures, and
floorplans to suit a variety of residential needs .
W H Y D O E S T H E C I T Y A L L O W F O R M O R E H I G H
R I S E B U I L D I N G S A N D D E N S I T Y ?
Growth and development in Burnaby is directed by the City’s Official
Community Plan (OCP) . The OCP locates the majority of new
commercial and residential growth in the City’s four Town Centres
(Metrotown, Brentwood, Edmonds, and Lougheed) near transit and
community services . This enables:
• the achievement of Metro Vancouver regional plan objectives
to support and improve livability in the region;
• the protection of parks, conservation areas, industrial lands,
and agricultural lands from the pressure of residential
development;
• the creation of compact and complete communities offering
diversity, choice, and convenience;
• the preservation of lower-scale single and two-family
neighbourhoods; and,
• the availability of a greater variety of transportation options .
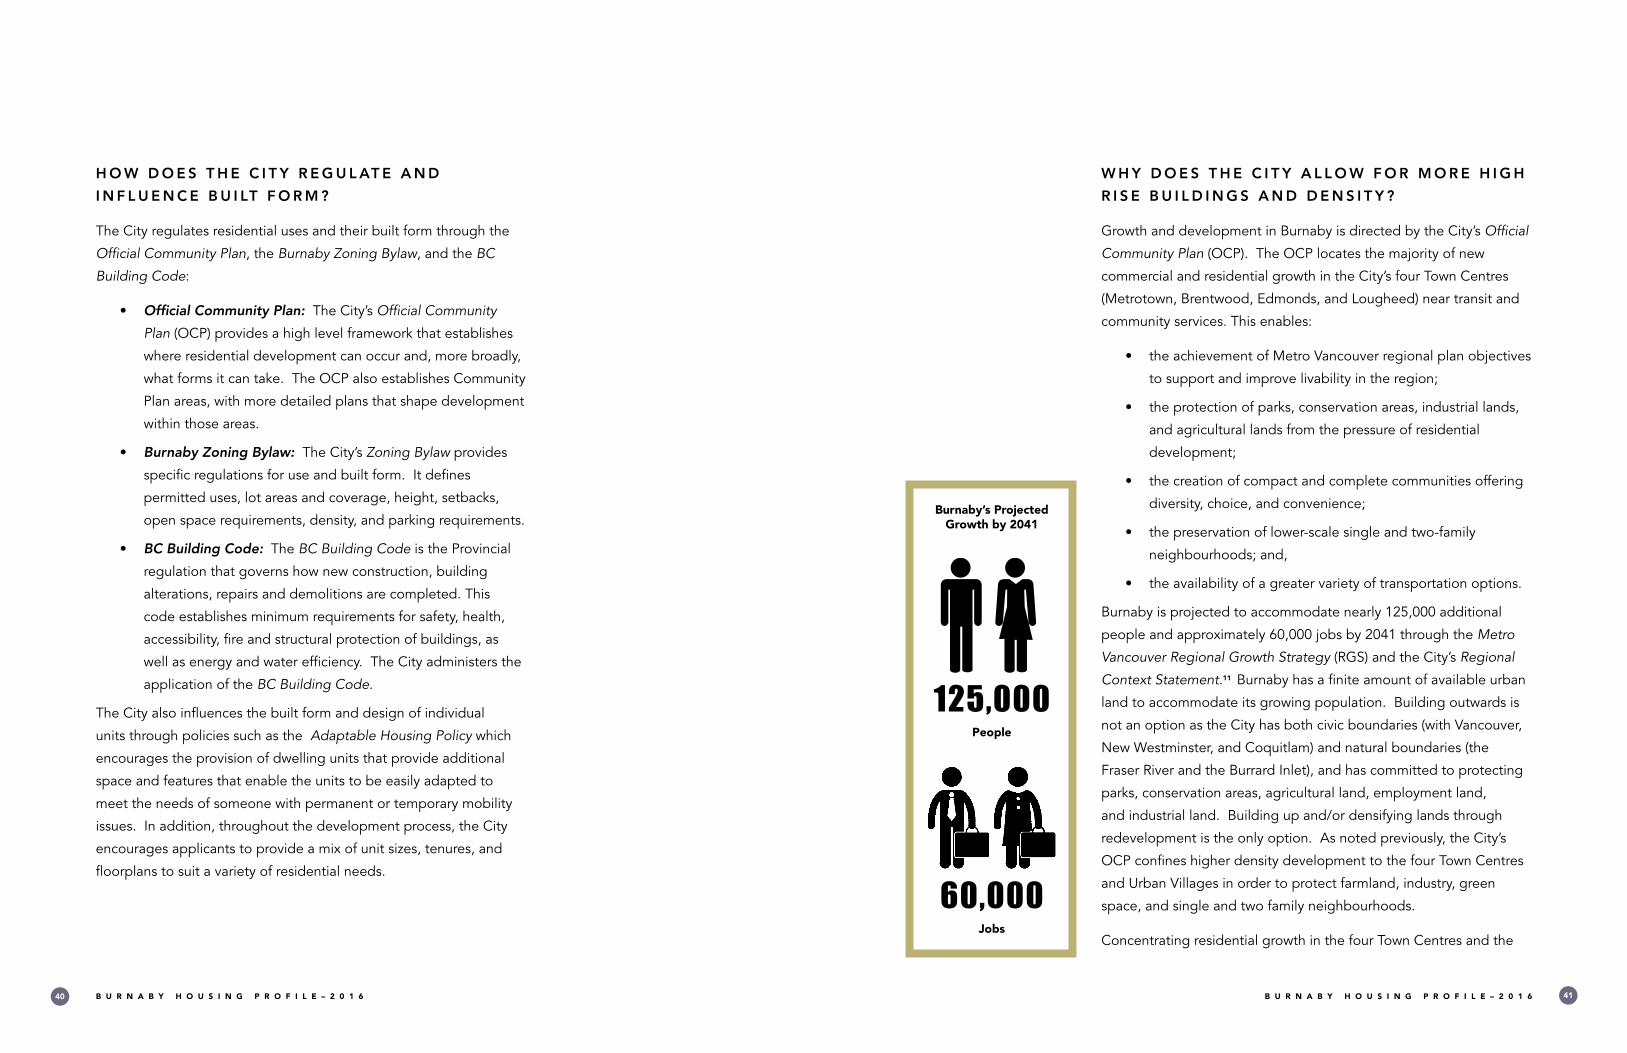
Burnaby is projected to accommodate nearly 125,000 additional
people and approximately 60,000 jobs by 2041 through the Metro
Vancouver Regional Growth Strategy (RGS) and the City’s Regional
Context Statement.11 Burnaby has a finite amount of available urban
land to accommodate its growing population . Building outwards is
not an option as the City has both civic boundaries (with Vancouver,
New Westminster, and Coquitlam) and natural boundaries (the
Fraser River and the Burrard Inlet), and has committed to protecting
parks, conservation areas, agricultural land, employment land,
and industrial land . Building up and/or densifying lands through
redevelopment is the only option . As noted previously, the City’s
OCP confines higher density development to the four Town Centres
and Urban Villages in order to protect farmland, industry, green
space, and single and two family neighbourhoods .
Concentrating residential growth in the four Town Centres and the
125,000People 60,000
Jobs
125,000People
Burnaby’s Projected Growth by 2041
60,000Jobs
125,000People
60,000Jobs

B U R N A B Y H O U S I N G P R O F I L E – 2 0 1 6 B U R N A B Y H O U S I N G P R O F I L E – 2 0 1 642 43
The supply of housing – its quantity, quality, size, and price – changes
as homes are constructed or demolished . This section examines the
factors influencing housing construction and demolition, and answers
some critical questions in the affordability debate .
WHAT DOES IT TAKE TO BUILD A DWELLING UNIT?
Housing construction is a complex process, particularly for large
projects . Apart from the “nuts and bolts” of physical construction,
planning for development includes:
• finding suitable land;
• calculating costs, pricing and returns;
• arranging financing, including investment, pre-sales, and
loans;
• achieving rezoning, subdivision and other municipal
approvals;
• designing the development as well as private and public
services;
• translating building designs into working drawings and
construction layouts;
• obtaining building permits and engineering approvals;
• completing legal documentation, registration, and ownership
matters;
• building finishing and interior design; and,
• marketing and sales/rental .
To accomplish all of this, property owners, investors, and a multitude
of professions, trades, and other occupations contribute to each
H O U S I N G D E V E L O P M E N T
PA R T 2
Urban Villages enables greater access to the public transit system,
which not only increases the viability of public transit but also
reduces congestion for automobiles and other transportation modes,
and makes transportation more affordable for more people . A well-
designed community includes a diverse mix of land uses and housing
types with increased residential and employment densities to
support local amenities and higher levels of transit service . Bringing
more people closer to their destinations makes it possible for them
to drive less and walk, cycle, and use transit more for their daily
needs with less cost . See Part 2 - Section 4.0 for the link between
Housing Affordability and Transportation .
Higher density in Town Centres also contributes directly to
construction of community amenities and affordable housing,
through the City’s density bonus provisions . In Town Centres,
property owners can build additional density in exchange for
providing a community benefit, including community amenities,
affordable and/or special needs housing, or a cash contribution-
in-lieu . These contributions improve the general livability of the
City, by funding public gathering places, civic facilities, non-profit
office spaces, cultural facilities, child care centres, public realm and
environmental enhancements, and affordable housing . Burnaby’s
density bonus program, the Community Benefit Bonus Policy, is
discussed in Part 3 - Section 1.3 and Part 3 - Section 3.3 .
B U R N A B Y H O U S I N G P R O F I L E – 2 0 1 6 B U R N A B Y H O U S I N G P R O F I L E – 2 0 1 644 45
stage in the process . Developers, financial analysts, bank officials,
marketing firms, architects, design consultants, structural, mechanical,
and electrical engineers, land surveyors, interior designers, and a variety
of consultants assist property owners in the development of a project .
In addition, a variety of tradespeople and subcontractors are required
to carry out the work, and municipal government is required to review
the project . The production, distribution, and marketing of building
materials is another industry closely tied to housing construction, as is
the real estate industry .
It is within this context that the housing market operates, and financial
decisions regarding housing construction and demolition are made .
W H O B U I L D S H O U S I N G ?
The building of housing is directed by property owners . Property
owners can be individuals, developers, non-profit agencies, for-
profit agencies or companies, pension and financial companies, or
government agencies .
Most housing is built by the private market (individuals, developers, and
for-profit agencies or companies) and falls into the housing continuum
categories of market ownership or market rental . Given the intensity
of the housing market within the Lower Mainland, much new market
housing is geared towards middle and higher income earners based on
private affordability levels .
Non-market housing is typically built by non-profit agencies, with
funding from the Federal and/or Provincial government . Some non-
market housing is built directly by senior governments . Historically,
most non-market housing was constructed through Federal/Provincial
partnerships with non-profit societies .
Municipalities in B .C . and other provinces do not generally build
housing directly, given their legislative mandates, the structure of
taxation policies, and population mobility in Canada .
W H Y D O P R O P E R T Y O W N E R S R E D E V E L O P
E X I S T I N G H O U S I N G ?
Typical reasons for redevelopment of existing residential structures
include:
• Financial: In competitive housing markets, redevelopment
is a means to renew investment in property and extend the
use of land and structures into the future, while generating
financial gain . This is true regardless of whether the property
can be rezoned to a higher density . Factors that affect
decisions to redevelop or re-invest in property include:
• Land Value: As property values increase, taxes go up
and profit margins from rents are reduced . Rents must
rise to continue generating profit, or the property
must be sold to provide a return on investment . The
high value of the land is an incentive to sell, and
an incentive for purchasers to recoup the cost by
maximizing revenue from any redevelopment project .
• Tenure: Given that land use and zoning cannot
regulate tenure, property owners may demolish a
rental building in order to build stratified residential
units, which can be sold at a profit .
• Age: Some property owners demolish a structure
when it reaches the end of its useful and/or economic
lifecycle – when the net cost to renovate or repair
outweighs the cost of demolition and redevelopment .
• Densification: Some properties have structures that
were built with less density or no longer conform
to the zoning and/or plan for the area . In these
instances, the property owner can demolish the
existing structure and build a new structure that
achieves what is allowed under the zoning and
plan for the area, achieving planned and desired
community development . It is important to
B U R N A B Y H O U S I N G P R O F I L E – 2 0 1 6 B U R N A B Y H O U S I N G P R O F I L E – 2 0 1 646 47
note that the property owner must follow all City
redevelopment processes and obtain all required
permits .
• Available Land: Land is a finite resource . Within Burnaby,
there are very few “green field” properties or properties
that haven’t been developed in some way; therefore almost
all new development is through redevelopment . New
development is necessary to meet community needs,
particularly as the City grows .
• Safety: Some structures become unsafe over time and
are demolished as they are no longer suitable for use and
occupancy .
W H Y I S D E M O L I T I O N P E R M I T T E D ?
Under the Provincial Community Charter, local government has no
legal authority to withhold either a Demolition Permit that complies
with local requirements, the BC Building Act, and the BC Building
Code, or a Building Permit that complies with the local Zoning Bylaw,
BC Building Act and the BC Building Code.12
C A N Z O N I N G P R O T E C T O L D E R B U I L D I N G S ?
Cities have the authority to zone land within their boundaries .
However, zoning has limited ability to prevent demolition .
Maintaining existing zoning or “down-zoning” a property to a lower
density cannot prevent redevelopment or renovation of the property .
Zoning only determines use, density and the size and location of
improvements on a property . It does not regulate cost of housing or
the quality of finishings and design .
From a community planning perspective, new development with
increased density permits more housing supply and smaller unit
sizes that provide greater affordability and a variety of unit types to
support the community over the renewed life of the building . An
increased supply of housing can also serve to moderate home prices,
whereas limiting supply can decrease affordability . In this indirect
way, zoning can influence housing affordability .
C A N C I T I E S P R E V E N T R E N TA L H O U S I N G F R O M
B E I N G C O N V E R T E D T O C O N D O S ?
Yes . Conversion of an existing rental building into a condominium,
where apartments are individually owned, requires strata titling,
which is a form of subdivision . Provincial regulations grant local
government the power to regulate all forms of subdivision . Since
1974, Burnaby has enforced its Rental Conversion Control Policy,
prohibiting strata titling of purpose-built rental apartment buildings .
C A N C I T I E S Z O N E F O R R E N TA L H O U S I N G ?
No . Burnaby has asked the Provincial government to grant local
government the authority to zone for rental housing; however, this
request has yet to be granted . Burnaby continues to advocate for
Provincial legislation that would permit rental-only zones .
W H Y A R E S O M E P R O P E R T I E S R E Z O N E D ?
Rezoning is a process to change the zoning district for a property .
Rezoning is required when a proposed or planned development is
not provided for in the existing zoning district . For instance, in order
to construct an apartment building on a property in a commercial
zoning district, the property would need to be rezoned to a multiple
family residential zoning district .
Rezoning to the Comprehensive Development (CD) zoning district
allows the zoning regulations for a property to be tailored to a
particular plan of development . This approach is typical of larger,

B U R N A B Y H O U S I N G P R O F I L E – 2 0 1 6 B U R N A B Y H O U S I N G P R O F I L E – 2 0 1 648 49
more complex proposals and mixed-use projects that may combine
uses permitted in different zoning districts . For instance, a residential
tower with retail storefronts at street level could only be permitted in
a Comprehensive Development (CD) zoning district based on both
multiple family residential and commercial zoning districts .
W H AT I S T H E R E Z O N I N G P R O C E S S ?
The rezoning process provides an opportunity for property owners to
propose new types of development . It also provides the community
the opportunity to evaluate and comment on proposed changes .
The rezoning process includes the following generalized steps13:
1 . Pre-application (optional): the property owner can
discuss the proposal and receive feedback from Planning
Department staff .
2 . Application: the property owner submits an application
outlining the proposed zoning change and provides
supporting materials .
3 . Initial Report: Council reviews a staff report that evaluates
the proposal and recommends either further review or denial
of the application .
4 . Proposal Refinement: the property owner prepares a more
detailed set of plans and addresses any concerns resulting
from review of the Initial Report .
5 . Public Hearing Report: Council reviews a report from staff
detailing the proposal and providing recommendations for
prerequisites to rezoning approval . Council may advance the
associated rezoning bylaw to First Reading, and schedule the
proposal for Public Hearing .
6 . Public Notice: Ten days prior to the Public Hearing, notice
is published in the local newspaper and sent to any property
owners and occupants within 30 m of the rezoning site .
7 . Public Hearing: any member of the public can speak to the
proposal at the scheduled Public Hearing before Council, or
submit written comments .
8 . Second Reading: having considered all public comment,
Council can reject the rezoning application, ask staff to
review issues raised at Public Hearing, or give Second
Reading and advance the proposal to the next steps in the
process . If staff undertakes further review, a new report will
be presented to Council and a second Public Hearing must
be held before the proposal can move forward .
9 . Prerequisites: once Second Reading is given, all
prerequisites, such as submittal of servicing plans and
preparation of legal documents, must be substantially met
before scheduling of Third Reading by Council .
10 . Final adoption: final adoption of the bylaw, which officially
changes the Zoning Map, can only be provided by Council
once all prerequisites are completely fulfilled .
W H AT I S T H E B A S I S F O R E VA L U AT I N G
R E Z O N I N G P R O P O S A L S ?
Rezoning proposals must be consistent with the policies of the
Official Community Plan (OCP), the associated Community Plans,
and all other City policies and applicable regulations . These policies
have been adopted after considerable public consultation and reflect
planning principles, legislation, community objectives, and other
considerations . As such, they serve as a baseline for determining the
appropriateness of any rezoning proposal .

B U R N A B Y H O U S I N G P R O F I L E – 2 0 1 6 B U R N A B Y H O U S I N G P R O F I L E – 2 0 1 650 51
In addition, proposals cannot exceed the density (floor space)
permitted in the proposed zoning district(s), or vary the permitted
uses .
For Comprehensive Development (CD) District rezoning proposals,
some zoning regulations can be varied, such as height limits or
setbacks from property lines; however, any proposed variations must
be compatible with surrounding development and all applicable
policies .
Housing is typically one of the largest expenses a household
has each month . In Canada, housing is considered affordable if
it consumes less than 30% of a household’s pre-tax income . In
Burnaby, 29% of owner households and 46% of tenant households
spent more than 30% of their total income on shelter costs in 2011 .15
W H Y I S H O U S I N G E X P E N S I V E ?
Housing is expensive for a range of inter-related reasons . In its most
basic sense, housing is a product that is subject to the economic
rules of supply and demand . In Burnaby, and in Metro Vancouver
more broadly, the demand for housing outweighs supply . When
demand rises more than supply, prices generally increase . When
there is an oversupply and/or demand falls, prices generally
decrease . The following factors can affect housing supply and
demand:
• Population Growth: Metro Vancouver is a desirable place
to live . People come to B .C . for economic opportunities,
educational opportunities, lifestyle, climate, family, and
many other reasons . Metro Vancouver is estimated to
accommodate an additional 1 million people by year 2041 –
that’s an additional 36,000 people per year . This projected
growth will require approximately half a million additional
homes . Of that growth, Burnaby is forecasted to grow
by 125,000 people, which would require approximately
50,000 new dwelling units (2,000 per year) by 2041 .16 This
population growth could lead to increases in housing price if
supply doesn’t keep up with demand .
WHAT ARE HOUSING
COSTS?
Housing costs are
defined as a household’s
gross monthly expenses
on housing-related
costs. For renters,
this could include the
monthly rent, the cost of
utilities (electricity, heat,
and water), and the
cost of other municipal
services such as garbage
collection. For owners,
this could include
mortgage payments,
the cost of utilities
(electricity, heat, and
water), and municipal
services, property
taxes, and condominium
fees.14
H O U S I N G C O S T
PA R T 2

B U R N A B Y H O U S I N G P R O F I L E – 2 0 1 6 B U R N A B Y H O U S I N G P R O F I L E – 2 0 1 652 53
• Lack of Funding: At the Federal and Provincial levels,
adequate government funding for non-market housing,
incentives for new rental apartments, and other housing
policies have been insufficient for over two decades, making
it more challenging for households to find affordable housing
options .
• Available Land: Land is a finite resource . Within Burnaby,
there are no “green field” properties or properties that
haven’t been developed . The land itself is expensive – again
the subject of a limited supply and a greater demand .
• Location/Livability: Burnaby is in a desirable location
for business and trade with access to or proximity to port
facilities, the Trans Canada Highway, major road networks,
railways, and Vancouver International Airport . Burnaby’s local
amenities, civic facilities, and access to transit are attractive
and desirable to residents and businesses .
• Demographics: Statistics, including population growth, age,
ethnicity, gender, income, and migration patterns, play an
important role in how housing is priced and what types of
housing are in demand .
• Government Policies: Taxes, incentives (subsidies, grants,
programs, etc .), and other policies related to housing can
impact the demand for and price of housing, as well as the
types of housing that gets built and where .
• The Economy: The strength of the overall economy (based
on GDP, employment data, etc .) can affect the value of
housing . Typically, when the economy is doing well, so is the
housing market and vice versa .
• Jobs and Incomes: As incomes rise, and the number of
jobs increase, more people can afford to participate in the
housing market, which then increases demand and price .
However, if incomes are lower, and/or unemployment levels
are high, fewer people can afford to participate in the
housing market, decreasing demand and price . This basic
dynamic becomes more complex within the irregularities
of most job and housing markets, and in the context of the
many other factors influencing housing demand and price .
• Interest Rates: Changes in interest rates can greatly
influence a person’s ability to purchase a residential property .
As the interest rates fall, the cost to obtain a mortgage
to buy a home decreases, which enables more people to
purchase a home and increases the demand for housing,
leading to increasing prices . Conversely, as interest rates
rise, the cost to obtain a mortgage increases, thus lowering
demand and in turn, price .
T H E H O U S I N G A N D T R A N S P O R TAT I O N
A F F O R D A B I L I T Y L I N K
Typically, housing is the largest expenditure that a household makes
each month, and transportation is the second largest . The two costs
are linked – as people move to more suburban locations to find more
affordable housing, their transportation costs may increase if they
are further away from their jobs, shopping, amenities, and services
and are faced with fewer public transit, cycling, or walking options .
As a part of the housing affordability equation, transportation
costs should be considered as they can have an impact on overall
household budgets .
Average Transportation Costs
According to the Metro Vancouver 2011 Regional Trip Diary, 69%
of trips by Burnaby residents are made by private vehicle, while
21% are by transit, and the remaining 10% walk or cycle to their
destination .18
WHO CONTROLS THE
HOUSING MARKET?
The housing market is a
‘free’ market and is not
controlled by any one
agency or government.
Rather, it is influenced
by an array of
socioeconomic factors
that affect supply,
demand, and price.
WHAT ARE
TRANSPORTATION
COSTS?
Transportation costs
include transit and
personal vehicle
expenditures. Transit
costs can include cash
fares or a variety of
monthly and annual
passes. Personal vehicle
costs can include fixed
items such as insurance,
license and registration
fees, financial charges,
and depreciation, as
well as operating costs
such as maintenance
and fuel.
Other transportation
costs may include tolls
or parking fees. Taxi
fares, car rental and
car-share fees are
also components of
transportation costs.
The value of time is
also a factor when
determining the total
cost of transportation.17

B U R N A B Y H O U S I N G P R O F I L E – 2 0 1 6 B U R N A B Y H O U S I N G P R O F I L E – 2 0 1 654 55
Driving a personal vehicle is the most expensive mode of travel .
According to the Canadian Automobile Association, the cost of
operating a personal vehicle (including depreciation, financing
charges, licenses and registration, insurance, maintenance and
repair) ranges from $8,600 per year for a compact car to over
$12,000 for an SUV per year .19
The cost of commuting by transit ranges from $1,092 to $2,040
depending on the fare zones travelled .20 Owning and riding a
bicycle or walking are the least expensive modes with costs more
easily controlled by the individual commuter .
For owner households in the Burnaby/New Westminster sub-region,
the combined housing and transportation cost burden is 45% of the
median income . For renter households, whose incomes are typically
lower, the cost burden is 47% of the median income .21
Living near public transit, or within biking or walking distance to
work and other daily needs, can reduce or eliminate household
transportation expenditures . This is particularly important for
renter households, whose incomes are typically lower than owner
households . These transportation savings can help to offset
the higher cost of rent or mortgage payments . In effect, the
concentration of residential development near jobs, shops, and
services increases affordability by reducing transportation costs .
T H E R O L E O F G O V E R N M E N T
PA R T 2
Government, particularly at the Federal level, plays a fundamental
role in the development of both market and non-market housing .
The housing system in Canada is based on Federal and Provincial
legislation and programs governing financing, construction practices,
land use, and other aspects of housing delivery and distribution .23
Market housing is supported by Federal subsidies such as mortgage
and tax incentives and homeowner assistance programs . Every
housing unit that is constructed in Canada relies on Federal and
Provincial legislation governing mortgage lending, taxes, building
regulations, and professional practices .
Most non-market housing developments rely on subsidies,
grants or low cost financing from senior levels of government . In
some cases, non-market housing developments are operated by
Provincial agencies . This is due to the greater taxation powers of
senior governments and their ability to redistribute wealth more
consistently and equitably than can be achieved on a city-by-city
basis .
Regional governments provide housing policy direction and may
also provide non-market housing through entities such as the Metro
Vancouver Housing Corporation . Local governments determine land
use and zoning under Provincial mandates, and play a supportive
and facilitating role in housing delivery .
See Table 1 for a listing of areas of responsibility and the associated
levels of government .
TAX DOLLARS - WHO
GETS WHAT?
Municipalities own over
60% of the country’s
infrastructure and
deliver a broad range
of local services and
amenities but collect
just eight to ten cents
of every tax dollar
paid in Canada, with
the other 90 - 92 cents
going to the Federal
and Provincial/Territorial
governments.22
8-10¢
10%of Burnaby Trips made by Walking or Cycling
Nominal Cost per Year
21%of Trips made by
Transit
$1,092-$2,040
Cost per Year
69%of Trips made by Private Vehicle
$8,600-$12,000
Cost per Year
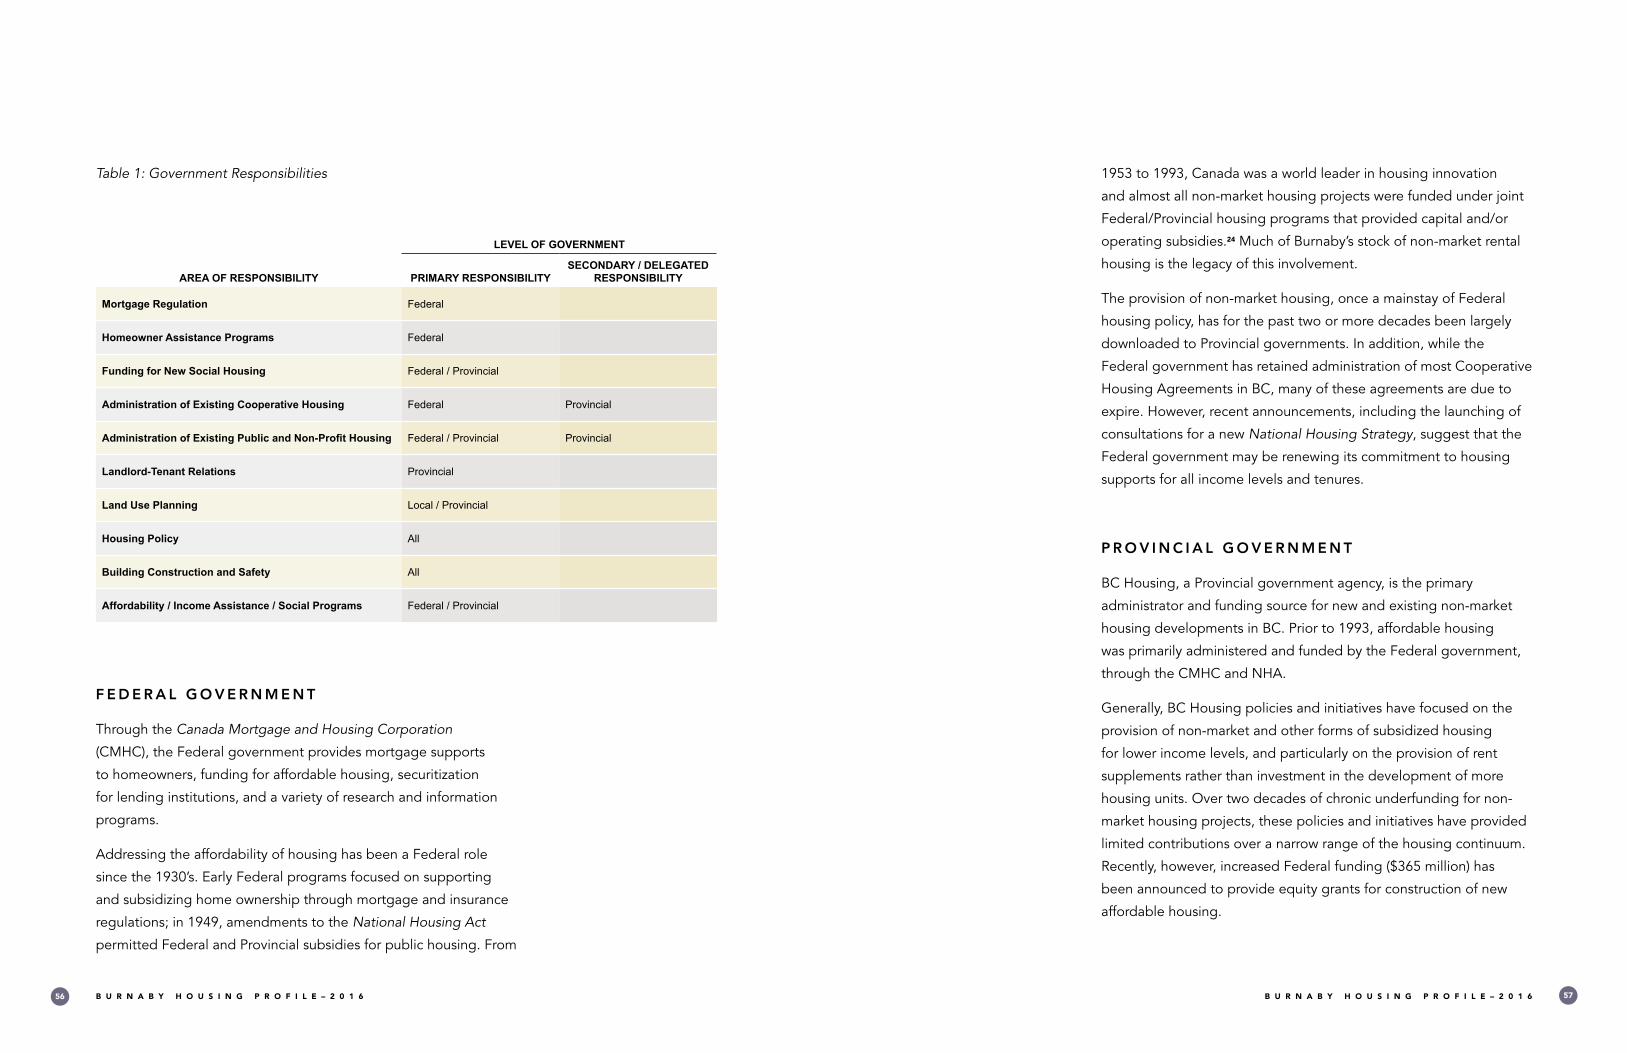
B U R N A B Y H O U S I N G P R O F I L E – 2 0 1 6 B U R N A B Y H O U S I N G P R O F I L E – 2 0 1 656 57
Table 1: Government Responsibilities
F E D E R A L G O V E R N M E N T
Through the Canada Mortgage and Housing Corporation
(CMHC), the Federal government provides mortgage supports
to homeowners, funding for affordable housing, securitization
for lending institutions, and a variety of research and information
programs .
Addressing the affordability of housing has been a Federal role
since the 1930’s . Early Federal programs focused on supporting
and subsidizing home ownership through mortgage and insurance
regulations; in 1949, amendments to the National Housing Act
permitted Federal and Provincial subsidies for public housing . From
1953 to 1993, Canada was a world leader in housing innovation
and almost all non-market housing projects were funded under joint
Federal/Provincial housing programs that provided capital and/or
operating subsidies .24 Much of Burnaby’s stock of non-market rental
housing is the legacy of this involvement .
The provision of non-market housing, once a mainstay of Federal
housing policy, has for the past two or more decades been largely
downloaded to Provincial governments . In addition, while the
Federal government has retained administration of most Cooperative
Housing Agreements in BC, many of these agreements are due to
expire . However, recent announcements, including the launching of
consultations for a new National Housing Strategy, suggest that the
Federal government may be renewing its commitment to housing
supports for all income levels and tenures .
P R O V I N C I A L G O V E R N M E N T
BC Housing, a Provincial government agency, is the primary
administrator and funding source for new and existing non-market
housing developments in BC . Prior to 1993, affordable housing
was primarily administered and funded by the Federal government,
through the CMHC and NHA .
Generally, BC Housing policies and initiatives have focused on the
provision of non-market and other forms of subsidized housing
for lower income levels, and particularly on the provision of rent
supplements rather than investment in the development of more
housing units . Over two decades of chronic underfunding for non-
market housing projects, these policies and initiatives have provided
limited contributions over a narrow range of the housing continuum .
Recently, however, increased Federal funding ($365 million) has
been announced to provide equity grants for construction of new
affordable housing .
AREA OF RESPONSIBILITY
LEVEL OF GOVERNMENT
PRIMARY RESPONSIBILITYSECONDARY / DELEGATED
RESPONSIBILITY
Mortgage Regulation Federal
Homeowner Assistance Programs Federal
Funding for New Social Housing Federal / Provincial
Administration of Existing Cooperative Housing Federal Provincial
Administration of Existing Public and Non-Profit Housing Federal / Provincial Provincial
Landlord-Tenant Relations Provincial
Land Use Planning Local / Provincial
Housing Policy All
Building Construction and Safety All
Affordability / Income Assistance / Social Programs Federal / Provincial

B U R N A B Y H O U S I N G P R O F I L E – 2 0 1 6 B U R N A B Y H O U S I N G P R O F I L E – 2 0 1 658 59
The Province is also responsible for tenant-landlord relations,
including rent controls, and the maintenance of rental buildings,
under the Residential Tenancy Act and Public Health Act .
Through the Local Government Act and Community Charter, the
Province also determines land use and zoning powers, which it
delegates to local governments . Burnaby’s ability to influence
housing delivery through land use plans and zoning depends on the
powers granted by this legislation .
The Province also is responsible for the BC Building Code, which
provides uniform construction standards to ensure the safety of all
buildings . The application of the BC Building Code is administered
by local governments through the building permit process .
R E G I O N A L G O V E R N M E N T
Metro Vancouver, through collaboration with local governments,
supports the development of housing, at the regional level through
its roles in housing policy and delivery . Specific actions include:
• providing mixed income housing through Metro Vancouver
Housing Corporation;
• setting policy direction through the Regional Growth Strategy
and the Regional Affordable Housing Strategy;
• researching, collecting and analyzing data to support
regional and municipal housing policy goals and promote
best practices;
• convening municipal politicians and staff on housing issues of
regional and local concern;
• advocating to senior governments for tools, policies and
resources to support regional housing needs; and,
• using fiscal measures, such as the waiver of Greater
Vancouver Sewerage and Drainage District (GVS & DD)
Development Cost Charges, to support affordable rental
housing .
L O C A L G O V E R N M E N T
Local governments, including municipalities, can only exercise
powers delegated to them by the Provincial government . In BC,
under Provincial legislation for housing, local governments are
responsible for land use planning and zoning, which affect the
location and type of housing available in their communities . They
are also responsible for ensuring adequate housing standards
through application of the BC Building Code . Through their land
use planning and zoning powers, local governments strive to ensure
an adequate supply of residential land to meet housing demand .
Through enforcement of building code requirements, they help to
ensure that housing is liveable and safe .
The development of Burnaby’s housing stock is guided by the
Residential Policy Framework of Burnaby’s Official Community
Plan (OCP) . This framework outlines the general types, density,
and location of residential development, with the twin goals of
accommodating regional population growth estimates and providing
a varied range and choice of living opportunities in the City . The
Burnaby Zoning Bylaw implements the residential framework of the
OCP .
Local governments, including Burnaby, can designate an area within
a zone for affordable housing or special needs housing, but only
with the cooperation and consent of the property owner . They can
also obtain a housing agreement from a developer on a voluntary
basis, such as through density bonus provisions . However, local
governments cannot zone for tenure; they cannot specify “rental
housing” as a permitted use, as opposed to stratified condominiums .
Burnaby has advocated to the Province for the ability to zone for
rental housing, but this has been rejected .
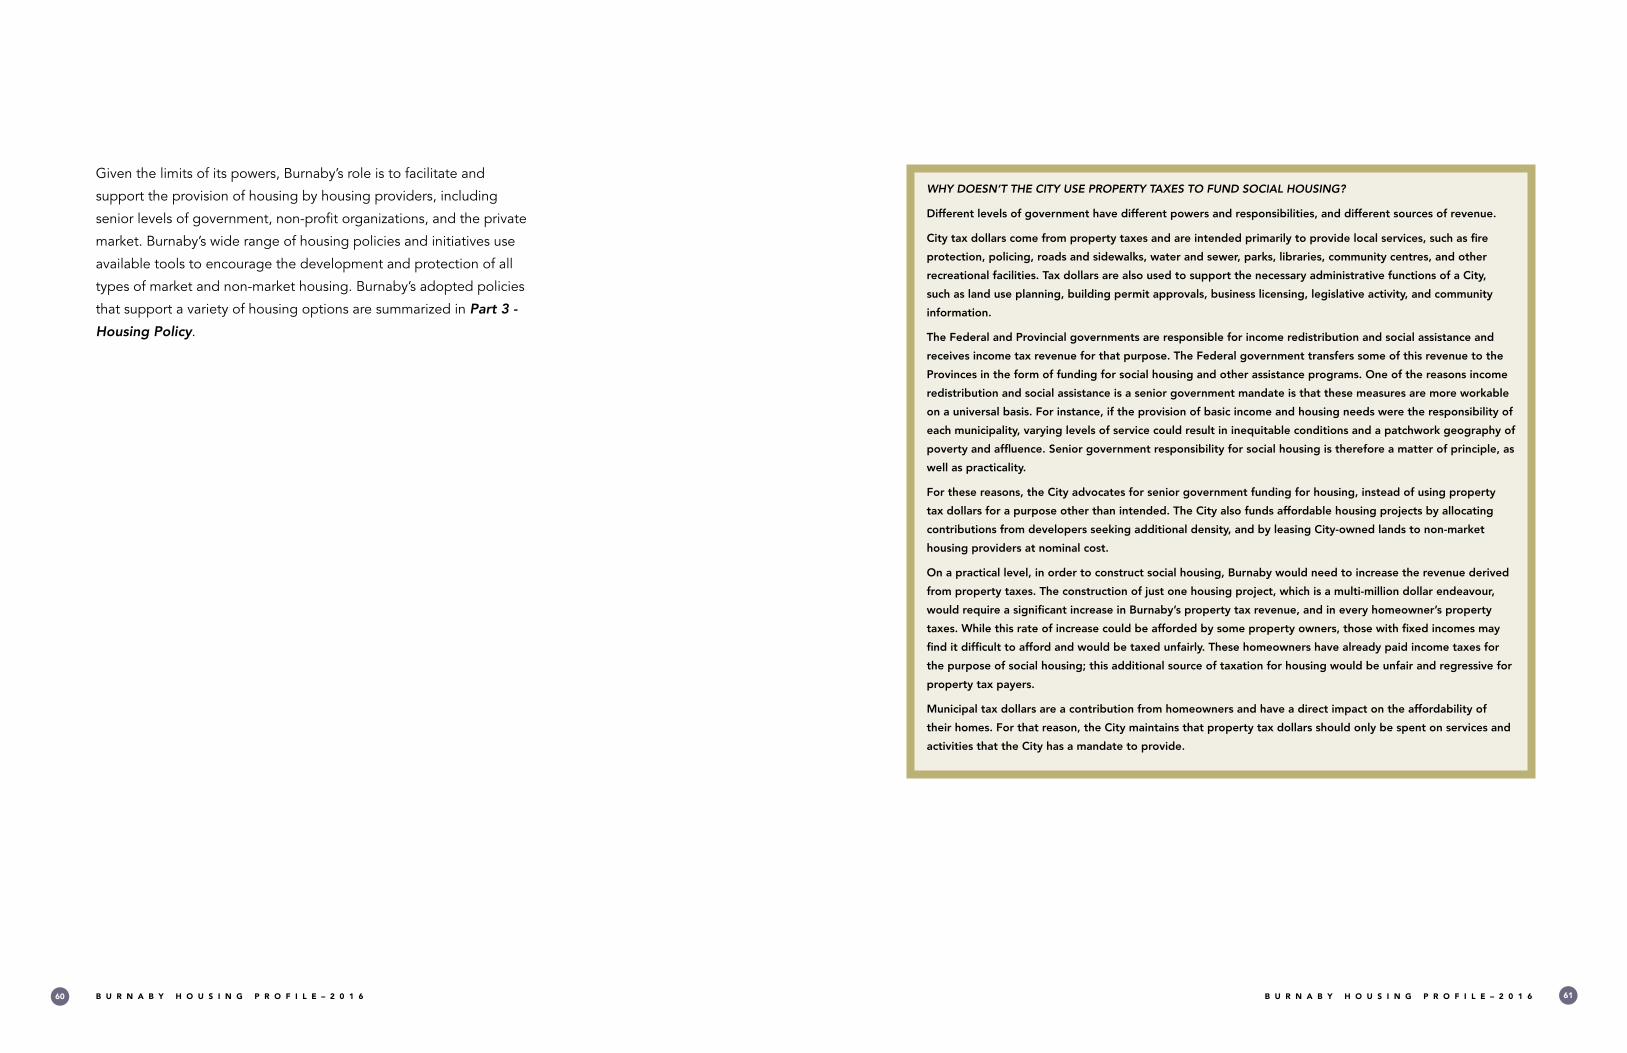
B U R N A B Y H O U S I N G P R O F I L E – 2 0 1 6 B U R N A B Y H O U S I N G P R O F I L E – 2 0 1 660 61
WHY DOESN’T THE CITY USE PROPERTY TAXES TO FUND SOCIAL HOUSING?
Different levels of government have different powers and responsibilities, and different sources of revenue.
City tax dollars come from property taxes and are intended primarily to provide local services, such as fire
protection, policing, roads and sidewalks, water and sewer, parks, libraries, community centres, and other
recreational facilities. Tax dollars are also used to support the necessary administrative functions of a City,
such as land use planning, building permit approvals, business licensing, legislative activity, and community
information.
The Federal and Provincial governments are responsible for income redistribution and social assistance and
receives income tax revenue for that purpose. The Federal government transfers some of this revenue to the
Provinces in the form of funding for social housing and other assistance programs. One of the reasons income
redistribution and social assistance is a senior government mandate is that these measures are more workable
on a universal basis. For instance, if the provision of basic income and housing needs were the responsibility of
each municipality, varying levels of service could result in inequitable conditions and a patchwork geography of
poverty and affluence. Senior government responsibility for social housing is therefore a matter of principle, as
well as practicality.
For these reasons, the City advocates for senior government funding for housing, instead of using property
tax dollars for a purpose other than intended. The City also funds affordable housing projects by allocating
contributions from developers seeking additional density, and by leasing City-owned lands to non-market
housing providers at nominal cost.
On a practical level, in order to construct social housing, Burnaby would need to increase the revenue derived
from property taxes. The construction of just one housing project, which is a multi-million dollar endeavour,
would require a significant increase in Burnaby’s property tax revenue, and in every homeowner’s property
taxes. While this rate of increase could be afforded by some property owners, those with fixed incomes may
find it difficult to afford and would be taxed unfairly. These homeowners have already paid income taxes for
the purpose of social housing; this additional source of taxation for housing would be unfair and regressive for
property tax payers.
Municipal tax dollars are a contribution from homeowners and have a direct impact on the affordability of
their homes. For that reason, the City maintains that property tax dollars should only be spent on services and
activities that the City has a mandate to provide.
Given the limits of its powers, Burnaby’s role is to facilitate and
support the provision of housing by housing providers, including
senior levels of government, non-profit organizations, and the private
market . Burnaby’s wide range of housing policies and initiatives use
available tools to encourage the development and protection of all
types of market and non-market housing . Burnaby’s adopted policies
that support a variety of housing options are summarized in Part 3 -
Housing Policy .

B U R N A B Y H O U S I N G P R O F I L E – 2 0 1 6 B U R N A B Y H O U S I N G P R O F I L E – 2 0 1 662 63
HOUSING POLICY
PART

B U R N A B Y H O U S I N G P R O F I L E – 2 0 1 6 B U R N A B Y H O U S I N G P R O F I L E – 2 0 1 664 65
DID YOU KNOW?
Burnaby’s role is to
facilitate and support
housing through
policies, programs,
initiatives, and advocacy.
Local government’s role is to support the provision of a diverse
range of housing types, through its land use and zoning powers and
other available means . To that end, Burnaby has developed a host of
housing policies and programs .
Burnaby’s policies facilitate opportunities across the housing
continuum . Through a range of programs and partnerships, these
policies encourage the development and protection of affordable
rental housing, special needs housing, and other non-market and
market housing to meet the community’s needs . As the basis for
regulating land use and development, policies such as the Official
Community Plan (OCP) and associated area-specific Community
Plans shape the location, amount, and types of housing available in
the City .
Burnaby’s housing policies can be divided into three categories:
Guiding policies, discussed in Part 3 – Section 1.0, provide high
level direction . Community plans, outlined in Part 3 – Section 2.0,
further the policies of the OCP, including the Residential Framework .
Supporting housing policies, outlined in Part 3 – Section 3.0,
provide more specific programs, initiatives, and actions .
H O U S I N G P O L I C Y

B U R N A B Y H O U S I N G P R O F I L E – 2 0 1 6 B U R N A B Y H O U S I N G P R O F I L E – 2 0 1 666 67
G U I D I N G P O L I C I E S
PA R T 3
Three primary documents guide all of the City’s land use planning
activities, including housing . These documents are:
• The Official Community Plan (OCP);
• The Regional Context Statement (RCS); and
• The Social Sustainability Strategy (SSS) .
Housing policy is also informed by two major reports:
• Affordable Housing and Homelessness: A Response to Issues
and Proposals (2007); and
• Growth Management and Housing Policies in Burnaby (2015) .
In addition, the Community Benefit Bonus Policy / Program is a key
component of Burnaby’s housing policy .
Like the foundations of a house, these documents are less prominent
than the more intricate work that they support: the programs, plans,
and practices that shape the City on a daily basis, and the homes,
neighbourhoods, and urban landscape that are the tangible result .
However, like any groundwork, these policies determine the size,
shape, location, quality, and sustainability of the overlying structure,
and are worth a quick inspection .
For a more detailed look, these documents are available online
at www .burnaby .ca, or from the Planning and Development
Department at planning@burnaby .ca .
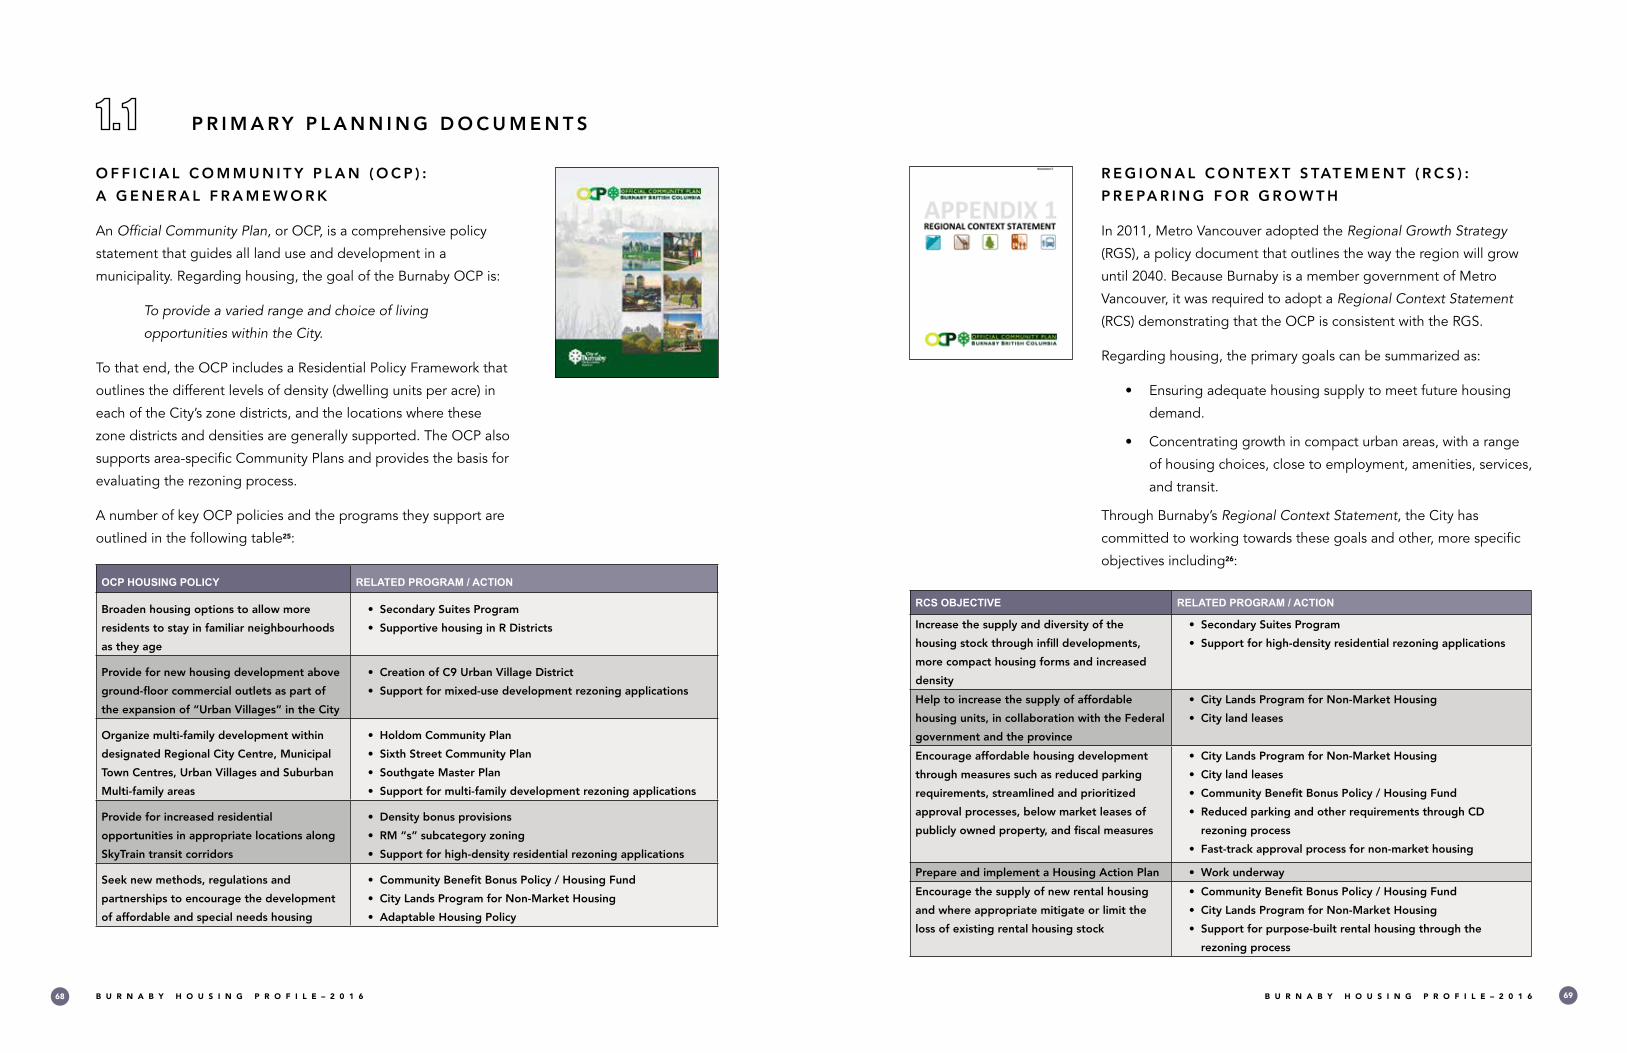
B U R N A B Y H O U S I N G P R O F I L E – 2 0 1 6 B U R N A B Y H O U S I N G P R O F I L E – 2 0 1 668 69
O F F I C I A L C O M M U N I T Y P L A N ( O C P ) :
A G E N E R A L F R A M E W O R K
An Official Community Plan, or OCP, is a comprehensive policy
statement that guides all land use and development in a
municipality . Regarding housing, the goal of the Burnaby OCP is:
To provide a varied range and choice of living
opportunities within the City.
To that end, the OCP includes a Residential Policy Framework that
outlines the different levels of density (dwelling units per acre) in
each of the City’s zone districts, and the locations where these
zone districts and densities are generally supported . The OCP also
supports area-specific Community Plans and provides the basis for
evaluating the rezoning process .
A number of key OCP policies and the programs they support are
outlined in the following table25:
OCP HOUSING POLICY RELATED PROGRAM / ACTION
Broaden housing options to allow more
residents to stay in familiar neighbourhoods
as they age
• Secondary Suites Program
• Supportive housing in R Districts
Provide for new housing development above
ground-floor commercial outlets as part of
the expansion of “Urban Villages” in the City
• Creation of C9 Urban Village District
• Support for mixed-use development rezoning applications
Organize multi-family development within
designated Regional City Centre, Municipal
Town Centres, Urban Villages and Suburban
Multi-family areas
• Holdom Community Plan
• Sixth Street Community Plan
• Southgate Master Plan
• Support for multi-family development rezoning applications
Provide for increased residential
opportunities in appropriate locations along
SkyTrain transit corridors
• Density bonus provisions
• RM “s” subcategory zoning
• Support for high-density residential rezoning applications
Seek new methods, regulations and
partnerships to encourage the development
of affordable and special needs housing
• Community Benefit Bonus Policy / Housing Fund
• City Lands Program for Non-Market Housing
• Adaptable Housing Policy
R E G I O N A L C O N T E X T S TAT E M E N T ( R C S ) :
P R E PA R I N G F O R G R O W T H
In 2011, Metro Vancouver adopted the Regional Growth Strategy
(RGS), a policy document that outlines the way the region will grow
until 2040 . Because Burnaby is a member government of Metro
Vancouver, it was required to adopt a Regional Context Statement
(RCS) demonstrating that the OCP is consistent with the RGS .
Regarding housing, the primary goals can be summarized as:
• Ensuring adequate housing supply to meet future housing
demand .
• Concentrating growth in compact urban areas, with a range
of housing choices, close to employment, amenities, services,
and transit .
Through Burnaby’s Regional Context Statement, the City has
committed to working towards these goals and other, more specific
objectives including26:
RCS OBJECTIVE RELATED PROGRAM / ACTION
Increase the supply and diversity of the
housing stock through infill developments,
more compact housing forms and increased
density
• Secondary Suites Program
• Support for high-density residential rezoning applications
Help to increase the supply of affordable
housing units, in collaboration with the Federal
government and the province
• City Lands Program for Non-Market Housing
• City land leases
Encourage affordable housing development
through measures such as reduced parking
requirements, streamlined and prioritized
approval processes, below market leases of
publicly owned property, and fiscal measures
• City Lands Program for Non-Market Housing
• City land leases
• Community Benefit Bonus Policy / Housing Fund
• Reduced parking and other requirements through CD
rezoning process
• Fast-track approval process for non-market housing
Prepare and implement a Housing Action Plan • Work underway
Encourage the supply of new rental housing
and where appropriate mitigate or limit the
loss of existing rental housing stock
• Community Benefit Bonus Policy / Housing Fund
• City Lands Program for Non-Market Housing
• Support for purpose-built rental housing through the
rezoning process
P R I M A RY P L A N N I N G D O C U M E N T S

B U R N A B Y H O U S I N G P R O F I L E – 2 0 1 6 B U R N A B Y H O U S I N G P R O F I L E – 2 0 1 670 71
S O C I A L S U S TA I N A B I L I T Y S T R AT E G Y ( S S S ) :
Q U A L I T Y O F L I F E
The Social Sustainability Strategy is a policy document about people
– their needs, communities, and quality of life . Adopted in 2011,
the Strategy contains seven strategic priorities for creating a more
inclusive, livable and resilient community .
Strategic Priority 1: Meeting Basic Needs calls for “access to a
continuum of safe, accessible and affordable housing,” and includes
several actions for promoting affordable and suitable housing27:
SOCIAL SUSTAINABILITY STRATEGY ACTION RELATED PROGRAM / ACTION
Consider developing or clarifying criteria for
use of the City’s Housing Fund to fill gaps in the
housing continuum
• City Lands Program for Non-Market Housing
Continue to lease City-owned properties
for affordable non-market, supportive and
transitional housing
• City Lands Program for Non-Market Housing
• City land leases
Continue to add to Burnaby’s stock of
adaptable/accessible housing through the
Community Benefit Bonus Policy
• Community Benefit Bonus Policy / Housing Fund
Consider revising the Adaptable Housing Policy
to ensure the construction of an adequate stock
of adaptable housing units
• Completed in 2014
Seek opportunities to work with senior
governments and the community to facilitate
the development of housing that is suitable and
affordable to specific target groups such as low-
and moderate-income households, and those
experiencing mental illness
• City Lands Program for Non-Market Housing
• City land leases
• Community Benefit Bonus Policy / Housing Fund
• Reduced parking and other requirements for affordable
housing through CD rezoning process
• Fast-track approval process for non-market housing
Facilitate housing affordability for a wide range
of Burnaby residents by considering a range of
additional housing options including secondary
suites, laneway housing and coach houses.
• Secondary Suites Program
Consider consolidating and updating the
City’s housing policies and programs into a
comprehensive Burnaby Housing Strategy
• Future Burnaby Housing Strategy
A F F O R D A B L E H O U S I N G & H O M E L E S S N E S S : A
R E S P O N S E T O I S S U E S A N D P R O P O S A L S
Adopted in 2007, this report provides an overview of affordable
housing issues and proposals to address them . It calls upon senior
levels of government to uphold their responsibilities to fund non-
market housing and encourages the Provincial government to grant
municipalities the authority to zone for rental housing .
It also outlines City housing initiatives that existed at the time or
have since been adopted, including28:
• cooperating to make civic lands available to non-profit
housing providers;
• reducing and/or providing grants for development cost
charges, property taxes, and building permit fees for non-
market housing;
• building flexibility in development standards;
• facilitating approval processes;
• supporting innovations in affordable housing types and
forms;
• increasing densities; and
• creating innovative housing policies .
This Burnaby Housing Profile - 2016, together with the development
of a future Burnaby Housing Strategy, will update and replace this
policy document .
AFFORDABLE HOUSING AND HOMELESSNESS -
A RESPONSE TO ISSUES AND PROPOSALS
PLANNING & BUILDING DEPARTMENT
2007 FEBRUARY 19
M A J O R R E P O R T S

B U R N A B Y H O U S I N G P R O F I L E – 2 0 1 6 B U R N A B Y H O U S I N G P R O F I L E – 2 0 1 672 73
K E Y P O L I C Y
Burnaby’s Community
Benefit Bonus Policy
Achieving Community Amenities
Program Report 1997-2014
Prepared by the Planning and Building Department
G R O W T H M A N A G E M E N T A N D H O U S I N G
P O L I C I E S I N B U R N A B Y
Prepared in response to concerns about redevelopment of rental
housing sites, this 2015 report reviews Burnaby’s approach to
managing growth and development, specifically in regard to housing
supply and demand, tenure, and affordability . It examines the
following issues, particularly as they affect market rental housing29:
• Burnaby’s policy framework for managing growth;
• The roles and responsibilities of local and senior levels of
government;
• Burnaby’s contributions to market and non-market housing
opportunities and affordability levels; and,
• The constraints faced by local governments to directly
provide or influence the supply and affordability of housing .
This Burnaby Housing Profile – 2016 expands on many of the themes
presented in the ‘Growth Management and Housing Policies in
Burnaby’ report .
C O M M U N I T Y B E N E F I T B O N U S P O L I C Y
Adopted in 1997, the Community Benefit Bonus Policy is a tool
for securing community amenities and affordable housing through
a density bonus program . The policy allows property owners to
achieve additional density in Town Centre areas in exchange for a
community benefit .
A community benefit can be affordable and/or special needs
housing, an amenity (such as a recreation facility, non-profit
office space, or child care centre), a cash contribution-in-lieu, or
a combination of any of the above . Cash contributions-in-lieu
are collected and split in two accounts, with 80% put into the
appropriate Town Centre account, and the remaining 20% into the
City-wide Housing Fund . These contributions are saved for the
provision of future community benefits .31
To date, the Community Benefit Bonus Policy and Housing Fund has
achieved:
• 19 affordable and/or special needs housing units in three
recent Brentwood Town Centre developments (Madison
Centre, Renaissance, and Brentwood Gate), with a density
bonus value of approximately $3 .9 million;
• Partnership agreement with BC Housing and private
developer for 181 non-market housing units at Cedar Place,
with a density bonus value of approximately $8 .5 million;
• $2 million in housing grants to five non-market housing
projects with a total of 276 housing units; and
• Over $40 million saved in the Housing Fund for future
housing projects and initiatives .
WHAT IS A DENSITY
BONUS?
A density bonus is an
increase in floor space
that can be granted to
a property owner in
exchange for an eligible
community benefit,
such as community
amenities, affordable
and/or special needs
housing, or a cash
contribution-in-lieu.
The value of the
amenities, housing, or
cash contribution-in-lieu
must be equivalent to
the increased land value
generated by the extra
density. In Burnaby,
density bonuses are
only available in Town
Centres.30

B U R N A B Y H O U S I N G P R O F I L E – 2 0 1 6 B U R N A B Y H O U S I N G P R O F I L E – 2 0 1 674 75
Burnaby has 35 Community Plans that further the policies of the OCP
on an area-specific basis . These plans guide future development
and are the basis for evaluating rezoning and other development
proposals .
Each Community Plan includes numerous policies, including
residential densities and building forms that are appropriate for
different locations in the plan area . These are depicted on a map
that indicates, in a generalized manner, the land use designations for
each parcel . These land use designations are consistent with specific
zone districts provided in the Burnaby Zoning Bylaw . As such,
Community Plans serve as a link between the broader policies of the
OCP and the review of rezoning proposals .
Community Plan areas include Town Centres, Urban Villages,
Suburban Multi-Family Areas, Mixed-Use Areas and Park/
Conservation Areas . Land use in areas without Community Plans,
such as most single and two-family residential neighbourhoods, is
guided directly by the Residential Framework of the OCP .
Like the OCP, Community Plans require detailed planning and land-
use analysis and undergo extensive public consultation . Community
Plans are adopted by Council and can be amended to serve
changing community needs .
C O M M U N I T Y P L A N S
PA R T 3
Town Centres
Urban Villages
Park And Conservation Areas
Suburban Multi-family Areas
Mixed-use Areas
Single and Two Family Areas
Capitol HillConservationArea
The Heights
BrentwoodHoldom
Capitol Hill Lochdale
Montecito
Burnaby MountainConservation Area
Forest Grove
Lake City
BrightonLougheed
CaribooHeights
GeorgeDerby
Burnaby LakeRegional Nature Park
Rayside
BurnabyLake
SportsComplex
CentralAdministrative
Area
GreentreeVillage
DiscoveryPlace
Broadview
MyrtleStreet
CascadeHeights
Metrotown
Oaklands
Royal Oak
Big Bend
Edmonds
SixthStreet Newcombe
Bainbridge
Barnet Marine Park
Simon FraserUniversity
WillingdonHeights
ChevronBufferZone
Community Plan Areas

B U R N A B Y H O U S I N G P R O F I L E – 2 0 1 6 B U R N A B Y H O U S I N G P R O F I L E – 2 0 1 676 77
S U P P O R T I N G P O L I C I E S
PA R T 3
The following sections describe the City’s supporting housing
policies and their accompanying programs, initiatives, and actions .
These policies implement the direction provided by the guiding
policies, resulting in significant achievements on the ground .

B U R N A B Y H O U S I N G P R O F I L E – 2 0 1 6 B U R N A B Y H O U S I N G P R O F I L E – 2 0 1 678 79
N O N - M A R K E T H O U S I N GC I T Y- W I D E H O U S I N GP O L I C I E S A N D I N I T I AT I V E S G E N E R A L P O L I C I E S A N D
The following policies and initiatives are used across the City for all
types of development .
Comprehensive Development (CD) District Zoning
The Comprehensive Development (CD) District provides flexibility
in the design of multiple family residential developments . Under
the Burnaby Zoning Bylaw, CD District developments can vary
regulations such as building setbacks, building height, and parking
requirements . These variances can decrease the cost of providing
housing and increase the number of units built . As such, they provide
valuable incentives that can assist in the development of both non-
market and market housing . Because CD District zoning can only be
achieved through the rezoning process, all variances are subject to
public review .
Adaptable Housing Policy
An adaptable housing unit has features that can be easily modified
to accommodate the changing accessibility requirements of
residents over time . It is distinct from an accessible housing unit,
which is customized to provide access, at the outset, for the majority
of mobility limitations and/or other disabilities .
Burnaby’s Adaptable Housing Policy applies to all new multi-family
residential developments approved through the Comprehensive
Development (CD) rezoning process . It requires adaptable design
for at least 20% of single-level units that are accessed by interior
corridors or exterior passageways . In purpose-built, seniors-oriented
developments, the required percentage increases to 100% .
To encourage the development of adaptable housing units, the
Burnaby Zoning Bylaw provides a 1 .85 m2 (approximately 20 sf) floor
area exemption for every adaptable housing unit .
Priority for non-market housing applications
Burnaby provides policies and initiatives to support all types of non-
market housing development, including:
Deferral of Development Cost Charges and Permit Fees
This policy allows for the deferral of applicable City development
cost charges and permit fees for non-market housing projects for
a period of up to 24 months commencing from the time of final
development approval . This policy helps to defer costs early in the
development schedule, recognizing that one of the most difficult
periods in a project’s establishment, from an operating budget
perspective, is when the project is being constructed prior to the
generation of cash flow .
Fast-Track Approvals Policy
This policy ensures that priority is given to processing applications
for non-market housing during the development application review
process .
Affordable Units Policy
This policy supports and encourages 20% of units in newly
developing communities on senior government and publicly-owned
lands to be developed for non-market rental housing . This policy,
implemented in conjunction with senior government housing
programs, has resulted in the development of 390 non-market
housing units at Oaklands, George Derby, Cariboo Heights, and the
former Burnaby South Secondary School Site in the Edmonds Town
Centre .
I N I T I AT I V E S

B U R N A B Y H O U S I N G P R O F I L E – 2 0 1 6 B U R N A B Y H O U S I N G P R O F I L E – 2 0 1 680 81
Burnaby utilizes a number of policies and initiatives to support each
type of non-market housing on the housing continuum:
E M E R G E N C Y S H E LT E R S
The need for emergency shelters reflects a crisis in Canada’s health
and welfare system, and one of the outcomes is a lack of permanent
housing to meet the needs of those vulnerable to homelessness .
These include citizens with low incomes, and those experiencing
mental illness, addiction, family violence, and other challenges .
Burnaby’s continued advocacy to both the Provincial and Federal
governments emphasizes that emergency shelters are not a
substitute for the permanent housing that they are mandated to
provide .
Along with its advocacy work, Burnaby supports the work of the
Burnaby Task Force on Homelessness and works with the Progressive
Housing Society’s Homeless Outreach Program to connect homeless
residents with services and support . It also participates in the Civic
Notification System for the Lookout Society’s Extreme Weather
Homeless Shelter .
Burnaby also supports the development of a combined emergency
shelter, transitional housing, and supportive housing facility, which
would help individuals move from homelessness to permanent
housing . The City has developed locational guidelines for such a
facility, in order to assist organizations in finding a suitable site in
Burnaby .
For many years, the City advocated for construction of such a facility
on Provincially-owned land at Willingdon Avenue and Canada Way,
currently the home of the Burnaby Centre for Mental Health and
Addiction and the Maples Adolescent Treatment Facility . However,
that land was sold in 2014, with the current uses scheduled to close
in 2017 .
T R A N S I T I O N A L H O U S I N G
Transitional housing offers safety and support for those who wish
to transition from an emergency shelter to a permanent place to
live . Transitional housing makes an important contribution to the
well-being of the community by helping individuals move out of
homelessness into permanent housing . It is an appropriate first step
in ensuring that the most vulnerable populations are housed .
Burnaby supports non-profit transitional housing developments
through its Community Benefit Bonus Policy and Housing Fund as
well as through the long-term lease of City land at nominal cost .
These programs are discussed in more detail later in this section . The
City also advocates for greater Provincial and Federal funding for
transitional housing .
H O U S I N G W I T H S U P P O R T S
A N D
N O N - M A R K E T R E N TA L H O U S I N G
In the competitive housing market, non-market rental housing is
an important way to manage the problem of affordability . Despite
the many contributions made by non-profit organizations and lower
levels of government, insufficient Federal and Provincial funding in
Burnaby advocates to higher levels of
government to support and provide all types of
non-market housing
N O N - M A R K E T H O U S I N G P O L I C I E S A N D I N I T I AT I V E S
B Y H O U S I N G T Y P E

B U R N A B Y H O U S I N G P R O F I L E – 2 0 1 6 B U R N A B Y H O U S I N G P R O F I L E – 2 0 1 682 83
N O R T H W E S T
Brentwood
Lougheed
Edmonds
Metrotown
N O R T H E A S T
S O U T H W E S T
S O U T H E A S T
The City leases land to non-profit societies and housing corporations at a reduced rate to build
non-market housing
302=
units to-date
recent decades has resulted in an inadequate supply of non-market
housing at a time when market conditions have increased housing
costs and demand .
Burnaby has long advocated for more programs and funding,
and in 2016 there have been indications that help may be on the
way . The Federal government has begun consultation towards the
development of a new National Housing Strategy, with the intent of
increasing affordable housing . The Provincial government recently
announced its Provincial Investment in Affordable Housing (PIAH)
program that earmarks $355 million for affordable rental housing
partnerships, with the goal of creating over 2,000 units Province-
wide .32 These efforts indicate a greater willingness among senior
government to uphold housing mandates than has been seen in
recent years .
Apart from its advocacy to senior levels of government, the City
provides financial support to non-market housing projects, including
housing with supports, under the following programs:
City Land Leases / City Lands Program for Non-Market Housing
Projects Program
The City leases land that it owns to non-profit societies and housing
corporations seeking to build non-market housing . Similar to a
community land trust, the City offers long-term lease of its lands at a
reduced or nominal rate . The lease of City-owned land significantly
reduces the cost of non-market housing development and ensures
that these lands provide affordable housing now and in the future .
To date, Burnaby has approved seven projects that have added 302
units of non-market rental, including housing with supports, to the
City’s housing inventory .
The projects completed to date utilizing civic lands include:
• Lions Mulberry Place (65 units)
• Ridgelawn Gardens (70 units)
• Cariboo Heights Housing Cooperative (56 units)
• Chelsea Village (43 units)
• Garden Square Housing Cooperative (58 units)
• Filby Court (59 units)
• Dixon Transition House (1 unit)
The City has recently formalized this practice by adopting the City
Land Program for Non-Market Housing Program . This program,
adopted in November 2015, allows designated City lands to be
leased at nominal cost to providers of non-market affordable
housing, including non-profit and/or cooperative housing
associations and other levels of government .
A Request for Expressions of Interest (RFEOI) for the first two
designated sites, at 7898 Eighteenth Avenue and 3802 Hastings
Street, was posted in June 2016, with the review process now
underway . The intent of the program, like previous City land leases,
is to help increase the stock of non-market rental housing in Burnaby .
Community Benefit Bonus Policy / Housing Fund
A range of non-market housing, including housing with supports,
is generated through Burnaby’s Community Benefit Bonus Policy
/ Program . Property owners developing within Town Centres can
achieve additional density in exchange for a community benefit . A
community benefit can be a community amenity (such as a recreation
centre, non-profit office space, child care space, or public realm
enhancements), affordable and/or special needs housing, a cash
contribution-in-lieu for future amenities or housing, or a combination
of these benefits . Cash contributions-in-lieu are collected and split
in two accounts, with 80% put into the appropriate Town Centre
Account, and the remaining 20% into the City-wide Housing Fund .33

B U R N A B Y H O U S I N G P R O F I L E – 2 0 1 6 B U R N A B Y H O U S I N G P R O F I L E – 2 0 1 684 85
The Housing Fund supports affordable and/or special needs housing
through the provision of housing grants and the allocation of funding
to support other housing initiatives . The Housing Fund may be
used to support non-market housing operated by non-profit housing
organizations, with or without senior government funding, as well as
housing for people with special needs, such as physical or mental
disabilities or recovery from violence . It may also be used to support
guaranteed rental units, and price-controlled limited-equity units .
To date, the Community Benefit Bonus Policy and Housing Fund has
achieved:
• 19 affordable and/or special needs housing units in three
recent Brentwood Town Centre developments (Madison
Centre, Renaissance, and Brentwood Gate), with a density
bonus value of approximately $3 .9 million;
• Partnership agreement with BC Housing and private
developer for 181 non-market housing units at Cedar Place,
with a density bonus value of approximately $8 .5 million, to
include:
• 90 units of new non-market family housing on the
Southgate site
• 91 units of non-market seniors housing on existing
Cedar Place site
• $2 million in housing grants to five non-market housing
projects including:
• Canadian Legion 83, “Poppy Residence” (70 units)
• Dixon Transition Society, “Wenda’s Place” (9 units)
• Swedish Canadian Rest Home (64 units)
• Vancouver Resource Society (11 units)
• George Derby Care Society (122 units)
• Over $40 million saved in the Housing Fund for future
housing projects and initiatives .
The City supports a wide range of market housing through its
land use planning and zoning powers . It supports property values
by providing and maintaining a high level of local services, such
as public safety services, roads and sidewalks, parks, community
centres, recreational facilities, and other amenities . It also leverages
the value of market housing development to provide funding
for affordable housing initiatives and to encourage inclusion of
affordable market rental housing in development proposals . As a
municipal government supported by property tax dollars, Burnaby
does not provide funding for the development of privately owned
market housing .
FOR RENT
M A R K E T R E N TA L H O U S I N G
The City supports the development and retention of market
rental housing and enhances the rights of tenants impacted by
redevelopment . The City also maintains its own inventory of rental
properties, generally detached homes, which are rented on a month-
to-month basis, pending their need to support other Community
Plans and objectives . Specific policies that support market rental
housing development include:
Rental Conversion Control Policy
Adopted in 1974, this policy upholds a moratorium on the strata
conversion of existing multi-family purpose-built rental housing . The
purpose of this policy is to maintain rental housing opportunities .
Much of Burnaby’s purpose-built rental housing stock was built
between the 1950s and 1970s, at a time when Federal government
programs encouraged the construction of rental housing . The City
adopted the Rental Conversion Control Policy in order to hold this
rental stock for the life of the building .34
M A R K E T H O U S I N GP O L I C I E S A N D I N I T I AT I V E S
$40 +million
saved in the Housing Fund
Purpose Built
Rental
Strata Ownership
No Conversion

B U R N A B Y H O U S I N G P R O F I L E – 2 0 1 6 B U R N A B Y H O U S I N G P R O F I L E – 2 0 1 686 87
H O M E O W N E R S H I P
Through the OCP, Burnaby supports a range of housing types,
provides for adequate supply, and protects investment stability
by providing a high level of local services and amenities and by
maintaining the integrity of its land use plans when reviewing
development proposals .
One of the policies supported by the OCP is the area rezoning
policy, which allows homeowners to petition for higher density or
greater restrictions on building forms in their neighbourhoods .
This policy helps homeowners achieve neighbourhood character
and form objectives and /or financial benefits through provision of
additional residential lots or units, while increasing housing supply . It
can also enhance homeowner’s enjoyment of their neighbourhoods,
and preserve views and other features that impact community
livability .
In addition, Burnaby’s secondary rental policies, such as the
Secondary Suites Program and Flex-Suites Policy, provide financial
benefit to individual homeowners, offer the flexibility to meet
changing housing needs through different stages of life, and increase
rental housing stock .
Tenant Assistance Policy
This policy outlines the City’s minimum expectations when tenanted
buildings with six or more units are redeveloped through the
rezoning process . The policy requires that property owners who are
redeveloping a tenanted site submit a Tenant Assistance Plan that
exceeds the minimum requirements of the Provincial Residential
Tenancy Act . The policy includes the following guidelines to assist
tenants in the relocation process:
• a minimum of three months’ notice;
• a minimum compensation payment equivalent to three
months’ rent; and
• provision of information on other accommodation options for
tenants seeking to relocate in the area .
Tenant Assistance Plans are a prerequisite to rezoning approval for all
qualifying redevelopment proposals .35
Secondary Suites Program
The Secondary Suites Program, adopted in 2014, allows secondary
rental housing within a single family residence . Secondary suites offer
a range of affordability, with many units priced below other types of
market rental . They also offer renters the opportunity to live in single
family neighbourhoods without renting an entire house .36
Flex-Suites Policy
The Burnaby Zoning Bylaw permits accessory suites in multi-family
dwelling units in the P11 zone . This zone encompasses UniverCity, a
new Urban Village located adjacent to Simon Fraser University (SFU)
on Burnaby Mountain . This innovative zoning provides opportunities
for rental units within new strata buildings . Sometimes known as
“lock-off units,” these suites provide affordable housing for both
university students and those wishing to live near campus .37
Secondary Suites Program
B U R N A B Y H O U S I N G P R O F I L E – 2 0 1 6 B U R N A B Y H O U S I N G P R O F I L E – 2 0 1 688 89
HOUSING PROFILE
PART

B U R N A B Y H O U S I N G P R O F I L E – 2 0 1 6 B U R N A B Y H O U S I N G P R O F I L E – 2 0 1 690 91
The result of Burnaby’s history, its policies through the years, the
varying levels of government funding, and the other forces that
influence development is an inventory of housing that is constantly
in flux . This changing stock of detached homes, apartments,
townhouses, and other dwellings supports and reflects the
people that it houses . It also reflects the cost of housing and the
socioeconomic conditions that drive the housing market .
This section provides an overview of Burnaby’s demographics and
housing supply, in the following order:
• Demographics
• Population
• Household Characteristics
• Housing Tenure
• Housing Affordability
• Housing Costs
• Housing Inventory
• Non-Market Housing Supply
• Market Housing Supply
Charts, tables, and maps throughout the section illustrate selected
aspects of the data . Due to the availability of data, particularly
census information, this profile is an approximation of current
conditions . Future editions of this document will incorporate 2016
Canada Census statistics .
H O U S I N G P R O F I L E
B U R N A B Y H O U S I N G P R O F I L E – 2 0 1 6 B U R N A B Y H O U S I N G P R O F I L E – 2 0 1 692 93
D E M O G R A P H I C S
PA R T 4
Demographics reflect the characteristics of a population, such as
age, gender, household size, income, and family composition .
The following subsections provide an overview of Burnaby’s
demographics, particularly as they relate to housing .

B U R N A B Y H O U S I N G P R O F I L E – 2 0 1 6 B U R N A B Y H O U S I N G P R O F I L E – 2 0 1 694 95
P O P U L AT I O N
BC Stats estimates Burnaby’s population to have grown to 238,209 in
2015 .38 The rate of growth has remained relatively steady, averaging
8 .6% every 5 years, with the exception of rapid growth experienced
in the years between 1991 and 1996, when Burnaby’s population
increased by approximately 13% .39
Metro Vancouver’s population is forecasted to grow to 3 .4 million
residents by 2041 . Burnaby’s population is projected to grow by
nearly 125,000 people, to a total population of approximately
345,000 by 2041 .40 (See Figure 2)
Figure 2: Burnaby’s Population Growth and Projected Growth,
1981 - 2041
100,0001981
223,218
1986 1991 1996 2001 2006 2011 2016 2021 2026 2031 2036 2041
150,000
200,000
250,000
300,000
350,000
Population growth has generally been accommodated within
the four Town Centres . In recent years, the Town Centres have
experienced a population increase of 18,800 people between 2001
and 2011, or 64% of the population growth in Burnaby during those
years .42 (See Table 2)
Table 2: Population Growth in the Town Centres, 2001 - 2011
2001 2006 2011% change
2001 - 2011
Metrotown 24,065 24,885 25,835 1,770
Brentwood 4,008 5,818 10,516 6,508
Edmonds 16,813 20,936 25,146 8,333
Lougheed 13,128 13,079 15,301 2,173
TOTAL 58,014 64,718 76,798 18,784
Burnaby 193,954 202,799 223,218 29,264
TC % 30% 32% 34% 64%
Since 2001, Burnaby’s population distribution by age has remained
relatively stable . (See Figure 3) However, the proportion of school
aged children has decreased slightly and the proportion of adults
aged 45 to 64 has increased slightly .44
Figure 3: Population by Age, 2001 - 2011
0%
20%
40%
60%
80%
100%13% 14% 14%
65+
45 to 64
20 to 44
5 to 19
0 to 4
24% 26% 28%
41% 39% 38%
17% 16% 15%5% 5% 5%
2001 2006 2011
Burnaby’s EstimatedPopulation, 2015
238,209People
8.6%Average Population
Growth Rate / 5 Years
Source: Statistics Canada and Metro Vancouver41
Source: Statistics Canada43
Source: Statistics Canada45

B U R N A B Y H O U S I N G P R O F I L E – 2 0 1 6 B U R N A B Y H O U S I N G P R O F I L E – 2 0 1 696 97
The total population in each age category increased for all age
ranges, with the exception of school children aged 5 to 19 years old,
which remained stable . The greatest increase occurred in the adult
population aged between 20 and 65 . There was also a significant
increase of 19% in the number of seniors aged 65 and over, between
2001 and 2011 .46
With the exception of Metrotown, the proportion of seniors living in
Town Centres is lower than in Burnaby as a whole . The proportion of
children aged 19 years and younger is also lower in Town Centres,
with the exception of Edmonds .47 (See Figure 4)
Figure 4: Population by Age: Town Centres, 2011
0%
20%
40%
60%
80%
100%15% 11% 12%
65+
45 to 64
20 to 44
5 to 19
0 to 4
26%23%
27%
43% 52% 43%
11% 9% 13%5% 5% 5%
10%
27%
43%
14%
6%Metrotown Brentwood Lougheed Edmonds Burnaby
14%
28%
38%
15%
5%
H O U S E H O L D C H A R A C T E R I S T I C S
The number of persons per household varies within the City . For
Burnaby as a whole, the average household size was 2 .5 persons
in 2011 .49 In Town Centres, that number decreases to a low of 2 .0
persons per household in Brentwood, 2 .1 persons per household in
Metrotown, 2 .2 persons per household in Lougheed and 2 .4 persons
per household in Edmonds .50
Figure 5 shows the proportion of household size within each of the
Town Centres and Burnaby as a whole . The data demonstrates that
the Town Centres have a significantly higher share of one and two
person households than Burnaby overall .
Figure 5: Household Size by Town Centre, 2011
0%
20%
40%
60%
80%
100%1% 1% 3%
6+ persons
4-5 persons
3 persons
2 persons
1 person
10% 15% 15%15%
16% 19%
38%33%
32%
36% 35% 31%
1%10%
17%
34%
38%
Metrotown Brentwood Lougheed Edmonds Burnaby
4%
20%
18%
31%
27%
2.5Average People per
Household
5% 15% 38% 28% 14%Between the Ages of 0-4
Between the Ages of 5-19
Between the Ages of 20-44
Between the Ages of 45-64
Aged 65+
Burnaby’s Population by Age
Source: Statistics Canada48
Source: Statistics Canada51
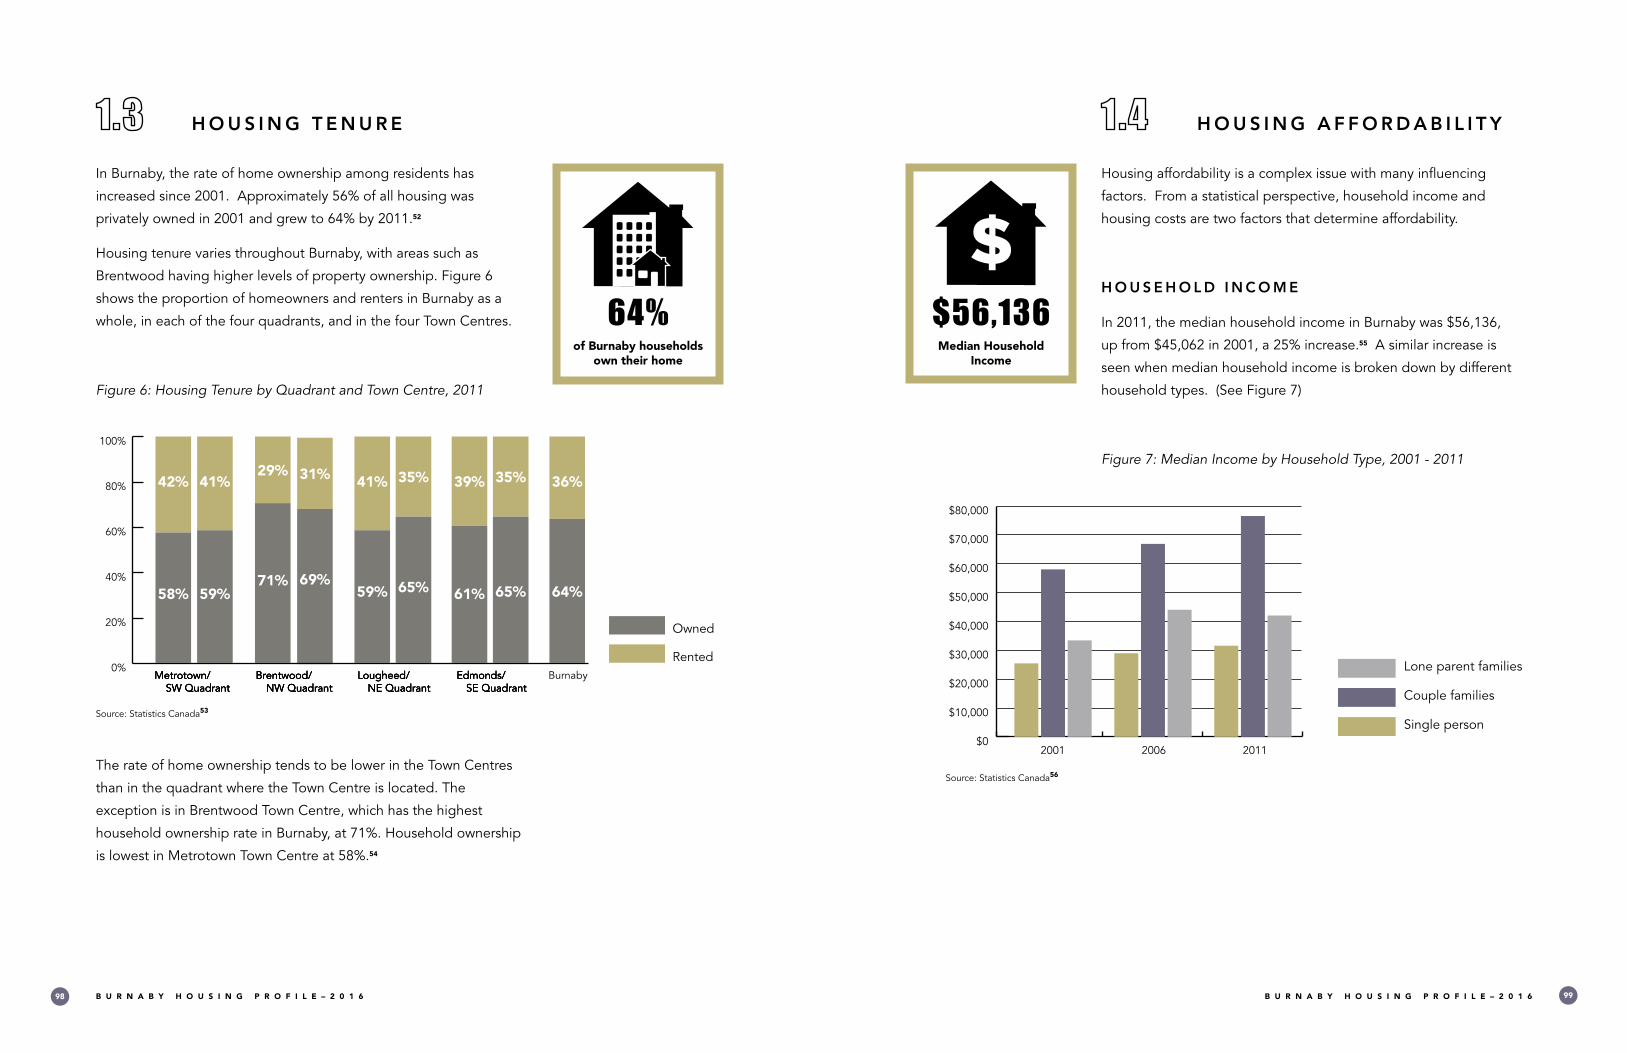
B U R N A B Y H O U S I N G P R O F I L E – 2 0 1 6 B U R N A B Y H O U S I N G P R O F I L E – 2 0 1 698 99
H O U S I N G T E N U R E
In Burnaby, the rate of home ownership among residents has
increased since 2001 . Approximately 56% of all housing was
privately owned in 2001 and grew to 64% by 2011 .52
Housing tenure varies throughout Burnaby, with areas such as
Brentwood having higher levels of property ownership . Figure 6
shows the proportion of homeowners and renters in Burnaby as a
whole, in each of the four quadrants, and in the four Town Centres .
Figure 6: Housing Tenure by Quadrant and Town Centre, 2011
0%
20%
40%
60%
80%
100%
Owned
Rented
42%
58%
31%
69%
29%
71%
41%
59%
41%
59%
35%
65%
39%
61%
35%
65%
36%
64%
Metrotown/ SW Quadrant
Metrotown/ SW Quadrant
Metrotown/ SW Quadrant
Metrotown/ SW Quadrant
Brentwood/ NW Quadrant
Brentwood/ NW Quadrant
Brentwood/ NW Quadrant
Brentwood/ NW Quadrant
Lougheed/ NE Quadrant
Lougheed/ NE Quadrant
Lougheed/ NE Quadrant
Lougheed/ NE Quadrant
Edmonds/ SE Quadrant
Edmonds/ SE Quadrant
Edmonds/ SE Quadrant
Edmonds/ SE Quadrant
Burnaby
The rate of home ownership tends to be lower in the Town Centres
than in the quadrant where the Town Centre is located . The
exception is in Brentwood Town Centre, which has the highest
household ownership rate in Burnaby, at 71% . Household ownership
is lowest in Metrotown Town Centre at 58% .54
64%of Burnaby households
own their home
H O U S I N G A F F O R D A B I L I T Y
Housing affordability is a complex issue with many influencing
factors . From a statistical perspective, household income and
housing costs are two factors that determine affordability .
H O U S E H O L D I N C O M E
In 2011, the median household income in Burnaby was $56,136,
up from $45,062 in 2001, a 25% increase .55 A similar increase is
seen when median household income is broken down by different
household types . (See Figure 7)
Figure 7: Median Income by Household Type, 2001 - 2011
Lone parent families
Couple families
Single person
2001 2006 2011$0
$10,000
$20,000
$30,000
$40,000
$50,000
$60,000
$70,000
$80,000
$56,136Median Household
Income
Source: Statistics Canada53
Source: Statistics Canada56
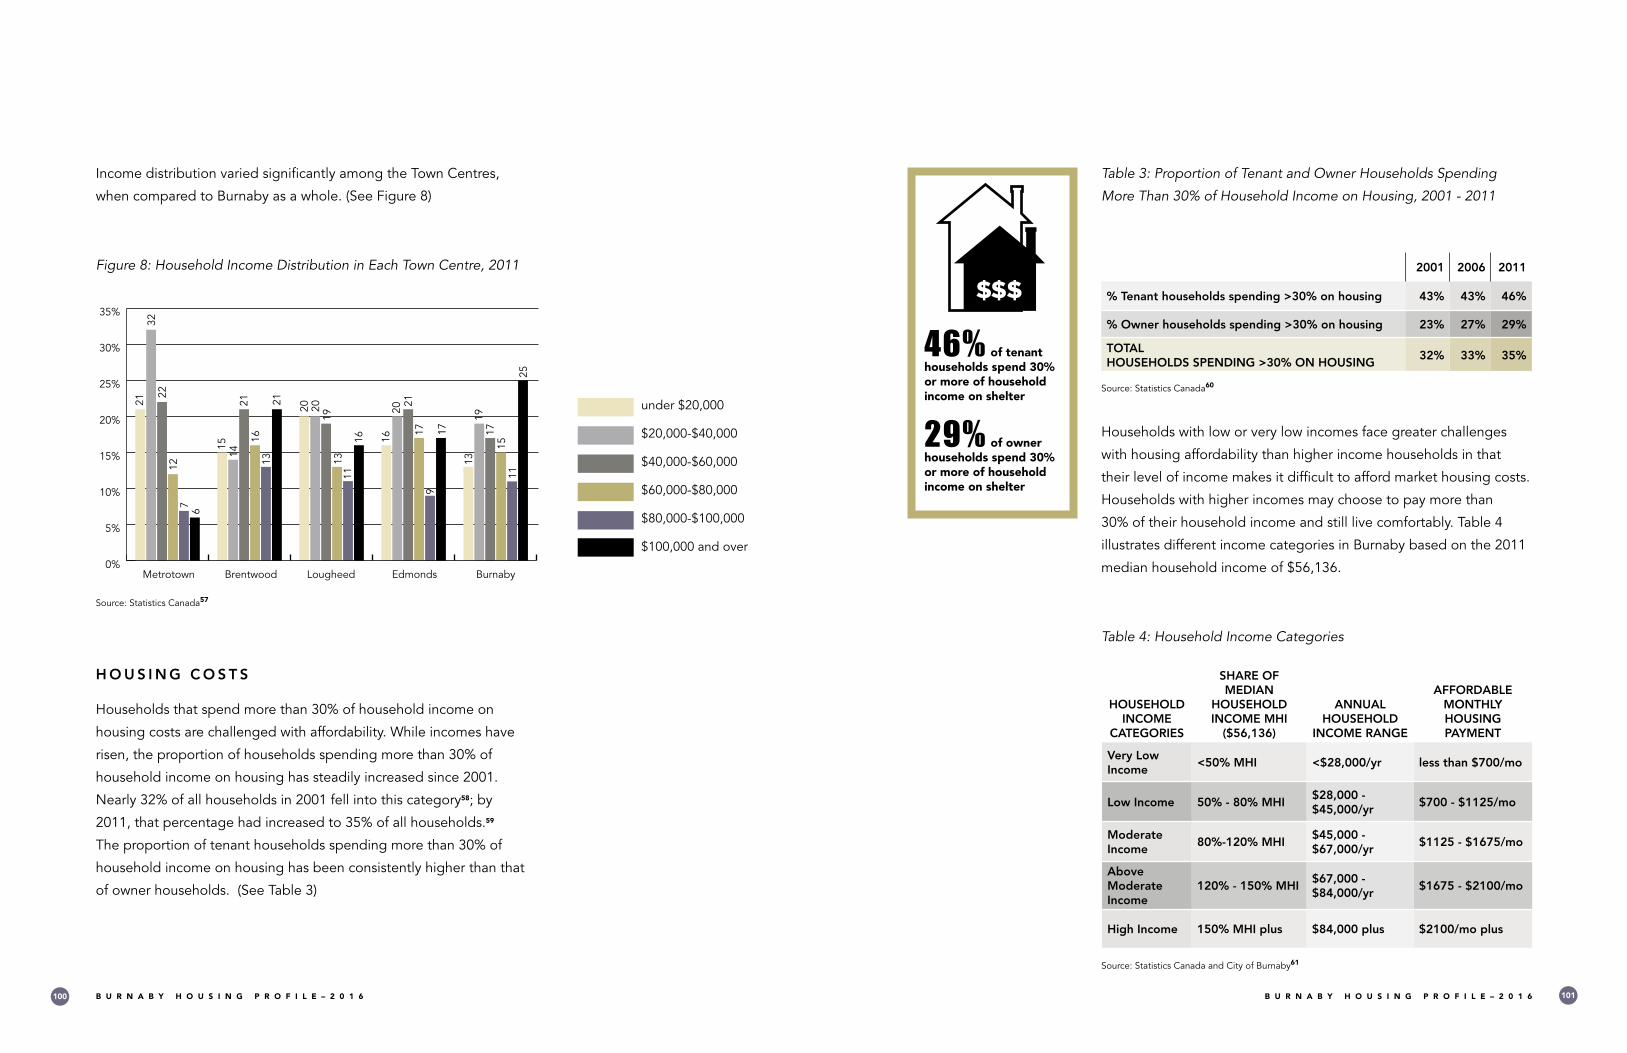
B U R N A B Y H O U S I N G P R O F I L E – 2 0 1 6 B U R N A B Y H O U S I N G P R O F I L E – 2 0 1 6100 101
Income distribution varied significantly among the Town Centres,
when compared to Burnaby as a whole . (See Figure 8)
Figure 8: Household Income Distribution in Each Town Centre, 2011
under $20,000
$20,000-$40,000
$40,000-$60,000
$60,000-$80,000
$80,000-$100,000
$100,000 and over
Metrotown Brentwood Lougheed Edmonds Burnaby0%
5%
10%
15%
20%
25%
2132
2212
7 6
1514
2116
1321
20 2019
1311
16 1620
2117
917
1319
1715
1125
30%
35%
H O U S I N G C O S T S
Households that spend more than 30% of household income on
housing costs are challenged with affordability . While incomes have
risen, the proportion of households spending more than 30% of
household income on housing has steadily increased since 2001 .
Nearly 32% of all households in 2001 fell into this category58; by
2011, that percentage had increased to 35% of all households .59
The proportion of tenant households spending more than 30% of
household income on housing has been consistently higher than that
of owner households . (See Table 3)
Table 3: Proportion of Tenant and Owner Households Spending
More Than 30% of Household Income on Housing, 2001 - 2011
2001 2006 2011
% Tenant households spending >30% on housing 43% 43% 46%
% Owner households spending >30% on housing 23% 27% 29%
TOTAL HOUSEHOLDS SPENDING >30% ON HOUSING
32% 33% 35%
Households with low or very low incomes face greater challenges
with housing affordability than higher income households in that
their level of income makes it difficult to afford market housing costs .
Households with higher incomes may choose to pay more than
30% of their household income and still live comfortably . Table 4
illustrates different income categories in Burnaby based on the 2011
median household income of $56,136 .
Table 4: Household Income Categories
HOUSEHOLD INCOME
CATEGORIES
SHARE OF MEDIAN
HOUSEHOLD INCOME MHI
($56,136)
ANNUAL HOUSEHOLD
INCOME RANGE
AFFORDABLE MONTHLY HOUSING PAYMENT
Very Low Income
<50% MHI <$28,000/yr less than $700/mo
Low Income 50% - 80% MHI$28,000 - $45,000/yr
$700 - $1125/mo
Moderate Income
80%-120% MHI$45,000 - $67,000/yr
$1125 - $1675/mo
Above Moderate Income
120% - 150% MHI$67,000 - $84,000/yr
$1675 - $2100/mo
High Income 150% MHI plus $84,000 plus $2100/mo plus
46% of tenant households spend 30% or more of household income on shelter
29% of owner households spend 30% or more of household income on shelter
Source: Statistics Canada57
Source: Statistics Canada and City of Burnaby61
Source: Statistics Canada60

B U R N A B Y H O U S I N G P R O F I L E – 2 0 1 6 B U R N A B Y H O U S I N G P R O F I L E – 2 0 1 6102 103
C O S T O F H O M E O W N E R S H I P
The Housing Price Index (HPI) provides a benchmark for the cost of
purchasing an average home within Metro Vancouver . The cost of an
average single detached unit in Burnaby has risen significantly since
2007, with a particular spike in the first half of 2016 .62 The cost of an
average multi-family unit has also increased but at a lower rate over
the same time period . (See Table 5)
Table 5: The HPI for Different Housing Structure Types in Burnaby,
July 2016
HOUSING TYPE HPI (July 2016)
Single detached $1,521,567
Semi-detached and Rowhouse $526,467
Apartment $515,400
Figure 9 illustrates the change in the cost of ownership by different
structure types between 2007 and July 2016 .
Single Family Home
$1,521,567
Semi-detached and Rowhouse
$526,467
Apartment
$515,400
Figure 9: Housing Price Index by Structure Type, 2007 - 2016
2007 2008 2009 2010 2011 2012 2013 2014 2015 July 2016$0
$500,000
$1,000,000
$1,500,000
$2,000,000
Single detached
Semi-detached and Rowhouse
Apartment
C O S T O F M A R K E T R E N TA L H O U S I N G
Canada Mortgage and Housing Corporation (CMHC) collects data
on rental rates for purpose-built market rental housing . These data,
which exclude secondary market rental units such as rented strata
units, generally reflect the lower end of market rental rates . As such,
they provide a benchmark for looking at trends in rental costs rather
than reflecting the true cost of renting .
The cost of market rentals has steadily increased in Burnaby over the
last 10 years . The median rental rate increased from $750 per month
in 2005 to $950 per month in 2015, a 26% increase .65 (See Figure 10)
FOR RENT
Burnaby’s 2015 Median Rental Rate
was
$950 per Month
Purchase Cost of an Average Home
in Burnaby
Source: Metro Vancouver63
Source: Metro Vancouver64
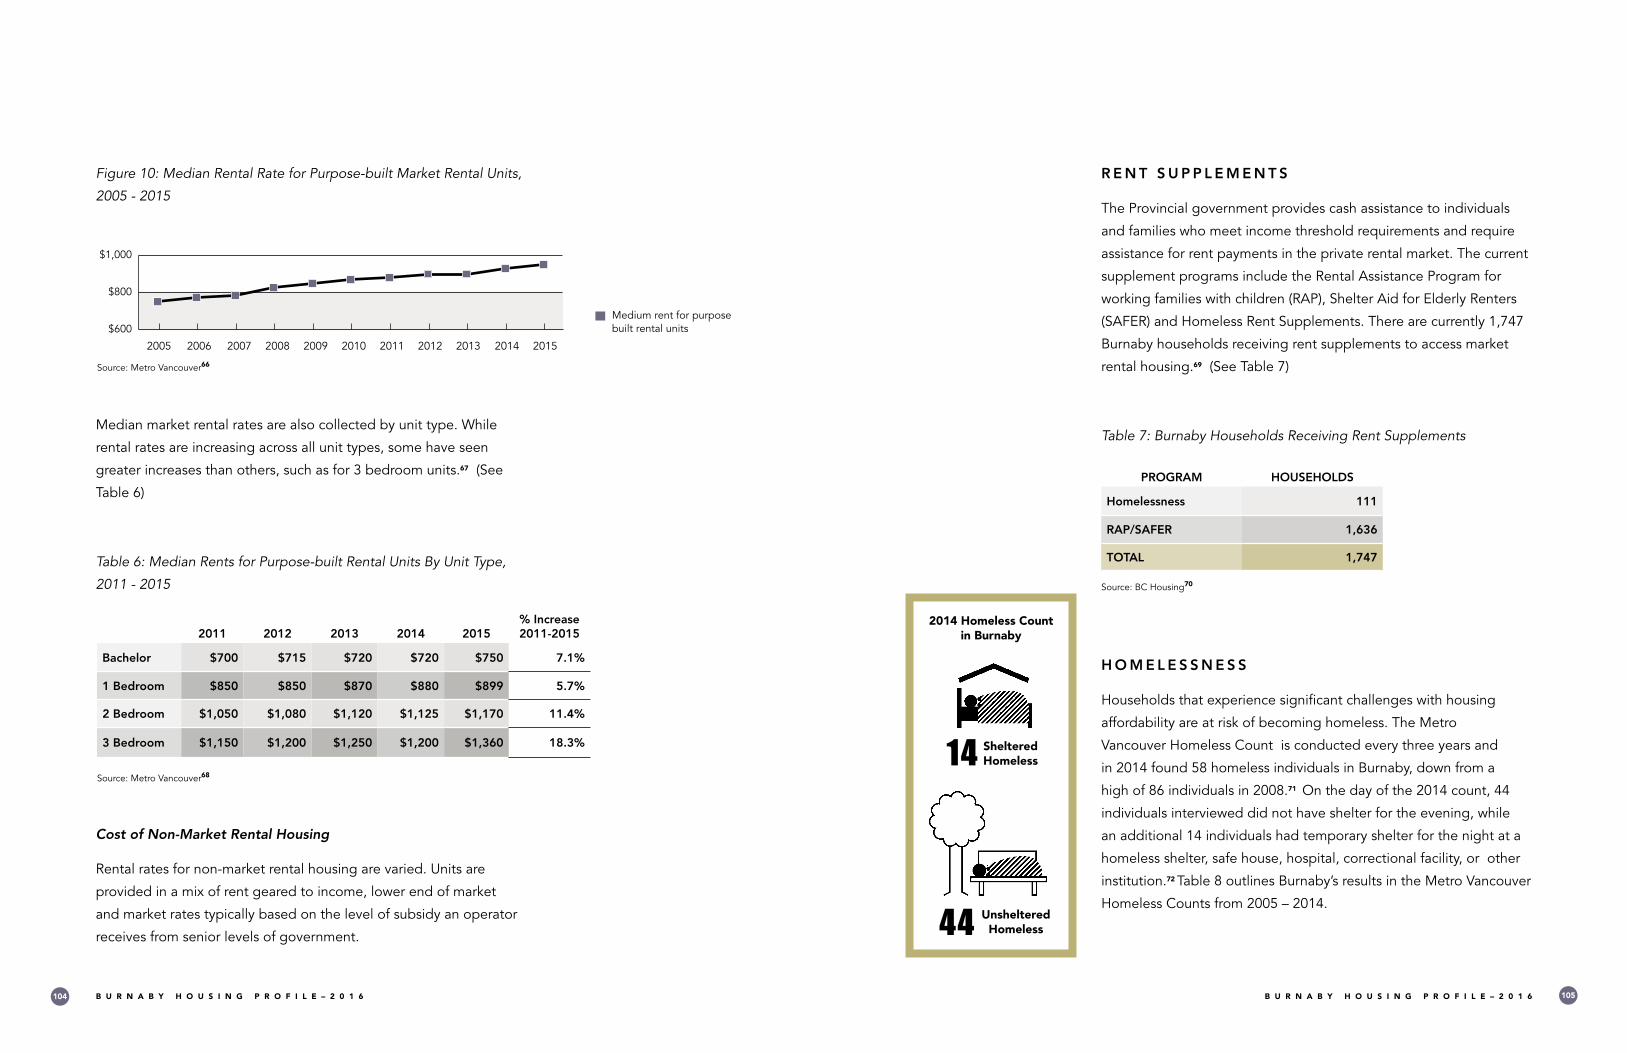
B U R N A B Y H O U S I N G P R O F I L E – 2 0 1 6 B U R N A B Y H O U S I N G P R O F I L E – 2 0 1 6104 105
Figure 10: Median Rental Rate for Purpose-built Market Rental Units,
2005 - 2015
2005 2006 2007 2008 2009 2010 2011 2012 2013 2014 2015
Medium rent for purpose built rental units $600
$800
$1,000
Median market rental rates are also collected by unit type . While
rental rates are increasing across all unit types, some have seen
greater increases than others, such as for 3 bedroom units .67 (See
Table 6)
Table 6: Median Rents for Purpose-built Rental Units By Unit Type,
2011 - 2015
Cost of Non-Market Rental Housing
Rental rates for non-market rental housing are varied . Units are
provided in a mix of rent geared to income, lower end of market
and market rates typically based on the level of subsidy an operator
receives from senior levels of government .
2011 2012 2013 2014 2015% Increase2011-2015
Bachelor $700 $715 $720 $720 $750 7.1%
1 Bedroom $850 $850 $870 $880 $899 5.7%
2 Bedroom $1,050 $1,080 $1,120 $1,125 $1,170 11.4%
3 Bedroom $1,150 $1,200 $1,250 $1,200 $1,360 18.3%
R E N T S U P P L E M E N T S
The Provincial government provides cash assistance to individuals
and families who meet income threshold requirements and require
assistance for rent payments in the private rental market . The current
supplement programs include the Rental Assistance Program for
working families with children (RAP), Shelter Aid for Elderly Renters
(SAFER) and Homeless Rent Supplements . There are currently 1,747
Burnaby households receiving rent supplements to access market
rental housing .69 (See Table 7)
Table 7: Burnaby Households Receiving Rent Supplements
PROGRAM HOUSEHOLDS
Homelessness 111
RAP/SAFER 1,636
TOTAL 1,747
H O M E L E S S N E S S
Households that experience significant challenges with housing
affordability are at risk of becoming homeless . The Metro
Vancouver Homeless Count is conducted every three years and
in 2014 found 58 homeless individuals in Burnaby, down from a
high of 86 individuals in 2008 .71 On the day of the 2014 count, 44
individuals interviewed did not have shelter for the evening, while
an additional 14 individuals had temporary shelter for the night at a
homeless shelter, safe house, hospital, correctional facility, or other
institution .72 Table 8 outlines Burnaby’s results in the Metro Vancouver
Homeless Counts from 2005 – 2014 .
ShelteredHomeless14
UnshelteredHomeless44
2014 Homeless Count in Burnaby
Source: Metro Vancouver66
Source: Metro Vancouver68
Source: BC Housing70
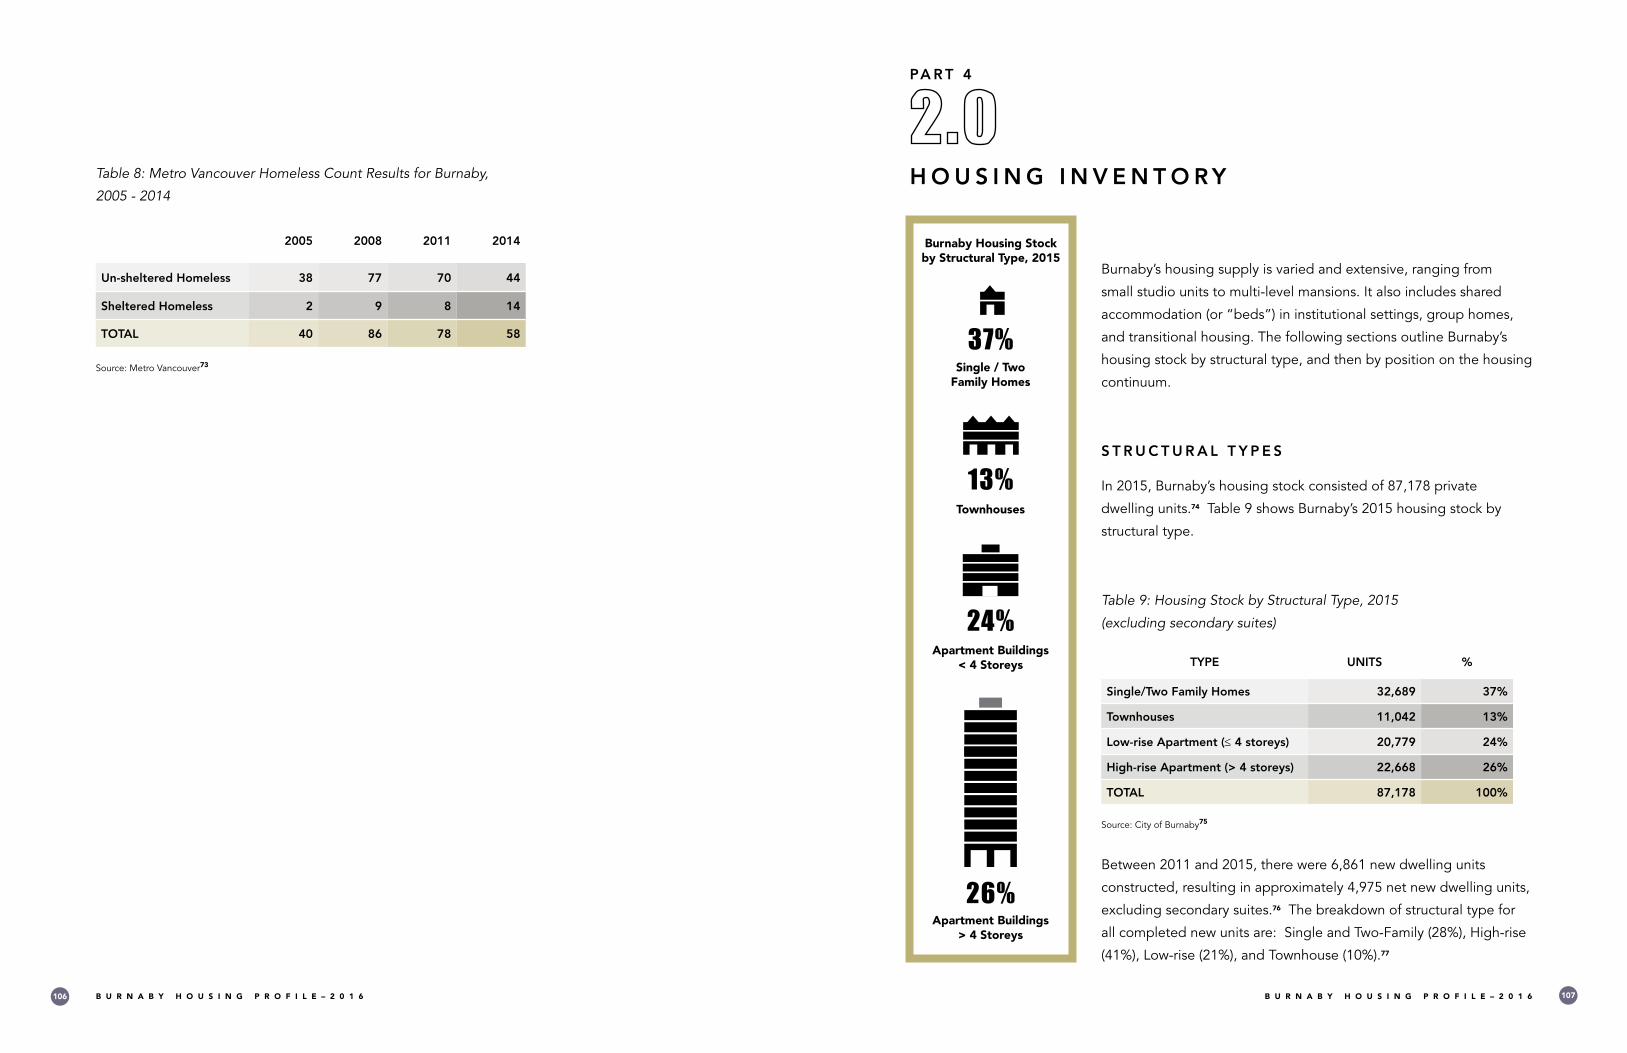
B U R N A B Y H O U S I N G P R O F I L E – 2 0 1 6 B U R N A B Y H O U S I N G P R O F I L E – 2 0 1 6106 107
H O U S I N G I N V E N T O R Y
PA R T 4
Burnaby’s housing supply is varied and extensive, ranging from
small studio units to multi-level mansions . It also includes shared
accommodation (or “beds”) in institutional settings, group homes,
and transitional housing . The following sections outline Burnaby’s
housing stock by structural type, and then by position on the housing
continuum .
S T R U C T U R A L T Y P E S
In 2015, Burnaby’s housing stock consisted of 87,178 private
dwelling units .74 Table 9 shows Burnaby’s 2015 housing stock by
structural type .
Table 9: Housing Stock by Structural Type, 2015
(excluding secondary suites)
TYPE UNITS %
Single/Two Family Homes 32,689 37%
Townhouses 11,042 13%
Low-rise Apartment (≤ 4 storeys) 20,779 24%
High-rise Apartment (> 4 storeys) 22,668 26%
TOTAL 87,178 100%
Between 2011 and 2015, there were 6,861 new dwelling units
constructed, resulting in approximately 4,975 net new dwelling units,
excluding secondary suites .76 The breakdown of structural type for
all completed new units are: Single and Two-Family (28%), High-rise
(41%), Low-rise (21%), and Townhouse (10%) .77
Single / Two Family Homes
37%
Townhouses
13%
Apartment Buildings < 4 Storeys
24%
Apartment Buildings > 4 Storeys
26%
Burnaby Housing Stock by Structural Type, 2015
Table 8: Metro Vancouver Homeless Count Results for Burnaby,
2005 - 2014
2005 2008 2011 2014
Un-sheltered Homeless 38 77 70 44
Sheltered Homeless 2 9 8 14
TOTAL 40 86 78 58
Source: Metro Vancouver73
Source: City of Burnaby75

B U R N A B Y H O U S I N G P R O F I L E – 2 0 1 6 B U R N A B Y H O U S I N G P R O F I L E – 2 0 1 6108 109
N E W C O N S T R U C T I O N
Figure 11 shows the total new units constructed by structural type
completed between 2011 and 2015 . The location of the units
constructed in 2015 are shown on Map 3 .
Figure 11: New Units Constructed by Structural Type, 2011 - 2015
2011 2012 2013 2014 20150
500
1,000
1,500
2,000
180
836
152
145
359 404
169
644
708
1,925
712
1,234
44
106
372371
104
176
659
1,310536
1,556
439
168
413
High-rise (> 4 storeys)
Low-rise (< 4 storeys)
Townhouse
Single/Two Family
Table 10: New Units Constructed by Structural Type, 2011 - 2015
Single/Two Family Townhouse
Low-rise (≤ 4 storeys)
High-rise (> 4 storeys)
YEARLY TOTAL
2011 359 145 152 180 836
2012 404 169 644 708 1,925
2013 372 106 44 712 1,234
2014 371 104 176 659 1,310
2015 413 168 439 536 1,556
TOTAL 1,919 692 1,455 2,795 6,861
Source: City of Burnaby, 2016.
Housing Type
High Rise
Low Rise
Townhouses
Single/Two FamilyDwellings
Map 3: Location and Structural Type of New Units Constructed, 2015
Source: City of Burnaby78
Source: City of Burnaby79
Source: City of Burnaby80

B U R N A B Y H O U S I N G P R O F I L E – 2 0 1 6 B U R N A B Y H O U S I N G P R O F I L E – 2 0 1 6110 111
The majority of new dwelling units in Burnaby have been built in
the four Town Centres . High-rise units continue to account for the
majority of these new units . Additional growth also occurred in other
growth areas of the City, including Urban Villages, Suburban Multi-
family and Mixed Use areas .
Historically, the predominant housing type in Burnaby has been
single and two family dwellings, which currently comprise 37% of
the total housing stock . The number and percentage of multi-family
units has been steadily increasing in recent years . Multi-family units
increased from 50,200 units in 2011 (61% of total residential units
in Burnaby) to 54,500 units in 2015 (63% of total residential units in
Burnaby) .81
U N D E R C O N S T R U C T I O N
As of July 2016, a total of 4,361 units were under construction .82
Figure 12 outlines these new housing units that are currently under
construction by structural type . The location of these units is shown
on Map 4 .
Figure 12: Residential Units Under Construction by Structural Type
(Building Permits Issued)
High-rise (> 4 storeys)
Low-rise (< 4 storeys)
Townhouse
Single/Two Family
5%
6%
13%
76%
oo
oo
oo
oo
oooooo oo oo
oo oooo
oo
oo oo
oo
oooo
oo oo
oo
oo
oo
oooo
oo
oo
oo
oo
oooo
oo
oooo
oo
oo
oo
oo
oo
oo
oooooo
oooo
oooo
oooooo
oo
oo
oooo
oo
oooo oo
oo
oo
oooo
oo
oo
oooo
oo
oo
oooo
oo
oo
oooo
oo
oooo
oo
oo
oooo oo oooooooo oo oooo
oooo oo
oo
oo oooooo
oo
oo
oo
oo oo
oo
oooo
oo
oo
oo
oo
oo
oo
oo
oooo
oooo
oooo
oo
oo
oooo
oo
oo
oo
oo oo
oooo
oo
oo
oo
oo
oo
oo
oooo
oo
oo
oo oo oo
oo
oooo
oo
oo
oooo
oo
oo
oooo
oo
oo
oo
oo
oo
oooo
oooo oooooooo
oo
oo
oooooo oo
oo
oo
oo
oo
oo
oo
oo
oo
oo
oo oo
oo
oo
oo
oo oooo oo oo oo
oooo
oo
oo
oo
oo oooooo
oo
oo oooo
oo
oo
oo
oo
oo
oooooo
oooo
oooo
oo
oo
oooo
oooo oooo
oooooo
oo
oooo
oooo oo
oo
oo oooo oooo oo oo oooo oo
oooo oooo oo
oooooooo oo
oo oo
oooo
oooooooo oooooooooo oo oooooooo
oo oooo
oooo
oo
oo
oo
oo
oo
oooooo
oo oo oooo
oo oo
oo
oo
oooo oo oooo
oo oooo
oooooo
oo
oo
oooo
oo
oo
oooo
oo
oo
oo
oo oo oo
oo
oo
oo oooo oo
oooo
oo
oooooo oo oooo
oooooo oo
oooo
oooooo
oooooo
oo
oooo
oo
oooooo
oo
oo
oo oo
oo
oo
oo
oooo oo
oooo
oo
oo
oo
oo
oooooo oo
oo
oo
oo
oooo
oo
oo
oo
oooo
oo
oo
oo
oo
oooo
oo
oo
oo
oo
oooo
oo
oo
oo
oooo
oooo
oo
oo
oo
oooo
oo
oo
oo
oo
oo
oo
oo oo
oo
oo
oo oooo
oo
oooo
oo
oo
oooooo
oooo
oo
oooo
oooooo
oo
oo
oo
oo
oo
oo
oooo
oo
oooo
oo
oo
oooo
oo oooo
oo
oo
oo
oo
oooo
oooo
oo
oo
oo
oooo
oo
oo
oooo
oo
oo
oo
oooooo
oo
oo
oooo
oo
oo
oooo
oo
oo
oo
oo
oo
oo
oo
oo
oo
oo
oooo
oo
oo
oo
oo
oo
oo
oooo
oo
oo
oo
oo
oo
oo
oooo
oo
oo
Source: City of Burnaby, 2016.
Housing Type
High Rise
Low Rise
Townhouses
Single/Two FamilyDwellings
Map 4: Location and Structural Type of New Units Under
Construction, 2016
Source: City of Burnaby83
Source: City of Burnaby84

B U R N A B Y H O U S I N G P R O F I L E – 2 0 1 6 B U R N A B Y H O U S I N G P R O F I L E – 2 0 1 6112 113
Non-market housing refers to housing that has ongoing government
subsidy, or generates sufficient revenue through rents, grants, and
donations that it is able to operate on a not-for-profit basis . This
housing supply provides an alternative to market rental housing
that is more affordable and/or provides needed services and
supports for populations with special housing needs . The following
sections outline different types of non-market housing that exist in
Burnaby . At the end of this section, Map 5 illustrates the location
of non-market housing in Burnaby . A list of existing non-market
developments is contained in Part 7 - Appendix 1.0 .
E M E R G E N C Y S H E LT E R S
The Lookout Emergency Aid Society operates an Extreme Weather
Shelter that temporarily provides emergency shelter beds during
extreme weather conditions that threaten the safety and health of
homeless individuals in Burnaby . For the 2015-2016 winter season
the extreme weather shelter was open for 33 nights and provided
shelter to 191 individuals (162 men and 29 women) .85 There is not
currently a permanent emergency shelter in Burnaby .
T R A N S I T I O N A L H O U S I N G
Transitional housing provides temporary housing with a variety of
supports and is intended to aid in the transition from homelessness,
or risk of homelessness, to independent living in permanent homes .
Transitional housing facilities in Burnaby specifically support women
N O N - M A R K E TH O U S I N G I N V E N T O RY
and children fleeing violence; youth in transition; women involved
in the justice system; individuals with mental illness; and those
recovering from drug or alcohol addiction . (See Table 11)
Table 11: Transitional Housing Facilities in Burnaby
RESIDENCE TYPE FACILITIES UNITS BEDS
Women and Children 3 9 15
Drug and Alcohol Recovery 1 15
Mental Health 1 3
Youth 1 6
TOTAL 6 9 38
H O U S I N G W I T H S U P P O R T S
This broad category includes a number of housing types that provide
support services for residents with special needs . These include
group homes in single family residences, institutional long-term
care facilities, assisted living residences, and supportive housing for
seniors .
Community Care Facilities
• Group Homes are smaller residences, typically located in
single- or two-family dwellings, that are licensed by Fraser
Health as community care facilities and provide a high level
of care to the residents . There are 40 licensed group homes
On 33 Nights the Extreme Weather
Shelter was Open
6 Facilities
9 Units
Transitional Housing in Burnaby
38 Beds
Source: City of Burnaby86
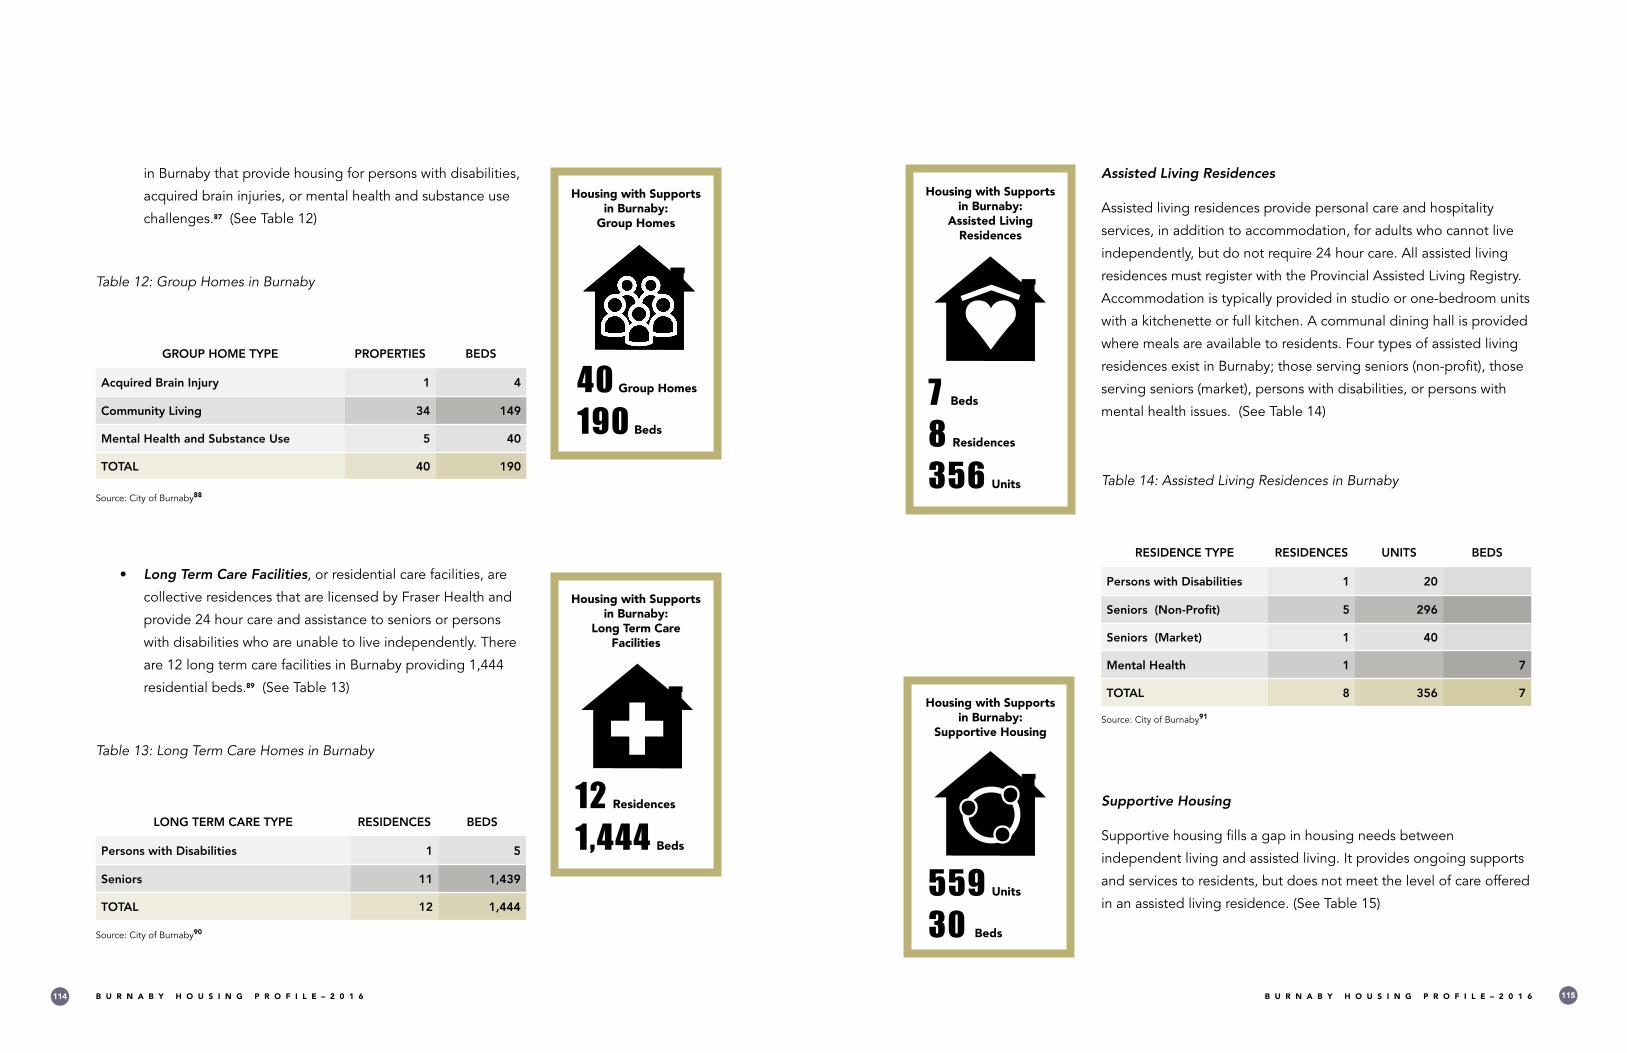
B U R N A B Y H O U S I N G P R O F I L E – 2 0 1 6 B U R N A B Y H O U S I N G P R O F I L E – 2 0 1 6114 115
in Burnaby that provide housing for persons with disabilities,
acquired brain injuries, or mental health and substance use
challenges .87 (See Table 12)
Table 12: Group Homes in Burnaby
GROUP HOME TYPE PROPERTIES BEDS
Acquired Brain Injury 1 4
Community Living 34 149
Mental Health and Substance Use 5 40
TOTAL 40 190
• Long Term Care Facilities, or residential care facilities, are
collective residences that are licensed by Fraser Health and
provide 24 hour care and assistance to seniors or persons
with disabilities who are unable to live independently . There
are 12 long term care facilities in Burnaby providing 1,444
residential beds .89 (See Table 13)
Table 13: Long Term Care Homes in Burnaby
LONG TERM CARE TYPE RESIDENCES BEDS
Persons with Disabilities 1 5
Seniors 11 1,439
TOTAL 12 1,444
Assisted Living Residences
Assisted living residences provide personal care and hospitality
services, in addition to accommodation, for adults who cannot live
independently, but do not require 24 hour care . All assisted living
residences must register with the Provincial Assisted Living Registry .
Accommodation is typically provided in studio or one-bedroom units
with a kitchenette or full kitchen . A communal dining hall is provided
where meals are available to residents . Four types of assisted living
residences exist in Burnaby; those serving seniors (non-profit), those
serving seniors (market), persons with disabilities, or persons with
mental health issues . (See Table 14)
Table 14: Assisted Living Residences in Burnaby
RESIDENCE TYPE RESIDENCES UNITS BEDS
Persons with Disabilities 1 20
Seniors (Non-Profit) 5 296
Seniors (Market) 1 40
Mental Health 1 7
TOTAL 8 356 7
Supportive Housing
Supportive housing fills a gap in housing needs between
independent living and assisted living . It provides ongoing supports
and services to residents, but does not meet the level of care offered
in an assisted living residence . (See Table 15)
12 Residences
1,444 Beds
Housing with Supports in Burnaby:
Long Term Care Facilities
7 Beds
8 Residences
356 Units
Housing with Supports in Burnaby:
Assisted Living Residences
559 Units
30 Beds
Housing with Supports in Burnaby:
Supportive Housing
40 Group Homes
190 Beds
Housing with Supports in Burnaby:
Group Homes
Source: City of Burnaby88
Source: City of Burnaby90
Source: City of Burnaby91

B U R N A B Y H O U S I N G P R O F I L E – 2 0 1 6 B U R N A B Y H O U S I N G P R O F I L E – 2 0 1 6116 117
Table 15: Supportive Housing in Burnaby
SUPPORTIVE HOUSING TYPE UNITS BEDS
Seniors (Market) 381
Seniors (Non-Profit) 178
Persons with Disabilities 20
Mental Health and Homelessness 10
TOTAL 559 30
N O N - M A R K E T R E N TA L H O U S I N G
Non-market rental housing without supports typically consists
of purpose-built rental apartments or townhouse units, in which
households live independently . This type of housing falls into three
main categories:
• Public housing, which is owned and operated by a
government agency;
• Non-profit housing, which is operated by non-profit
organizations, usually with government funding; and,
• Cooperative housing, which is a type of non-profit housing
that is membership based and is able to provide subsidies
through Federally supported operating agreements .
Public housing and non-profit housing, which share many
characteristics, are discussed together below, followed by
cooperative housing .
NEW NON-MARKET
RENTAL PROJECTS
The following new non-
market development
projects are in the
rezoning process or are
under construction but
not yet complete and
are not included in the
inventory:
Building Permits in
progress:
• Derby Manor, 7550
Cumberland St, 122
seniors supportive
housing units
• Teatro (former
Dolphin Cinema
site) 4551 Hastings
St, 11 accessible
units for persons
with disabilities
Non-Profit Housing and Public Housing
In Burnaby, non-profit housing is operated by a variety of non-profit
societies; public housing is operated by the Provincial government
through BC Housing . These housing developments provide rental
units for independent living and offer a mix of subsidized and low-
end of market rents .
There are 3,408 non-market rental units in 57 developments across
Burnaby .93 This housing stock is comprised of 2,656 units of non-
profit housing and 752 units of public housing . It includes a mix of
apartment and townhouse developments and offers a range of unit
sizes . Over 70% of non-profit and public housing is located in the
southern quadrants of Burnaby, with nearly half of the units in the
southeast quadrant .
Demand for non-profit and public housing is greater than the current
supply . BC Housing maintains a waitlist of households seeking
subsidized units within the non-profit and public housing supply . In
2015, there were 1,199 Burnaby households on the BC Housing
waitlist .94
Cooperative Housing
Cooperative housing is another form of housing operated on a
not-for-profit basis that offers affordable housing to members of a
cooperative . The member-based cooperative owns and operates
the housing development and is responsible for all maintenance
of its buildings . Members are required to buy a membership in
the cooperative to become a resident and pay a monthly housing
fee, which is used to pay for the operation and maintenance of the
development .
Burnaby has 1,900 cooperative units in 26 developments; the
second largest supply of cooperative housing in Metro Vancouver .95
Cooperative housing units in Burnaby can be apartment or
1,900Total Co-op Units in
Burnaby
3,408Total Non-Profit and
Public Housing Units in Burnaby
Source: City of Burnaby92

B U R N A B Y H O U S I N G P R O F I L E – 2 0 1 6 B U R N A B Y H O U S I N G P R O F I L E – 2 0 1 6118 119
townhouse units depending on the development . There is high
demand for cooperative housing and many individual cooperatives
maintain a waitlist of people wishing to become members and live
in one of the cooperative housing developments . The majority of
cooperative units are located in Burnaby’s northeast quadrant .
� �
�
�
�
�
�
�
�
�
�
�
�
�
� �
�
�
� �
�
�
�
�
�
�
�
� � �
�
�
�
� �
�
� �
�
�
�
�
�
�
�
�
�
�
�
�
�
�
�
� �
�
�
� �
�
�
�
�
�
�
�
�
�
�
�
�
�
�
�
�
�
�
�
�
�
�
� � � � � � � �
�
�
�
�
�
�
� � �
�
�
�
�
� �
� �
�
� � � �
�
� �
�
�
�
� �
�
�
� �
� �
�
�
�
�
�
�
�
�
� �
�
�
Non Profit HousingDevelopments
Public HousingDevelopments
Cooperative HousingDevelopments
Assisted Living Residences
Group Homes
Long Term Care Facilities
Supportive Housing
Transitional Housing
Note: Some locations withheldat operator’s requestSource: City of Burnaby, 2016.
Map 5: Location of Non-Market Housing in Burnaby
Source: City of Burnaby96

B U R N A B Y H O U S I N G P R O F I L E – 2 0 1 6 B U R N A B Y H O U S I N G P R O F I L E – 2 0 1 6120 121
There are two forms of market housing: Market Ownership and
Market Rental . Market housing is owned by private individuals or
companies rather than government or non-profit entities . The cost
of market housing is influenced by factors related to supply and
demand .
FOR RENT
M A R K E T R E N TA L H O U S I N G
Market rental housing is an important part of the housing continuum
and is made up of several different components that serve diverse
groups of Burnaby residents . Market rental housing is comprised of:
• Primary market rental: Secured, purpose-built market rental
units under single ownership; and,
• Secondary market rental: Unsecured rental units that
individual homeowners choose to rent to tenants .
Demand for market rental housing remains high, as indicated by
continued low vacancy rates . As the City grows, demand for a
diverse rental housing supply is expected to remain .
It is estimated that Burnaby’s stock of market rental housing is
comprised of approximately 32,400 units .97 This rental housing stock
includes single family dwellings (10%), secondary suites (22%), two
family (duplex) dwellings (3%), multi-family purpose-built rental units
(38%) and multi-family strata rental units (27%) .98 (See Table 16)
NEW PURPOSE-BUILT
RENTAL PROJECTS
Three new purpose-built
market rental buildings
are in the process of
development:
Rezoning pending:
• 238 unit tower to
be added to the
existing 254 unit
tower at 4769 and
4758 Hazel Street
• 21 unit apartment
building with
ground floor
commercial at 3700
Hastings Street
Under construction:
• 300 unit tower
component at 4567
Lougheed Highway
in Brentwood
M A R K E T H O U S I N G I N V E N T O RY
Table 16: Estimate of Market Rental Housing Stock, 2015
RENTAL HOUSING TYPEESTIMATED
RENTAL UNITS % OF TOTAL
Single Family Dwelling 3,100 10%
Secondary Suites 7,000 22%
Two Family Dwelling / Townhouse 1,000 3%
Purpose-Built Rental 12,400 38%
Multi-Family Strata (Rented) 8,900 27%
TOTAL ESTIMATED UNITS 32,400 100%
Single and Two Family Dwellings
At the end of 2015, there were approximately 28,000 single family
dwellings in the City .100 It is estimated that 3,100 of these single
family dwelling units were rented .
In 2015, there were approximately 4,700 two family dwellings in the
City .101 It is estimated that 1,000 of these two family dwellings were
occupied by renters .
Secondary Suites
Since 2014, the Zoning Bylaw has permitted secondary suites in all
single family dwellings . BC Assessment estimates that there are over
7,000 secondary suites in Burnaby .102
Since 2014:
• 359 new secondary suites have been completed;
• 515 secondary suites are in the building permit process; and
• 523 licensed in-law suites grandfathered under the previous
program .103
22% Secondary Suites
3% Two-Family / Townhouse
38% Purpose-Built
Rental
27% Multi-Family Strata
(Rented)
10% Single Family Home
Burnaby’s Rental Stock
Source: City of Burnaby99

B U R N A B Y H O U S I N G P R O F I L E – 2 0 1 6 B U R N A B Y H O U S I N G P R O F I L E – 2 0 1 6122 123
Purpose-Built Rental
Burnaby has the second largest supply of purpose-built rental
housing in Metro Vancouver, comprised of 12,400 units .104 Purpose-
built rental housing is secured for use as rental for the lifetime of the
building . The stock of purpose-built rental housing is aging, making
it attractive for building owners to redevelop these properties . Figure
13 shows the breakdown of purpose-built rental stock by decade of
construction . The City’s purpose-built rental housing stock is:
• primarily located in the City’s four Town Centres (76%); and,
• mainly located in south Burnaby, with over 54% located in
the southwest quadrant .105
Figure 13: Purpose-built Rental Units by Decade of Construction
0
1000
2000
3000
4000
5000
6000
7000
8000
< 1950 1951-1960
1961-1970
1971-1980
1981-1990
1991-2000
2001-2010
2011-2015
129
1,364
7,150
3,560
162 22 0 7
The majority of purpose-built rental housing is among the oldest
housing in the City . Most of this housing was built between 1951
and 1980 .107
FOR RENT
Burnaby has Approximately
12,400Purpose-Built Rental
Units
N O R T H W E S T
Brentwood
Lougheed
Edmonds
Metrotown
N O R T H E A S T
S O U T H W E S T
S O U T H E A S T
76%of the Purpose-Built
Rental Units are located in Town Centres
Between 2011 and 2015, a total of 18 demolition permits involving
365 purpose-built rental units were issued; 309 of these rental units
were located in Metrotown .108 It is noted, however, that these sites
have since been developed to create a total of 1,558 new strata
units added to the City’s housing stock .109 It is estimated that 25% of
these (390 units) will be utilized as secondary market rental units .
Multi-Family Strata Rental
Burnaby currently has over 35,000 multi-family residential strata
units .110 The percentage of stratified units that are rented to tenants
is conservatively estimated at 25%, or approximately 8,900 strata
rental units in the City .111 Multi-family rental strata housing is:
• evenly distributed across the four quadrants: NW (20%), NE
(25%), SW (31%), SE (24%);
• primarily located in the Town Centres (73%); and,
• newer than the purpose-built rental housing stock .112
H O M E O W N E R S H I P
The 2011 National Household Survey indicated that 64% of
Burnaby’s private households own their home .113
64%of Burnaby’s
households own their homeSource: City of Burnaby106

B U R N A B Y H O U S I N G P R O F I L E – 2 0 1 6 B U R N A B Y H O U S I N G P R O F I L E – 2 0 1 6124 125
HOUSING ACTIONS
PART

B U R N A B Y H O U S I N G P R O F I L E – 2 0 1 6 B U R N A B Y H O U S I N G P R O F I L E – 2 0 1 6126 127
H O U S I N G A C T I O N S
Policies come to life when they are put into action . Burnaby’s
housing actions are numerous and diverse, ranging from the day-
to-day processing of secondary suite applications to the granting
of multi-million dollar Housing Fund requests for the construction
of non-market housing . The result of these actions can be seen
around the City, in the many forms of housing that make up the City’s
inventory .
This part includes three sections that highlight Burnaby’s housing
policies in action:
• Part 5 - Section 1.0 outlines many of the actions that
Burnaby is undertaking now - or in the near future - including
major reviews and ongoing work .
• Part 5 - Section 2.0 reviews Burnaby’s housing advocacy
efforts, an ongoing pursuit that has brought needed changes
from senior levels of government and has raised awareness
and support among fellow local governments . This summary
of resolutions, letters, and reports chronicles the City’s
position, through the years, on important housing issues .
• Part 5 - Section 3.0 provides case studies showing the types
of developments that the City’s housing policies support .
These include non-market rental housing, special needs
housing, and market rental housing developments in a
variety of locations .

B U R N A B Y H O U S I N G P R O F I L E – 2 0 1 6 B U R N A B Y H O U S I N G P R O F I L E – 2 0 1 6128 129
The City, in addition to the ongoing implementation of the policies
outlined in this report, is undertaking a number of housing actions .
These include:
• Official Community Plan Update: The Burnaby Official
Community Plan (OCP) was adopted in 1998 . Under the
Metro Vancouver Regional Growth Strategy (2011) and
the City’s Regional Context Statement (2013), the City has
committed to updating the OCP . This update will include
review of the City’s Residential Land Use Framework, as well
as other policies and directions related to housing .
• Sustainability Strategies: In recent years, the City has
adopted two sustainability strategies, the Economic
Development Strategy (2007) and the Social Sustainability
Strategy (2011) . A third strategy, the Environmental
Sustainability Strategy, is in final draft form and is expected
to be completed in late 2016 . All three strategies address
different aspects of providing housing within Burnaby . These
strategies influence housing actions and will inform the
development of an updated OCP .
• Burnaby Housing Strategy: Under the Metro Vancouver
Regional Growth Strategy, the Regional Affordable Housing
Strategy, and the City’s Regional Context Statement, the
City has committed to creating a ‘Housing Action Plan’ to
demonstrate how the City plans to address local priorities
for housing supply, diversity, and affordability . This Plan will
be developed in the future in conjunction with the Official
Community Plan update .
W O R K I N G T O W A R D S T H E F U T U R E
PA R T 5
B U R N A B Y H O U S I N G P R O F I L E – 2 0 1 6 B U R N A B Y H O U S I N G P R O F I L E – 2 0 1 6130 131
• Review of Community Plans: The City undertakes reviews
of Community Plans to manage growth and continue to build
complete communities .
• Rezoning and Development Processes: Through each
rezoning and development process, staff work with property
owners to achieve a mix of housing unit types and encourage
a mix of tenures .
• Community Benefit Bonus Policy / Housing Fund: Through
this density bonusing policy/program, the City will continue
to create additional affordable and/or special needs housing
units and cash contributions-in-lieu for the Housing Fund .
The Housing Fund will continue to provide grants that help
to reduce the costs of constructing new affordable and/or
special needs housing .
• Secondary Suites: The City will add to its growing inventory
of secondary suites by continuing to assist homeowners
who wish to construct suites in new homes, or renovate an
existing home to include a suite .
• City Lands Program for Non-Market Housing: The City
will continue the selection process for development of non-
market housing at the initial two sites (3802 Hastings Street
and 7898 Eighteenth Avenue), with the goal of finalizing
selection in early 2017 .
• Research: The City is continuing to research Burnaby’s
housing profile to better understand the needs and gaps
within the City’s housing stock, as demonstrated in this
report .
• Partnerships: The City continues to work with other levels
of government, non-profits, the development industry,
and other agencies to achieve housing for vulnerable
populations .
• Advocacy: The City continues to advocate to higher levels
of government and seek new methods, regulations and
partnerships to encourage the development and protection
of affordable and/or special needs housing in the City . More
information on Burnaby’s advocacy efforts can be found in
the following section .

B U R N A B Y H O U S I N G P R O F I L E – 2 0 1 6 B U R N A B Y H O U S I N G P R O F I L E – 2 0 1 6132 133
The City continues to advocate for the development and protection
of affordable and/or special needs housing in the City . The following
tables outline many the City’s advocacy efforts to-date, including
UBCM resolutions, FCM resolutions, letters, as well as reports and
motions .
B U R N A B Y ’ S H I S T O R Y O F A D V O C A C Y
PA R T 5

B U R N A B Y H O U S I N G P R O F I L E – 2 0 1 6 B U R N A B Y H O U S I N G P R O F I L E – 2 0 1 6134 135
2008 Development of new rental housing
Provincial and Federal Governments
Urge federal and provincial governments to work together to prepare National and Provincial Housing Strategies and address housing and homelessness issues over the long term through the provision of an adequate continuum of housing, income and support; to allocate funding to support the development and maintenance of affordable housing, including non-market housing units; and to establish incentives for the private sector construction of new rental housing.
Endorsed by UBCM
2009 Payment of development cost charges for non-profit housing
Provincial Government
Recommend amendment to the Local Government Act to permit the deferral of development cost charges for non-profit housing projects.
Endorsed by UBCM
2013 Subsidies, rent supplements and other supports for operating agreements with social housing
Federal Government
Call to assess, examine, and renew the subsidy, rent supplements, or other supports for operating agreements set to expire; and collaborate with provincial, territorial and municipal governments, and non-profit housing providers and other housing stakeholders to ensure the viability and sustainability of all social housing stock through a national action plan on housing for Canada.
Endorsed by UBCM
2014 Subsidies, rent supplements and other supports for operating agreements with social housing
Federal Government
Endorse the FCM housing campaign “Fixing Canada’s Housing Crunch,” and urge the minister of employment and social development to develop a long-term plan for housing that puts core investments on solid ground, increases predictability, protects Canadians from the planned expiry of $1.7 billion in social housing agreements and ensures a healthy stock of affordable rental housing for Canadians.
Endorsed by UBCM
2016 National Housing Strategy
Federal Government
Urge the federal government to expedite the development of a National Housing Strategy.
Endorsed by UBCM
2016 Tenant Assistance Provincial Government
Urge the provincial government to amend the Residential Tenancy Act to include an improved and standardized approach to tenant assistance, particularly in relation to tenancy dissolution and/or relocation as a result of building demolition.
Endorsed by UBCM
U B C M R E S O L U T I O N S
DATE SUBJECT TO DESCRIPTION OUTCOME
1988 Property maintenance standards for residential rental buildings
Ministry of Municipal Affairs, Recreation and Culture
A request to amend the Municipal Act to authorize municipalities to enact bylaws establishing the regulation of minimum standards of property maintenance for residential rental buildings occupied by tenants.
Not Endorsedby UBCM
1990 Standards of maintenance and occupancy for buildings and sites
Provincial Government
A petition to amend the Municipal Act to provide municipalities with the authority to enact a Standards of Maintenance Bylaw similar to what the City of Vancouver is enabled to do under the Vancouver Charter.
Endorsed by UBCM
1990 Development of rental housing
Ministry of Municipal Affairs, Recreation and Culture
A request to amend the Municipal Act to authorize municipalities to enact land use legislation to regulate residential rental tenure through zoning and other measures.
Endorsed by UBCM
1992 Community care facilities and database of established facilities
Provincial Government
Request for appropriate ministries to consult with local governments on plans to establish group homes and other community based residential facilities; and assistance from provincial government to develop and maintain a comprehensive database on group homes, foster homes, and other community based residential developments throughout B.C.
Endorsed by UBCM
2000 Replacement of affordable housing
Provincial Government
Request to amend the Local Government Act to authorize municipalities to levy a development cost charge for replacement affordable housing as deemed necessary by local governments.
Endorsed by UBCM
2007 Development of new rental housing
Provincial Government
Request to amend the Local Government Act to authorize local governments to enact land use regulations that would regulate residential rental tenure through zoning and other measures.
Endorsed by UBCM
Source: UBCM114

B U R N A B Y H O U S I N G P R O F I L E – 2 0 1 6 B U R N A B Y H O U S I N G P R O F I L E – 2 0 1 6136 137
F C M R E S O L U T I O N S
DATE SUBJECT TO DESCRIPTION OUTCOME
2014 Subsidies, rent supplements and other supports for operating agreements with non-profits
Federal Government
Call on the federal government, through the Federation of Canadian Municipalities and other avenues as appropriate, to assess, examine, and renew the subsidy, rent supplements, or other supports for operating agreements set to expire; and to collaborate with provincial, territorial and municipal governments, and non-profit housing providers and other housing stakeholders to ensure the viability and sustainability of all social housing stock through a national action plan on housing for Canada.
Adopted
2015 Rental assistance for Housing Cooperatives
Provincial and Federal Governments
Urge the federal and provincial governments to work together to reduce the uncertainty for vulnerable members of housing cooperatives by ensuring that long-term, cost-shared rental assistance programs are in place as federal cooperative housing agreements expire.
Adopted
L E T T E R S
DATE SUBJECT TO DESCRIPTION
2004 Continued Funding for National Homelessness Initiative
Federal Minister of Labour and Housing
Request to continue funding for the National Homeless Initiative beyond its 2006 end date.
2006 May 16
Condition and maintenance of purpose built rental building and review of Residential Tenancy Branch processes
Provincial Government
Request, on behalf of the tenants of a purpose built rental building, that the Residential Tenancy Branch provide prompt attention to the concerns of tenants regarding the condition and maintenance of the building and that the accessibility, effectiveness and efficiency of the Residential Tenancy Branch’s process for assessing and resolving complaints be reviewed and enhanced.
2006 July 26
Rent Supplements and Housing Allowances
Provincial Government (and forwarded to UBCM member municipalities)
Expressing opposition to the Province’s introduction of rent supplements and requesting that its budget be reallocated towards the development of new social housing units.
2006 July 26
Provincial Funding for Safe Houses
Provincial Government
Request that Provincial funding for safe houses in Burnaby and on the North Shore be restored.
2007 October 10
204 Alpha and 205 Beta – Response to Delegation Request
Provincial Government
Request that BC Housing maintain the housing in said development as family housing despite its purchase under the Provincial Homelessness Initiative.
2008 December 16
Support for Social Housing Projects in Burnaby
Provincial Government
Request that BC Housing reverse its decision to revoke funding for two social housing projects, which included transitional and supportive housing for women in two existing apartment buildings on Hastings Street, which had successfully completed the Public Hearing process. The Elizabeth Fry Society’s proposed projects could not proceed without provincial funding.
2009 July 10
Application of Property Transfer Tax to Non-Market Housing
Provincial Government
Support for a non-profit society’s request for an exemption from the Provincial Property Transfer Tax. The tax was proving to be a financial barrier for the advancement of a seniors’ housing development.
2009 October 22
City Housing Initiatives/Property Transfer Tax Issue
Provincial Government
Request once again that the Province address the financial barrier to the advancement of a seniors’ housing development in Burnaby caused by the Provincial Property Transfer Tax.
Source: FCM115
Source: City of Burnaby116
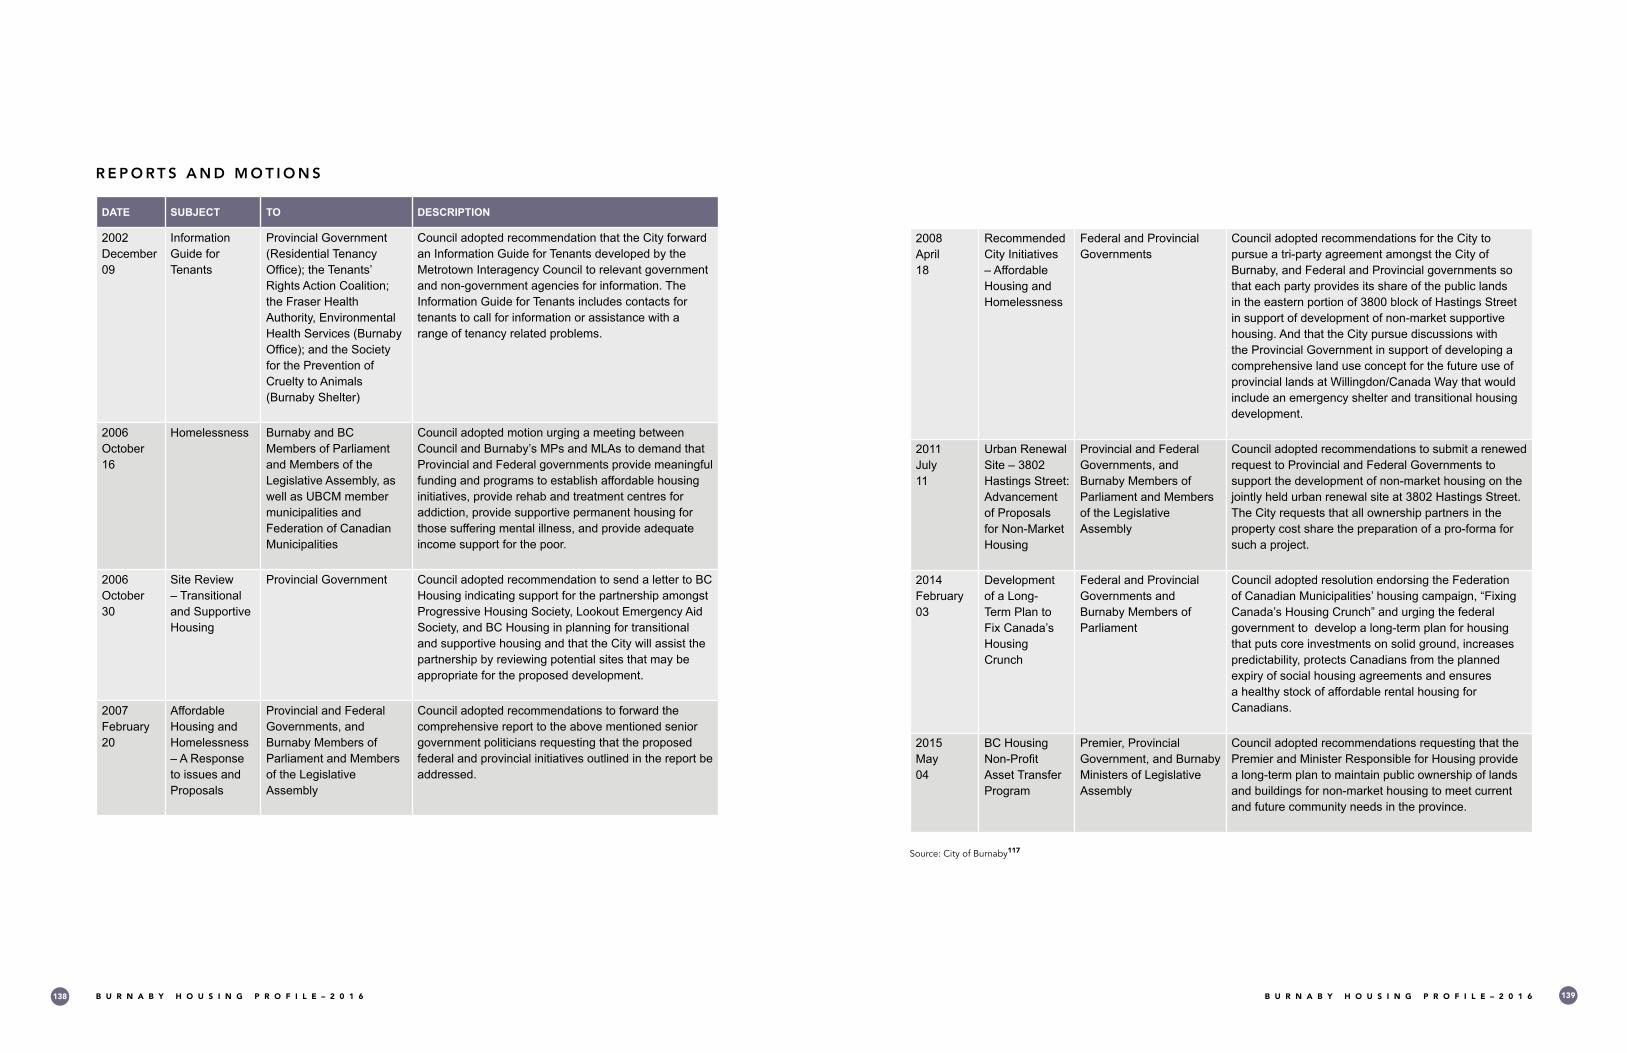
B U R N A B Y H O U S I N G P R O F I L E – 2 0 1 6 B U R N A B Y H O U S I N G P R O F I L E – 2 0 1 6138 139
R E P O R T S A N D M O T I O N S
DATE SUBJECT TO DESCRIPTION
2002 December 09
Information Guide for Tenants
Provincial Government (Residential Tenancy Office); the Tenants’ Rights Action Coalition; the Fraser Health Authority, Environmental Health Services (Burnaby Office); and the Society for the Prevention of Cruelty to Animals (Burnaby Shelter)
Council adopted recommendation that the City forward an Information Guide for Tenants developed by the Metrotown Interagency Council to relevant government and non-government agencies for information. The Information Guide for Tenants includes contacts for tenants to call for information or assistance with a range of tenancy related problems.
2006 October 16
Homelessness Burnaby and BC Members of Parliament and Members of the Legislative Assembly, as well as UBCM member municipalities and Federation of Canadian Municipalities
Council adopted motion urging a meeting between Council and Burnaby’s MPs and MLAs to demand that Provincial and Federal governments provide meaningful funding and programs to establish affordable housing initiatives, provide rehab and treatment centres for addiction, provide supportive permanent housing for those suffering mental illness, and provide adequate income support for the poor.
2006 October 30
Site Review – Transitional and Supportive Housing
Provincial Government Council adopted recommendation to send a letter to BC Housing indicating support for the partnership amongst Progressive Housing Society, Lookout Emergency Aid Society, and BC Housing in planning for transitional and supportive housing and that the City will assist the partnership by reviewing potential sites that may be appropriate for the proposed development.
2007 February 20
Affordable Housing and Homelessness – A Response to issues and Proposals
Provincial and Federal Governments, and Burnaby Members of Parliament and Members of the Legislative Assembly
Council adopted recommendations to forward the comprehensive report to the above mentioned senior government politicians requesting that the proposed federal and provincial initiatives outlined in the report be addressed.
2008 April 18
Recommended City Initiatives – Affordable Housing and Homelessness
Federal and Provincial Governments
Council adopted recommendations for the City to pursue a tri-party agreement amongst the City of Burnaby, and Federal and Provincial governments so that each party provides its share of the public lands in the eastern portion of 3800 block of Hastings Street in support of development of non-market supportive housing. And that the City pursue discussions with the Provincial Government in support of developing a comprehensive land use concept for the future use of provincial lands at Willingdon/Canada Way that would include an emergency shelter and transitional housing development.
2011 July 11
Urban Renewal Site – 3802 Hastings Street: Advancement of Proposals for Non-Market Housing
Provincial and Federal Governments, and Burnaby Members of Parliament and Members of the Legislative Assembly
Council adopted recommendations to submit a renewed request to Provincial and Federal Governments to support the development of non-market housing on the jointly held urban renewal site at 3802 Hastings Street. The City requests that all ownership partners in the property cost share the preparation of a pro-forma for such a project.
2014 February 03
Development of a Long-Term Plan to Fix Canada’s Housing Crunch
Federal and Provincial Governments and Burnaby Members of Parliament
Council adopted resolution endorsing the Federation of Canadian Municipalities’ housing campaign, “Fixing Canada’s Housing Crunch” and urging the federal government to develop a long-term plan for housing that puts core investments on solid ground, increases predictability, protects Canadians from the planned expiry of social housing agreements and ensures a healthy stock of affordable rental housing for Canadians.
2015 May 04
BC Housing Non-Profit Asset Transfer Program
Premier, Provincial Government, and Burnaby Ministers of Legislative Assembly
Council adopted recommendations requesting that the Premier and Minister Responsible for Housing provide a long-term plan to maintain public ownership of lands and buildings for non-market housing to meet current and future community needs in the province.
Source: City of Burnaby117
B U R N A B Y H O U S I N G P R O F I L E – 2 0 1 6 B U R N A B Y H O U S I N G P R O F I L E – 2 0 1 6140 141
C A S E S T U D I E S
PA R T 5
The following case studies highlight the types of development
supported by the City’s housing policies . These developments are
either already completed, under construction, or proceeding through
the rezoning approvals process . The case studies primarily feature
non-market housing developments supported by the Community
Benefit Bonus Policy, City Land Leases policy, and/or other policies .
In addition, some recent market rental development projects are also
presented .
B U R N A B Y H O U S I N G P R O F I L E – 2 0 1 6 B U R N A B Y H O U S I N G P R O F I L E – 2 0 1 6142 143
The provision of affordable and special needs non-market housing is
a fundamental objective of all of Burnaby’s major policy documents .
This section provides examples of non-market housing developments
that meet those objectives, and were supported by the City under
one or more policy programs .118
All of these projects utilize the Comprehensive Development (CD)
rezoning process, and are consistent with all applicable Community
Plans .
N O N - M A R K E T H O U S I N G C A S E S T U D I E S
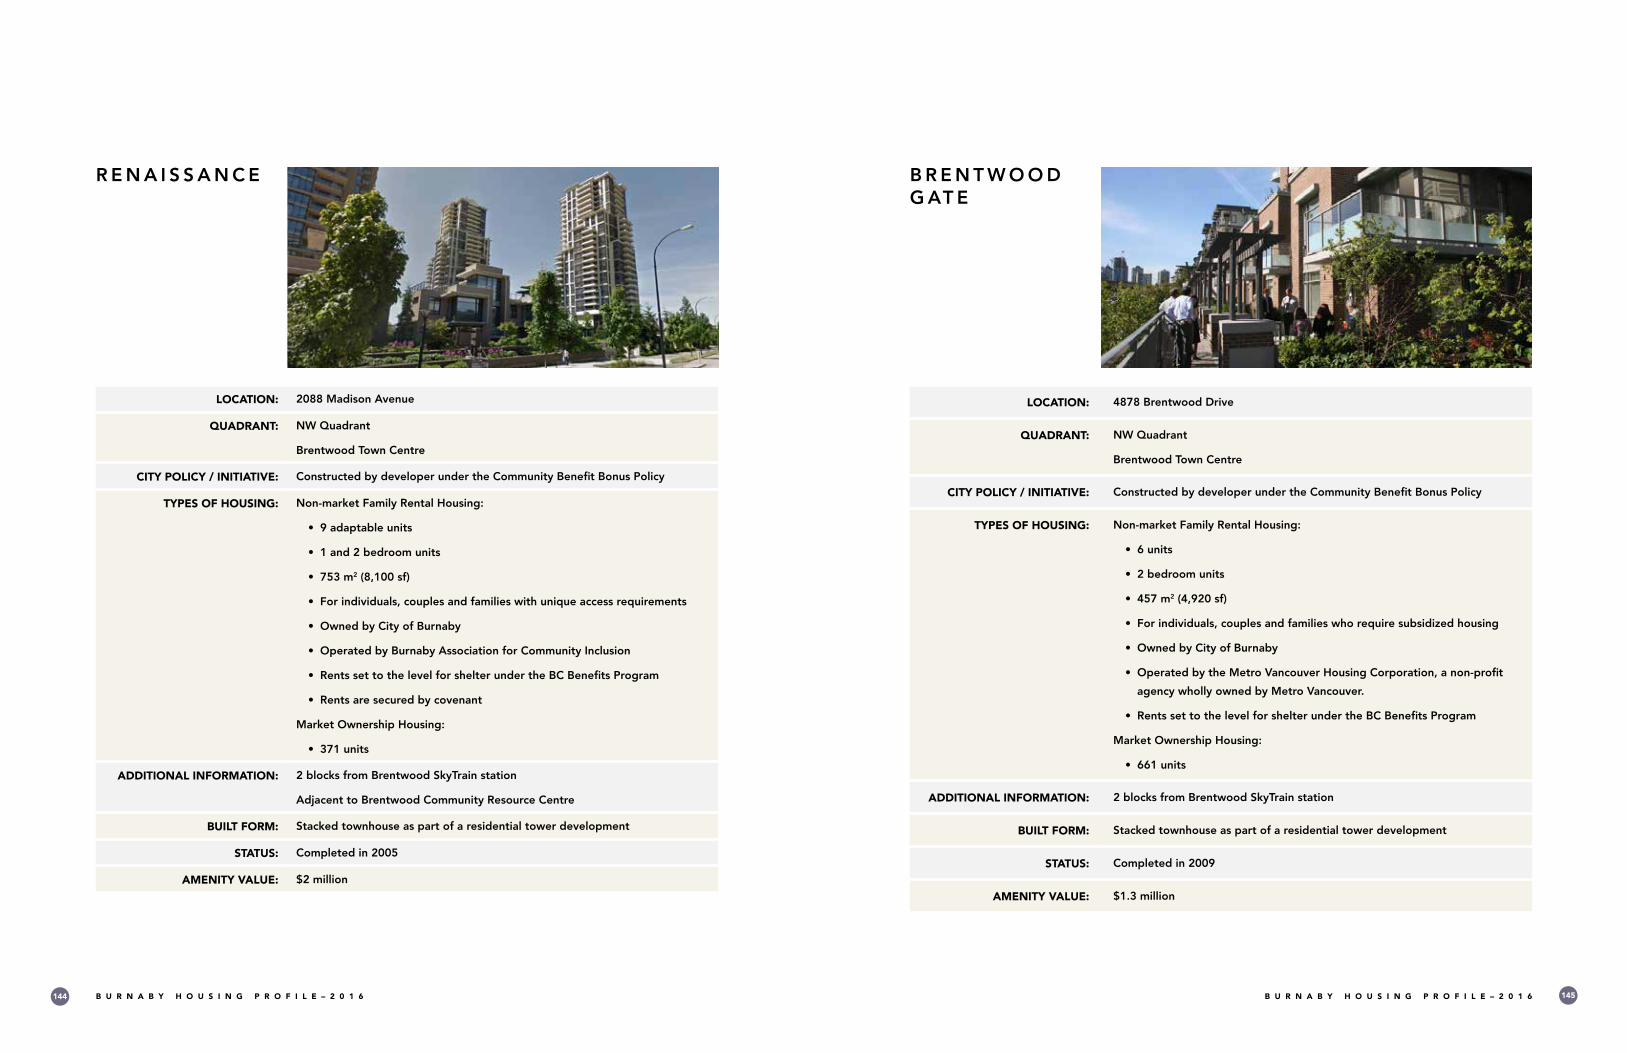
B U R N A B Y H O U S I N G P R O F I L E – 2 0 1 6 B U R N A B Y H O U S I N G P R O F I L E – 2 0 1 6144 145
LOCATION: 2088 Madison Avenue
QUADRANT: NW Quadrant
Brentwood Town Centre
CITY POLICY / INITIATIVE: Constructed by developer under the Community Benefit Bonus Policy
TYPES OF HOUSING: Non-market Family Rental Housing:
• 9 adaptable units
• 1 and 2 bedroom units
• 753 m2 (8,100 sf)
• For individuals, couples and families with unique access requirements
• Owned by City of Burnaby
• Operated by Burnaby Association for Community Inclusion
• Rents set to the level for shelter under the BC Benefits Program
• Rents are secured by covenant
Market Ownership Housing:
• 371 units
ADDITIONAL INFORMATION: 2 blocks from Brentwood SkyTrain station
Adjacent to Brentwood Community Resource Centre
BUILT FORM: Stacked townhouse as part of a residential tower development
STATUS: Completed in 2005
AMENITY VALUE: $2 million
R E N A I S S A N C E
LOCATION: 4878 Brentwood Drive
QUADRANT: NW Quadrant
Brentwood Town Centre
CITY POLICY / INITIATIVE: Constructed by developer under the Community Benefit Bonus Policy
TYPES OF HOUSING: Non-market Family Rental Housing:
• 6 units
• 2 bedroom units
• 457 m2 (4,920 sf)
• For individuals, couples and families who require subsidized housing
• Owned by City of Burnaby
• Operated by the Metro Vancouver Housing Corporation, a non-profit
agency wholly owned by Metro Vancouver.
• Rents set to the level for shelter under the BC Benefits Program
Market Ownership Housing:
• 661 units
ADDITIONAL INFORMATION: 2 blocks from Brentwood SkyTrain station
BUILT FORM: Stacked townhouse as part of a residential tower development
STATUS: Completed in 2009
AMENITY VALUE: $1.3 million
B R E N T W O O D G AT E
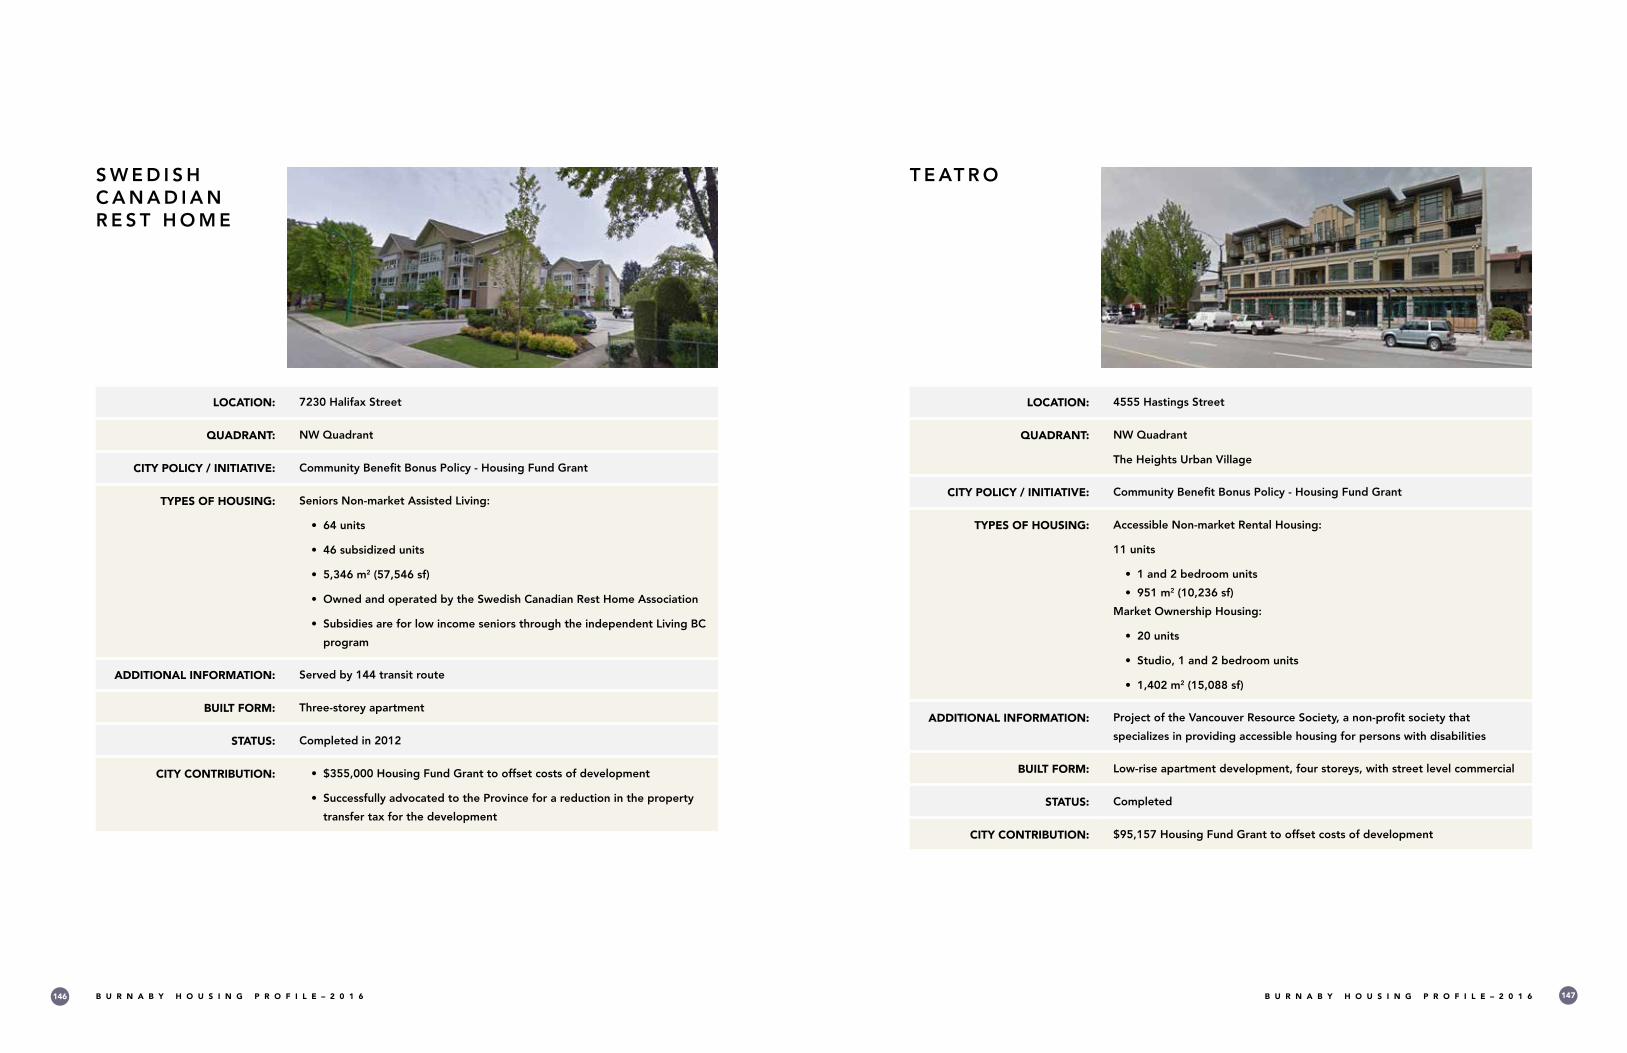
B U R N A B Y H O U S I N G P R O F I L E – 2 0 1 6 B U R N A B Y H O U S I N G P R O F I L E – 2 0 1 6146 147
LOCATION: 7230 Halifax Street
QUADRANT: NW Quadrant
CITY POLICY / INITIATIVE: Community Benefit Bonus Policy - Housing Fund Grant
TYPES OF HOUSING: Seniors Non-market Assisted Living:
• 64 units
• 46 subsidized units
• 5,346 m2 (57,546 sf)
• Owned and operated by the Swedish Canadian Rest Home Association
• Subsidies are for low income seniors through the independent Living BC
program
ADDITIONAL INFORMATION: Served by 144 transit route
BUILT FORM: Three-storey apartment
STATUS: Completed in 2012
CITY CONTRIBUTION: • $355,000 Housing Fund Grant to offset costs of development
• Successfully advocated to the Province for a reduction in the property
transfer tax for the development
S W E D I S H C A N A D I A N R E S T H O M E
LOCATION: 4555 Hastings Street
QUADRANT: NW Quadrant
The Heights Urban Village
CITY POLICY / INITIATIVE: Community Benefit Bonus Policy - Housing Fund Grant
TYPES OF HOUSING: Accessible Non-market Rental Housing:
11 units
• 1 and 2 bedroom units
• 951 m2 (10,236 sf)
Market Ownership Housing:
• 20 units
• Studio, 1 and 2 bedroom units
• 1,402 m2 (15,088 sf)
ADDITIONAL INFORMATION: Project of the Vancouver Resource Society, a non-profit society that
specializes in providing accessible housing for persons with disabilities
BUILT FORM: Low-rise apartment development, four storeys, with street level commercial
STATUS: Completed
CITY CONTRIBUTION: $95,157 Housing Fund Grant to offset costs of development
T E AT R O

B U R N A B Y H O U S I N G P R O F I L E – 2 0 1 6 B U R N A B Y H O U S I N G P R O F I L E – 2 0 1 6148 149
LOCATION: 7121 Fourteenth Avenue and 7201 Eleventh Avenue
QUADRANT: SE Quadrant
Edmonds Town Centre
Southgate Master Plan Area
CITY POLICY / INITIATIVE: Community Benefit Bonus Policy
TYPES OF HOUSING: Non-market Family Housing – Public Housing owned and operated by BC
Housing
• 90 units
• 9,261 m2 (99,683 sf)
• On land obtained by the developer (Ledingham McAllister)
Non-market Seniors Housing
• 91 units, owned by BC Housing
• 6,488 m2 (69,840 sf)
• On land obtained by BC Housing
Market Ownership Housing
• 606 units
• 44,046 m2 (474,117 sf)
• On land sold to the developer (Ledingham McAllister)
C E D A R P L A C EADDITIONAL INFORMATION: • Currently, there are 90 family housing units at Cedar Place, which are
owned and operated by BC Housing. These would be replaced by 90
new public housing units on adjacent property owned by Ledingham
McAllister.
• Existing residents of Cedar Place could stay in their homes until the 90
new units are constructed. They would then have the option of moving
to the new units, located across the street.
• Once the residents are relocated to the new housing, the old Cedar
Place development would be demolished and construction of the
91-unit non-market seniors housing and the 606-unit market housing
development would commence.
• Developed through a collaborative partnership with the Province,
Ledingham McAllister, and the City.
• Demonstrates what can be accomplished with senior government
participation and funding
• Sale of a portion of the current Cedar Place property would generate
funding for development of the new non-market housing
• Proceeds from the sale would stay in the same community and be used
to provide improved accommodations for existing tenants and double
the amount of people housed
• Value was also generated through support for the rezoning of the
Cedar Place site to a higher density multiple family district
BUILT FORM: Low to mid-rise apartment development, four to six storeys
STATUS: Undergoing Rezoning
CITY CONTRIBUTION: Approximately $8.5 million through the density bonus program, and about
$28.5 million in indirect funding through the value created by the proposed
rezoning of the Cedar Place site

B U R N A B Y H O U S I N G P R O F I L E – 2 0 1 6 B U R N A B Y H O U S I N G P R O F I L E – 2 0 1 6150 151
LOCATION: Withheld at Operators Request
QUADRANT:
CITY POLICY / INITIATIVE: Community Benefit Bonus Policy - Housing Fund Grant
City Land Lease
TYPES OF HOUSING: Safe House for women and children fleeing abusive relationships:
• 10 beds
• 24 hour support and advocacy in a secure environment
• 30 day stays
Wenda’s Place - Transitional Housing:
• 9 units
• support, advocacy and life skills in a secure environment
• Average of 1 year stays, maximum stay 18 months
ADDITIONAL INFORMATION:
BUILT FORM:
STATUS: Safe House - Opened 1985
Wenda’s Place - Opened 2009
CITY CONTRIBUTION: Safe House:
• 41 year lease of City lands for lump sum of $11,995 (approx. $293/year)
Wenda’s Place - Transitional Housing:
• $100,000 Housing Fund Grant
D I X O N T R A N S I T I O N S O C I E T Y
Purpose-built rental housing, offered at market rates, is an important
part of the housing continuum, particularly for low to middle income
earners that are unable to purchase homes . As such, encouraging
the supply of new rental housing is supported by Burnaby’s major
policy documents, as a way to maintain diversity in its housing stock
and provide an affordable housing option for many households .
This section provides examples of recent purpose-built market
housing projects currently under development .
All of these projects utilize the Comprehensive Development (CD)
rezoning process, and are consistent with all applicable Community
Plans .
M A R K E T R E N TA L H O U S I N G C A S E S T U D I E S

B U R N A B Y H O U S I N G P R O F I L E – 2 0 1 6 B U R N A B Y H O U S I N G P R O F I L E – 2 0 1 6152 153
LOCATION: 7230 Halifax Street
QUADRANT: NW Quadrant
TYPES OF HOUSING BEING CREATED:
Purpose-built market rental housing:
• 300 units
• 1 and 2 bedroom units
• ~19,224 m2 (206,925 sf) plus shared 1,363 m2 (14,672 sf) amenity space
• Rental tenure secured by covenant
Market ownership housing
• 291 units
• 1, 2, and 3 bedroom units
• ~27,726 m2 (298,441 sf) ~19,224 m2 (206,925 sf) plus shared 1,363 m2
(14,672 sf) amenity space
BUILT FORM: 53-storey apartment tower
STATUS: under construction
T H E A M A Z I N G B R E N T W O O D – T O W E R 1
LOCATION: 3700 Hastings Street
QUADRANT: NW Quadrant,
Heights Community Plan area
TYPES OF HOUSING BEING CREATED:
Purpose-built market rental housing:
• 21 units
• Studio, 1 and 2 bedroom units
• 1,757 m2 (18,914 sf)
• 4 units are adaptable
• Rental tenure to be secured by covenant
BUILT FORM: three-storey apartment building over street-level commercial
STATUS: undergoing rezoning
3 7 0 0 H A S T I N G S S T R E E T

B U R N A B Y H O U S I N G P R O F I L E – 2 0 1 6 B U R N A B Y H O U S I N G P R O F I L E – 2 0 1 6154 155
LOCATION: 4769 Hazel Street/4758 Grange Street/6050 Sussex Avenue
QUADRANT: SW Quadrant,
Metrotown Town Centre
TYPES OF HOUSING BEING CREATED:
Purpose-built market rental housing:
• 232 apartment units
• 6 townhouse units
• Studio, 1 and 2 bedroom units
• 16,287 m2 (175,311 sf) plus 823 m2 (8,858 sf) amenity space
• 46 units are adaptable
• Rental tenure to be secured by covenant
ADDITIONAL INFORMATION: To be added to two existing rental apartment towers on site
BUILT FORM: 31-storey apartment tower and 3-storey townhouses
STATUS: undergoing rezoning
PA R K V I E W T O W E R S /S U S S E X
LOCATION: 4310 Hastings Street
QUADRANT: NW Quadrant,
Heights Community Plan area
TYPES OF HOUSING BEING CREATED:
Purpose-built market rental housing:
• 7 apartment units
• Studio, 1 and 2 bedroom units
• 543 m2 (5,846 sf)
• Rental tenure at 95% of fair market rental value secured by covenant
Market ownership housing:
• 48 apartment units
• Studio, 1, and 2 bedroom units
• 3,867 m2 (41,627 sf)
BUILT FORM: Built form: 5 storey apartment building over ground floor commercial
STATUS: completed in 2011
U N I O N

B U R N A B Y H O U S I N G P R O F I L E – 2 0 1 6 B U R N A B Y H O U S I N G P R O F I L E – 2 0 1 6156 157
CONCLUSION
PART

B U R N A B Y H O U S I N G P R O F I L E – 2 0 1 6 B U R N A B Y H O U S I N G P R O F I L E – 2 0 1 6158 159
This Burnaby Housing Profile provides an overview of housing
topics, issues and questions, and explains the programs, policies,
and actions Burnaby undertakes to improve housing affordability
and choice . Burnaby’s housing landscape is complex and operates
within the context of the Metro Vancouver regional market, which is
characterized by rising prices, increased demand and limited supply .
It is also affected by senior government policies and funding for
housing .
Burnaby’s approach to housing has been multi-pronged:
• Support non-market housing through funding (Housing
Fund, leasing City-owned lands at no cost), facilitating
development (deferring fees and charges, fast-tracking), and
advocacy and partnerships .
• Support rental housing and renters by encouraging supply
(development of market rental housing, Secondary Suites
Program, Flex-Suites Policy), protecting renters (Tenant
Assistance Policy) and advocating to senior governments for
stronger tenant protection and financial support for rental
housing .
• Support Market Housing through a strong planning
framework that accommodates growth (Official Community
Plan, Regional Context Statement), programs that support
affordability (Secondary Suites Program, Flex-Suites Policy),
and a streamlined development process .
Burnaby, like other cities in Metro Vancouver, is grappling with
increased housing demand and rising affordability challenges .
However, our long-term approach to housing has facilitated positive
outcomes across the housing continuum:
C O N C L U S I O N

B U R N A B Y H O U S I N G P R O F I L E – 2 0 1 6 B U R N A B Y H O U S I N G P R O F I L E – 2 0 1 6160 161
• Agreement to construct 181 new units of non-market seniors
and family housing at Cedar Place, with an approximately
$8 .5 million density bonus value;
• Over $42 million contributed to the Housing Fund over the
life of the fund;
• $2 million of which has been allocated or disbursed in
Housing Fund grants to five non-profit organizations
to support 276 non-profit units;
• Lease of City lands to seven non-profit and cooperative
housing projects to support 302 units;
• Request for proposals to develop two City-owned sites for
non-market housing;
• Affordable Units Policy to secure 390 units of non-market
housing on public lands;
• Approval of 575 new purpose-built rental housing units in 3
projects;
• Permitting of 359 new secondary suites, adding to the
existing inventory of over 7,000 units;
• Protection of renters through the Tenant Assistance Policy;
• Addition of nearly 5,000 units of new market housing in the
past 5 years;
• Support for people aging in place through the Adaptable
Housing Policy; and,
• Assistance for homeowners by permitting suites and flex
suites .
Looking ahead, the City will continue to support all aspects of the
housing program and will consider ways in which to build upon its
foundations . Burnaby will support non-market housing by reviewing
the use of the Housing Fund, advancing the City Lands Program
for Non-Market Housing, and by seeking new partnerships with
senior levels of government, the non-profit sector, and industry .
The City will continue to support the rental housing market and
renters by facilitating the development of rental housing, reviewing
ways to increase the number of accessory units (e .g . Secondary
Suites and Flex-Suites Programs), and helping tenants through the
Tenant Assistance Policy . Burnaby will also review its guiding policy
documents, including the Official Community Plan, which manages
growth and sets the residential framework, and review the City’s
housing strategies to set out more specific goals and approaches to
meet local housing demand .
By building a solid housing foundation, the City can achieve its goals
of developing a sustainable community that provides a high quality
of life for all who call Burnaby home .

B U R N A B Y H O U S I N G P R O F I L E – 2 0 1 6 B U R N A B Y H O U S I N G P R O F I L E – 2 0 1 6162 163
APPENDIX
PART
B U R N A B Y H O U S I N G P R O F I L E – 2 0 1 6 B U R N A B Y H O U S I N G P R O F I L E – 2 0 1 6164 165
A P P E N D I X
The following appendices provide additional information:
Appendix 1: Existing Non-Market Housing Developments
Appendix 2: Glossary
Appendix 3: References and Endnotes
B U R N A B Y H O U S I N G P R O F I L E – 2 0 1 6 B U R N A B Y H O U S I N G P R O F I L E – 2 0 1 6166 167
A list of existing non-market developments in Burnaby is provided in
this appendix under the following categories:
• Transitional Housing
• Housing with Supports
• Group Home
• Long Term Care
• Assisted Living
• Supportive Housing
• Non-Market Rental Housing
• Non-Profit Housing Developments
• Public Housing Developments
• Cooperative Housing Developments
E X I S T I N G N O N - M A R K E T H O U S I N G D E V E L O P M E N T S
PA R T 7
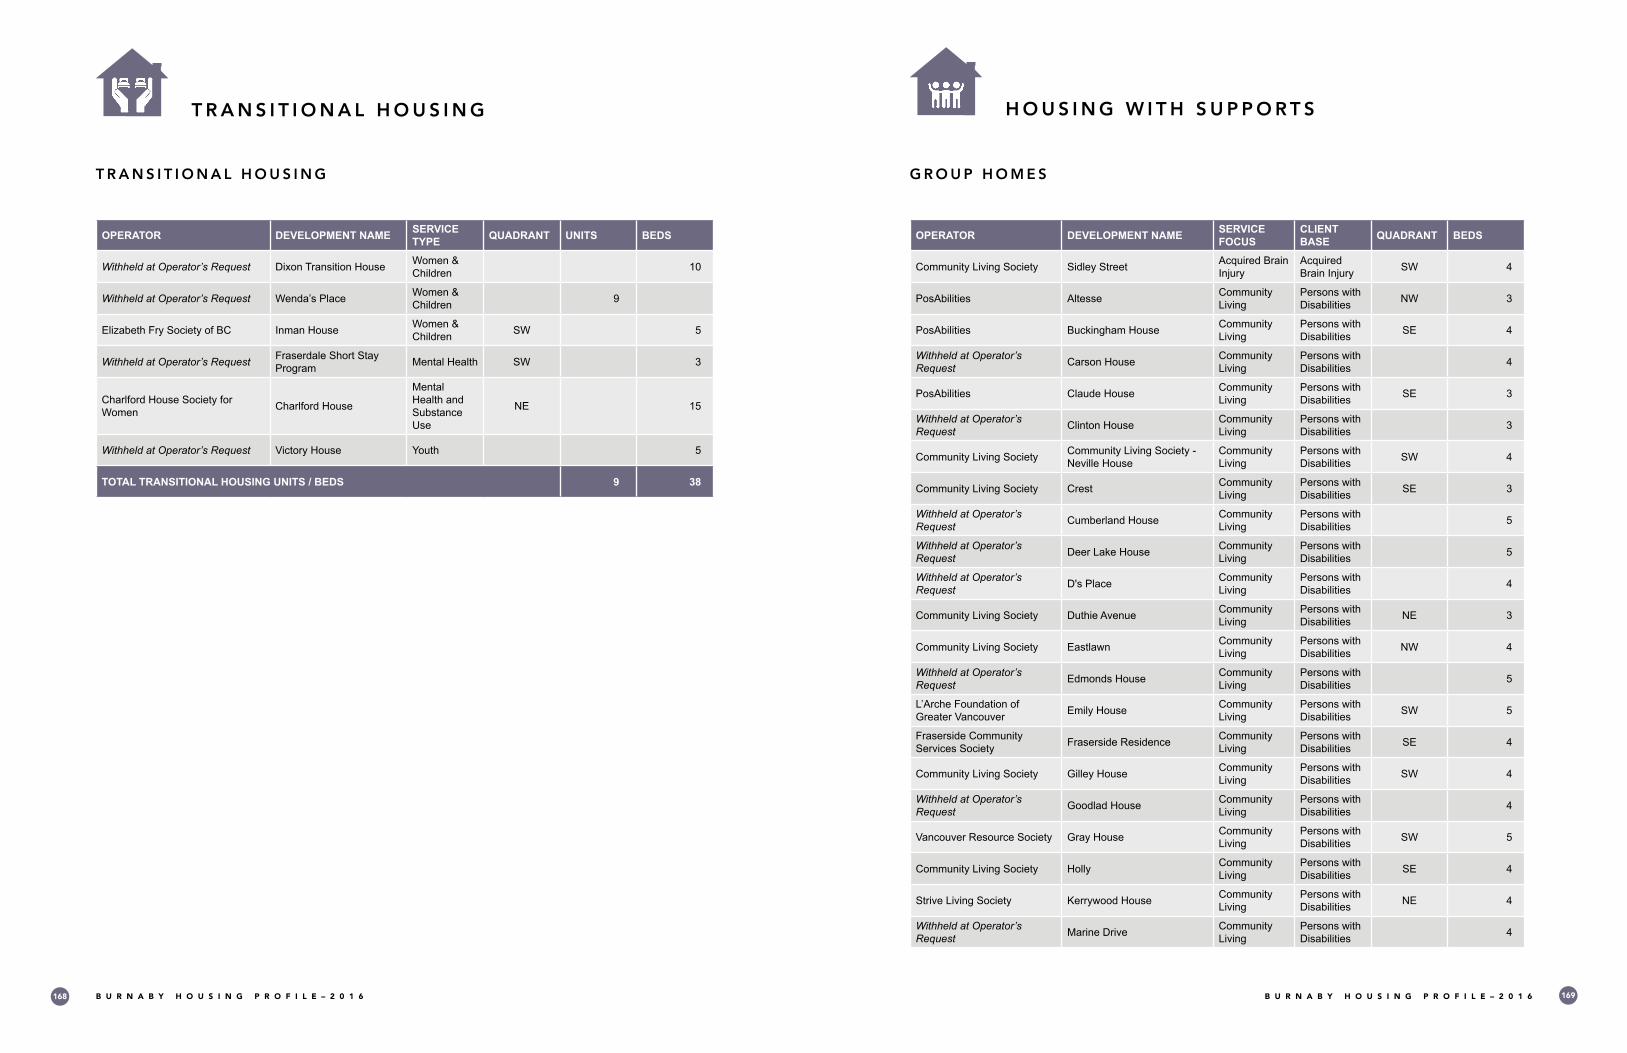
B U R N A B Y H O U S I N G P R O F I L E – 2 0 1 6 B U R N A B Y H O U S I N G P R O F I L E – 2 0 1 6168 169
T R A N S I T I O N A L H O U S I N G
T R A N S I T I O N A L H O U S I N G
OPERATOR DEVELOPMENT NAME SERVICE TYPE QUADRANT UNITS BEDS
Withheld at Operator’s Request Dixon Transition House Women & Children 10
Withheld at Operator’s Request Wenda’s Place Women & Children 9
Elizabeth Fry Society of BC Inman House Women & Children SW 5
Withheld at Operator’s Request Fraserdale Short Stay Program Mental Health SW 3
Charlford House Society for Women Charlford House
Mental Health and Substance Use
NE 15
Withheld at Operator’s Request Victory House Youth 5
TOTAL TRANSITIONAL HOUSING UNITS / BEDS 9 38
G R O U P H O M E S
OPERATOR DEVELOPMENT NAME SERVICE FOCUS
CLIENT BASE QUADRANT BEDS
Community Living Society Sidley Street Acquired Brain Injury
Acquired Brain Injury SW 4
PosAbilities Altesse Community Living
Persons with Disabilities NW 3
PosAbilities Buckingham House Community Living
Persons with Disabilities SE 4
Withheld at Operator’s Request Carson House Community
LivingPersons with Disabilities 4
PosAbilities Claude House Community Living
Persons with Disabilities SE 3
Withheld at Operator’s Request Clinton House Community
LivingPersons with Disabilities 3
Community Living Society Community Living Society - Neville House
Community Living
Persons with Disabilities SW 4
Community Living Society Crest Community Living
Persons with Disabilities SE 3
Withheld at Operator’s Request Cumberland House Community
LivingPersons with Disabilities 5
Withheld at Operator’s Request Deer Lake House Community
LivingPersons with Disabilities 5
Withheld at Operator’s Request D's Place Community
LivingPersons with Disabilities 4
Community Living Society Duthie Avenue Community Living
Persons with Disabilities NE 3
Community Living Society Eastlawn Community Living
Persons with Disabilities NW 4
Withheld at Operator’s Request Edmonds House Community
LivingPersons with Disabilities 5
L’Arche Foundation of Greater Vancouver Emily House Community
LivingPersons with Disabilities SW 5
Fraserside Community Services Society Fraserside Residence Community
LivingPersons with Disabilities SE 4
Community Living Society Gilley House Community Living
Persons with Disabilities SW 4
Withheld at Operator’s Request Goodlad House Community
LivingPersons with Disabilities 4
Vancouver Resource Society Gray House Community Living
Persons with Disabilities SW 5
Community Living Society Holly Community Living
Persons with Disabilities SE 4
Strive Living Society Kerrywood House Community Living
Persons with Disabilities NE 4
Withheld at Operator’s Request Marine Drive Community
LivingPersons with Disabilities 4
H O U S I N G W I T H S U P P O R T S

B U R N A B Y H O U S I N G P R O F I L E – 2 0 1 6 B U R N A B Y H O U S I N G P R O F I L E – 2 0 1 6170 171
OPERATOR DEVELOPMENT NAME SERVICE FOCUS
CLIENT BASE QUADRANT BEDS
L’Arche Foundation of Greater Vancouver Nazirah House Community
LivingPersons with Disabilities SW 5
Community Living Society Nelson Avenue Community Living
Persons with Disabilities SW 4
Withheld at Operator’s Request Neville House Community
LivingPersons with Disabilities 5
Withheld at Operator’s Request New Britton House Community
LivingPersons with Disabilities 4
Withheld at Operator’s Request Oakland Community
LivingPersons with Disabilities 5
PosAbilities Randall House Community Living
Persons with Disabilities SE 4
Community Living Society Rosewood Community Living
Persons with Disabilities SE 4
Withheld at Operator’s Request Sardis House Community
LivingPersons with Disabilities 4
Withheld at Operator’s Request Sardis New Chaffey Community
LivingPersons with Disabilities 4
L’Arche Foundation of Greater Vancouver Shiloah Community
LivingPersons with Disabilities SW 12
L’Arche Foundation of Greater Vancouver The Crossing House Community
LivingPersons with Disabilities SW 4
Community Living Society Twelfth Avenue Community Living
Persons with Disabilities SE 3
PosAbilities Vista House Community Living
Persons with Disabilities SW 4
Pioneer Community Living Association Adrian House
Mental Health and Substance Use
Adults NW 10
Coast Foundation Society Forglen 5450Mental Health and Substance Use
Adults SW 5
Coast Foundation Society Forglen 5452Mental Health and Substance Use
Adults SW 5
Withheld at Operator’s Request Millers Way
Mental Health and Sustance Use
Adults 10
MEI Enterprises Ltd. Rainbow LodgeMental Health and Substance Use
Adults SE 10
TOTAL GROUP HOME BEDS 190
L O N G T E R M C A R E FA C I L I T I E S
OPERATOR DEVELOPMENT NAME SERVICE FOCUS
CLIENT BASE QUADRANT BEDS
Chartwell Ltd. Carlton Gardens Care Centre
Long Term Care Seniors SW 128
Dania Society Dania Home Long Term Care Seniors SW 102
Fair Haven Vancouver Fair Haven United Church Homes
Long Term Care Seniors SW 100
Fraser Health Authority Fellburn Care Centre Long Term Care Seniors NW 110
Finnish Canadian Rest Home Association Finnish Manor Long Term
Care Seniors SW 60
George Derby Society George Derby Centre Long Term Care Seniors SE 300
Agecare Investments BC Ltd. Harmony Court Care Centre
Long Term Care Seniors SE 80
New Vista Society New Vista Care Home I Long Term Care Seniors SE 236
Norwegian Old People’s Home Association Normanna Rest Home II Long Term
Care Seniors SE 100
Vancouver Resource Society Rotary House Long Term Care
Persons with Disabilities SW 5
St. Michael’s Centre Hospital Society St. Michael's Centre Long Term
Care Seniors SW 128
The Pinnacle Care Group Willingdon Care Centre Long Term Care Seniors SW 95
TOTAL LONG TERM CARE BEDS 1444
G R O U P H O M E S - C O N T I N U E D

B U R N A B Y H O U S I N G P R O F I L E – 2 0 1 6 B U R N A B Y H O U S I N G P R O F I L E – 2 0 1 6172 173
S U P P O R T I V E H O U S I N G
OPERATOR DEVELOPMENT NAME SERVICE TYPE QUADRANT UNITS BEDS
Action Line Housing Society Seton Villa
Supportive Housing Seniors (Non-Profit)
NW 88
AgeCare Harmony Court Estate
Supportive Housing Seniors (Market)
SE 133
Sienna Seniors Living Rideau Retirement Residence
Supportive Housing Seniors (Market)
NW 102
Atira Women's Resource Society Margaret's Housing for Older Women (Maggie's)
Supportive Housing Seniors (Non-Profit)
NE 20
Burnaby Association for Community Inclusion Eastburn House Persons with
Disabilities SE 5
Burnaby Association for Community Inclusion Orchard Heights Persons with
Disabilities SW 5
Burnaby Association for Community Inclusion Southview Persons with
Disabilities SW 4
Pacific Arbour Retirement Communities The Mulberry
Supportive Housing Seniors (Market)
SE 146
PosAbilities Norfolk House I Persons with Disabilities SW 6
Progressive Housing Society Holly House Mental Health/Homelessness SE 5
Progressive Housing Society Rumble House Mental Health/Homelessness SW 5
Royal Canadian Legion The Poppy Residences
Supportive Housing Seniors (Non-Profit)
SW 70
TOTAL SUPPORTIVE HOUSING UNITS / BEDS 559 30
A S S I S T E D L I V I N G R E S I D E N C E S
OPERATOR DEVELOPMENT NAME SERVICE FOCUS QUADRANT UNITS BEDS
Park Place Seniors Living Courtyard Terrace (Market) Seniors SW 47
Dania Society Dania Manor Seniors SW 50
Withheld at Operator’s Request Fraserdale Long Stay Program Mental Health 7
Howe Sound Rehabilitation Services Society Liberty Place Persons with
Disabilities SE 20
Nikkei Seniors Health Care and Housing Society Nikkei Home Seniors SE 59
Sienna Seniors Living Rideau Retirement Residence (Market) Seniors NW 40
Action Line Housing Society Seton Villa Seniors NW 76
Swedish Canadian Rest Home Association
Swedish Assisted Living Residence Seniors NE 64
TOTAL ASSISTED LIVING UNITS / BEDS 356 7

B U R N A B Y H O U S I N G P R O F I L E – 2 0 1 6 B U R N A B Y H O U S I N G P R O F I L E – 2 0 1 6174 175
N O N - M A R K E T R E N TA L H O U S I N G
N O N - P R O F I T H O U S I N G D E V E L O P M E N T S
OPERATOR DEVELOPMENT NAME SERVICE FOCUS
STRUCTURE TYPE
QUADRANT UNITS
Action Line Housing Society Seton Villa Seniors Apartment NW 53
Affordable Housing Charitable Association Sunset Court Family Apartment /
Townhouse SW 48
Affordable Housing Non-Profit Rental Association Heritage Heights Family Apartment NW 21
Affordable Housing Societies Chaffey Lane Seniors Apartment SW 37
Affordable Housing Societies Concordia Court Seniors /Family
Apartment / Townhouse SW 100
Affordable Housing Societies Burnaby Court I & II Seniors /Family Townhouse SE 86
Affordable Housing Societies Ridgelawn Gardens Seniors /Family Townhouse NW 70
Burnaby Association for Community Inclusion Madison Persons with
Disabilities Townhouse NW 4
Burnaby Association for Community Inclusion Stride Place Persons with
Disabilities Apartment SE 45
Burnaby Association for Community Inclusion Renaissance Persons with
Disabilities Apartment NW 9
Burnaby Association for Community Inclusion Filby Court Persons with
Disabilities Apartment SW 9
Burnaby Lougheed Lions Housing Society Lions Mulberry Place Family Townhouse SE 65
Burnaby Lougheed Lions Housing Society Lions Thurston Place Seniors /
Family Apartment SW 40
Burnaby Lougheed Lions Housing Society Lions Kingsway Terrace Seniors /
Family Apartment SE 32
Central Park Citizen Society Kingsway Court Seniors /Family Apartment SW 116
City of Burnaby (formerly Action Line Housing Society)
City managed (Irmin Street properties) Family Apartment SW 20
Community Living Society City Club Development Persons with Disabilities Apartment SE 10
Dania Society Carl Mortenson Manor Seniors Apartment SW 49
Fair Haven United Church Homes Fairhaven apartments Seniors Apartment SW 55
Fair Haven United Church Homes Fairhaven cottages Seniors Townhouse SW 20
Metro Vancouver Housing Corporation Greystone Village Family Townhouse NE 96
Metro Vancouver Housing Corporation Ran Beamish Place Family Townhouse NE 122
OPERATOR DEVELOPMENT NAME SERVICE FOCUS
STRUCTURE TYPE
QUADRANT UNITS
Metro Vancouver Housing Corporation Eastburn Square Family Townhouse SE 30
Metro Vancouver Housing Corporation Brentwood Gate Family Apartment NW 6
More than a Roof Mennonite Housing Society Lake Park Village Family Townhouse SE 43
New Chelsea Society Chelsea View Family Townhouse SW 20
New Chelsea Society Chelsea Heights Family Townhouse NW 38
New Chelsea Society Chelsea Terrace Seniors Apartment SW 209
New Chelsea Society Chelsea Village Seniors /Family
Apartment / Townhouse NW 43
New Vista Society Douglas Manor Seniors Apartment SE 51
New Vista Society Grace MacInnis Place Seniors Apartment SE 24
New Vista Society J.S. Woodsworth Seniors Apartment / Townhouse SE 38
New Vista Society Margaret Bacchus Manor Seniors Apartment SE 39
New Vista Society New Vista Place Seniors Apartment SE 174
New Vista Society E. Winch Tower Seniors Apartment SE 174
New Vista Society J.S. Woodsworth Court Seniors /Family
Apartment / Townhouse SE 40
Nikkei Seniors Health Care and Housing Society Sakura-So Seniors Apartment SE 34
PosAbilities Ridgeview Heights Persons with Disabilities Apartment NE 40
Red Door Housing Society Catherine Anne Court Seniors /Family Townhouse SE 45
Society for Christian Care of the Elderly Salishan Court Seniors Apartment NE 188
SUCCESS Hillside Gardens Family Apartment SE 162
Swedish Canadian Manor Society Swedish Canadian Manor Seniors Apartment NE 63
Swedish Canadian Rest Home Association Gustav Wasa Place Seniors Apartment NE 80
Vancity The Union Seniors /Family Apartment NW 7
TOTAL NON-PROFIT UNITS 2,656
N O N - P R O F I T H O U S I N G D E V E L O P M E N T S - C O N T I N U E D

B U R N A B Y H O U S I N G P R O F I L E – 2 0 1 6 B U R N A B Y H O U S I N G P R O F I L E – 2 0 1 6176 177
P U B L I C H O U S I N G D E V E L O P M E N T S
OPERATOR DEVELOPMENT NAME SERVICE FOCUS
STRUCTURE TYPE QUADRANT UNITS
BC Housing Management Commission Inman & Lister Family 2
BC Housing Management Commission Inman & Lister Family 2
BC Housing Management Commission Inman & Lister Family 2
BC Housing Management Commission Inman & Lister Family 2
BC Housing Management Commission Cedar Place Family Townhouse SE 90
BC Housing Management Commission Inman & Lister Family 2
BC Housing Management Commission Inman & Lister Family 2
BC Housing Management Commission Inman & Lister Family 2
BC Housing Management Commission Inman & Lister Family 2
BC Housing Management Commission Stratford Gardens Seniors Apartment NW 127
BC Housing Management Commission Laurelynn Place Seniors Apartment SW 70
BC Housing Management Commission
Hall Tower & Hall Tower Extension Seniors Apartment SE 324
BC Housing Management Commission
Douglas Drummond Manor
Seniors /Family Apartment SW 125
TOTAL PUBLIC HOUSING UNITS 752
C O O P E R AT I V E H O U S I N G
OPERATOR DEVELOPMENT NAME SERVICE FOCUS
STRUCTURE TYPE QUADRANT UNITS
115 Place Housing Cooperative Association
115 Place Housing Association Co-op Apartment NE 244
Andras Place Housing Cooperative
Andras Place Housing Cooperative Co-op Apartment SW 94
Antrim Place Housing Cooperative Antrim Place Housing Cooperative Co-op Apartment SW 38
Avalon Housing Cooperative Avalon Housing Cooperative Co-op Townhouse SE 40
Bounty Housing Cooperative Bounty Housing Cooperative Co-op Apartment /
Townhouse SE 70
Brambles Housing Cooperative The Brambles Housing Cooperative Co-op Apartment SE 42
Byrne Creek Housing Cooperative Byrne Creek Housing Cooperative Co-op Apartment SE 74
Cariboo Heights Housing Cooperative
Cariboo Heights Housing Cooperative Co-op Townhouse SE 56
Centennial Park Housing Cooperative
Centennial Park Housing Cooperative Co-op Townhouse SW 30
Chances Housing Cooperative Chances Housing Cooperative Co-op Apartment SE 44
Edmonds Place Housing Cooperative
Edmonds Place Housing Cooperative Co-op Apartment SE 51
Garden Square Housing Cooperative
Garden Square Housing Cooperative Co-op Townhouse SW 58
Halston Hills Housing Cooperative Halston Hills Housing Cooperative Co-op Townhouse NE 90
Hillside Place Housing Cooperative
Hillside Place Housing Cooperative Co-op Townhouse NE 172
Medina Housing Cooperative Medina Housing Cooperative Co-op Apartment SE 44
Misty Ridge Housing Cooperative Misty Ridge Housing Cooperative Co-op Townhouse NE 70
Mosaico Housing Cooperative Mosaico Housing Cooperative Co-op Apartment SW 29
Norman Bethune Cooperative Housing Association
Norman Bethune Cooperative Co-op Apartment NE 24
Nova Vita Housing Cooperative Nova Vita Housing Cooperative Co-op Apartment /
Townhouse NE 56
Oaklands Housing Cooperative Oaklands Housing Cooperative Co-op Apartment SW 73
Pine Ridge Cooperative Pine Ridge Housing Cooperative Co-op Townhouse NE 88
Post 83 Cooperative Housing Association
Post 83 Housing Cooperative Co-op Apartment SW 181

B U R N A B Y H O U S I N G P R O F I L E – 2 0 1 6 B U R N A B Y H O U S I N G P R O F I L E – 2 0 1 6178 179
OPERATOR DEVELOPMENT NAME SERVICE FOCUS
STRUCTURE TYPE QUADRANT UNITS
Rainbow's End Housing Cooperative
Rainbow's End Housing Cooperative Co-op Apartment SW 39
Spectrum Housing Cooperative Spectrum Housing Cooperative Co-op Apartment SW 44
Sunset Heights Housing Cooperative
Sunset Heights Housing Cooperative Co-op Apartment /
Townhouse SW 46
Whattlekainum Cooperative Housing Association
Whattlekainum Housing Cooperative Co-op Townhouse NE 103
TOTAL CO-OP HOUSING UNITS 1,900
C O O P E R AT I V E H O U S I N G - C O N T I N U E D G L O S S A R Y
PA R T 7
AFFORDABLE HOUSING Housing that should not cost more than 30 percent of a household’s gross income regardless of whether the household is living in market or non-market housing.
ASSISTED LIVING Self-contained apartments for seniors or people with disabilities or lifestyle challenges who need some support but who do not need 24 hour facility care.
CENSUS FAMILY Refers to a married couple (with or without children), a common-law couple (with or without children) or a lone parent family.
COMMUNITY CARE FACILITIES
Provincially licensed residences that provide ongoing care services to three or more residents.
COMMUNITY LAND TRUSTS
Non-profit organizations whose mission is to preserve land for particular purposes, including affordable housing. To that end, a land trust may acquire land and lease it to individuals or non-market housing providers on a long-term basis (e.g., 99 years) at an affordable rate.
COOPERATIVE HOUSING Housing development where residents who are members of the cooperative own and manage the building. Each member has one vote and members work together to keep their housing well-managed and affordable.
DENSITY BONUS POLICY City policy that permits developers to build at higher densities than current zoning allows in exchange for community amenity contributions (such as affordable housing units or community facilities) or cash-in-lieu contributions (which are pooled to construct community amenities).
DUPLEX HOMES A residential building that contains two dwelling units stacked on top of each other.
DWELLING Refers to a set of living quarters in which a person or a group of persons reside or could reside.
EMERGENCY SHELTER These facilities provide temporary shelter for homeless individuals. Emergency shelters may be seasonal or year-round; many are operated by non-profit societies with government supports, such as funding for construction and/or operation.
GROUP HOME A Provincially licensed residential care facility for not more than 6 persons in care.
HIGH-RISE APARTMENT A dwelling unit in a building that has five or more storeys.
HOME OWNERSHIP Home ownership encompasses a range of options including strata, leasehold, or freehold/fee simple interest in a residential property.
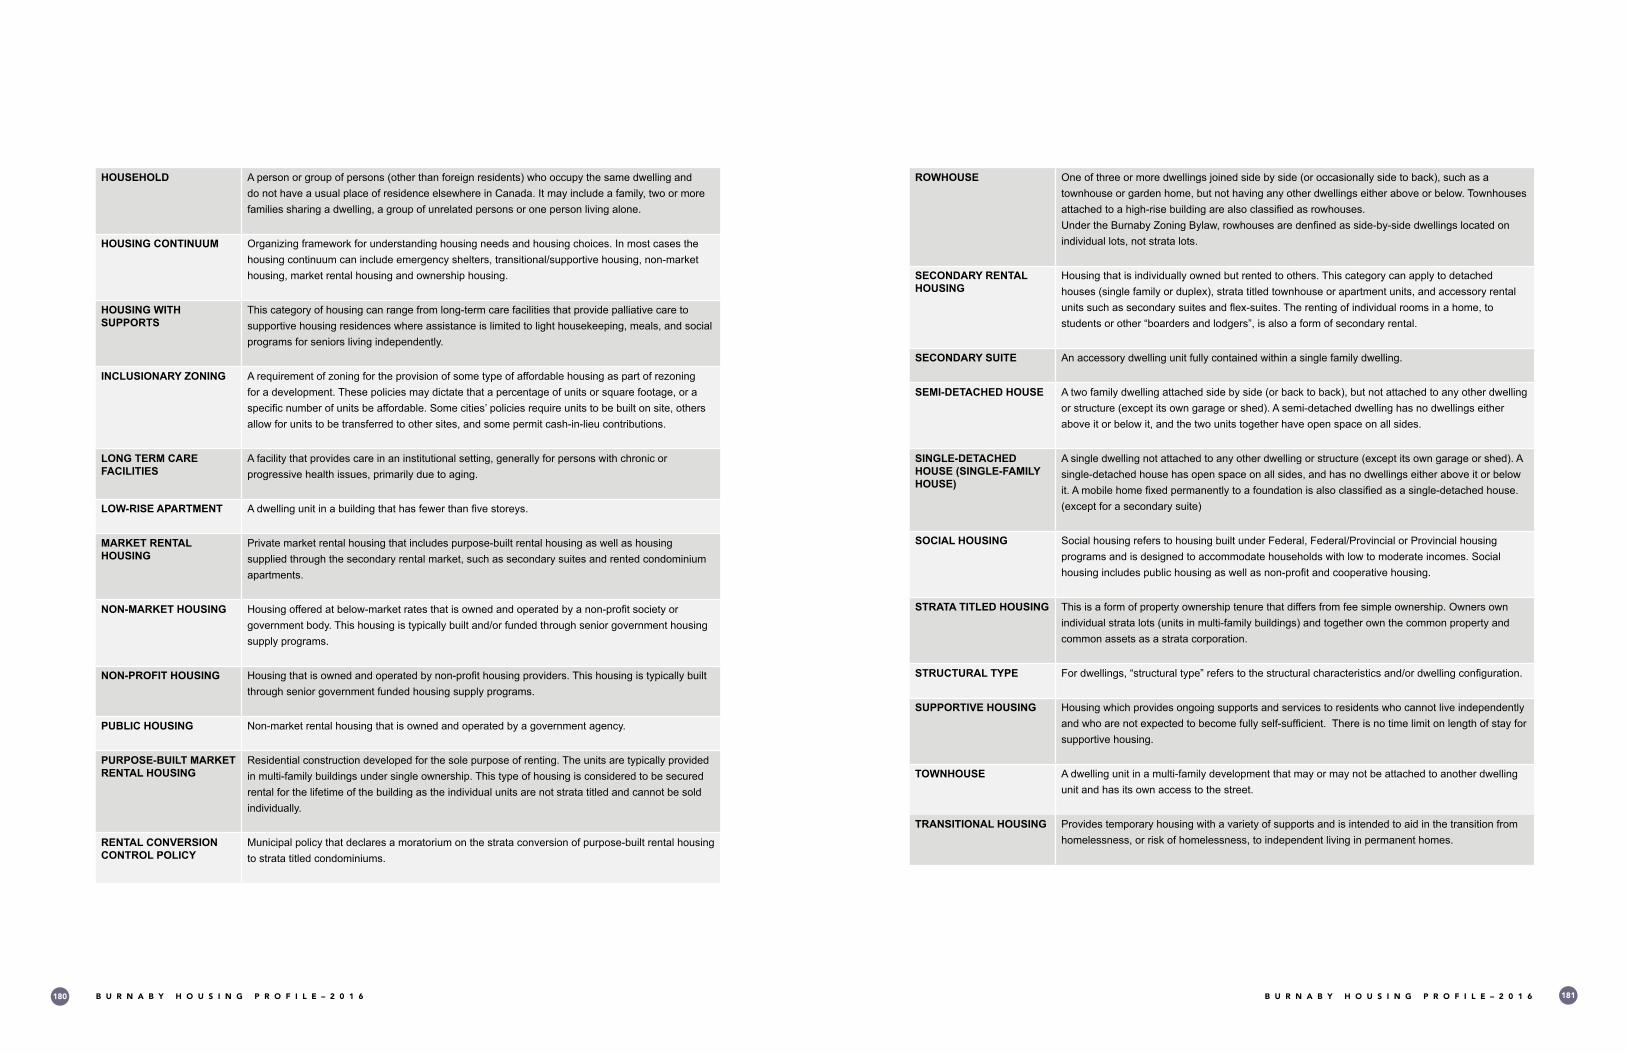
B U R N A B Y H O U S I N G P R O F I L E – 2 0 1 6 B U R N A B Y H O U S I N G P R O F I L E – 2 0 1 6180 181
ROWHOUSE One of three or more dwellings joined side by side (or occasionally side to back), such as a townhouse or garden home, but not having any other dwellings either above or below. Townhouses attached to a high-rise building are also classified as rowhouses.Under the Burnaby Zoning Bylaw, rowhouses are denfined as side-by-side dwellings located on individual lots, not strata lots.
SECONDARY RENTAL HOUSING
Housing that is individually owned but rented to others. This category can apply to detached houses (single family or duplex), strata titled townhouse or apartment units, and accessory rental units such as secondary suites and flex-suites. The renting of individual rooms in a home, to students or other “boarders and lodgers”, is also a form of secondary rental.
SECONDARY SUITE An accessory dwelling unit fully contained within a single family dwelling.
SEMI-DETACHED HOUSE A two family dwelling attached side by side (or back to back), but not attached to any other dwelling or structure (except its own garage or shed). A semi-detached dwelling has no dwellings either above it or below it, and the two units together have open space on all sides.
SINGLE-DETACHED HOUSE (SINGLE-FAMILY HOUSE)
A single dwelling not attached to any other dwelling or structure (except its own garage or shed). A single-detached house has open space on all sides, and has no dwellings either above it or below it. A mobile home fixed permanently to a foundation is also classified as a single-detached house. (except for a secondary suite)
SOCIAL HOUSING Social housing refers to housing built under Federal, Federal/Provincial or Provincial housing programs and is designed to accommodate households with low to moderate incomes. Social housing includes public housing as well as non-profit and cooperative housing.
STRATA TITLED HOUSING This is a form of property ownership tenure that differs from fee simple ownership. Owners own individual strata lots (units in multi-family buildings) and together own the common property and common assets as a strata corporation.
STRUCTURAL TYPE For dwellings, “structural type” refers to the structural characteristics and/or dwelling configuration.
SUPPORTIVE HOUSING Housing which provides ongoing supports and services to residents who cannot live independently and who are not expected to become fully self-sufficient. There is no time limit on length of stay for supportive housing.
TOWNHOUSE A dwelling unit in a multi-family development that may or may not be attached to another dwelling unit and has its own access to the street.
TRANSITIONAL HOUSING Provides temporary housing with a variety of supports and is intended to aid in the transition from homelessness, or risk of homelessness, to independent living in permanent homes.
HOUSEHOLD A person or group of persons (other than foreign residents) who occupy the same dwelling and do not have a usual place of residence elsewhere in Canada. It may include a family, two or more families sharing a dwelling, a group of unrelated persons or one person living alone.
HOUSING CONTINUUM Organizing framework for understanding housing needs and housing choices. In most cases the housing continuum can include emergency shelters, transitional/supportive housing, non-market housing, market rental housing and ownership housing.
HOUSING WITH SUPPORTS
This category of housing can range from long-term care facilities that provide palliative care to supportive housing residences where assistance is limited to light housekeeping, meals, and social programs for seniors living independently.
INCLUSIONARY ZONING A requirement of zoning for the provision of some type of affordable housing as part of rezoning for a development. These policies may dictate that a percentage of units or square footage, or a specific number of units be affordable. Some cities’ policies require units to be built on site, others allow for units to be transferred to other sites, and some permit cash-in-lieu contributions.
LONG TERM CARE FACILITIES
A facility that provides care in an institutional setting, generally for persons with chronic or progressive health issues, primarily due to aging.
LOW-RISE APARTMENT A dwelling unit in a building that has fewer than five storeys.
MARKET RENTAL HOUSING
Private market rental housing that includes purpose-built rental housing as well as housing supplied through the secondary rental market, such as secondary suites and rented condominium apartments.
NON-MARKET HOUSING Housing offered at below-market rates that is owned and operated by a non-profit society or government body. This housing is typically built and/or funded through senior government housing supply programs.
NON-PROFIT HOUSING Housing that is owned and operated by non-profit housing providers. This housing is typically built through senior government funded housing supply programs.
PUBLIC HOUSING Non-market rental housing that is owned and operated by a government agency.
PURPOSE-BUILT MARKET RENTAL HOUSING
Residential construction developed for the sole purpose of renting. The units are typically provided in multi-family buildings under single ownership. This type of housing is considered to be secured rental for the lifetime of the building as the individual units are not strata titled and cannot be sold individually.
RENTAL CONVERSION CONTROL POLICY
Municipal policy that declares a moratorium on the strata conversion of purpose-built rental housing to strata titled condominiums.

B U R N A B Y H O U S I N G P R O F I L E – 2 0 1 6 B U R N A B Y H O U S I N G P R O F I L E – 2 0 1 6182 183
R E F E R E N C E S A N D E N D N O T E S
PA R T 7
1 Metro Vancouver. Metro Vancouver Data Housing Book. November 2015. Burnaby ranked third after Vancouver (23,507 units) and Surrey (6,546 units) in December 2014. The totals primarily include non-market rental housing and cooperative housing, and excluded shelter beds, transitional housing beds, and most group home, assisted living and supportive housing units.
2 City of Burnaby: Community Plan Areas Map.
3 City of Burnaby property records, 2015.
4 Statistics Canada. 2011 National Household Survey table, downloaded from: Statistics Canada https://www12.statcan.gc.ca/nhs-enm/2011/dp-pd/prof/details/download-telecharger/comprehensive/comp-csv-tab-nhs-enm.cfm?Lang=E . Reformatted to:..\map_source_data\160716_NHS_Table_Burnaby_2011.xlsxFile Downloaded 13/07/2016.
5 Community Care and Assisted Living Regulation (2004), http://www.bclaws.ca/civix/document/id/complete/statreg/217_2004
6 BC Housing. http://www.bchousing.org/Options/Subsidized_Housing/Apply/Eligibility/Income_requirementsHousing Income Limits represent the income required to pay the average market rent for an appropriately sized unit in the private market. Average rents are derived from CMHC’s annual Rental Market Survey. The size of unit required by a household is governed by federal/provincial occupancy standards. HILs vary throughout the Province, reflecting the average market rents in different locales.
7 This definition is a widely recognized standard in Canada and is used by the Canada Mortgage and Housing Corporation (CMHC).
8 City of Burnaby. Affordable Housing and Homelessness – A Response to Issues and Proposals. February 19, 2007.
Canadian Mortgage and Housing Corporation (CMHC).Understanding Private Rental Housing Investment in Canada, CMHC Research Report. 1999.
Clayton Research Associates, Ltd. Economic Impact of Federal Tax Legislation on the Rental Housing Market in Canada. November 1998.
9 Part 14 of the BC Local Government Act provides land use and zoning powers to local governments.
10 Part 14 of the Local Government Act provides land use and zoning powers to local governments.
Section 15(1) of the Community Charter authorizes local government to issue licences, permits, and approvals in order to exercise those land use and zoning powers.
11 Metro Vancouver. Metro Vancouver 2040: Shaping our Future. 2011.
12 Section 8(3)(l) and Section 53(2) of the Community Charter establish local government authority regarding buildings and other structures.
13 Section 7.8 of the Burnaby Zoning Bylaw regulates rezoning applications.
Burnaby Procedure Bylaw for regulations regarding Public Hearings, Council meetings, and bylaw readings.

B U R N A B Y H O U S I N G P R O F I L E – 2 0 1 6 B U R N A B Y H O U S I N G P R O F I L E – 2 0 1 6184 185
14 Metro Vancouver. Metro Vancouver Housing and Transportation Cost Burden Study. 2015.
15 Statistics Canada. 2011 National Household Survey (NHS) Profile. Statistics Canada Catalogue no. 99-004-XWE. Ottawa.
16 Metro Vancouver. Metro Vancouver 2040: Shaping our Future. 2011.
17 Metro Vancouver. Metro Vancouver Housing and Transportation Cost Burden Study. 2015.
18 Translink. Metro Vancouver Regional Trip Diary Survey Analysis Report. February 2013.Mode share for all trip purposes, Burnaby and New Westminster sub-region.
19 Canadian Automobile Association, Driving Costs Calculator: http://caa.ca/car_costs/
20 Translink monthly fares for 1, 2, and 3 zone travel. http://www.translink.ca/en/Fares-and-Passes.aspx
21 Metro Vancouver. Metro Vancouver Housing and Transportation Cost Burden Study. 2015.
22 Federation of Canadian Municipalities. Rising to the Moment: FCM Federal Budget Submission 2016. https://www.fcm.ca/Documents/reports/2016-FCM-FedBudgetSubmission-EN.pdf
23 Principal legislation affecting housing in Burnaby includes the National Housing Act, CMHC Act, BC Community Charter, BC Local Government Act, BC Residential Tenancy Act, and the BC Building Code Act. Model building codes, including the National Building Code and the BC Building Code, are adopted by legislation at either the Provincial/Territorial or local government level. The BC Building Code applies to all municipalities in BC except the City of Vancouver and some Federal lands.
24 City of Burnaby. Affordable Housing and Homelessness – A Response to Issues and Proposals. February 19, 2007.
25 City of Burnaby. Official Community Plan for Burnaby, British Columbia. Bylaw #10709. Adopted 1998 June 15. Updated and Revised May 2014.
26 City of Burnaby. Official Community Plan for Burnaby, British Columbia. Bylaw #10709. Adopted 1998 June 15. Updated and Revised May 2014. Appendix 1 – Regional Context Statement.
27 City of Burnaby. Burnaby Social Sustainability Strategy. June 2011.
28 City of Burnaby. Affordable Housing and Homelessness – A Response to Issues and Proposals. February 19, 2007.
29 City of Burnaby. Growth Management and Housing Policies in Burnaby. Council Report. November 4, 2015.
30 Section 482 of the Local Government Act allows zoning bylaws to include density bonus provisions subject to conditions.
31 City of Burnaby. Burnaby’s Community Benefit Bonus Policy: Achieving Community Amenities - Program Report 1997-2014. May 2014.
32 More information on the PIAH program can be found on the BC Housing website: http://www.bchousing.org/Initiatives/Creating/PIAH
33 City of Burnaby. Burnaby’s Community Benefit Bonus Policy: Achieving Community Amenities - Program Report 1997-2014. May 2014.
34 City of Burnaby, Council Meeting Minutes, July 8, 1974. For the text of the Rental Conversion Policy, see City of Burnaby website: https://www.burnaby.ca/Assets/city+services/planning/Rental+Conversion+Control+Policy.pdf
35 City of Burnaby. Tenant Assistance Policy. Council Report. April 23, 2015. See also City of Burnaby, Council Meeting Minutes, May 4, 2015. For the text of the policy, see City of Burnaby website: https://www.burnaby.ca/Assets/Tenant+Assistance+Policy.pdf
36 Secondary suites are regulated in Section 3 of the Burnaby Zoning Bylaw (see Definitions – “Accessory Use” and “Secondary Suite,”). Complete information on the Secondary Suites Program, including all pertinent Council reports, can be found on the City of Burnaby website: https://www.burnaby.ca/City-Services/Building/Secondary-Suite-Program.html
37 City of Burnaby. Proposed Amendments P11 and P11e Zoning Districts. Council Report. October 30, 2002.
See also City of Burnaby, Council Meeting Minutes, January 20, 2003. Flex Suites are defined in Section 3 of the Burnaby Zoning Bylaw, and further regulated in Section 511.2(4).
38 Government of British Columbia. (2016). BC Stats – Population Estimates. Retrieved August 18, 2016, from http://www.bcstats.gov.bc.ca/StatisticsBySubject/Demography/PopulationEstimates.aspx
39 Statistics Canada. 1981-2011 Census of Canada.
Metro Vancouver. (2011). Metro Vancouver 2040 – Shaping Our Future. Retrieved from http://www.metrovancouver.org/services/regional-planning/PlanningPublications/RGSAdoptedbyGVRDBoard.pdf
40 Metro Vancouver. (2011). Metro Vancouver 2040 – Shaping Our Future. Retrieved from http://www.metrovancouver.org/services/regional-planning/PlanningPublications/RGSAdoptedbyGVRDBoard.pdf
41 Statistics Canada 1981-2011 Census of Canada.
Metro Vancouver. (2011). Metro Vancouver 2040 – Shaping Our Future. Retrieved from http://www.metrovancouver.org/services/regional-planning/PlanningPublications/RGSAdoptedbyGVRDBoard.pdf
42 Statistics Canada. 2001-2011 Census of Canada: Profile Data. Ottawa, Canada. Statistics Canada; Tetrad Computer Applications, Vancouver, BC.
43 Ibid.
44 Ibid.
45 Ibid.
46 Ibid.
47 Ibid.
48 Ibid.
49 Statistics Canada, 2011 Census of Canada.
50 Statistics Canada. 2011 Census of Canada: Profile Data. Ottawa, Canada. Statistics Canada; Tetrad Computer Applications, Vancouver, BC.
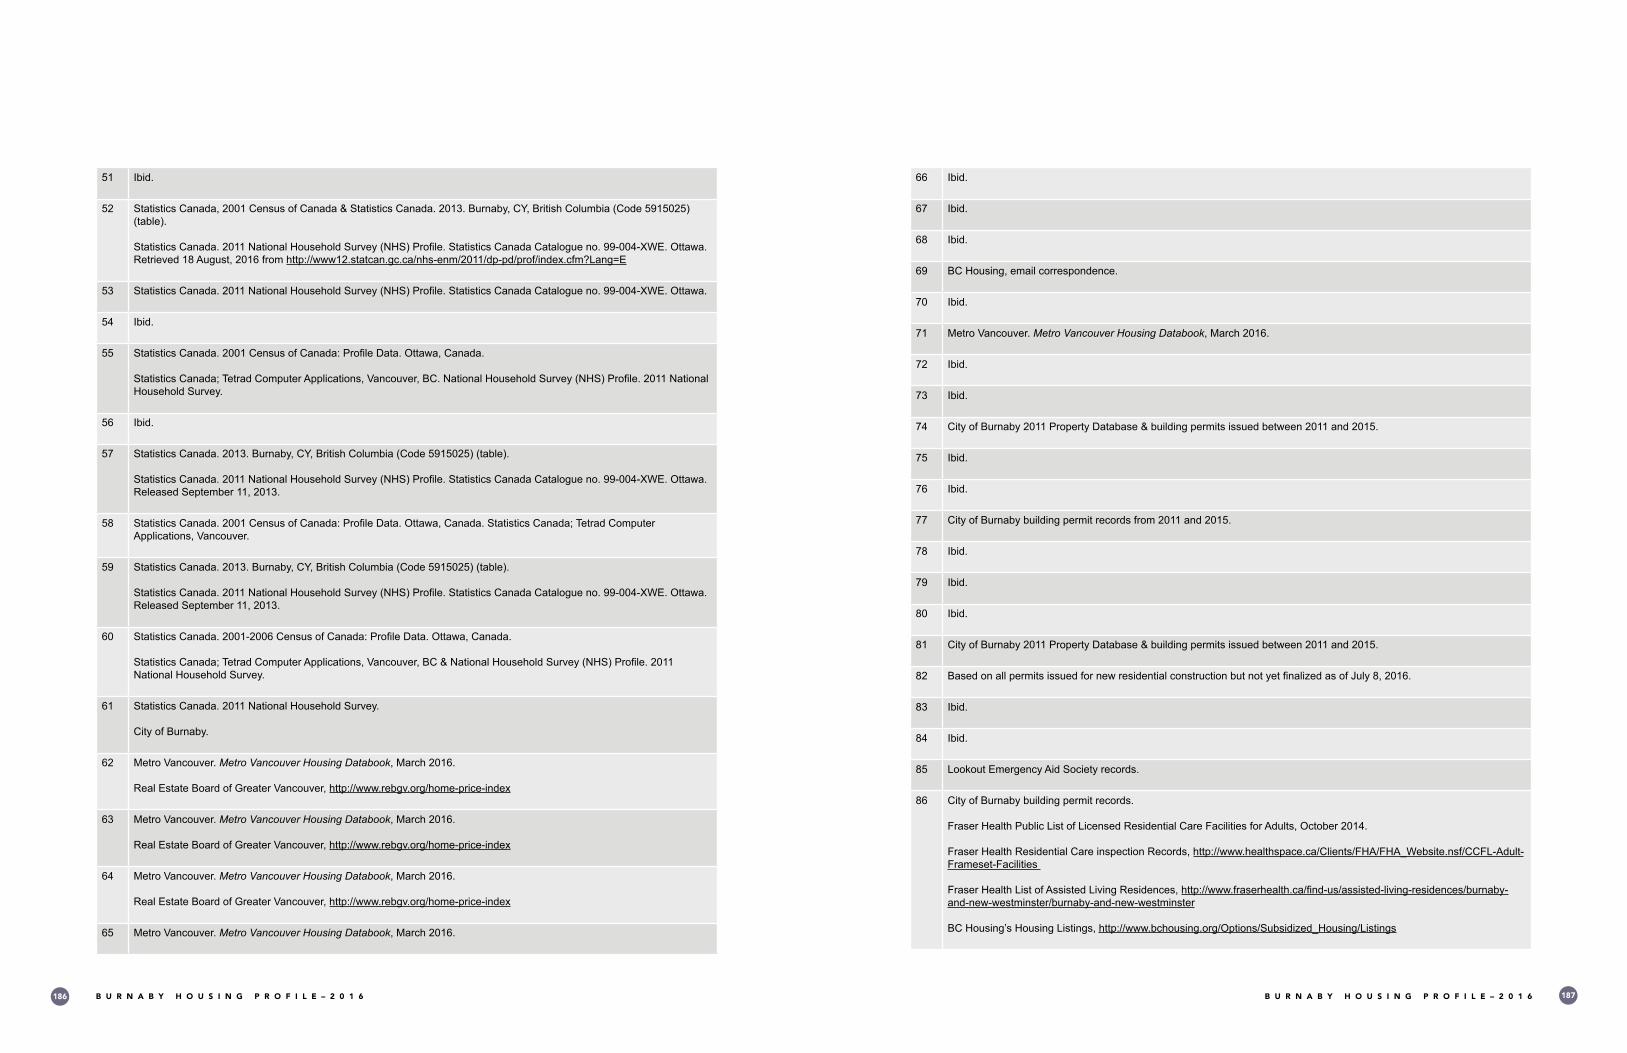
B U R N A B Y H O U S I N G P R O F I L E – 2 0 1 6 B U R N A B Y H O U S I N G P R O F I L E – 2 0 1 6186 187
51 Ibid.
52 Statistics Canada, 2001 Census of Canada & Statistics Canada. 2013. Burnaby, CY, British Columbia (Code 5915025) (table).
Statistics Canada. 2011 National Household Survey (NHS) Profile. Statistics Canada Catalogue no. 99-004-XWE. Ottawa. Retrieved 18 August, 2016 from http://www12.statcan.gc.ca/nhs-enm/2011/dp-pd/prof/index.cfm?Lang=E
53 Statistics Canada. 2011 National Household Survey (NHS) Profile. Statistics Canada Catalogue no. 99-004-XWE. Ottawa.
54 Ibid.
55 Statistics Canada. 2001 Census of Canada: Profile Data. Ottawa, Canada.
Statistics Canada; Tetrad Computer Applications, Vancouver, BC. National Household Survey (NHS) Profile. 2011 National Household Survey.
56 Ibid.
57 Statistics Canada. 2013. Burnaby, CY, British Columbia (Code 5915025) (table).
Statistics Canada. 2011 National Household Survey (NHS) Profile. Statistics Canada Catalogue no. 99-004-XWE. Ottawa. Released September 11, 2013.
58 Statistics Canada. 2001 Census of Canada: Profile Data. Ottawa, Canada. Statistics Canada; Tetrad Computer Applications, Vancouver.
59 Statistics Canada. 2013. Burnaby, CY, British Columbia (Code 5915025) (table).
Statistics Canada. 2011 National Household Survey (NHS) Profile. Statistics Canada Catalogue no. 99-004-XWE. Ottawa. Released September 11, 2013.
60 Statistics Canada. 2001-2006 Census of Canada: Profile Data. Ottawa, Canada.
Statistics Canada; Tetrad Computer Applications, Vancouver, BC & National Household Survey (NHS) Profile. 2011 National Household Survey.
61 Statistics Canada. 2011 National Household Survey.
City of Burnaby.
62 Metro Vancouver. Metro Vancouver Housing Databook, March 2016.
Real Estate Board of Greater Vancouver, http://www.rebgv.org/home-price-index
63 Metro Vancouver. Metro Vancouver Housing Databook, March 2016.
Real Estate Board of Greater Vancouver, http://www.rebgv.org/home-price-index
64 Metro Vancouver. Metro Vancouver Housing Databook, March 2016.
Real Estate Board of Greater Vancouver, http://www.rebgv.org/home-price-index
65 Metro Vancouver. Metro Vancouver Housing Databook, March 2016.
66 Ibid.
67 Ibid.
68 Ibid.
69 BC Housing, email correspondence.
70 Ibid.
71 Metro Vancouver. Metro Vancouver Housing Databook, March 2016.
72 Ibid.
73 Ibid.
74 City of Burnaby 2011 Property Database & building permits issued between 2011 and 2015.
75 Ibid.
76 Ibid.
77 City of Burnaby building permit records from 2011 and 2015.
78 Ibid.
79 Ibid.
80 Ibid.
81 City of Burnaby 2011 Property Database & building permits issued between 2011 and 2015.
82 Based on all permits issued for new residential construction but not yet finalized as of July 8, 2016.
83 Ibid.
84 Ibid.
85 Lookout Emergency Aid Society records.
86 City of Burnaby building permit records.
Fraser Health Public List of Licensed Residential Care Facilities for Adults, October 2014.
Fraser Health Residential Care inspection Records, http://www.healthspace.ca/Clients/FHA/FHA_Website.nsf/CCFL-Adult-Frameset-Facilities
Fraser Health List of Assisted Living Residences, http://www.fraserhealth.ca/find-us/assisted-living-residences/burnaby-and-new-westminster/burnaby-and-new-westminster
BC Housing’s Housing Listings, http://www.bchousing.org/Options/Subsidized_Housing/Listings

B U R N A B Y H O U S I N G P R O F I L E – 2 0 1 6 B U R N A B Y H O U S I N G P R O F I L E – 2 0 1 6188 189
87 Ibid.
88 Ibid.
89 Ibid.
90 Ibid.
91 Ibid.
92 Ibid.
93 Ibid.
94 Metro Vancouver. Metro Vancouver Housing Databook, March 2016 .
95 City of Burnaby 2011 Property Database.
Cooperative Housing Federation of B.C. http://www.chf.bc.ca/
96 City of Burnaby building permit records.
Fraser Health Public List of Licensed Residential Care Facilities for Adults, October 2014.
Fraser Health Residential Care inspection Records, http://www.healthspace.ca/Clients/FHA/FHA_Website.nsf/CCFL-Adult-Frameset-Facilities
Fraser Health List of Assisted Living Residences, http://www.fraserhealth.ca/find-us/assisted-living-residences/burnaby-and-new-westminster/burnaby-and-new-westminster
BC Housing’s Housing Listings, http://www.bchousing.org/Options/Subsidized_Housing/Listings
97 Estimated from City of Burnaby 2011 Property Database & building permits issued between 2011 and 2015.
98 Ibid.
99 Ibid.
100 Ibid.
101 Ibid.
102 BC Assessment Records, June 15, 2016.
103 City of Burnaby building permit records, August 23, 2016.
104 City of Burnaby 2011 Property Database & building permits issued between 2011 and 2015.
105 Ibid.
106 City of Burnaby 2011 Property Database, building permits issued between 2011 and 2015.
BC Assessment Records. June 15, 2016.
107 Ibid.
108 City of Burnaby building permit records from 2011 and 2015.
109 City of Burnaby rezoning public hearing reports and building permit records.
110 City of Burnaby 2011 Property Database & building permits issued between 2011 and 2015.
111 Ibid.
112 Ibid.
113 Statistics Canada. 2011 National Household Survey.
114 Union of British Columbia Municipalities (UBCM), Resolutions and Responses, http://www.ubcm.ca/EN/main/resolutions/resolutions/resolutions-responses.html
115 Federation of Canadian Municipalities. Resolutions, http://www.fcm.ca/home/about-us/corporate-resources/fcm-resolutions.htm
116 City of Burnaby records.
117 City of Burnaby records.
118 Source material for the case studies include: City of Burnaby. Burnaby’s Community Benefit Bonus Policy: Achieving Community Amenities - Program Report 1997-2014. May 2014.
Council reports for the rezoning of each included property and for the associated Community Benefit Bonus Policy Housing Fund requests.
City rezoning application and building permit records.
2011 Canada Census – National Household Survey: Limitations
The National Household Survey is a voluntary survey that replaced the compulsory long-form census used in previous years . It complements the census by providing additional information on demographic and socio-economic characteristics . Due to the change from the compulsory long-form census to the voluntary survey, completion rates saw a decline from 6 .5% in 2006 to 26% in 2011 . In response to this, Statistics Canada lowered its suppression standards by accepting a non-response rate of 50% for 2011 compared to the 25% cut-off in 2006 . This leads to a higher rate of inaccuracy .
For the 2011 National Household Survey (NHS) estimates, the global non-response rate (GNR) is used as an indicator of data quality . This indicator combines complete non-response (household) and partial non-response (question) into a single rate . The value of the GNR is presented to users . A smaller GNR indicates a lower risk of non-response bias and as a result, lower risk of inaccuracy . For more information, please refer to the National Household Survey User Guide, 2011 . For the City of Burnaby, the GNR rate is 23 .6%


