
brightsourceenergy.com
BrightSource Energy
Opportunities and
Case for CSP
Desert Solar Saud Arabia
September 17, 2014
Ambassador Thomas Riley

Strategic Partners & Customers
Project Equity Investors
Enhanced Oil Recovery Applications
International Business Expansion
Key Electricity Generation Customers
Engineering, Procurement & Construction
Proven Access to Growth Capital
Partners & Customers

© ALSTOM 2014. All rights reserved. Information contained in this document is indicative only. No representation or warranty is given or should be relied on that it is complete or correct or will apply to any particular project. This will depend on the technical and commercial circumstances. It is provided without liability and is subject to change without notice. Reproduction, use or disclosure to third parties, without express written authority, is strictly prohibited.
Presentation title - 18/09/2014 – P 3
Alstom Presence: >400 people Main references
• Thermal Power
− 2013: Yanbu 3, 5x620 MW for power & desal
− 2013: Shuqaiq, 4x720MW STG
− 2012: Riyadh PP12 gas-fired power plant,
2x342MW ST and 8xHRSG
− 2008: Shoaiba III, 3x400MW
− 2004: Shoabia II, 6x400MW
− 1998: Shoaiba I, 5x400MW
− SWFGD in Marafiq, Yanbu 5+6
− 69xGT11
− 21xGT9
− 1xGT8
• Transport
− 2013: Metro Riyadh, 3 lines, €1.2 billion
• Grid
− 2012: Dawadmi substation, 21x380 kV gas-insulated switchgear
− 2009: Gulf largest HVDV converter station (3x600MW) and network management system
− 400 kV gas-insulated substation in Jubail − 18 substations
60+ years of presence
Corporate
Grid
Transport
Thermal Power
Riyadh
Grid
Al Khobar
Grid
Thermal Power
Jeddah
Thermal Power
Shoaiba
Alstom in Saudi Arabia

Concentrating
Solar Power (CSP)
How it Works

What is Concentrating Solar Power?

Where does CSP work best?
Source: CSP Alliance Technical Report dated September 2014
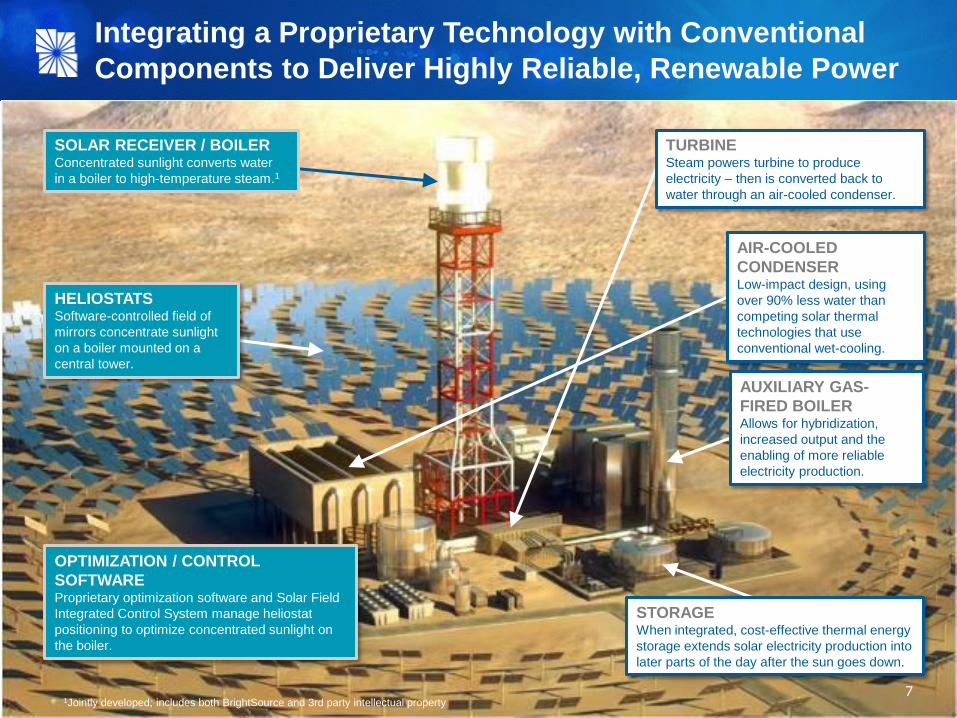
Integrating a Proprietary Technology with Conventional
Components to Deliver Highly Reliable, Renewable Power
HELIOSTATS Software-controlled field of
mirrors concentrate sunlight
on a boiler mounted on a
central tower.
OPTIMIZATION / CONTROL
SOFTWARE Proprietary optimization software and Solar Field
Integrated Control System manage heliostat
positioning to optimize concentrated sunlight on
the boiler.
STORAGE When integrated, cost-effective thermal energy
storage extends solar electricity production into
later parts of the day after the sun goes down.
AIR-COOLED
CONDENSER Low-impact design, using
over 90% less water than
competing solar thermal
technologies that use
conventional wet-cooling.
AUXILIARY GAS-
FIRED BOILER Allows for hybridization,
increased output and the
enabling of more reliable
electricity production.
TURBINE Steam powers turbine to produce
electricity – then is converted back to
water through an air-cooled condenser.
7
SOLAR RECEIVER / BOILER Concentrated sunlight converts water
in a boiler to high-temperature steam.1
1Jointly developed; includes both BrightSource and 3rd party intellectual property

Alstom & BrightSource Energy Partnership
Solar Receiver
Steam Generator
Solar field control system Power Block
Heliostats
Air Cooled Condenser
Storage
We combine Alstom’s extensive experience in the field of turnkey power
plants and key power equipment (e.g. steam turbines and solar receiver
steam generator) with BrightSource’s LPT solar thermal technology

Heliostats: Intelligent and Precise
Heliostats individually positioned in field to optimize annual plant output
Account for real time weather, sun location, and wind
Heliostats “communicate” with each other to optimize radiation collection
and solar receiver heat balance
Two flat glass mirrors (2.3m x 3.3m) mounted on a single pylon
equipped with a computer-controlled drive system
System delivers beam accuracy in excess of one mile

Solar Field Integration and Control System (SFINCS)
Algorithmic software determines the optimal position of each heliostat accounting
for the unique conditions of each project site
The SFINCS control system manages distribution of energy across the solar
receiver using real-time heliostat-aiming and closed-loop feedback
On-site weather systems, and visual and infrared cameras provide real-time
feedback into advanced algorithms for solar field management
Proprietary optimization and control software maximizes project performance and
power production efficiencies

Enhanced Oil Recovery

BrightSource Technology for Enhanced Oil Recovery

Hybridization for supplemental
production
Hybridization for extended
production
Complete Hybridization
- Integrated Solar Combined Cycle
(ISCC)
- Solar Hybrid Add-On
- Solar Boost
Solar Hybrid Applications for Fossil Baseload Power Plants (1/2)
Solar hybridization allows fossil baseload power plants to reduce fossil fuel
consumption, air pollutants and other regulated emissions.
We offer three unique solar thermal hybrid power plant
configurations for customer specific applications:

Solar Hybrid Applications for Fossil Baseload Power Plants (2/2)
Solar HP steam injected into HP Steam Turbine Energy collection and electricity production
decoupled and separated by a buffer, the thermal
energy storage system
Suitable medium for energy collection and
storage: Molten Salt
Integration of CCPP and Solar Plant
with Direct Steam generation Basic concept hybrid with
Molten Salt Central Receiver (MSCR)
CSP With
Storage
A Critical Role
In Renewable
Energy

Chart Source: NERC – Accommodating High Levels of Variable Generation
Load shape source: California’s Electricity System Supply and Demand Overview, presentation by Jeffrey Byron, Commissioner, State Energy Resources Conservation
and Development Commission (energy commission), to the California State Assembly Utilities and Commerce Committee, Informational Hearing, March 29, 2007.
PV Output Variability
… Requiring additional flexible generation to maintain reliability
Output Variability Impacts Grid Reliability and Increases Costs …

Wind and PV Have Lower Reliability Due to Poor Alignment With System Peak Demand
Additional resources are needed to meet reliability requirements
Load shape source: California’s Electricity System Supply and Demand Overview, presentation by Jeffrey Byron, Commissioner, State Energy Resources Conservation and
Development Commission (energy commission), to the California State Assembly Utilities and Commerce Committee, Informational Hearing, March 29, 2007.
Production output of wind and PV are illustrative. Not drawn to scale with load shape curve.

Integration costs are increasingly being assigned by utilities
to intermittent resources within the selection process
Chart Source: Wiser, Ryan and Bolinger, Mark, Lawrence Berkeley National Laboratory, “2009 Wind Technologies Market Report”, pg 65; and, Navigant Consulting et
al; Large Scale PV Integration Study, Prepared for NV Energy; July 2011 1"Competitive Market Analysis Prepared for BrightSource Energy" (E3, March 2012).
The California Public Utilities Commission Long Term Planning Process methodology applies $7.50/MWh, as a “penalty” for all wind and solar resources in resource ranking and selection.1
According to Energy and
Environmental Economic (E3),
while integration cost estimates
vary by study, there is a
clear upward trend in
integration costs,
per megawatt hour,
as renewables penetration
increases.1
CSP Avoids Real Integration Costs Imposed by Intermittent Resources

Note: CA utility time-of-use factors based on PG&E and SCE data
Load shape source: California’s Electricity System Supply and Demand Overview, presentation by Jeffrey Byron, Commissioner, State Energy Resources Conservation
and Development Commission (energy commission), to the California State Assembly Utilities and Commerce Committee, Informational Hearing, March 29, 2007.
Production output of PV and BrightSource Power Tower are illustrative. Not drawn to scale with load shape curve
Net System Cost is Used by Utilities to Evaluate Cost Competitiveness
Energy storage increases asset utilization and transforms
solar thermal into a high-value, flexible resource

Storage is discharged when most economic to dispatch the power plant
Energy storage enables optimization of
production profile against market prices Production output of PV and CSP are illustrative. Market Price / System Value are representative, not actual, prices.
Integrating Storage Transforms a Solar Thermal Plant into a High-value, Flexible Resource

Capacity value refers to a power plant’s expected available production during peak demand
hours multiplied by forward capacity prices.
Capacity Value = On-Peak Availability Factor % × Plant Capacity (MW) × Capacity Price
Reliable resources, such as solar thermal and natural gas,
have higher capacity value
1On-peak availability factors used for planning from California’s 2010 Long Term Planning Process (LTPP), except Solar Thermal with Storage from Western Wind
and Solar Integration Study, Prepared for NREL by GE Energy, May 2010 and Simple Cycle Natural Gas is a BrightSource management estimate.
Capacity Value Varies According to the Availability of a Resource at System Peak

Projects

Chevron Solar-to-Steam for Thermal EOR
23
Capacity: 29 MWth for thermal EOR
Solar field: 3,822 heliostats
Location: Coalinga, CA
Delivered fully operational project to Chevron (Oct 2011)

Ivanpah Valley Pre-Construction

25

Integration of Supply and Assembly at Site
26

Transportation of Heliostats to Solar Field

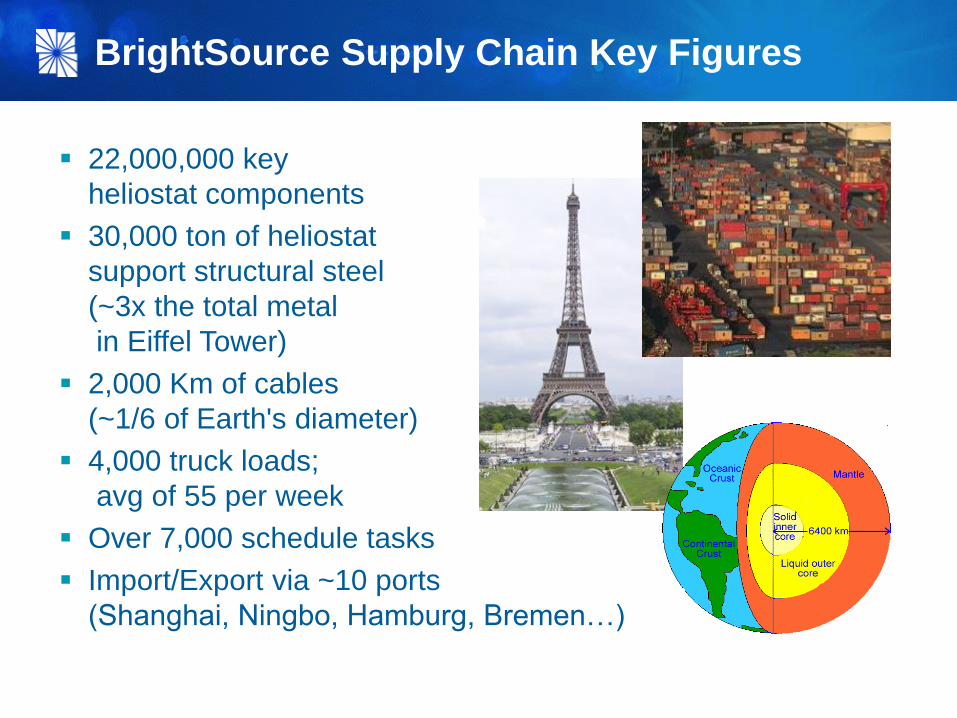
22,000,000 key
heliostat components
30,000 ton of heliostat
support structural steel
(~3x the total metal
in Eiffel Tower)
2,000 Km of cables
(~1/6 of Earth's diameter)
4,000 truck loads;
avg of 55 per week
Over 7,000 schedule tasks
Import/Export via ~10 ports
(Shanghai, Ningbo, Hamburg, Bremen…)
BrightSource Supply Chain Key Figures

Ivanpah: World’s Largest Solar Thermal Project
Photo taken October 2012
Substation (SCE)

BrightSource Energy: Ivanpah - World’s Largest Concentrating Solar Power Plant
3 power plants
- Total 377 MW of electricity generation
- 20+ year contracts with PG&E and SCE
- 140,000 homes served annually
- 173,500 heliostats installed
$2.2B project financing - April 2011
- Equity Investors: NRG, Google & BrightSource
- $1.63B DOE loan guarantee
Key dates
- Commenced construction – October 2010
- Substantial completion – Dec 2013
Unit 3
Unit 2
Construction logistics area
Unit 1
Common Area
Substation (SCE)

Conclusions

BrightSource Solar Plant with Thermal Energy Storage
Extends electricity production into later parts of the day and after sundown,
when valued most by utilities
Reduces the cost of renewable power: - Increases a plant’s capacity factor / higher asset utilization
- Offers higher efficiencies than competing solar thermal power plants
Provides utilities with greater operational flexibility to shape production to account
for variable production of other intermittent resources
Offers utilities and grid operators additional operational and market value: - Balancing and shaping capabilities
- Ancillary services to support a reliable grid

CSP with storage
compares
favorably with PV
and wind when
considering grid
system costs
Impact is greater
as non-
dispatchable
renewables exceed
5% of total
generation
Benefits can
exceed
$60US/MWh
The Benefits of CSP vs PV
Net System Cost = Levelized
Cost of Energy + Transmission Cost
+ Integration Cost – Energy Benefits
–Ancillary Benefits –Capacity
Benefits
Free Report:
http://www.brightsourceenergy.com/new-
report#.VBNAaufwmVu

brightsourceenergy.com


