There are some things that are so big that
they have implications for everyone,
whether we want it or not.
Big Data is one of those things, and is
completely transforming the way we do
business and is impacting most other
parts of our lives.
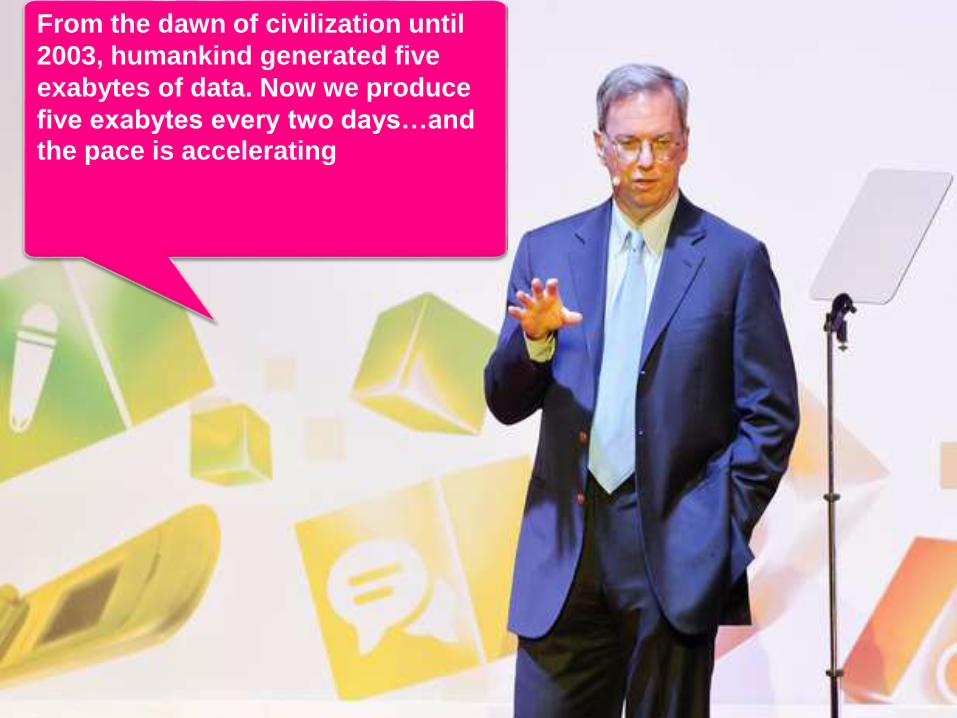
From the dawn of civilization until
2003, humankind generated five
exabytes of data. Now we produce
five exabytes every two days…and the pace is accelerating
Activity Data
Conversation Data
Photo and Video Image Data
Sensor Data
The Internet of Things Data
Simple activities like listening to music or reading a book are now generating data. Digital music players and eBooks collect data on our activities. Your smart phone collects data on how you use it and your web browser collects information on what you are searching for. Your credit card company collects data on where you shop and your shop collects data on what you buy. It is hard to imagine any activity that does not generate data.
Our conversations are now digitally recorded. It all started with emails but nowadays most of our conversations leave a digital trail. Just think of all the conversations we have on social media sites like Facebook or Twitter. Even many of our phone conversations are now digitally recorded.
Just think about all the pictures we take on our smart phones or digital cameras. We upload and share 100s of thousands of them on social media sites every second. The increasing amounts of CCTV cameras take video images and we up-load hundreds of hours of video images to YouTube and other sites every minute .
We are increasingly surrounded by sensors that collect and share data. Take your smart phone, it contains a global positioning sensor to track exactly where you are every second of the day, it includes an accelerometer to track the speed and direction at which you are travelling. We now have sensors in many devices and products.
We now have smart TVs that are able to collect and process data, we have smart watches, smart fridges, and smart alarms. The Internet of Things, or Internet of Everything connects these devices so that e.g. the traffic sensors on the road send data to your alarm clock which will wake you up earlier than planned because the blocked road means you have to leave earlier to make your 9a.m meeting…
• Volume• Velocity• Variety • Veracity
…refers to the vast amounts of data generated every second. We are not talking Terabytes but Zettabytes or Brontobytes. If we take all the data generated in the world between the beginning of time and 2008, the same amount of data will soon be generated every minute. New big data tools use distributed systems so that we can store and analyse data across databases that are dotted around anywhere in the world.
…refers to the speed at which new data is generated and the speed at which data moves around. Just think of social media messages going viral in seconds. Technology allows us now to analyse the data while it is being generated (sometimes referred to as in-memory analytics), without ever putting it into databases.
…refers to the different types of data we can now use. In the past we only focused on structured data that neatly fitted into tables or relational databases, such as financial data. In fact, 80% of the world’s data is unstructured (text, images, video, voice, etc.) With big data technology we can now analyse and bring together data of different types such as messages, social media conversations, photos, sensor data, video or voice recordings.
…refers to the messiness or trustworthiness of the data. With many forms of big data quality and accuracy are less controllable (just think of Twitter posts with hash tags, abbreviations, typos and colloquial speech as well as the reliability and accuracy of content) but technology now allows us to work with this type of data.
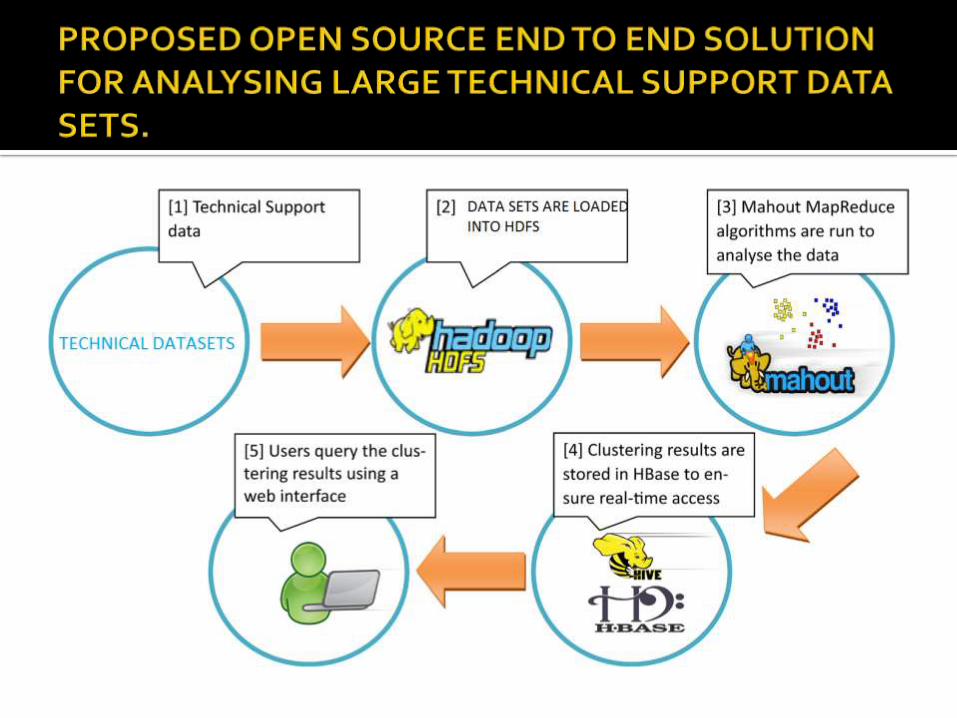
LOGISTIC APPROACH OF BIG DATA FOR CATEGORIZING TECHNICAL SUPPORT REQUESTS USING HADOOP AND MAHOUT COMPONENTS.
Social Media Machine Log Call Center Logs Email Financial Services transactions.
R-PROGRAMMING. HDFS(Map-Reduce). MAHOUT(Clustering algo). H-BASE. HIVE. JAVA/C.
Revolution has created a series of “RevoConnectRs for Hadoop” that will allow an R programmer to manipulate Hadoop data stores directly from HDFS and HBASE, and give R programmers the ability to write MapReduce jobs in R using Hadoop Streaming. RevoHDFS provides connectivity from R to HDFS and RevoHBase provides connectivity from R to HBase. Additionally, RevoHStream allows MapReduce jobs to be developed in R and executed as Hadoop Streaming jobs.
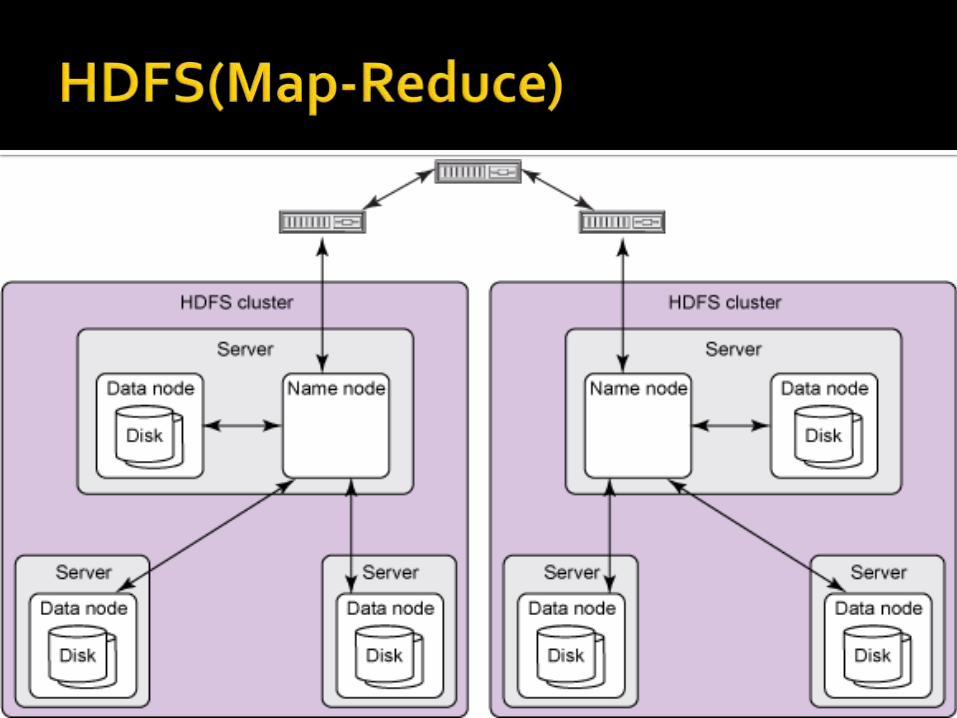
HDFS can be presented as a master/slave architecture.Namenode is treated as master and datanode the slave.Namenode is the server that manages the filesystem namespace and adjust the access to files by the client.It divides the input data into blocks and announces which data block will be stored in which datanode.Datanode is the slave machine that stores the replicas of the partition datasets and serves the data as the request comes.It also performs block creation and deletion
HDFS is managed with the master/slave architecture included with the following components:-
NAMENODE:-This is the master of the HDFS system. It maintains the metadata and manages the blogs that are present on datanodes.
DATANODE:-These are slaves that are deployed on each machine and provide actual storage.They are responsible for serving read and write data request for the clients
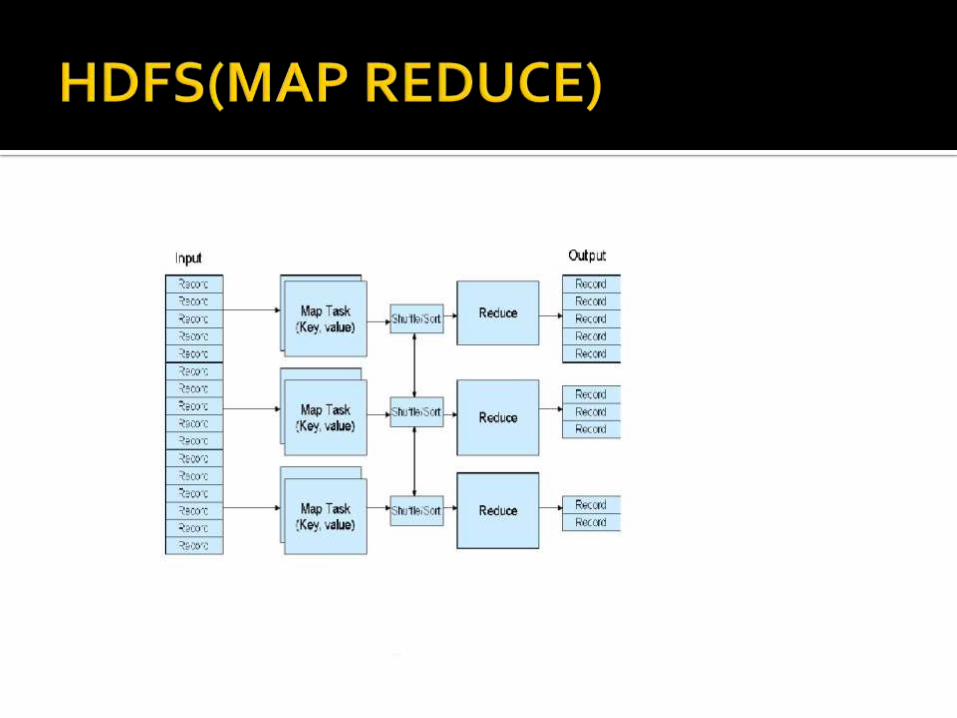
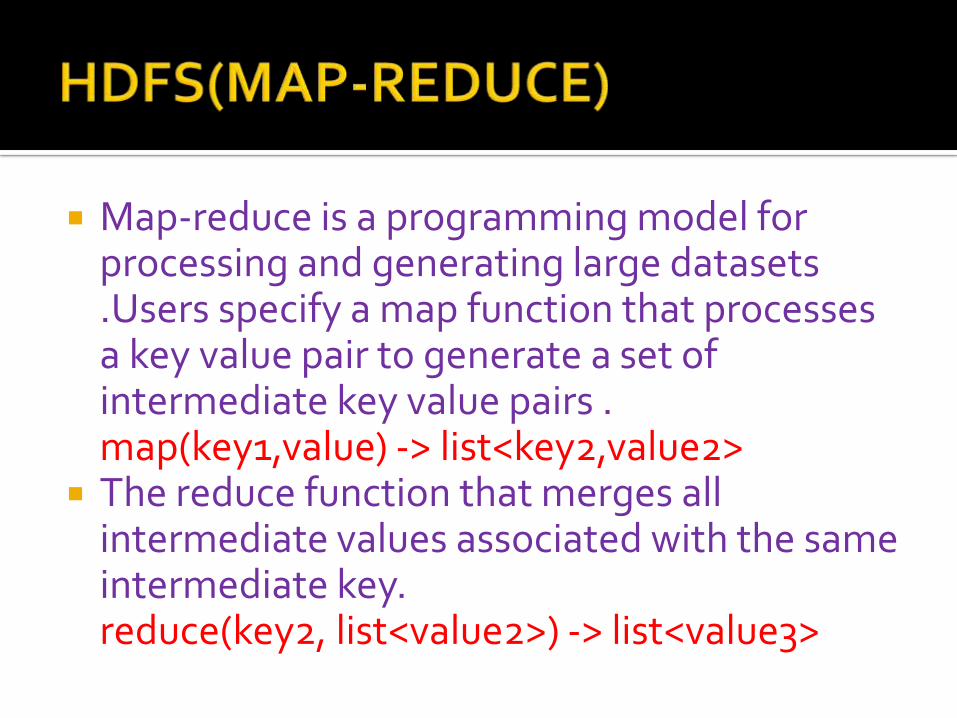
Map-reduce is a programming model for processing and generating large datasets .Users specify a map function that processes a key value pair to generate a set of intermediate key value pairs . map(key1,value) -> list<key2,value2>
The reduce function that merges all intermediate values associated with the same intermediate key. reduce(key2, list<value2>) -> list<value3>
The important innovation of map-reduce is the ability to take a query over a dataset,divide it ,and run it in parallel over multiple nodes. Distributing the computation solves the issue of data too large to fitonto a single machine. Combine this technique
with commodity Linux servers and you have a cost-effective alternative to massive computingarrays.The advantage of map-reduce model is its simplicity because only Map() and Reduce() to be written by user.
Every organization’s data are diverse and particular to their needs. However, there is much less diversity in the kinds of analyses performed on that data. The Mahout project is a library of Hadoop implementations of common analytical computations. Use cases include user collaborative filtering,user recommendations, clustering and classification.
Mahout is an open source machine learning library built on top of Hadoop to provide distributed analytics capabilities. Mahout incorporates a wide range of data mining techniques including collaborative filtering, classification and clustering algorithms.
Mahout supports a wide variety of clustering algorithms including: -
k-means Canopy clustering Fuzzy k-means Dirichlet Clustering Latent Dirichlet Allocation.
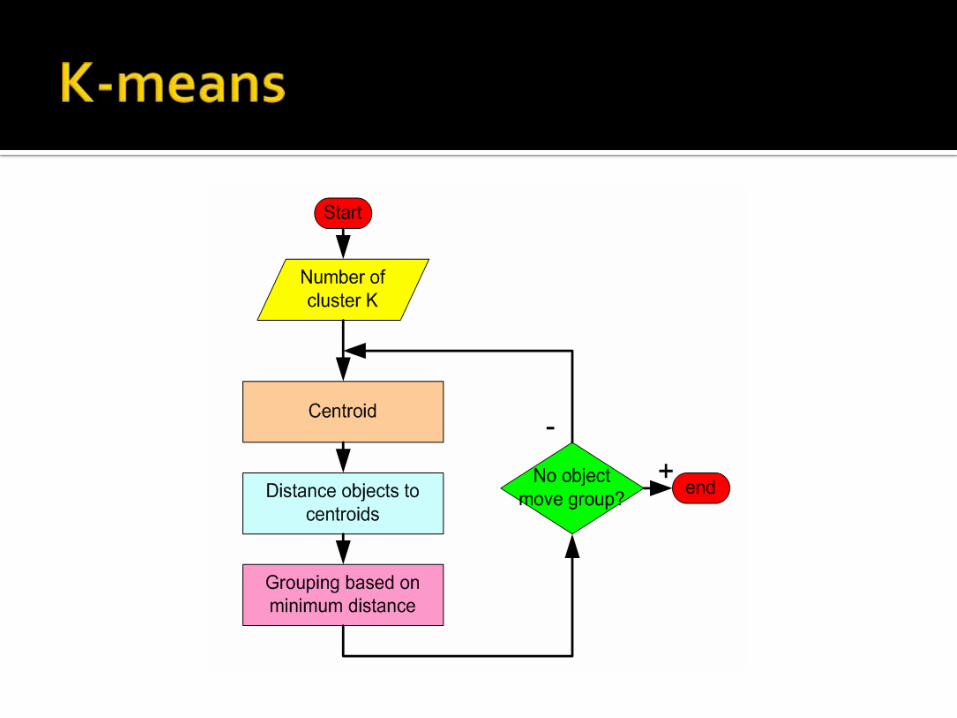
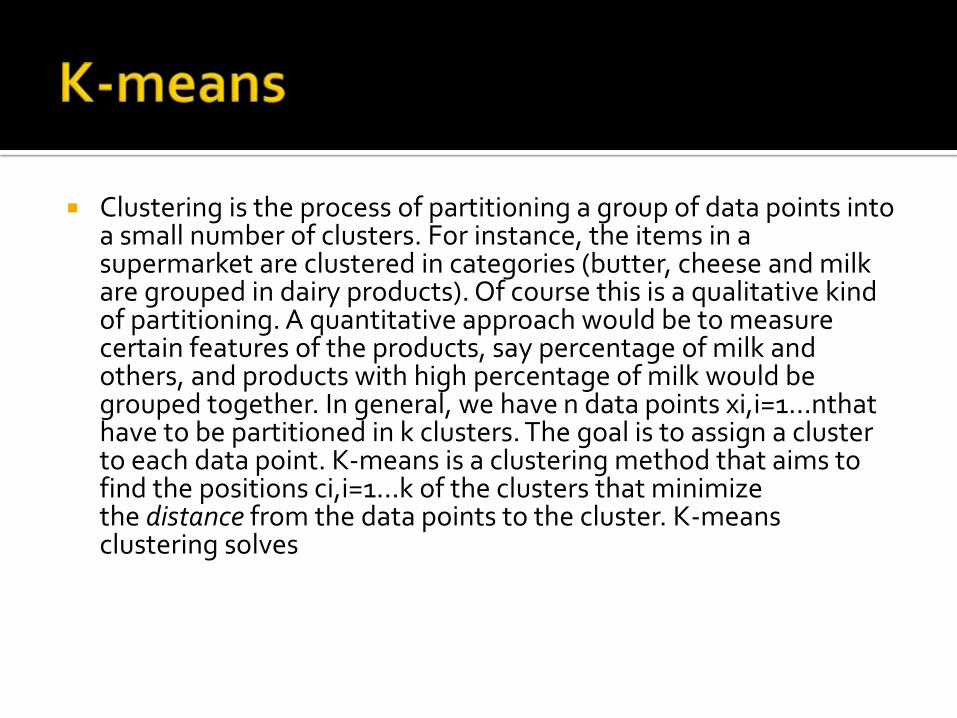
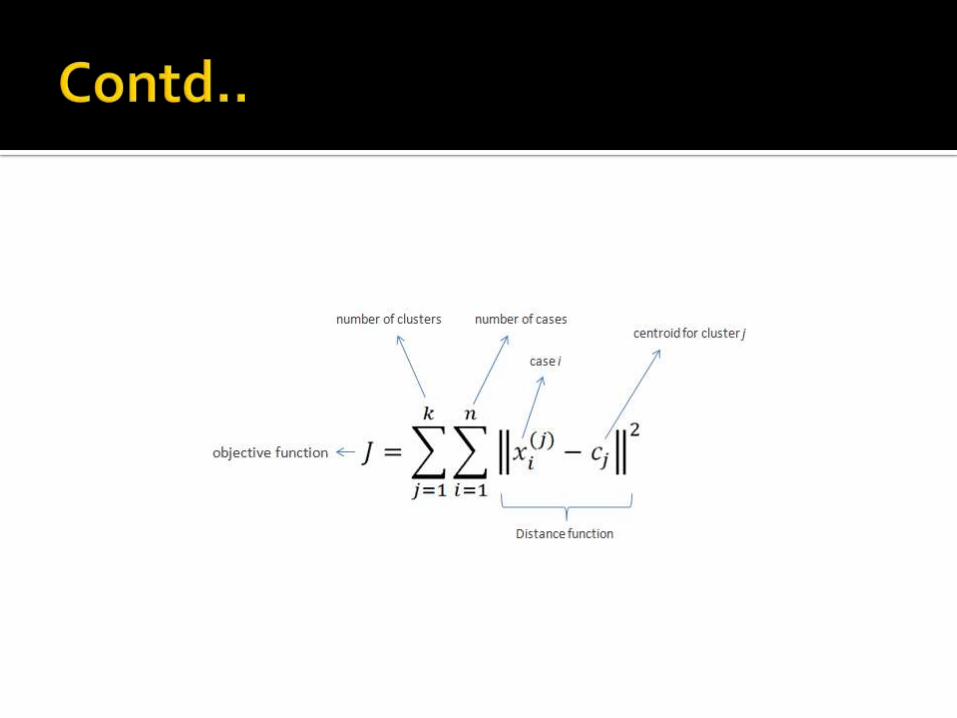
Clustering is the process of partitioning a group of data points into a small number of clusters. For instance, the items in a supermarket are clustered in categories (butter, cheese and milk are grouped in dairy products). Of course this is a qualitative kind of partitioning. A quantitative approach would be to measure certain features of the products, say percentage of milk and others, and products with high percentage of milk would be grouped together. In general, we have n data points xi,i=1...nthathave to be partitioned in k clusters. The goal is to assign a cluster to each data point. K-means is a clustering method that aims to find the positions ci,i=1...k of the clusters that minimize the distance from the data points to the cluster. K-means clustering solves
There are several layers that sit on top of HDFS that also provide additional capabilities and make working with HDFS easier. One such implementation is HBASE, Hadoop’s answer to providing database like table structures.Just like being able to work with HDFS from inside R, access to HBASE helps open up the Hadoop framework to the R programmer. Although R may not be able to load a billion row-by-million-column table, working with smaller subsets to perform adhoc analysis can help lead to solutions that work with the entire data set.
The H-Base data structure is based on LSM Trees.
The Log-Structured Merge Tree:
The Log-Structured Merge-Tree (or LSM tree) is a data structure with performance characteristics that make it attractive for providing indexed access to files with high insert volume, such as transactional log data.
LSM trees, like other search trees, maintain key-value pairs. LSM trees maintain data in two or more separate structures, each of which is optimized for its respective underlying storage medium.
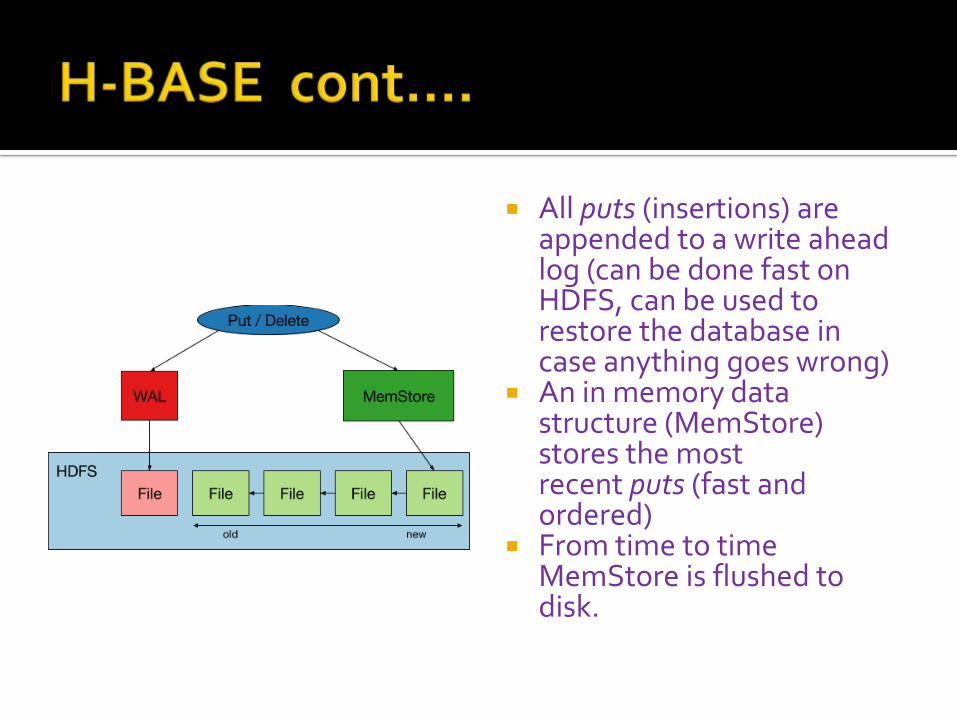
All puts (insertions) are appended to a write ahead log (can be done fast on HDFS, can be used to restore the database in case anything goes wrong)
An in memory data structure (MemStore) stores the most recent puts (fast and ordered)
From time to time MemStore is flushed to disk.
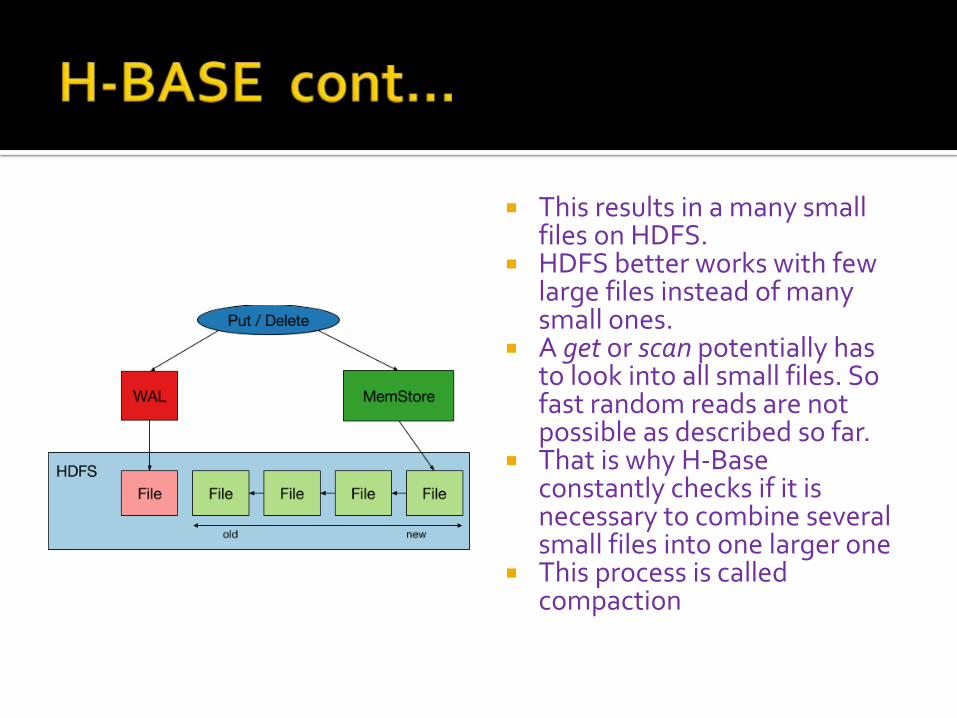
This results in a many small files on HDFS.
HDFS better works with few large files instead of many small ones.
A get or scan potentially has to look into all small files. So fast random reads are not possible as described so far.
That is why H-Base constantly checks if it is necessary to combine several small files into one larger one
This process is called compaction
There are two different kinds of compactions. Minor Compactions merge few small ordered
files into one larger ordered one without touching the data.
Major Compactions merge all files into one file. During this process outdated or deleted values are removed.
Bloom Filters (stored in the Metadata of the files on HDFS) can be used for a fast exclusion of files when looking for a specific key.
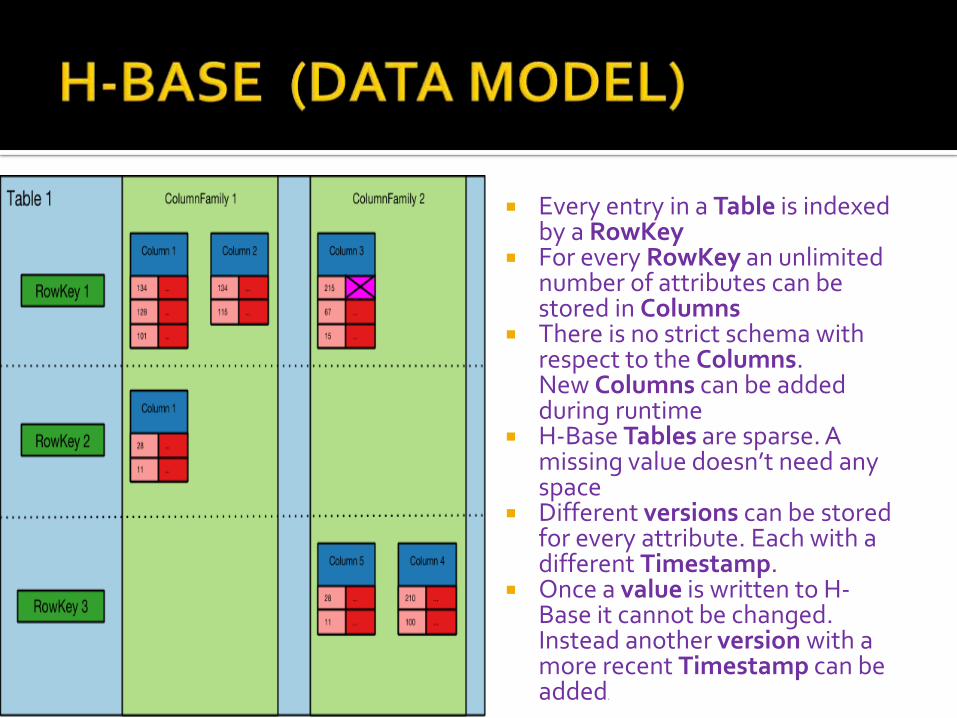
Every entry in a Table is indexed by a RowKey
For every RowKey an unlimited number of attributes can be stored in Columns
There is no strict schema with respect to the Columns. New Columns can be added during runtime
H-Base Tables are sparse. A missing value doesn’t need any space
Different versions can be stored for every attribute. Each with a different Timestamp.
Once a value is written to H-Base it cannot be changed. Instead another version with a more recent Timestamp can be added.
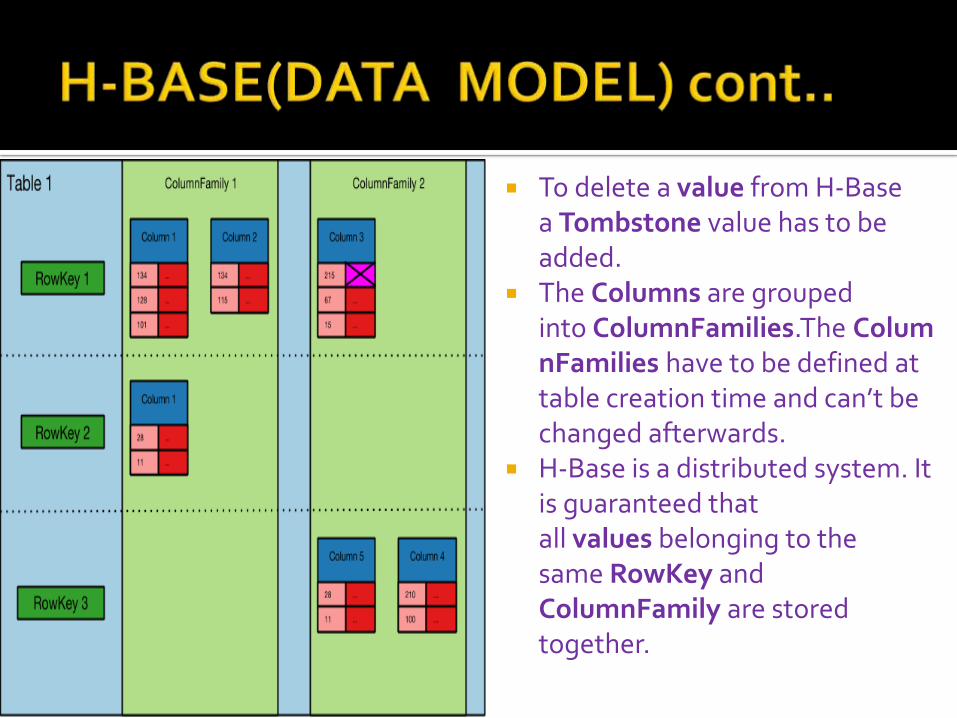
To delete a value from H-Base a Tombstone value has to be added.
The Columns are grouped into ColumnFamilies.The ColumnFamilies have to be defined at table creation time and can’t be changed afterwards.
H-Base is a distributed system. It is guaranteed that all values belonging to the same RowKey and ColumnFamily are stored together.
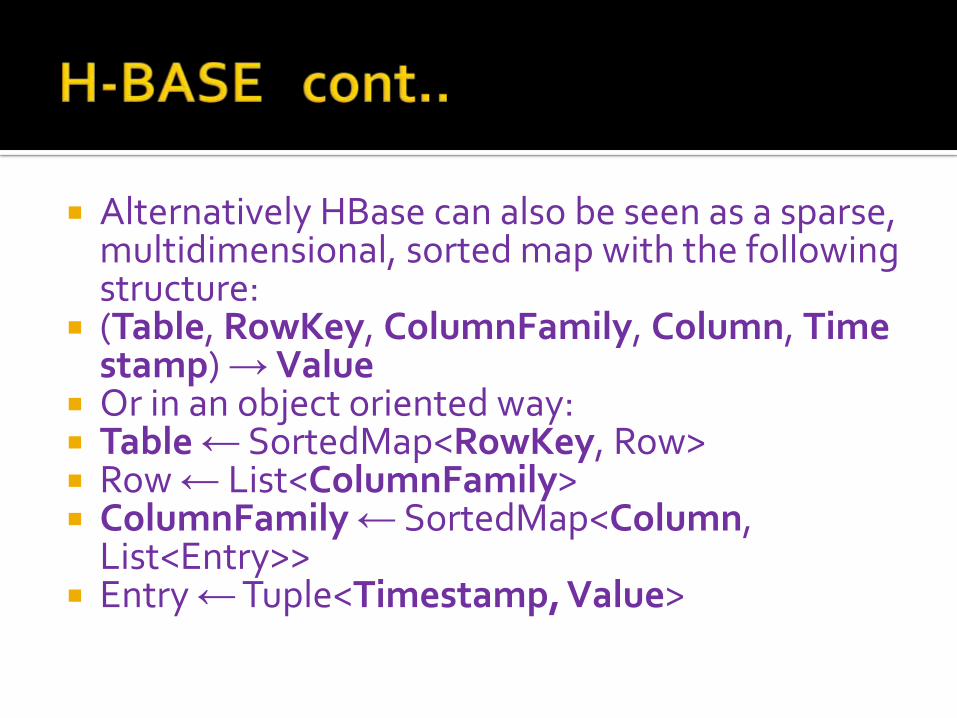
Alternatively HBase can also be seen as a sparse, multidimensional, sorted map with the following structure:
(Table, RowKey, ColumnFamily, Column, Timestamp) → Value
Or in an object oriented way: Table ← SortedMap<RowKey, Row> Row ← List<ColumnFamily> ColumnFamily ← SortedMap<Column,
List<Entry>> Entry ←Tuple<Timestamp, Value>
HBase supports the following operations:
Get: Returns the values for a given RowKey. Filters can be used to restrict the results to specific ColumnFamilies, Columns or versions.
Put: Adds a new entry. The Timestamp can be set automatically or manually.
Scan: Returns the values for a range of RowKeys. Scans are very efficient in HBase. Filters can also be used to narrow down the results. HBase 0.98.0 (which was released last week) also allows backward scans.
Delete: Adds a Tombstone marker.
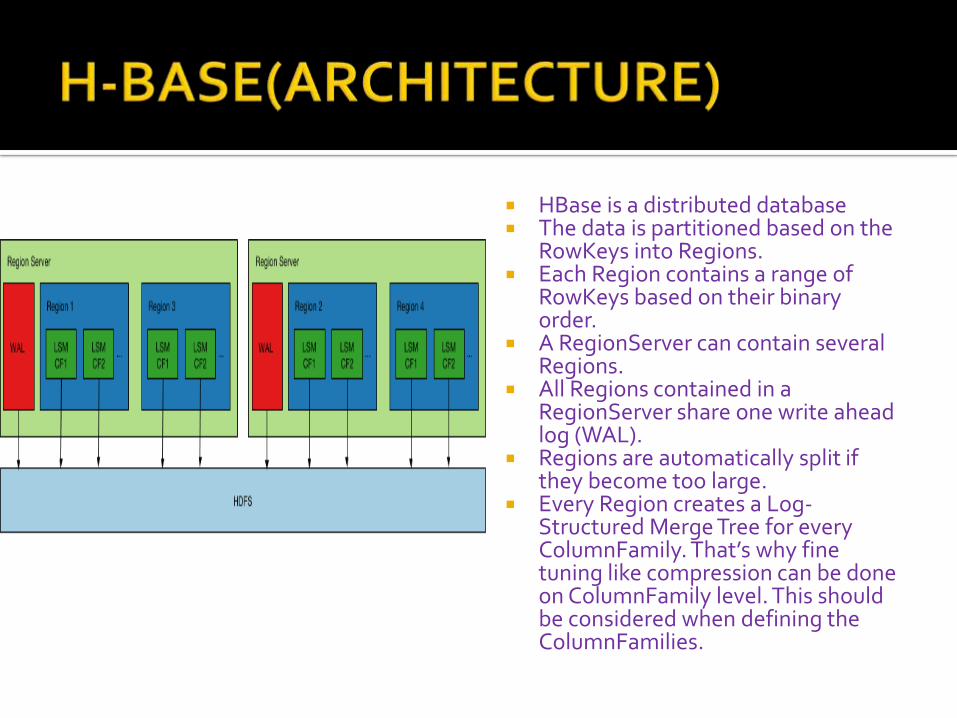
HBase is a distributed database The data is partitioned based on the
RowKeys into Regions. Each Region contains a range of
RowKeys based on their binary order.
A RegionServer can contain several Regions.
All Regions contained in a RegionServer share one write ahead log (WAL).
Regions are automatically split if they become too large.
Every Region creates a Log-Structured Merge Tree for every ColumnFamily. That’s why fine tuning like compression can be done on ColumnFamily level. This should be considered when defining the ColumnFamilies.
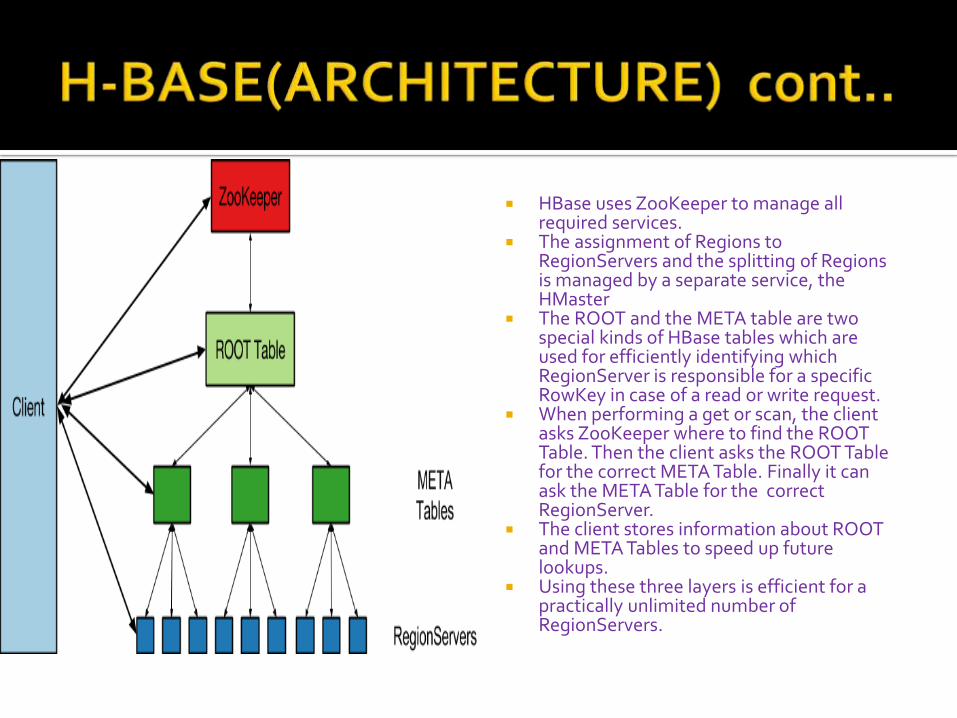
HBase uses ZooKeeper to manage all required services.
The assignment of Regions to RegionServers and the splitting of Regions is managed by a separate service, the HMaster
The ROOT and the META table are two special kinds of HBase tables which are used for efficiently identifying which RegionServer is responsible for a specific RowKey in case of a read or write request.
When performing a get or scan, the client asks ZooKeeper where to find the ROOT Table. Then the client asks the ROOT Table for the correct META Table. Finally it can ask the META Table for the correct RegionServer.
The client stores information about ROOT and META Tables to speed up future lookups.
Using these three layers is efficient for a practically unlimited number of RegionServers.
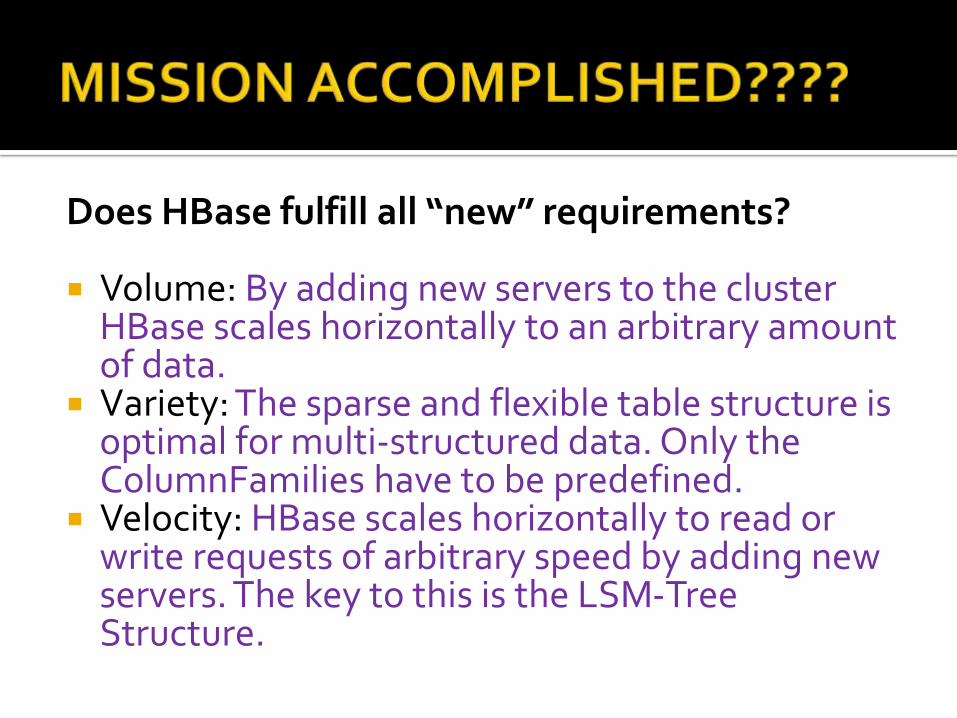
Does HBase fulfill all “new” requirements?
Volume: By adding new servers to the cluster HBase scales horizontally to an arbitrary amount of data.
Variety: The sparse and flexible table structure is optimal for multi-structured data. Only the ColumnFamilies have to be predefined.
Velocity: HBase scales horizontally to read or write requests of arbitrary speed by adding new servers. The key to this is the LSM-Tree Structure.


