
Beyond an Integrated Organization: Best Care with Integrated Data at Kaiser
Terhilda Garrido, MPH Vice President, Health Information Technology Transformation & Analytics Kaiser Permanente Madrid - June 2015 Health System Integration in Spain and Globally: New Evidence Copyright © 2015 Kaiser Permanente

Copyright © 2015 Kaiser Permanente
Integrated Data Impact on Health Care at Kaiser
• KP’s Performance • Our Data Systems
Introduction to Kaiser
• Transparency of Data • Big Q • Tackling Care Gaps with Population
Management • Risk Adjustment
The Value of Integrated Data
• Redefining Access/Empowering Patients • Data for the Patient
‘Integrating the Patient’
2
2
Copyright © 2015 Kaiser Permanente 3
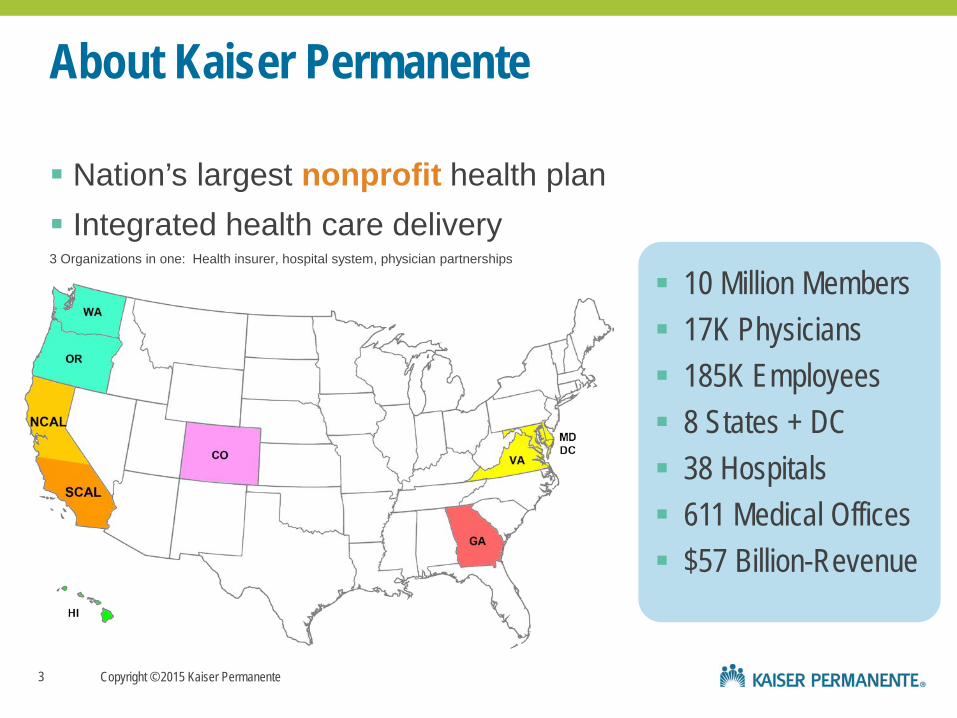
About Kaiser Permanente
Integrated health care delivery 3 Organizations in one: Health insurer, hospital system, physician partnerships
Nation’s largest nonprofit health plan
10 Million Members 17K Physicians 185K Employees 8 States + DC 38 Hospitals 611 Medical Offices $57 Billion-Revenue
Copyright © 2015 Kaiser Permanente
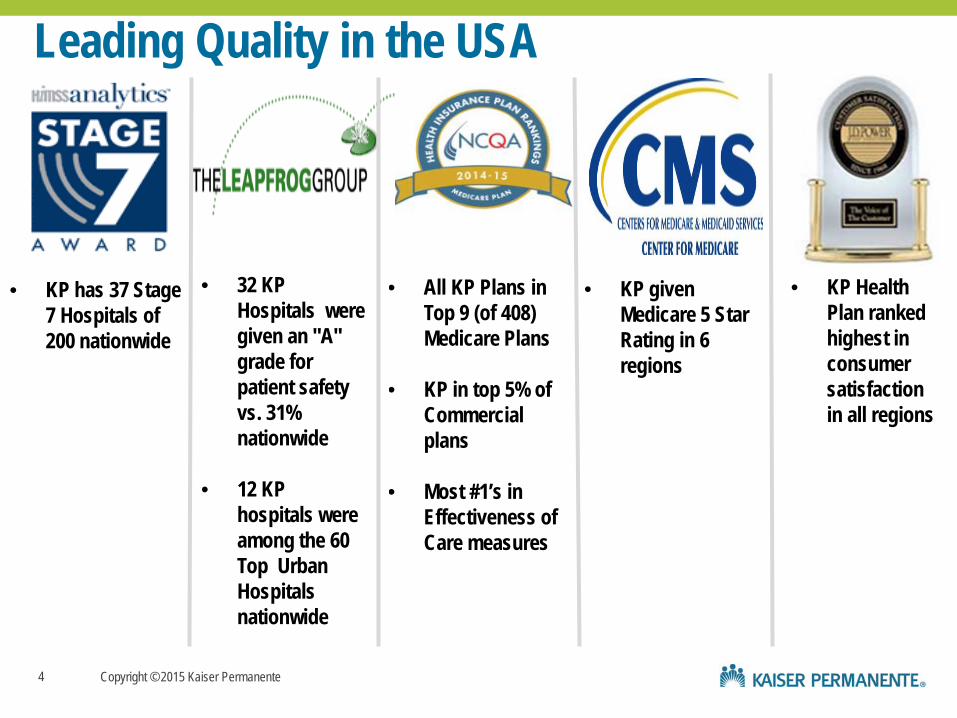
• All KP Plans in Top 9 (of 408) Medicare Plans
• KP in top 5% of
Commercial plans
• Most #1’s in
Effectiveness of Care measures
Leading Quality in the USA
• KP has 37 Stage 7 Hospitals of 200 nationwide
• 32 KP
Hospitals were given an "A" grade for patient safety vs. 31% nationwide
• 12 KP hospitals were among the 60 Top Urban Hospitals nationwide
• KP given Medicare 5 Star Rating in 6 regions
• KP Health Plan ranked highest in consumer satisfaction in all regions
4

Copyright © 2015 Kaiser Permanente
Patient Portal / kp.org
Membership/
Benefits
Claims Processing
Benefits Accumulation
Pricing System
Health Plan
Outpatient Pharmacy
Lab
Radiology/ Imaging
Others (EKG, dictation)
Ancillaries
General Ledger
Capital Planning
Financial Reporting
Outpatient • Scheduling • Registration • Clinicles • Billing • Health Info
Management
Inpatient • Clinical
documentation • ADT • CPOE • Pharmacy • ER • Operating
Room • Billing
Scope of Kaiser Permanente HealthConnect®
5
Care Delivery Core Finance
Refe
rral &
Util
izatio
n Ma
nage
men
t
KP HealthConnect
Care Delivery Core
Data Repository
Copyright © 2015 Kaiser Permanente
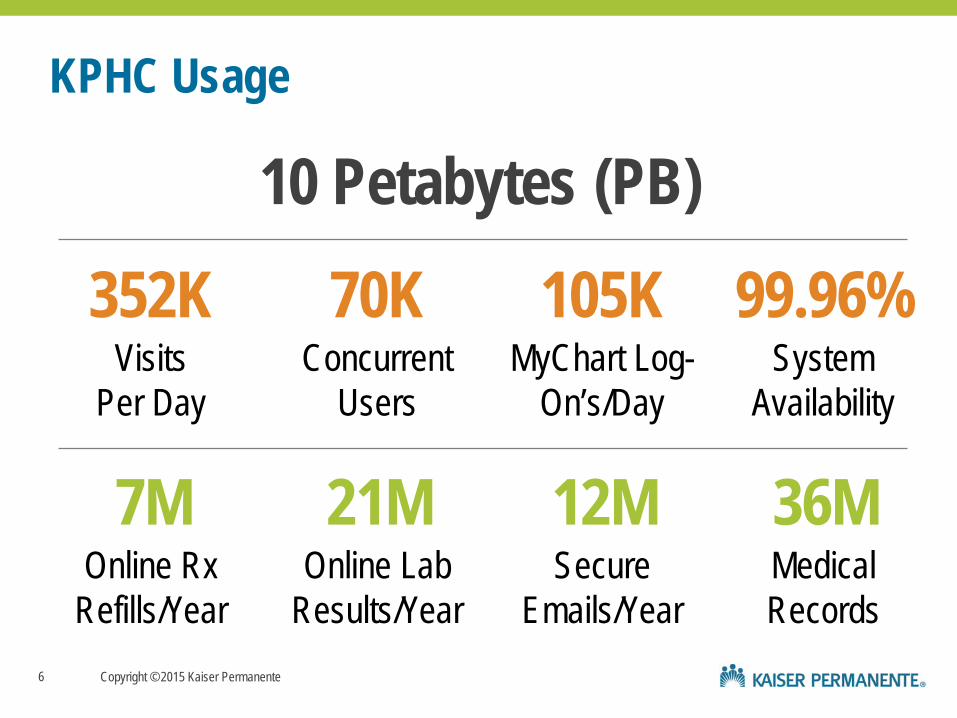
KPHC Usage
99.96% System
Availability
70K Concurrent
Users
36M Medical Records
7M Online Rx
Refills/Year
21M Online Lab
Results/Year
12M Secure
Emails/Year
352K Visits
Per Day
105K MyChart Log-
On’s/Day
6
10 Petabytes (PB)

Copyright © 2015 Kaiser Permanente
Leading Prevention & Cancer Screening Best Hospitals Best Care for
Chronic Conditions
25th
90th
75th
10th
And Our Quality of Care Is Up
Clinical effectiveness
composite
Hospital clinical
effectiveness Hospital mortality
Note: Placement of current status and starting points approximate
Diabetes care
composite
Performance Relative to National Benchmarks
100th
Perc
entil
e
50th
Prevention composite
Cervical cancer
screening
Colon cancer
screening
Cardio- vascular
care composite
04 04
04 04
04
03 03
2012
04
7
Copyright © 2015 Kaiser Permanente
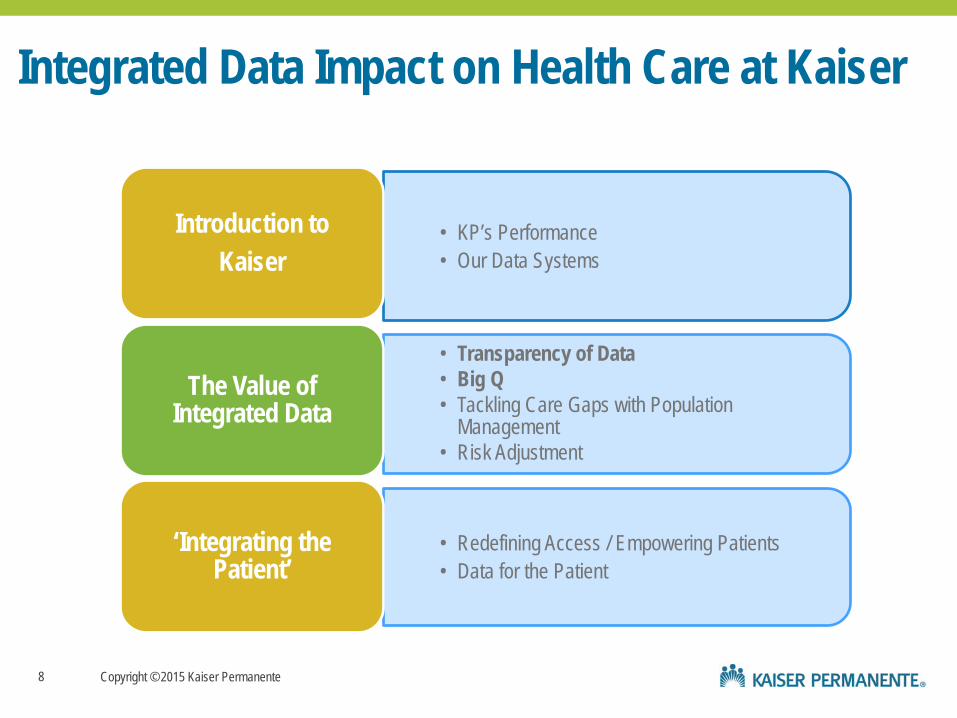
Integrated Data Impact on Health Care at Kaiser
• KP’s Performance • Our Data Systems
Introduction to Kaiser
• Transparency of Data • Big Q • Tackling Care Gaps with Population
Management • Risk Adjustment
The Value of Integrated Data
• Redefining Access / Empowering Patients • Data for the Patient
‘Integrating the Patient’
8
8

Copyright © 2015 Kaiser Permanente
Organization Level Strategic Decisions From Data & Performance Transparency 1
Data Story: ‘Big Q’ – Big Quality
Kaiser ensures success via a
dashboard of 6 dimensions that
make up the Big Q.
Monitoring outcomes gives us
clear strategic focus for creating value for KP and
our patients
Context Action Outcome
Other kinds of companies have a single metric for
success: profit. In health care, we
seek a balanced scorecard that is widely available.
9
Copyright © 2015 Kaiser Permanente
Transparency is a Game Changer
“Serious improvement beings with understanding reality. Transparency and honesty are not just assets for better health care, they are preconditions” - Don Berwick, MD, 2009, Co-Founder of the institute for Healthcare Improvement in 1991, not-for-profit organization
“helping to lead the improvement of healthcare throughout the World’”
10

Copyright © 2015 Kaiser Permanente
The Benefits of Transparency
• Allows demonstration of “best” • Motivates improvement • Raises the bar on accountability • Enables learning • Increases recognition of risk • Provides information for decision-making
11

Copyright © 2015 Kaiser Permanente
“The Solution” A balanced set of measures of national performance for KP leadership and regional & hospital operations that: • Presents a top-level, “big dot” view of overall quality
performance • Enables drill-down by geography and measures • Shows trends for processes and outcomes over time • Provides comparative metrics for benchmarking across
organizations • Serves as input to strategic quality improvement planning
12
Copyright © 2015 Kaiser Permanente
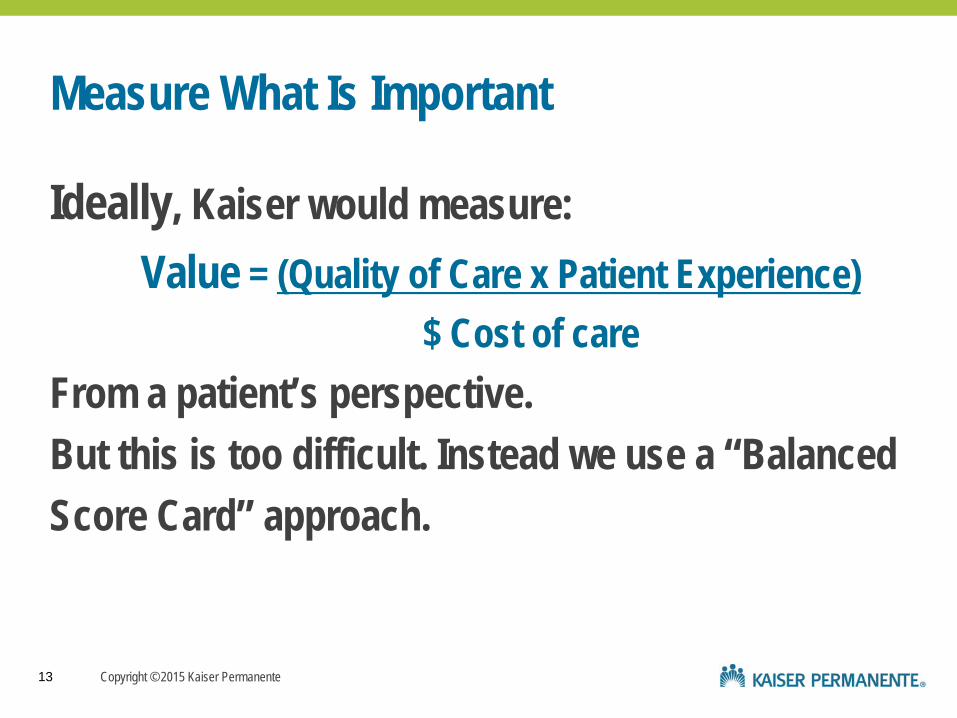
Measure What Is Important
Ideally, Kaiser would measure: Value = (Quality of Care x Patient Experience)
$ Cost of care From a patient’s perspective. But this is too difficult. Instead we use a “Balanced Score Card” approach.
13

Copyright © 2015 Kaiser Permanente
Big Q - Big Areas of Focus
Clinical Effectiveness
Inpatient
Patient Safety
Risk Management
Patient Service
Experience
Resource Stewardship
Equitable Care
14
Clinical Effectiveness
Outpatient
Copyright © 2015 Kaiser Permanente
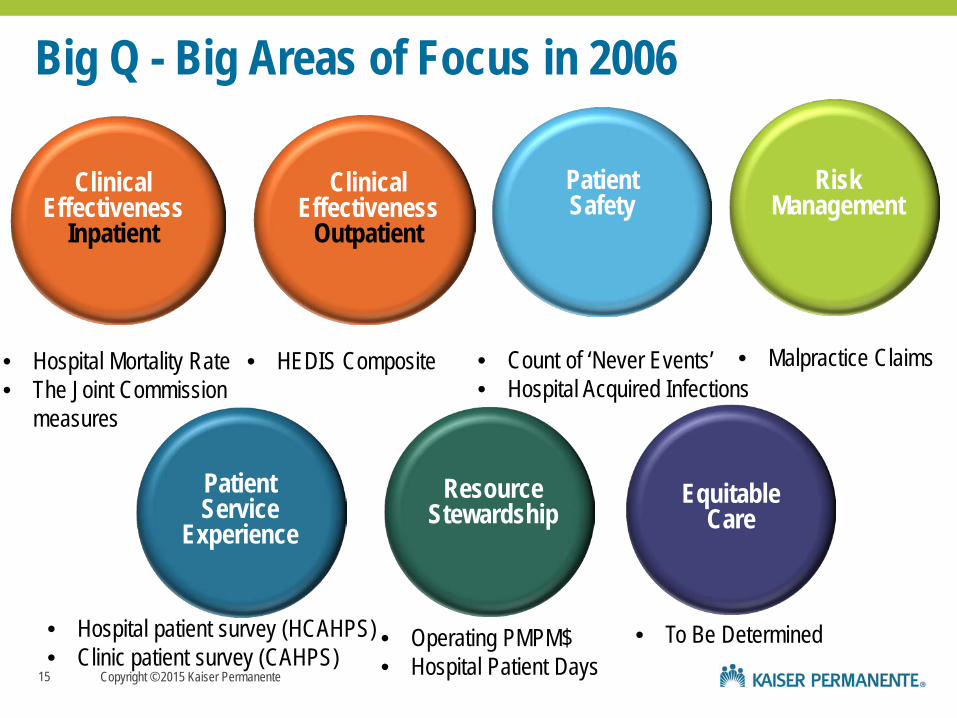
Big Q - Big Areas of Focus in 2006
15
Clinical Effectiveness
Inpatient
Patient Safety
Risk Management
Patient Service
Experience Resource
Stewardship Equitable
Care
Clinical Effectiveness
Outpatient
• Hospital Mortality Rate • The Joint Commission
measures
• HEDIS Composite
• Count of ‘Never Events’ • Hospital Acquired Infections
• Malpractice Claims
• Hospital patient survey (HCAHPS) • Clinic patient survey (CAHPS)
• Operating PMPM$ • Hospital Patient Days
• To Be Determined
Copyright © 2015 Kaiser Permanente
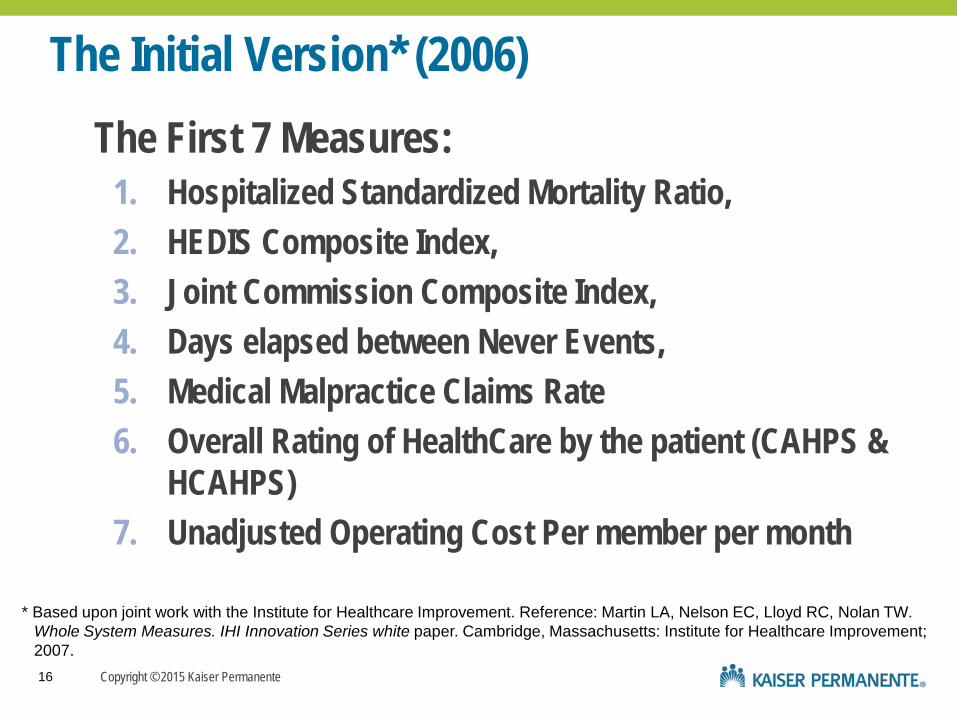
The Initial Version* (2006) The First 7 Measures:
1. Hospitalized Standardized Mortality Ratio, 2. HEDIS Composite Index, 3. Joint Commission Composite Index, 4. Days elapsed between Never Events, 5. Medical Malpractice Claims Rate 6. Overall Rating of HealthCare by the patient (CAHPS &
HCAHPS) 7. Unadjusted Operating Cost Per member per month
16
* Based upon joint work with the Institute for Healthcare Improvement. Reference: Martin LA, Nelson EC, Lloyd RC, Nolan TW. Whole System Measures. IHI Innovation Series white paper. Cambridge, Massachusetts: Institute for Healthcare Improvement; 2007.

Copyright © 2015 Kaiser Permanente
A Hierarchy of Measures
17
Individual Measures
Subscales
The top-level Index is typically a ‘Big Dot’ such as the TJC or HEDIS Composite.
Typically, a natural grouping of measures such as diabetes, CHF or asthma.
Increasing level of detail
*The user chooses the best match for their reporting purpose
185 Measures
7 Big Dots

Copyright © 2015 Kaiser Permanente
Two Levels of Reporting: (1) Top Level or Big Dot
page 18
Big Q

Copyright © 2015 Kaiser Permanente
Two Levels of Reporting: (1) Top Level & (2) Detail
19
One frame to show trend, variation, target and benchmark for a key performance measure.
A balanced set of measures to denote system performance on one easy to read/interpret dashboard.

Copyright © 2015 Kaiser Permanente
Two Levels of Reporting: (2) Detail Level
20

Copyright © 2015 Kaiser Permanente
Integrated Data Impact on Health Care at Kaiser
• KP’s Performance • Our Data Systems
Introduction to Kaiser
• Transparency of Data: • Big Q • Tackling Care Gaps with Population
Management • Risk Adjustment
The Value of Integrated Data
• Redefining Access / Empowering Patients • Data for the Patient
‘Integrating the Patient’
21
21

Copyright © 2015 Kaiser Permanente
The advantage of geographically based care! Spain can take care of ALL of the patient’s needs and resolve care gaps Kaiser is also geographically based and divides the care and the data reporting into many levels of aggregation: • National • Regional (7) • Medical Center (38) • Department • MD or MD panel (19,000)
For example, each primary care MD has about 2200 patients in their MD panel
2
Spain’s Opportunity
22

Copyright © 2015 Kaiser Permanente
Failings of a Visit-Centric System*
• $200B Avoidable chronic condition costs • $125B Routine and/or unnecessary visits • This does NOT include costs to patients
Cost
• Infrequent measurement • Sampling errors of measurement • No real incentives for improving quality
Quality
• Little inter-visit engagement (on either side) • Hard to maintain behaviors & adhere to plan Engagement
23
*Daniel Sands, MD, MPH Harvard Medical School – 2014 Bio Medical Informatics Conference, May 2015

Copyright © 2015 Kaiser Permanente
The Current Model is Unsustainable in the USA
100M more primary visits needed for newly insured
(20M+) and aging population with chronic
conditions
150,000 physician shortfall; 50,000 in primary care alone
24
Copyright © 2015 Kaiser Permanente
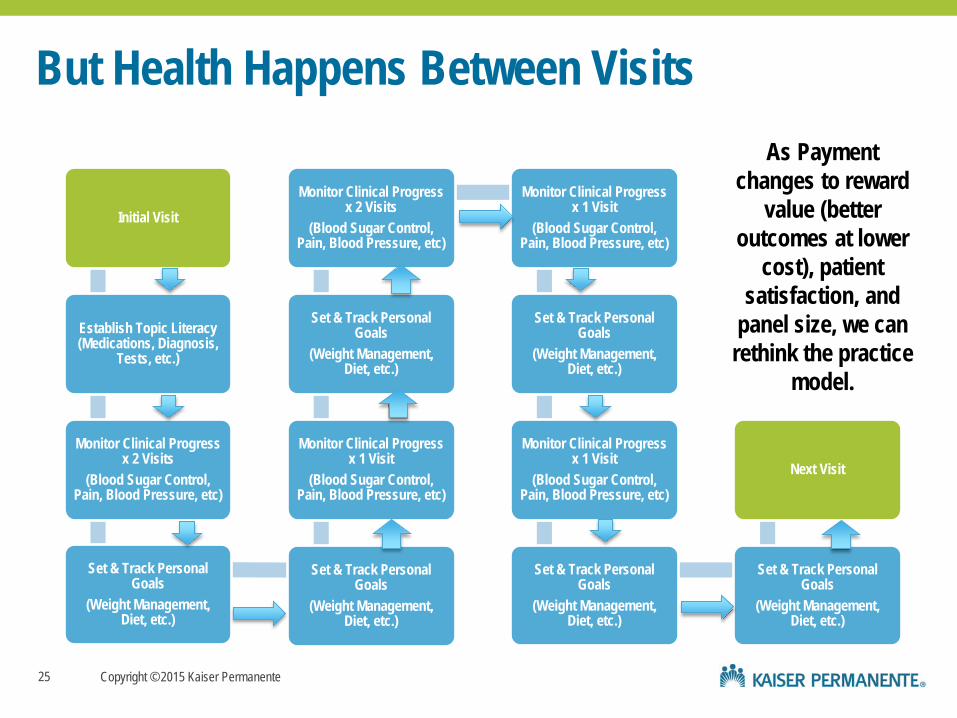
But Health Happens Between Visits
Initial Visit
Establish Topic Literacy (Medications, Diagnosis,
Tests, etc.)
Monitor Clinical Progress x 2 Visits
(Blood Sugar Control, Pain, Blood Pressure, etc)
Set & Track Personal Goals
(Weight Management, Diet, etc.)
Set & Track Personal Goals
(Weight Management, Diet, etc.)
Monitor Clinical Progress x 1 Visit
(Blood Sugar Control, Pain, Blood Pressure, etc)
Set & Track Personal Goals
(Weight Management, Diet, etc.)
Monitor Clinical Progress x 2 Visits
(Blood Sugar Control, Pain, Blood Pressure, etc)
Monitor Clinical Progress x 1 Visit
(Blood Sugar Control, Pain, Blood Pressure, etc)
Set & Track Personal Goals
(Weight Management, Diet, etc.)
Monitor Clinical Progress x 1 Visit
(Blood Sugar Control, Pain, Blood Pressure, etc)
Set & Track Personal Goals
(Weight Management, Diet, etc.)
Set & Track Personal Goals
(Weight Management, Diet, etc.)
Next Visit
25
As Payment changes to reward
value (better outcomes at lower
cost), patient satisfaction, and
panel size, we can rethink the practice
model.

Copyright © 2015 Kaiser Permanente
Team-Based Care Proactive Office
Encounter
Panel Management
Medication Adherence
Health Education
26
KP’s Population Care
Focus Systems Technology
Chronic Conditions Asthma
Coronary Artery Disease
Hypertension
Diabetes
Congestive Heart Failure
Chronic Kidney Disease
Electronic Health Record
Clinical Decision Support
Secure Messaging
Registries
Outreach by IVR, Text, etc.
KP.org Member Portal

Copyright © 2015 Kaiser Permanente
The Old Way • Disease focused – individual care for
each disease • 100% care delivered in
hospitals/clinics • Intensive care management programs
expensive
• Paper dependent tracking systems
• No transparency of performance
• Patient/family passive role
The New Way
• Shift to population health
• Increased percentage of care delivered virtually
• Care management programs customized
• Electronic tracking
• Full transparency
• Full patient/family engagement
• Predictive capability using Big Data 27

Copyright © 2015 Kaiser Permanente
Patient Population Tools
28
28

Copyright © 2015 Kaiser Permanente
Taking Accountability for Patient Populations
Clinical Outcomes in Southern California
Metric Improvement Lives Saved Per Decade1
Blood Pressure Control 38.9% 5,341 Lives
Colorectal cancer screening 30.2% 4,788 Lives
Cholesterol Control 21.8% 1,751 Lives
Blood sugar control 11.5% 1.088 Lives
Smoking Cessation 17.0% 955 Lives
Breast Cancer Screening 11.4% 570 Lives
Cervical Cancer Screening 5.9% 59 Lives
1/ Based on NCQA Quality Dividend Calculator
Over 14,000 Lives
Saved1
29
Kaiser Permanente member Mary Gonzales talks about her experience with KP, and how a receptionist using KP HealthConnect prompted and scheduled her for a mammogram.

Copyright © 2015 Kaiser Permanente 30
• Integration – Medical Group, Hospital, and Insurance all in one system – develop the right systems and most efficient workflow
• Unified cost structure that creates Incentives allowing you to do the right thing – capitated payment for the system or population
• Clinical Information systems that allow for population management and the right thing to get done easily (EBM, reminders, monitoring, feedback)
• Culture of Quality Improvement – Collaborative, shared innovation, dissemination of best practices – find the right ways to do things
• Expertise in Implementation – Know how to diffuse and drive changes in the organization using our infrastructure and culture
Population Care in a Fully Integrated System
Copyright © 2015 Kaiser Permanente
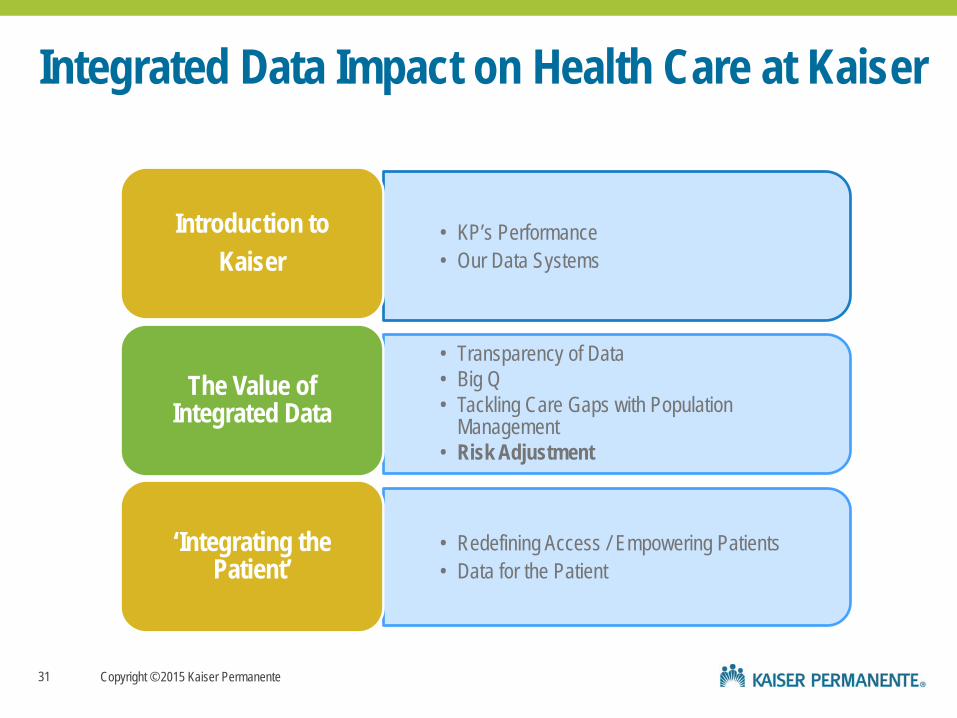
Integrated Data Impact on Health Care at Kaiser
• KP’s Performance • Our Data Systems
Introduction to Kaiser
• Transparency of Data • Big Q • Tackling Care Gaps with Population
Management • Risk Adjustment
The Value of Integrated Data
• Redefining Access / Empowering Patients • Data for the Patient
‘Integrating the Patient’
31
31

Copyright © 2015 Kaiser Permanente
Risk Adjustment For any measurable factor that impacts utilization but is NOT determined by the health care system
• Age (0-64, 65+) • Age (in finer increments) • Gender • Chronic Conditions • Illness Burden (e.g. DxCG)
32
Copyright © 2015 Kaiser Permanente
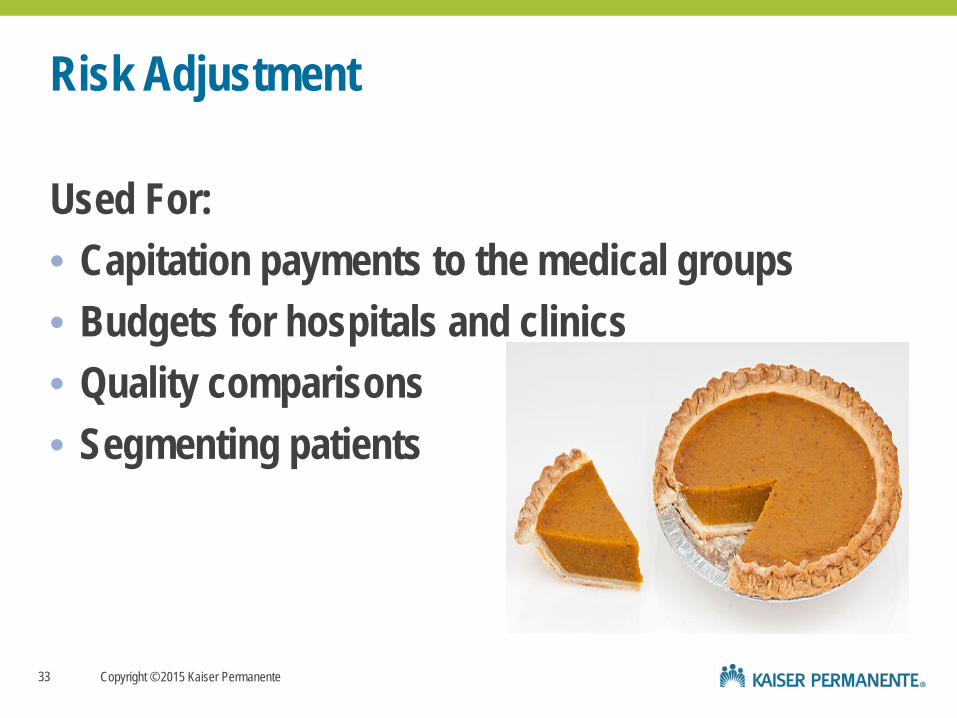
Risk Adjustment
Used For: • Capitation payments to the medical groups • Budgets for hospitals and clinics • Quality comparisons • Segmenting patients
33

Copyright © 2015 Kaiser Permanente
Segmentation - Matching Care to 65+ Needs
34
15-20% 10-15%
Population Care
Complex Care
Usual Care
5-7% 60-65%
1. Healthy
2. Chronic
Conditions
3. Advanced
Illness
4. Frailty &
End of Life Benefits: • Services are aligned to
needs of each Care Group
• Person-Centered care is based on individual needs and values
• Geriatrics services are utilized optimally
• Health care is more cost effective

Copyright © 2015 Kaiser Permanente
Integrated Data Impact on Health Care at Kaiser
• KP’s Performance • Our Data Systems
Introduction to Kaiser
• Transparency of Data • Big Q • Tackling Care Gaps with Population
Management • Risk adjustment
The Value of Integrated Data
• Redefining Access / Empowering Patients • Data for the Patient
‘Integrating the Patient’
35
35

Copyright © 2015 Kaiser Permanente
Health Behaviors Are The Largest Determinant of Health
36
10%
40% 20%
30%

Copyright © 2015 Kaiser Permanente 37


Copyright © 2015 Kaiser Permanente 39

Copyright © 2015 Kaiser Permanente 40 David Sobel, MD – [email protected]


Copyright © 2015 Kaiser Permanente
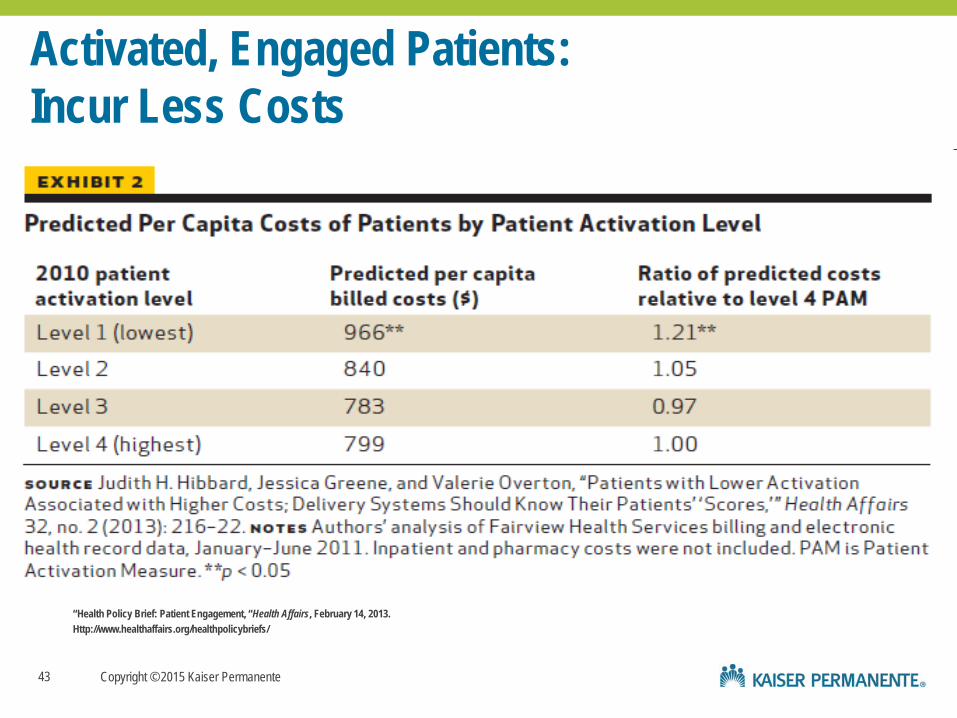
Activated, Engaged Patients: Incur Less Costs
“Health Policy Brief: Patient Engagement, “Health Affairs, February 14, 2013. Http://www.healthaffairs.org/healthpolicybriefs/
43

Copyright © 2015 Kaiser Permanente
Redefining Access – Empowering Patients
44
2014 KP.org
• Almost 5M Patients Online!
• 162M Visits to KP.org • 20M Secure Emails • 78M Lab Views • 17M Refills

Copyright © 2015 Kaiser Permanente
Redefining Access – Empowering Patients
45
45
2014 KP.org • Almost 5M Patients
Online! • 162M Visits to KP.org • 20M Secure Emails • 78M Lab Views • 17M Refills 30% of Transactions
Mobile

Copyright © 2015 Kaiser Permanente
Redefining Access – Empowering Patients
Doris Taylor, a KP member, talks about contacting her doctor from the convenience of her home. She sends a secure message to her doctor via KP HealthConnect. Dr. Liu receives Doris’s question and proceeds to reply almost instantaneously. Transforming Access 46
46
• Health Encyclopedia
Copyright © 2015 Kaiser Permanente
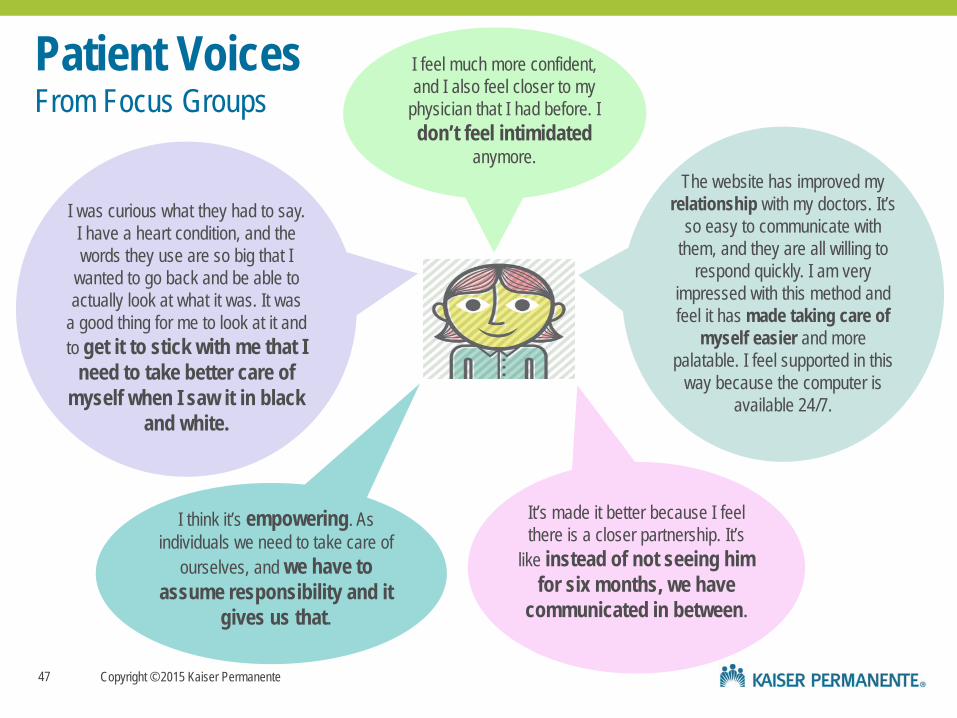
I feel much more confident, and I also feel closer to my
physician that I had before. I don’t feel intimidated
anymore.
I was curious what they had to say. I have a heart condition, and the words they use are so big that I
wanted to go back and be able to actually look at what it was. It was
a good thing for me to look at it and to get it to stick with me that I
need to take better care of myself when I saw it in black
and white.
I think it’s empowering. As individuals we need to take care of
ourselves, and we have to assume responsibility and it
gives us that.
The website has improved my relationship with my doctors. It’s
so easy to communicate with them, and they are all willing to
respond quickly. I am very impressed with this method and feel it has made taking care of
myself easier and more palatable. I feel supported in this
way because the computer is available 24/7.
It’s made it better because I feel there is a closer partnership. It’s
like instead of not seeing him for six months, we have
communicated in between.
47 47
Patient Voices From Focus Groups

Copyright © 2015 Kaiser Permanente
Improved Engagement, Quality, & Satisfaction Patient Loyalty • My Health Manager users were 2.6 times
more likely to remain members 1
Quality of care improved • 2.0 to 6.5% improvement - glycemic
(HbA1c), cholesterol, and blood pressure screening and control2
• Refill improves outcomes (LDL)3
High patient satisfaction • 85% rated encounters 8 or 9 on a 9 pt
scale4
1 Turley, Marianne; Garrido, Terhilda; Lowenthal, Alex; Zhou, Yi Yvonne, “Association Between Personal Health Record Enrollment and Patient Loyalty,” Am J Manag Care. 2012;18(7):e248-e253 (web exclusive) 2 Zhou, Yi Yvonne; Kanter, Michael H; Wang, Jian J; Garrido, Terhilda, “Improved Quality at Kaiser Permanente Through E-Mail Between Physicians and Patients,” Health Affairs, Vol 29, No 7 (2010); 1370-1375. 3 Sarkar, Urmimala, Lyles, Courtney; Parker, Melissa; Allen, Jill, et al., “Use of the Refill Function Through an Online Patient Portal is associated With Improved Adherence to Statins in an Integrated Health System,”
Medical Care, Vol 00, No 00 (2013) 4 Internal KP study, “Harvesting Value: Early Findings from Kaiser Permanente HealthConnect™” presented to Center for Information Therapy by T Garrido, C Serrato, J Oldenburg (1/15/2008)
48
Copyright © 2015 Kaiser Permanente
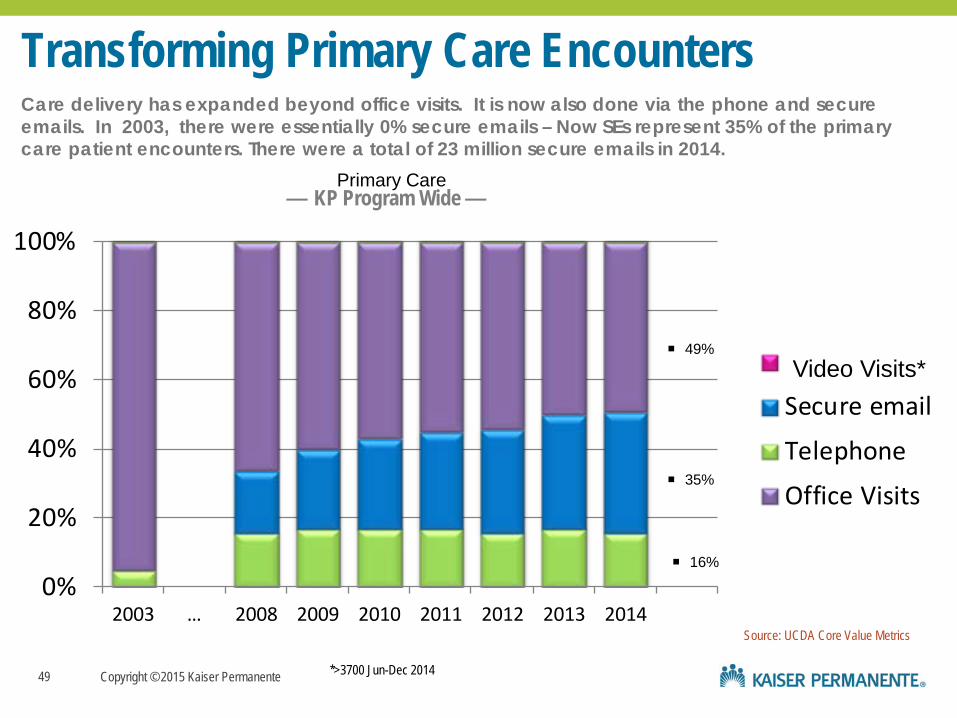
Transforming Primary Care Encounters
0%
20%
40%
60%
80%
100%
2003 … 2008 2009 2010 2011 2012 2013 2014
Office Visits
Secure email
Telephone
Office Visits
— KP Program Wide —
Source: UCDA Core Value Metrics
Care delivery has expanded beyond office visits. It is now also done via the phone and secure emails. In 2003, there were essentially 0% secure emails – Now SEs represent 35% of the primary care patient encounters. There were a total of 23 million secure emails in 2014.
49
Video Visits*
*>3700 Jun-Dec 2014
Primary Care
49
16%
35%
49%

Copyright © 2015 Kaiser Permanente
Some Kaiser Metrics
1. KP Quality Measures, BigDot- Clinical Effectiveness. Ratio of observed readmissions versus expected readmissions. The overall expected probability of readmission was calculated using weighted adjusted rates based on the total number of index discharges. Includes readmissions associated with all clinical conditions . KP Medicare total excludes MAS and OH.
2. KP HEDIS At-A-Glance Reports 2013-2014, for data reported in the years 2012-2013. 2014 data not yet available. 3. KP Quality Measures, BigDot- Clinical Effectiveness. Ratio of observed versus expected mortality among patients with diagnoses accounting for 80% of inpatient mortality after being adjusted for patient-mix and
community variables.
2013
Kaiser Permanente Commercial Medicare Total
All 30-Day Re-Admissions1 (all cause)
0.827 0.785 0.807
Commercial Medicare
ED Visit Rate (Emergency Department Visits per 1,000 Member/Year2)
157.00 374.02
Patient Discharge Rate (per 1,000 Member/Year2)
39.66 169.92
Patient Day Rate (per 1,000 Member/Year2)
137.11 721.73
Hospital Standardized Mortality Ratio (HSMR)3
0.470
50


