Better BusinessInsights Report
Prepared for: XYZ Retail
Prepared by: Joe SmithPhone: 123 456 789Email: [email protected]: 20th February 2017

3.
4.
5.
6.
7.
8.
9.
10.
11.
12.
13.
14.
15.
Manchester Retailing in Australia Industry Overview
Sample Analysis Guide
Sample Analysis Payments
Sample Analysis Demographics and Loyalty
Sample Analysis Location and Family
Sample Analysis Online
Sample BPAY Analysis Payments
NSW State Overview
Sydney - Eastern Suburbs Catchment Overview
Sydney - Eastern Suburbs Catchment Key Statistics
Australian Economy Key Indicators
Tips and Tricks
Appendix Government Agencies
Contents
Important information: This report has been produced by Commonwealth Bank of Australia ABN 48 123 123 124 based on information available at the time of publishing. The report is confidential and isprovided to you on the condition that you will not disclose its contents to any third parties other than your directors or employees, without the prior written consent of Commonwealth Bank. This obligationwill not apply if the information is available to the public generally (except as a result of a breach of a confidentiality obligation) or you are or as otherwise required to disclose it by law. Commonwealth Bankhas taken reasonable steps to ensure that the information in this report is correct and any opinions, conclusions or recommendations are reasonably held or made at the time of its compilation, but nowarranty is made as to accuracy, reliability or completeness. To the extent permitted by law, neither Commonwealth Bank nor any of its subsidiaries (“Commonwealth Bank Group”) accept liability to you orany person for loss or damage arising from the use of this report. The contents of this report should not be relied upon by you or any third party in making business or other decisions. This report is not asubstitute for professional advice. Any opinions, conclusions or recommendations in this report are subject to change without notice and Commonwealth Bank is under no obligation to, and do not, updateor keep current the information contained in this report. This report is not directed to, or intended for distribution to or use by, any person or entity who is a citizen or resident of or located in any locality,state, country or other jurisdiction where such distribution, publication, availability or use would be contrary to law or regulation or which would subject the Commonwealth Bank Group to any registration orlicensing requirement within such jurisdiction. All customer data used or represented in this report is anonymous and aggregated before analysis and is used and disclosed in accordance with theCommonwealth Bank Group’s Privacy Policy Statement. By receiving a copy of this report you acknowledge and agree that you will not use, manipulate or interpret the information to identify any individualor entity. All material presented in this report, unless specifically indicated otherwise, is under copyright to the Commonwealth Bank Group. None of the report, its content, nor any copy of it, may be alteredin any way, transmitted to, copied or distributed to any other party, without the prior written permission of the Commonwealth Bank. If you receive this report in error, please do not use or disclose thecontents, please delete and destroy all copies.
THIS IS A TEST REPORT ONLY and CONFIDENTIAL - Not for disclosure to any third party 2Commonwealth Bank of Australia ABN 48 123 123 124
IntroductionThis report has been prepared for Sample Client.
The merchant transaction analysis within this section provides information about your performanceagainst similar businesses in your industry and profiles the customers that frequent your business.
We present information in aggregated summary format, often only in percentages, to ensure wecomply with our privacy and confidentiality obligations. In concentrated industries or locationsinformation may not be disclosed. All data provided to Commonwealth Bank clients through thereport's Merchant Analysis is aggregated by industry and location, without any indication of individualmerchants' transactions and performance.
Merchant Analysis PaymentsYour merchant data is compared to a set of companies (called the Competitive Set). These arebusinesses within a similar industry and similar locations. Your competitive set has a 10km radius.
The industry is what is recorded in the CBA Merchant system.
Merchant Analysis Demographics and LoyaltyYour customer data is based on Commonwealth Bank card holders (this includes credit and debitcard holders) that frequent your business and transact on a CBA merchant terminal. The bankaggregates and analysis the behaviour of these customers.
Merchant Analysis Location and FamilyThe footprint and activity is based on the location and transactions of CBA customers profiled at anaggregated level.
Each page within the following sections also highlights some key insights extracted from the data.
Merchant AccountsAccount No. Trading Name City / Suburb0000000000000000 Sample Client Manly
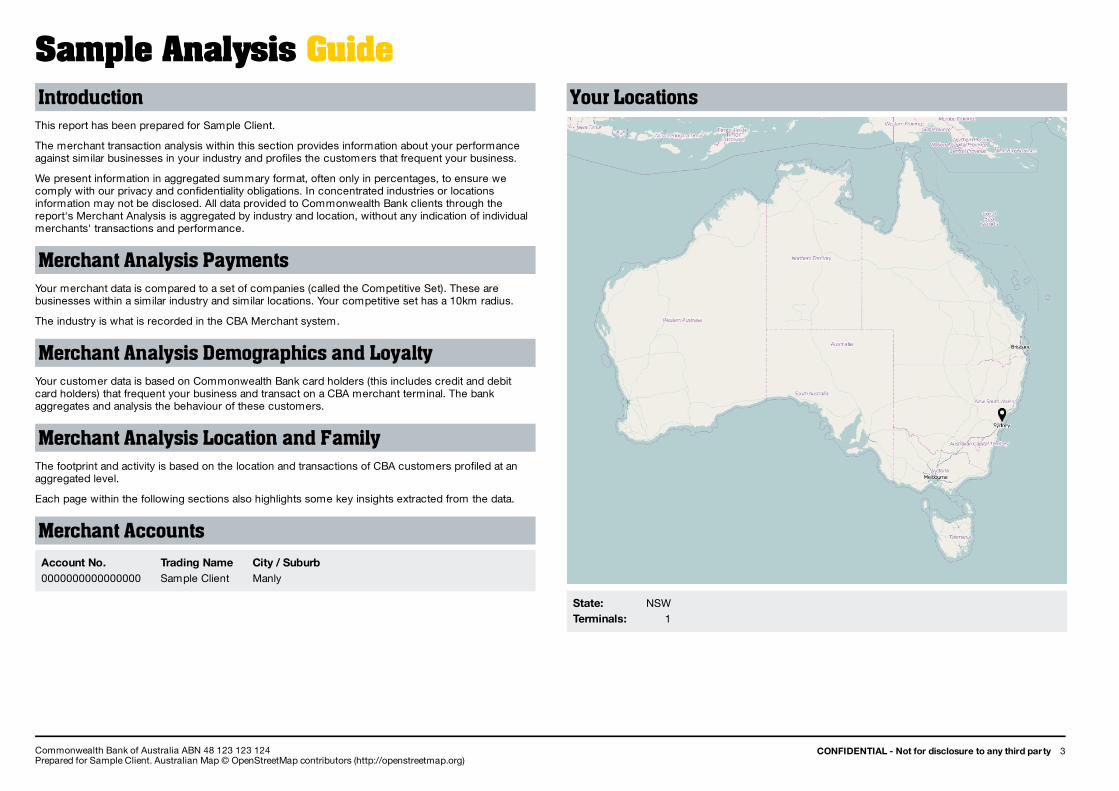
Your Locations
State: NSWTerminals: 1
Sample Analysis Guide
CONFIDENTIAL - Not for disclosure to any third party 3Commonwealth Bank of Australia ABN 48 123 123 124Prepared for Sample Client. Australian Map © OpenStreetMap contributors (http://openstreetmap.org)

Quarterly Sales Trend
Monthly Sales Distribution
1. For more information on the competitive set refer to the "Merchant Analysis Guide" in this report
2. Refers to total sales ($)
Key InsightsYour merchant sales have grown by 30% in the past 12 months. The sales of your industrycompetitors have grown by 5%.
There is a 6% difference in contribution to yearly sales between your highest month October andlowest month July while your industry competitors have a 2% difference in contribution to yearlysales between their highest month March and lowest month January.
79% of your merchant transactions are on Debit which is higher than your industry competitorswho have 32% on Debit.
Your business is smaller than most other businesses in this industry with 61% being larger and25% being smaller.
Card Type
Competition
Note: Size comparison based on total sales
Sample Analysis Payments
Change in quarterly sales ($) benchmarked to the first stated quarter
Your Growth Competitive Set 1 Trend
Jul-2015 to Sep-2015
Oct-2015 to Dec-2015
Jan-2016 to Mar-2016
Apr-2016 to Jun-2016
0%
20%
40%
Distribution of sales ($) and volume by month
Your Estimated Volume Competitive Set 1 Estimated Volume Your Estimated SalesCompetitive Set 1 Estimated Sales
Jul-2015
Aug-2015
Sep-2015
Oct-2015
Nov-2015
Dec-2015
Jan-2016
Feb-2016
Mar-2016
Apr-2016
May-2016
Jun-2016
0%
10%
2.5%
5%
7.5%
12.5%
% transaction volume from each stated card type
VisaMasterCardDebitCommercial & Other
Your Business Industry Competition0%
50%
100%
Relative size 2 of your business compared to the competitive set 1
14% 11% 14% 10% 51%
SignificantlyLess Sales
Less Sales Similar Sales Greater Sales SignificantlyGreater Sales
CONFIDENTIAL - Not for disclosure to any third party 4Commonwealth Bank of Australia ABN 48 123 123 124Prepared for Sample Client. Note: Information on this page is primarily sourced from the CBA Merchant System.For further information regarding a consolidated merchant transaction analysis for your business, please talk to your Relationship Manager.

F
Customer Demographics
Age Distribution
Key InsightsThe gender of customers is substantially different with 77% being male.
The highest annual sales value comes from the 20-24 yrs age band which contributes 32% ofmerchant sales.
The 50-64 yrs age band has the highest spending per transaction ($29).
The largest value (44%) comes from the Wealthy Households group, however the largesttransaction size ($20) is from the Lower Medium Income Households group.
Socioeconomic BackgroundConsumer Profile % of Customers % of Volume % of Value Avg per
TransWealthy Households 43% 44% 44% $18High Income Professional Households 17% 18% 19% $19Multi-cultural Households 12% 10% 10% $17Young High Income Singles 11% 10% 9% $17Medium Income Households 4% 4% 5% $20Low Income Singles 2% 4% 4% $18Young Multi-cultural Singles 4% 3% 4% $20Young High Income Families 4% 3% 2% $16Low Income Retirees 2% 2% 2% $19Lower Medium Income Households 2% 1% 2% $20Low Income Rural Households 0% 0% 0% $15
Loyalty1
Repeat customers at same location % of Customers % of Volume % of Value Avg perTrans
Once off only 75% 45% 45% $19Repeat 2-4 times 20% 30% 30% $19Repeat 5-15 times 5% 21% 21% $19Repeat > 15 times 0% 4% 3% $16
Repeat customers at any of yourlocations
% of Customers % of Volume % of Value Avg perTrans
Once off only 75% 45% 45% $19Repeat 2-4 times 20% 30% 30% $19Repeat 5-15 times 5% 21% 21% $19Repeat > 15 times 0% 4% 3% $16
1. If you have only one location both tables will be identical
Sample Analysis Demographics and Loyalty
M77% 23%
Distribution of your customers by age group and gender
< 20yrs 20-24yrs 25-34yrs 35-49yrs 50-64yrs > 64yrs0%
10%
20%
30%
40%
Sales ($) distribution and average annual spend by age group
$31$28 $29
$31
$40
$22
$15$16
$18
$24
$29
$20
Total Sales ($) Average Annual Spend per Customer Average Spend per Transaction
< 20yrs 20-24 yrs 25-34 yrs 35-49 yrs 50-64 yrs > 64yrs0%
10%
20%
30%
40%
50%
CONFIDENTIAL - Not for disclosure to any third party 5Commonwealth Bank of Australia ABN 48 123 123 124Prepared for Sample Client. Note: Information on this page is primarily sourced from the CBA Merchant System and ABS data.

Distance from Store
Estimated Family Composition of your Customers
Family Composition % of Customers Avg Spend per Cust Avg Spend per TransSingle or living alone 79 $31 $18Married or living with family 21 $30 $23
Key InsightsOver half of your customers live less than 15km from your locations.
21% of your customers are families and they spend on average $1 less per year than those wholive alone.
The top suburb, accounting for 34% of customers, is Seaforth (2092).
Top Catchments
Top PostcodesWhere your customers live
Postcode Suburb % of Customers % of Volume % of Value Avg perTrans
2092 Seaforth 34% 43% 46% $212093 Balgowlah 32% 28% 30% $202099 Dee Why 9% 8% 6% $142088 Mosman 7% 7% 7% $192095 Manly 5% 4% 4% $182094 Fairlight 4% 3% 2% $162096 Freshwater 3% 3% 3% $172086 Frenchs Forest 3% 2% 2% $17
Sample Analysis Location and Family
Distance between customer home location and transaction location
% of Customers % of Spend
< 7km 7-15km 15-30km 30-50km > 50km0%
20%
40%
60%
Customers
79%
21%
Sales ($)
79%
21% Single or living aloneMarried or living with family
Where your customers live
% of Customers % of Value % of Volume
NorthernBeaches
North Sydney Hurstville Gosford Chatswood0%
25%
50%
75%
CONFIDENTIAL - Not for disclosure to any third party 6Commonwealth Bank of Australia ABN 48 123 123 124Prepared for Sample Client. Note: Information on this page is primarily sourced from the CBA Merchant System.

Online vs In-Store Distribution
Monthly Sales Distribution - Online vs In-Store
1. For more information on the competitive set refer to the "Merchant Analysis Guide" in this report
Key Insights98.82% of your business sales value is online which is much higher than the industry average
Young Adult20-24yrs is the largest age group buying your products online
Youth<20yrs has the highest spending per transaction online
Age Distribution - Online vs In-Store
Gender
55% of your online customers are female
Repeat Customers
Approx. 4% of your online base are repeat customers
Sample Analysis Online
Your transaction volume
99%
1%
Competitive set 1 transaction volume
67%
33%
OnlineIn-Store
Distribution of your sales ($) and volume by month
In-Store Volume Online Volume In-Store Sales Value Online Sales Value
Jan16
Feb16
Mar16
Apr16
May16
Jun16
Jul16
Aug16
Sep16
Oct16
Nov16
Dec16
0%
20%
40%
60%
80%
Sales ($) distribution and average annual spend by age group
$219
$53 $55$78 $67 $72
$41$15 $16 $22
Total Value Online Total Value In-Store Average online Spend per TransactionAverage In-store Spend per Transaction
<20 yrs 20-24yrs 25-34yrs 35-49yrs 50-64yrs >64 yrs0%
20%
40%
60%
80%
THIS IS A TEST REPORT ONLY and CONFIDENTIAL - Not for disclosure to any third party 7Commonwealth Bank of Australia ABN 48 123 123 124Prepared for sdfsds. Note: Information on this page is primarily sourced from the CBA Merchant System.* Competitive set for this chart limited to those merchants with ecommerce facilities.

Your Top 3 BillersBelow is a list of your CBA BPAY Biller Codes:
Biller Code AccountXXXXX XXXXXXXXXXXXXXX XXXXXXXXXX
Monthly Sales Distribution
Note: Monthly distribution over 12 months period.
BPAY Usage Change Over 12 MonthsVol Change1 Avg Tran Val
Your Volume -4% $420.19Industry Volume +7% $558.11
1. Refers to year on year change
2. For more information on the competitive set refer to the "Merchant Analysis Guide" in this report
Key InsightsYour average BPAY transaction is $420.19 which is lower than the industry average
97.8% of your BPAY sales value is from debit cards
Youth<20yrs is the largest customer group using BPAY
Payment Preferences - Your CustomersCredit Debit
By Sales ($) 2% 98%By Volume 2% 98%
Payment Preferences – Competitive Set 2
Credit Debit
By Sales ($) 1% 99%By Volume 1% 99%
Age distribution
Sample BPAY Analysis Payments
Distribution of sales ($) and volume by month
Your Estimated Volume Industry Estimated Volume Your Estimated SalesIndustry Estimated Sales
Aug16
Jul16
Jun16
Jan16
Feb16
Mar16
Apr16
May16
Sep16
Oct16
Nov16
Dec16
0%
100%
25%
50%
75%
Volume distribution by age group
Your BPay customers Your Total Customer Base
<20 yrs 20-24yrs 25-34yrs 35-49yrs 50-64yrs >64 yrs NA(Businesses)
0%
25%
50%
75%
THIS IS A TEST REPORT ONLY and CONFIDENTIAL - Not for disclosure to any third party 8Commonwealth Bank of Australia ABN 48 123 123 124Note: Information on this page is primarily sourced from the ABS and CBA internal databases.

Population and EmploymentApproximately 7.6 million people (32% of the Australian population) currently live in New South Wales.
The NSW population is predicted to grow 1.17% annually over the next 5 years, slightly lower than the1.29% annual growth predicted for Australia.
Unemployment is currently at 5.22%, slightly lower than the national unemployment rate of 5.82%.
Top 5 industries that NSW residents work in:
Industry Percentage of Working Population1. Healthcare & Social Assistance 12%2. Retail Trade 10%3. Manufacturing 8%4. Education & Training 8%5. Professional & Technology 8%
Business ProfileThere are approximately 708,000 actively trading businesses in NSW (33.4% of Australia).
Top 5 Industries & Catchments:
Percentage1. Construction 15%2. Professional & Technology 13%3. Rental, Hiring & Real Estate 11%4. Finance & Insurance 9%5. Agri, Forestry & Fishing 8%
1. Sydney - City and Inner South 15%2. Sydney - North Sydney and Hornsby 13%3. Sydney - Inner South West 11%4. Sydney - Parramatta 9%5. Sydney - Inner West 8%
Businesses that generate over $2 million in sales per annum:
Of these businesses, around 48,000 generate over $2 million in sales per annum.
Key IndicatorsConsumer spending has been supported by higher dwelling prices and a strong labour market.Consumer sentiment is above the national average. These factors suggest that NSW householdconsumption growth should outperform the national average in 2016. But nominal retail salesgrowth expected to slow.
Dwelling commencements forecast to be 65k in 2016. Demand for housing remains firm and iskeeping prices elevated. Population and employment growth is supporting housing demand.Further rate cuts may refuel the housing market.
Engineering capex has declined sharply. But non-residential building capex, including health andaged care, is buoyant. Further, there is a large pipeline of public works that will support total statecapital investment.
Export growth is modest and the state runs a large trade deficit. Coal is an important exportindustry and prices have fallen recently after a rally over March and April. Tourism and educationexports to continue to perform well.
Employment growth well above national average over the past year. The unemployment rate isbelow the national rate. Jobs growth over past year strongest in healthcare, professional services,accommodation and retail.
Inflation in Sydney has slowed considerably and is in line with the national average. Overall inflationpressures to remain muted but Sydney CPI should track higher than national CPI reflecting lessspare capacity in Sydney.
Family and WealthApproximately 71% of the households in NSW are families, and around 46% of those are families withchildren.
Families with chidren make up 61% of high-income (over $156,000 p.a.) households.
Top wealthy catchments: (with high percentage of household income over $156,000 p.a.)
Catchment Estimated householdswith income > $150K
1. Sydney - North Sydney and Hornsby 24%2. Sydney - Baulkham Hills and Hawkesbury 22%3. Sydney - Eastern Suburbs 21%4. Sydney - Inner West 19%5. Sydney - Northern Beaches 19%
New South Wales State Overview
21%
8%
5.8%
5.4%
3.8%
Sydney - City and InnerSouth
Sydney - North Sydney andHornsby
Sydney - Parramatta
Sydney - Inner South West
Sydney - South West
14%
13.2%
12.2%
9.4%
7.9%
Retail Trade
Construction
Wholesale Trade
Professional & Technology
Manufacturing
THIS IS A TEST REPORT ONLY and CONFIDENTIAL - Not for disclosure to any third party 7Commonwealth Bank of Australia ABN 48 123 123 124Note: Information on this page is primarily sourced from ABS. Unemployment data is as at Dec-2016

Population and EmploymentThe catchment covers the following boundaries: Eastern Suburbs - North / Eastern Suburbs -South.
Approximately 283,000 people (3.7% of the NSW population) currently live in this catchment.
The population of the Sydney - Eastern Suburbs catchment is predicted to grow 1.08% annuallyover the next 5 years, slightly lower than the 1.17% growth predicted for the state as a whole.
Unemployment is currently at 2.51%, much lower than the total state unemployment rate of5.22%.
Financial Health Indicators
Catchment Geography
Sydney - Eastern Suburbs Catchment Overview
Unemployment rate
Sydney - Eastern Suburbs Unemployment NSW Unemployment
Jan-16
Feb-16
Mar-16
Apr-16
May-16
Jun-16
Jul-16
Aug-16
Sep-16
Oct-16
Nov-16
Dec-16
0%
5%
10%
Estimated sales ($) and volume for merchants in this catchment
Sydney - Eastern Suburbs Sale Volume (m)Sydney - Eastern Suburbs Merchant Sales ($m)
Jan-16
Feb-16
Mar-16
Apr-16
May-16
Jun-16
Jul-16
Aug-16
Sep-16
Oct-16
Nov-16
Dec-16
2
2.5
3
1.5 $100
$125
$150
$175
THIS IS A TEST REPORT ONLY and CONFIDENTIAL - Not for disclosure to any third party 8Commonwealth Bank of Australia ABN 48 123 123 124Note: Information on this page is primarily sourced from the ABS and CBA internal databases.

Socioeconomic EnvironmentQualified professionals and managers
High density inner-city units with greater than average prices
More than half of the dwellings are privately rented
High incomes are improved by shares and interest from investments
Considerable rents and mortgage repayments
Numerous single persons, couples and sharers, aged between 20-34
Resident Population Profile
Working Population Employment Profile
Sydney - Eastern Suburbs Catchment Key Statistics
Estimated population distribution by age group Sydney - Eastern SuburbsNational Average
< 15yrs 15-19yrs 20-24yrs 25-34yrs 35-44yrs 45-54yrs 55-64yrs > 64yrs0%
10%
20%
30%
l Und
er /
Rep
rese
ntat
ion
/ Ove
r +
Household income distribution comparedto the national average
Low Average High VeryHigh
l Und
er /
Rep
rese
ntat
ion
/ Ove
r +
Cultural distribution compared tothe national average
Australia,NZ &
Oceania
Asia Europe& UK
Other
Age and income distribution Sydney - Eastern SuburbsNational Average
YoungLow
Income
YoungAverageIncome
YoungHigh
Income
OlderLow
Income
OlderAverageIncome
OlderHigh
Income
0%
50%
100%
Gender distribution
Female Male0%
50%
100%
Occupation distribution
Managers Professionals Technical& Trade
Community&
Personnel
Clerical &Admin
Sales Mach Op& Drivers
Labourers0%
25%
50%
Industry distribution
18.8%11.1%
9.4%9.4%
6.2%6%
5.8%5.3%5.3%
4.6%3.7%
3.4%3.1%
2.4%2.2%
Professional & TechnologyHealthcare & Social Assistance
Finance & InsuranceEducation & Training
Retail TradeConstruction
Information Media & TelcoPublic Admin & Safety
AdministrationTransport, Postal & Warehousing
ManufacturingAccommodation & Food
Wholesale TradeRental, Hiring & Real Estate
Other Services0% 2.5% 5% 7.5% 10% 12.5% 15% 17.5% 20%
THIS IS A TEST REPORT ONLY and CONFIDENTIAL - Not for disclosure to any third party 9Commonwealth Bank of Australia ABN 48 123 123 124

First trade surplus in almost 3 yearsAustralia's trade balance improved by $2,362 million to a surplus of $1,243 million in November. Itwas the first monthly trade surplus in 33 months. In trend terms the deficit improved to a 20-monthlow of $16 million in November. The rolling 12-month deficit improved from $28.6 billion to $23.8billion (smallest deficit in 18 months).
In November, exports of goods and services rose by 8.4 per cent (goods up 10.6 per cent) whileimports of goods and services fell by 0.1 per cent (goods down 0.2 per cent). Exports are up 15.7per cent on a year ago, while imports are down by 2.4 per cent. Services exports are up 9.8 percent on the year.
Rural exports rose by 17.3 per cent in the month while non-rural goods rose by 12.2 per cent.
Within imports, consumer imports fell by 0.4 per cent with capital goods imports down by 2.4 percent while intermediate goods imports rose by 1.2 per cent.
Consumption goods imports are down 3.4 per cent on a year ago while capital goods imports areup 0.8 per cent and intermediate goods imports are down by 6 per cent.
The monthly International Trade in Goods and Services release from the Bureau of Statistics providesestimates on exports and imports of physical goods and services.
Last updated: 06 January 2017
Producer pricesThe Sydney-Melbourne route is one of the busiest air routes in the world. The Sydney-Melbourneroute is also a key measure of business activity. In the year to October 2016, the number of flightsbetween Sydney and Melbourne eased from 59,625 to 59,413. But the number of passengers roseby 1.1 per cent to a record high of 775,717. As a result the smoothed load factor hit a record highof 83.4 per cent in the year to October.
In the year to October a record 8.87 million passengers were carried between Sydney andMelbourne. Smoothed annual growth in passenger numbers remained at 3.9 per cent.
There were 5.43 million passengers carried on Australian domestic commercial aviation (includingcharter operations) in October 2016, an increase of 0.3 per cent on October 2015. For the monthof October 2016 there were 58 354 aircraft trips, a decrease of 1.4 per cent compared withOctober 2015.
With passenger traffic increasing at a faster rate than capacity, the industry wide load factorincreased from 79.6 per cent in October 2015 to 80.0 per cent in October 2016. Load factors onindividual routes increased on 40 of the 66 routes. The moving annual load factor was the highestin four years.
The Bureau of Infrastructure, Transport and Regional Economics (BITRE) releases regular aviationdata.
Last updated: 06 January 2017
Record car sales in 2016In 2016, a total of 1,178,133 new vehicles were sold - a record for a calendar year.
Sales by State: NSW (397,563), Victoria (326,269), Queensland (233,026), Western Australia(100,234), South Australia (71,738), Tasmania (19,751), ACT (18,816) and NT (10,736).
Respective market shares by vehicle type were: passenger (41.3 per cent), SUV (37.4 per cent),light commercial (18.5 per cent), and heavy commercial (2.8 per cent).
The top-five segments by volume were small cars (224,450, down 4 per cent), medium SUV(172,194, up 16.5 per cent), 4x4 ute (146,820, up 10 per cent), large SUV (142,495, up 2 per cent)and small SUV (110,414, up 2 per cent).
The sub-total of sales by buyer type for 2016 was: private (571,544, down 7 per cent), business(472,156, up 13 per cent), government (40,989, down 1.4 per cent) and rental (60,335, up 6 percent). Buyers using their ABN to buy a single car count as a business sale, while novated leasescount as private.
The Federal Chamber of Automotive Industries releases estimates of car sales on the third businessday of the month.
Last updated: 05 January 2017
Commonwealth Bank Business Sales IndexThe Commonwealth Bank Business Sales Indicator (BSI) - a measure of economy-wide spending -rose by 1.2 per cent in November after an upwardly revised 1.1 per cent lift in October. Spendinggrowth had slowed earlier in the year ahead of the UK vote on European Union membership('Brexit') and the Australian Federal Election. But spending is now expanding at the fastest pace inseven-and-a-half years.
Over the first six months of 2016, economy-wide spending grew on average by 0.2 per cent amonth in trend terms; down from 0.5 per cent average monthly gains over 2015. But over the pastfour months spending has grown on average by 0.9 per cent a month. per cent in November - thestrongest annual growth rate in a year.
The seasonally-adjusted measure of spending rose by 2.8 per cent in November after falling by 0.4per cent in October and lifting by 0.5 per cent in September.
One of the strongest gains occurred in Government Services with spending up 4.5 per cent intrend terms in November after lifting by 4.7 per cent in October and 4.2 per cent in September.Spending at Amusement & Entertainment was also strong - up 3.6 per cent in November - andfollowed a 3.9 per cent rise in October and 3.7 cent gain in September.
Across states and territories in November sales were stronger in all states and territories, strongestwere NSW (up 1.8 per cent) followed by the ACT (up 1.4 per cent), Northern Territory &Queensland (up 1 per cent), Western Australia (up 0.9 per cent), South Australia (up 0.8 per cent),Victoria (up 0.7 per cent) and Tasmania (up 0.4 per cent).
The Business Sales Indicator (BSI) is obtained by tracking the value of credit and debit cardtransactions processed through CBA merchant facilities throughout Australia.
Last updated: 20 December 2016
Australian Economy Key Indicators
THIS IS A TEST REPORT ONLY and CONFIDENTIAL - Not for disclosure to any third party 10Commonwealth Bank of Australia ABN 48 123 123 124To obtain copies of all the above reports and others, please visit www.commbank.com.au/business

Planning for SuccessGoals and vision: Put your goals and visions for your business into writing - and date thedocument. Defining a target helps you maintain your commitment to your goals.
Succession planning: What will happen to your business down the track? Will you sell it when youretire? Whatever you decide, you need to have a plan in place.
Lifetime value: Mapping the spending patterns of returning customers can help you unlock thepotential for business growth.
Analyse your strengths and weaknesses: Conduct a SWOT analysis to identify the strengths,weaknesses, opportunities and threats of your business.
The 5 Key Numbers1. Reconciled cash flow
Your reconciled cash flow tells you where you stand and whether you have cash available tomeet immediate costs.
2. Days sales outstanding (DSO)
Days sales outstanding tells you how long, on average, it takes for an invoice to be paid.Days sales outstanding = (Total receivables outstanding / Total credit sales) * Number of days inperiod
3. Break even point
Your break-even point is the point at which revenues cover your expenses and can be calculatedas follows: Fixed costs are costs you must meet and generally include wages, rent, leases andadministrative costs, but not the variable costs of sales. Gross profit margin is the percentage ofeach sale left over after the costs of that sale have been covered.
4. Margin vs. markup
It's vital to understand the difference between margin and markup:
Margin is expressed as a percentage of the selling price:Margin = (Gross profit / Sales) * 100
Markup is expressed as a percentage of the cost:Markup = (Gross profit / Cost) * 100
5. Your industry metric
Every industry has at least one metric that is specific to that industry. Examples includeoccupancy rates (hotel industry), covers per night and wastage (restaurants), and staff utilisationrates (services).
Managing StaffMake sure you stay up-to-date with Australia's industrial relations system and Work Choices legislationby visiting:http://www.commbank.com.au/business/betterbusiness/managing-staff/the-new-ir-landscapehttp://www.deewr.gov.au
Your Business Without YouIt' vital that your business can function when you're not there. Here are some key ways to achievethat goal:
Share knowledge, tasks and responsibilities: Train people to share your tasks andresponsibilities, ensuring there's backup if you have to take time off for any reason. Choose at leastone or two "lieutenants" to share your invaluable management skills and knowledge with.
Involve your "lieutenants": Once you have trained up your lieutenants, be sure to involve them indecision-making.
Delegate: Give others a chance to share responsibility.
Emphasise team goals Motivate your staff so they want to help the business achieve its goals.
Reward staff: It pays to offer your staff competitive salaries and other rewards - if they feel valued,they'll work better.
Managing your Cash FlowEvery dollar that you invest in your business goes through the cash flow cycle before returning toyou, bringing some profit with it. So the faster you can make your cash flow cycle, the morefinancially successful your business will be. Always be alert for any potential cash flow problems suchas:
Suppliers regularly going unpaid for more than 60 days, or insisting on cash on delivery terms.
Frequent disputes with suppliers or regular changes to suppliers.
Late BAS lodgements.
Employee super payments in arrears.
Managing RiskRisk can't be eliminated but it can be managed. Protecting your business from the impact of risinginterest rates, changing commodity prices and currency movements will help to ensure steady cashflow.
You'll find useful information on managing risk at the NSW Government Small Business website athttp://www.smallbiz.nsw.gov.au/smallbusiness
Tips and Tricks
THIS IS A TEST REPORT ONLY and CONFIDENTIAL - Not for disclosure to any third party 11Commonwealth Bank of Australia ABN 48 123 123 124As this advice has been prepared without considering your objectives, financial situation or needs, you should, before acting on the above advice,consider its appropriateness to your circumstances and, if necessary, seek the appropriate professional advice.

Links to Relevant Government AgenciesAustrade
www.austrade.gov.au
Austrades role is to work with companies to help them achieve their export, investment andinternational business opportunities. They provide Export market Development Grants, show casecapabilities of Australian companies to international markets
Australian Bureau of Statistics (ABS)
www.abs.gov.au
The ABS provides statistics on a wide range of economic and social matters, serving government,business and the general population. This data can help businesses identify potential markets fortheir products
Australian Competition and Consumer Commission (ACCC)
www.accc.gov.au
Promotes competition and fair trade in the market place to benefit consumers, business and thecommunity. Businesses can use this site to gain knowledge on ensuring they comply with the fairtrading laws and obtaining information about product safety
Australian Human Rights Commission
www.humanrights.gov.au
This website provides businesses with information regarding anti-decsrimination and anti-harrassment laws in the workplace
Australian Securities and Investments Commission (ASIC)
www.asic.gov.au
Provides information to Australian Companies regarding regulations in starting, running and closingbusinesses
Australian Taxation Office
www.ato.gov.au
Provides information to businesses regarding BAS, record keeping, reporting and paying taxes
Department of Education and Training
education.gov.au
Provides businesses with information on Australian education system, vocational education andtraining, international education and research
Department of Employment
www.employment.gov.au
Provides businesses with information on workplace relations, skills shortage in Australia andindigenous employment
Department of Human Services
www.humanservices.gov.au
The Department of Human Services provides easy, high quality services to people at differentstages of their lives through the Medicare, Centrelink and Child Support programs.
Department of Immigration and Border Protection
www.border.gov.au
Provides informaton to businesses regarding employer sponsored visas, sponsored training visasand the importing and exporting of goods in Australia
Department of Industry, Innovation and Science
industry.gov.au
Supports globally competitive industries with scientific capability, technology, engineering andmathematics skills
Department of the Environment and Energy
www.environment.gov.au
Provides information on policies in relation to businesses whose actions may have a significantimpact on national environmental significance including land owners, developers and farmers
Export Finance and Insurance Corporation (EFIC)
www.efic.gov.au
This website provides informaton to businesses regarding financial services to help businessesgrow their export capabilities
Fair Work Ombudsman
www.fairwork.gov.au
This website provides information for businesses regarding advice on Commonwealth workplacelaws
Grants and Assistance
www.business.gov.au/Assistance
Provides businesses with Australian, state and territory government grants and assistanceinformation
Indigenous Business Australia (IBA)
www.iba.gov.au
IBA Enterprises works with Indigenous Australians to assist them to succeed in business
Appendix Government Agencies
THIS IS A TEST REPORT ONLY and CONFIDENTIAL - Not for disclosure to any third party 12Commonwealth Bank of Australia ABN 48 123 123 124Information is primarily sourced from the Government websites, Commonwealth Bank can not guarantee its accuracy.


