
ww
MEDIAN DPI F OR 20 10 VC V IN TAGE S SURGE S
6P E I N ENERGY:PME CASE S TUDY
9PE HORIZON IRRs BY FUND SIZE
14
SPONSORED BY
BENCHMARKING+ F UND P ERF ORM A NCE
through 3Q 2015

Venue Data Room
WELCOME TO VENUE
®DEAL SOLUTIONS
At RR Donnelley, our Venue Deal Solutions streamline every step of the deal life cycle.
888.773.8379www.rrdonnelley.comwww.venue.rrd.comCopyright © 2016 R. R. Donnelley & Sons Company.All rights reserved.
Venue Data Room — Whether conducting due diligence for a merger, raising capital, or developing a
document repository, our Venue Data Room is your ideal workspace for Deals. Done. Simple.
Credits & ContactPitchBook Data, Inc.
JOHN GABBERT Founder, CEO
ADLEY BOWDEN Vice President,
Market Development & Analysis
ContentGARRETT JAMES BLACK Senior Analyst
NIZAR TARHUNI Senior Analyst
BRIAN LEE Senior Analyst
EVAN B. MORRIS Analyst
JENNIFER SAM Senior Graphic Designer
Contact PitchBook pitchbook.com
RESEARCH
EDITORIAL
SALES
COPYRIGHT © 2016 by PitchBook Data, Inc. All rights reserved. No part of this publication may be reproduced in any form or by any means—graphic, electronic, or mechanical, including photocopying, recording, taping, and information storage and retrieval systems—without the express written permission of PitchBook Data, Inc. Contents are based on information from sources believed to be reliable, but accuracy and completeness cannot be guaranteed. Nothing herein should be construed as any past, current or future recommendation to buy or sell any security or an offer to sell, or a solicitation of an offer to buy any security. This material does not purport to contain all of the information that a prospective investor may wish to consider and is not to be relied upon as such or used in substitution for the exercise of independent judgment.
Introduction 4
PE & VC KS PME Benchmarks 5
KS PME Case Study: Energy 6
IRR by Fund Type 7
Quartiles & Benchmarks 8
PE IRRs 9
PE Fund Return Multiples 10
PE Fund Cash Flows 11-12
VC IRRs 13
VC Fund Return Multiples 14
VC Fund Cash Flows 15
Select Top Funds by IRR 16
Methodology 17
Contents
3 PITCHBOOK GLOBAL PE & VC BENCHMARKING & FUND PERFORMANCE REPORT
SPONSORED BY

IntroductionEach quarter, we seek to cover the full spectrum of activity in private equity
and venture capital, presenting multiple datasets along with analysis to inform
your decisions. Hence our initial quarterly reports—the U.S. and European
PE Breakdowns and the U.S. and European Venture Industry Reports—offer
overviews of quarter-over-quarter (QoQ) dealmaking, exits and fundraising.
But to round everything off, toward the end of the quarter we benchmark
global PE and venture fund performance, utilizing our most recent datasets
of fund performance to assess trends in distributions, IRRs, fund return
multiples and more. Surveying these latest numbers presents a useful, funds-
based perspective, particularly as the high tide of exit activity subsides, the
buyout cycle moves lower and the venture capital climate cools. Fund returns
are lagged, yet the picture they portray—particularly the sheer strength of
distributions across both PE and VC—helps explain current strong fundraising
across both PE and VC, as well as shifts in commitments across different
strategies, among other broader trends.
If you have any questions or comments, please don’t hesitate to reach out to us
at [email protected]. As a final note, all the funds return data within this
report is as of September 30, 2015; the lag is due to reporting cycles.
RR Donnelley is the world’s largest integrated communications company. The company works collaboratively with more than 60,000 customers worldwide to develop custom communications solutions that reduce costs, drive top-line growth, enhance ROI and increase compliance. Drawing on a range of proprietary and commercially available digital and
conventional technologies deployed across four continents, the company employs a suite of leading Internet based capabilities and other resources to provide pre-media, printing, logistics and business process outsourcing services to clients in virtually every private and public sector. Our Corporate Responsibility Report is available at www.rrdonnelley.com.
Our Venue® secure online workspace provides a powerful feature-set and an intuitive design that allows you to easily organize, manage, share and track all of your sensitive information. Venue® data rooms provide complete control, allowing you to manage who has access to your data room, which documents they see, and how they can interact with those documents.
Venue® data rooms are backed by RR Donnelley, a $10.5 billion corporation with more than 500 locations and nearly 60,000 employees worldwide. RR Donnelley’s total revenues are larger than all other virtual data room providers combined. Whether you’re conducting due diligence for a merger, raising capital, or developing a document repository, a Venue® virtual data room is the ideal virtual workspace for managing critical information.
RR Donnelley is the sponsor of the PitchBook Global PE & VC Benchmarking & Fund Performance Report. All information contained in this publication is for informational purposes only and should not be construed as legal, accounting, tax, or other professional advice of any kind, on any subject matter. RR Donnelley expressly disclaims all liability in respect to actions taken or not taken based on any or all the content herein.
MAKE WAY FOR
SMARTER, ON-THE-FLY MEETING PREP
US +1 206.623.1986
UK +44 (0)207.190.9809
pitchbook.com
Introducing PitchBook
Mobile. The same
excellent data, technology
and service from the
PitchBook Platform, now
available on a mobile
device.
Search:
“PitchBook”
Available for
4 PITCHBOOK GLOBAL PE & VC BENCHMARKING & FUND PERFORMANCE REPORT
SPONSORED BY
KS PME Benchmarks
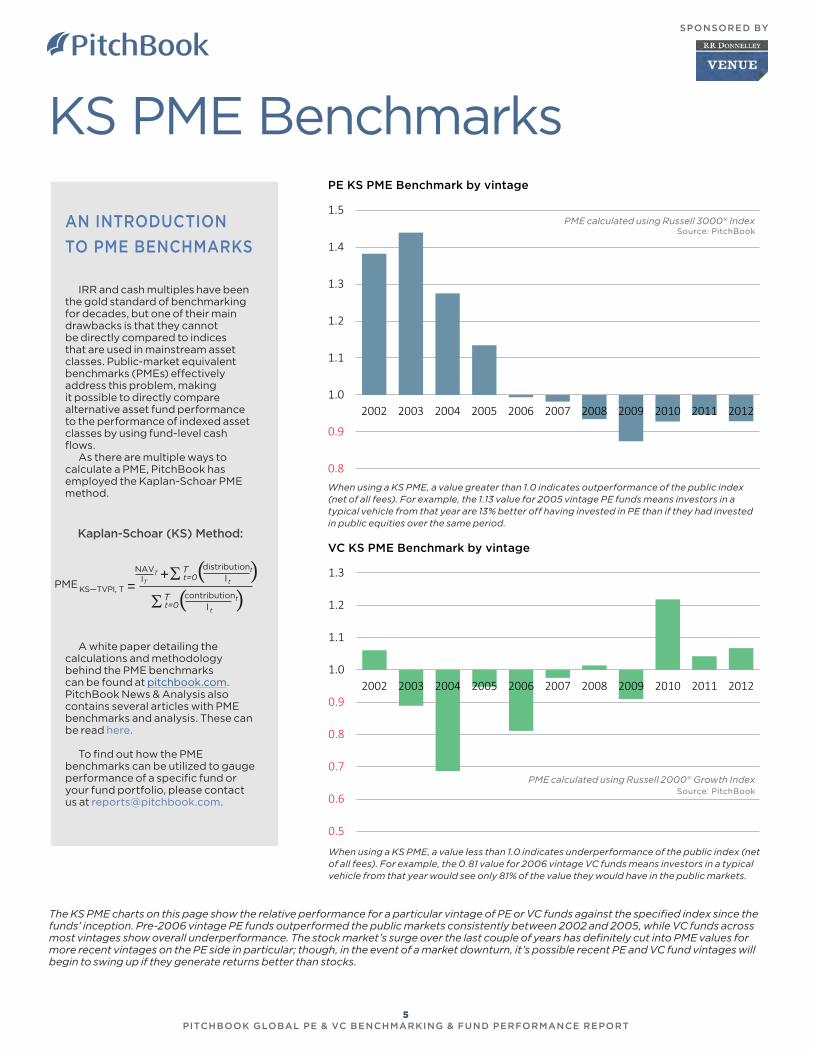
IRR and cash multiples have been the gold standard of benchmarking for decades, but one of their main drawbacks is that they cannot be directly compared to indices that are used in mainstream asset classes. Public-market equivalent benchmarks (PMEs) effectively address this problem, making it possible to directly compare alternative asset fund performance to the performance of indexed asset classes by using fund-level cash flows.
As there are multiple ways to calculate a PME, PitchBook has employed the Kaplan-Schoar PME method.
Kaplan-Schoar (KS) Method:
A white paper detailing the calculations and methodology behind the PME benchmarks can be found at pitchbook.com. PitchBook News & Analysis also contains several articles with PME benchmarks and analysis. These can be read here.
To find out how the PME benchmarks can be utilized to gauge performance of a specific fund or your fund portfolio, please contact us at [email protected].
PMEKS—TVPI, T =S t=0
distribution
I t
T tNAVTIT
( )+
AN INTRODUCTION
TO PME BENCHMARKS
S t=0T contribution
I t
t( )
PE KS PME Benchmark by vintage
VC KS PME Benchmark by vintage
Source: PitchBook
The KS PME charts on this page show the relative performance for a particular vintage of PE or VC funds against the specified index since the funds’ inception. Pre-2006 vintage PE funds outperformed the public markets consistently between 2002 and 2005, while VC funds across most vintages show overall underperformance. The stock market’s surge over the last couple of years has definitely cut into PME values for more recent vintages on the PE side in particular; though, in the event of a market downturn, it’s possible recent PE and VC fund vintages will begin to swing up if they generate returns better than stocks.
When using a KS PME, a value greater than 1.0 indicates outperformance of the public index (net of all fees). For example, the 1.13 value for 2005 vintage PE funds means investors in a typical vehicle from that year are 13% better off having invested in PE than if they had invested in public equities over the same period.
When using a KS PME, a value less than 1.0 indicates underperformance of the public index (net of all fees). For example, the 0.81 value for 2006 vintage VC funds means investors in a typical vehicle from that year would see only 81% of the value they would have in the public markets.
PME calculated using Russell 3000® Index
PME calculated using Russell 2000® Growth IndexSource: PitchBook
0.8
0.9
1.0
1.1
1.2
1.3
1.4
1.5
2002 2003 2004 2005 2006 2007 2008 2009 2010 2011 2012
0.5
0.6
0.7
0.8
0.9
1.0
1.1
1.2
1.3
2002 2003 2004 2005 2006 2007 2008 2009 2010 2011 2012
5 PITCHBOOK GLOBAL PE & VC BENCHMARKING & FUND PERFORMANCE REPORT
SPONSORED BY
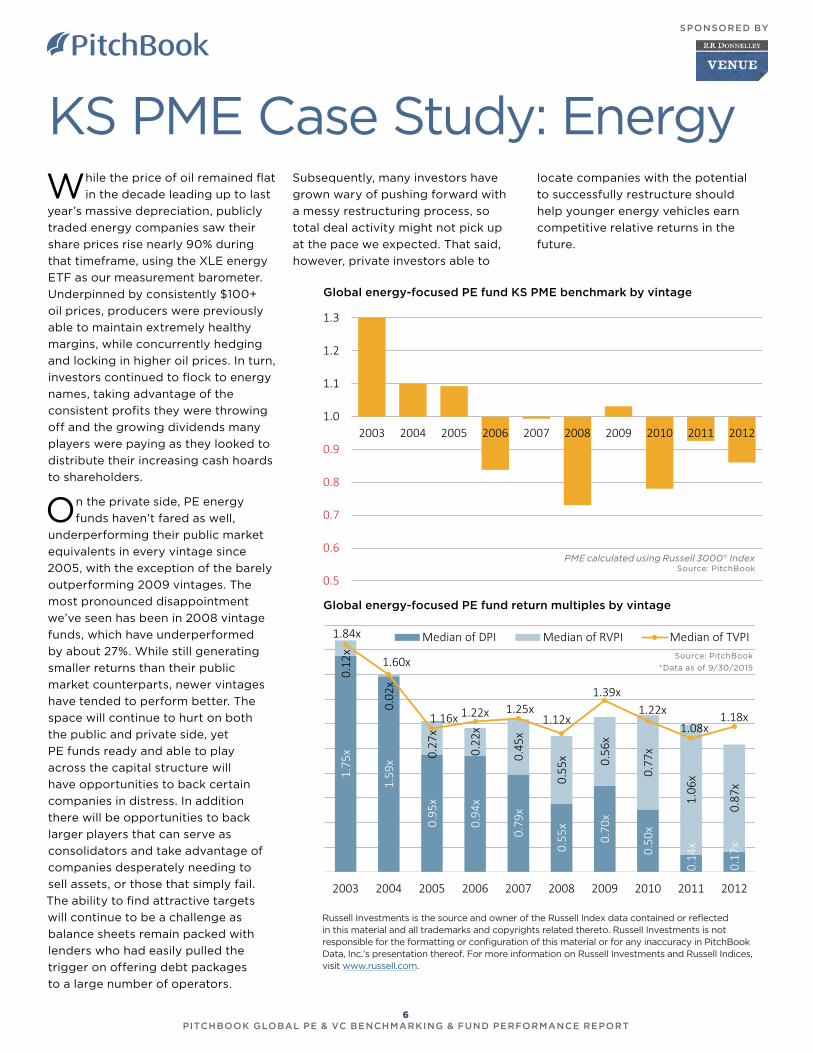
KS PME Case Study: EnergyW hile the price of oil remained flat
in the decade leading up to last
year’s massive depreciation, publicly
traded energy companies saw their
share prices rise nearly 90% during
that timeframe, using the XLE energy
ETF as our measurement barometer.
Underpinned by consistently $100+
oil prices, producers were previously
able to maintain extremely healthy
margins, while concurrently hedging
and locking in higher oil prices. In turn,
investors continued to flock to energy
names, taking advantage of the
consistent profits they were throwing
off and the growing dividends many
players were paying as they looked to
distribute their increasing cash hoards
to shareholders.
On the private side, PE energy
funds haven’t fared as well,
underperforming their public market
equivalents in every vintage since
2005, with the exception of the barely
outperforming 2009 vintages. The
most pronounced disappointment
we’ve seen has been in 2008 vintage
funds, which have underperformed
by about 27%. While still generating
smaller returns than their public
market counterparts, newer vintages
have tended to perform better. The
space will continue to hurt on both
the public and private side, yet
PE funds ready and able to play
across the capital structure will
have opportunities to back certain
companies in distress. In addition
there will be opportunities to back
larger players that can serve as
consolidators and take advantage of
companies desperately needing to
sell assets, or those that simply fail.
The ability to find attractive targets
will continue to be a challenge as
balance sheets remain packed with
lenders who had easily pulled the
trigger on offering debt packages
to a large number of operators.
Global energy-focused PE fund KS PME benchmark by vintage
Global energy-focused PE fund return multiples by vintage
Russell Investments is the source and owner of the Russell Index data contained or reflected in this material and all trademarks and copyrights related thereto. Russell Investments is not responsible for the formatting or configuration of this material or for any inaccuracy in PitchBook Data, Inc.’s presentation thereof. For more information on Russell Investments and Russell Indices, visit www.russell.com.
PME calculated using Russell 3000® IndexSource: PitchBook
Subsequently, many investors have
grown wary of pushing forward with
a messy restructuring process, so
total deal activity might not pick up
at the pace we expected. That said,
however, private investors able to
locate companies with the potential
to successfully restructure should
help younger energy vehicles earn
competitive relative returns in the
future.
Source: PitchBook
*Data as of 9/30/2015
0.5
0.6
0.7
0.8
0.9
1.0
1.1
1.2
1.3
2003 2004 2005 2006 2007 2008 2009 2010 2011 2012
1.75
x
1.59
x
0.95
x
0.94
x
0.79
x
0.55
x
0.70
x
0.50
x
0.14
x
0.17
x
0.12
x
0.02
x
0.27
x
0.22
x
0.45
x
0.55
x 0.56
x
0.77
x
1.06
x
0.87
x
1.84x
1.60x
1.16x 1.22x 1.25x1.12x
1.39x1.22x
1.08x1.18x
2003 2004 2005 2006 2007 2008 2009 2010 2011 2012
Median of DPI Median of RVPI Median of TVPI
6 PITCHBOOK GLOBAL PE & VC BENCHMARKING & FUND PERFORMANCE REPORT
SPONSORED BY
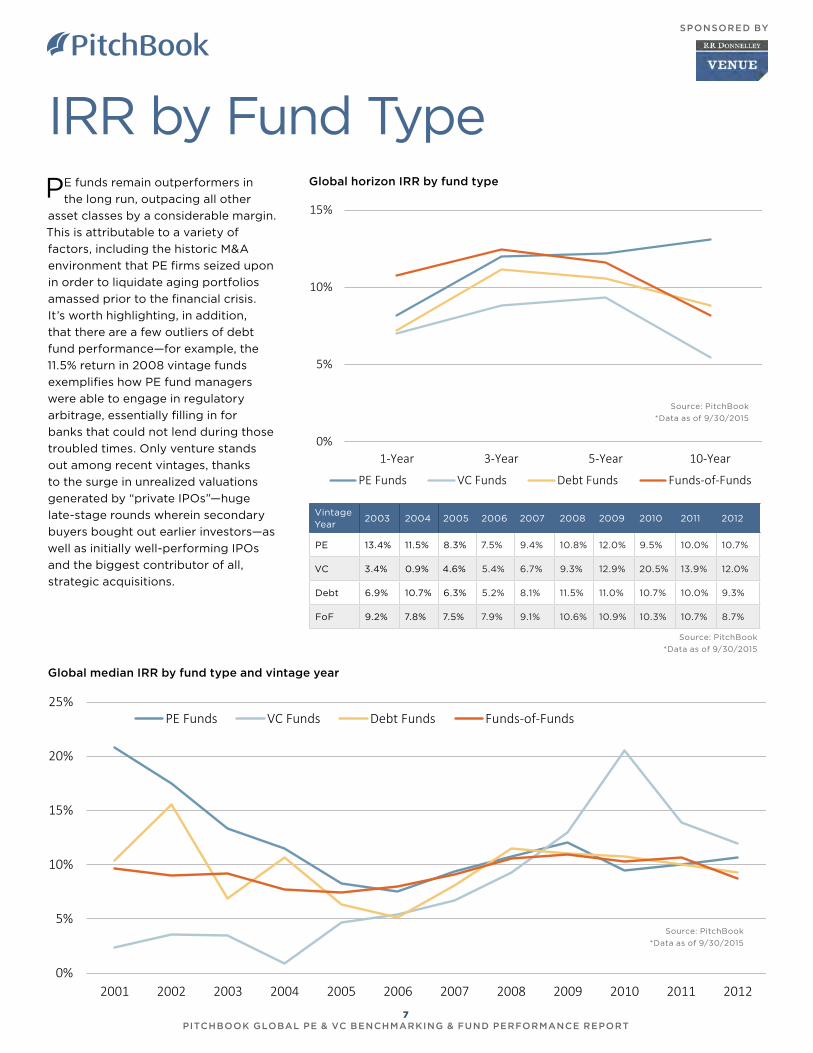
IRR by Fund TypeGlobal horizon IRR by fund type
Source: PitchBook
*Data as of 9/30/2015
Global median IRR by fund type and vintage year
Source: PitchBook
*Data as of 9/30/2015
Vintage Year
2003 2004 2005 2006 2007 2008 2009 2010 2011 2012
PE 13.4% 11.5% 8.3% 7.5% 9.4% 10.8% 12.0% 9.5% 10.0% 10.7%
VC 3.4% 0.9% 4.6% 5.4% 6.7% 9.3% 12.9% 20.5% 13.9% 12.0%
Debt 6.9% 10.7% 6.3% 5.2% 8.1% 11.5% 11.0% 10.7% 10.0% 9.3%
FoF 9.2% 7.8% 7.5% 7.9% 9.1% 10.6% 10.9% 10.3% 10.7% 8.7%
PE funds remain outperformers in
the long run, outpacing all other
asset classes by a considerable margin.
This is attributable to a variety of
factors, including the historic M&A
environment that PE firms seized upon
in order to liquidate aging portfolios
amassed prior to the financial crisis.
It’s worth highlighting, in addition,
that there are a few outliers of debt
fund performance—for example, the
11.5% return in 2008 vintage funds
exemplifies how PE fund managers
were able to engage in regulatory
arbitrage, essentially filling in for
banks that could not lend during those
troubled times. Only venture stands
out among recent vintages, thanks
to the surge in unrealized valuations
generated by “private IPOs”—huge
late-stage rounds wherein secondary
buyers bought out earlier investors—as
well as initially well-performing IPOs
and the biggest contributor of all,
strategic acquisitions.
Source: PitchBook
*Data as of 9/30/2015
0%
5%
10%
15%
1-Year 3-Year 5-Year 10-Year
PE Funds VC Funds Debt Funds Funds-of-Funds
0%
5%
10%
15%
20%
25%
2001 2002 2003 2004 2005 2006 2007 2008 2009 2010 2011 2012
PE Funds VC Funds Debt Funds Funds-of-Funds
7 PITCHBOOK GLOBAL PE & VC BENCHMARKING & FUND PERFORMANCE REPORT
SPONSORED BY
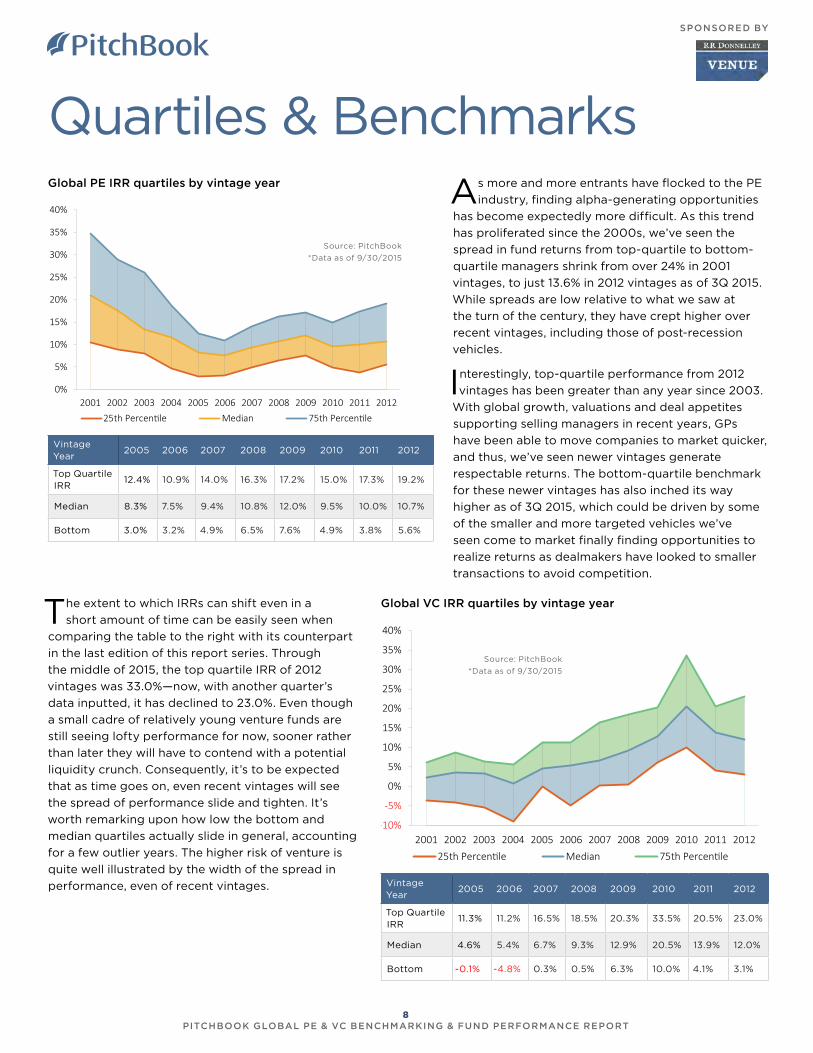
Quartiles & Benchmarks Global PE IRR quartiles by vintage year
Source: PitchBook
*Data as of 9/30/2015
As more and more entrants have flocked to the PE
industry, finding alpha-generating opportunities
has become expectedly more difficult. As this trend
has proliferated since the 2000s, we’ve seen the
spread in fund returns from top-quartile to bottom-
quartile managers shrink from over 24% in 2001
vintages, to just 13.6% in 2012 vintages as of 3Q 2015.
While spreads are low relative to what we saw at
the turn of the century, they have crept higher over
recent vintages, including those of post-recession
vehicles.
Interestingly, top-quartile performance from 2012
vintages has been greater than any year since 2003.
With global growth, valuations and deal appetites
supporting selling managers in recent years, GPs
have been able to move companies to market quicker,
and thus, we’ve seen newer vintages generate
respectable returns. The bottom-quartile benchmark
for these newer vintages has also inched its way
higher as of 3Q 2015, which could be driven by some
of the smaller and more targeted vehicles we’ve
seen come to market finally finding opportunities to
realize returns as dealmakers have looked to smaller
transactions to avoid competition.
Global VC IRR quartiles by vintage yearThe extent to which IRRs can shift even in a
short amount of time can be easily seen when
comparing the table to the right with its counterpart
in the last edition of this report series. Through
the middle of 2015, the top quartile IRR of 2012
vintages was 33.0%—now, with another quarter’s
data inputted, it has declined to 23.0%. Even though
a small cadre of relatively young venture funds are
still seeing lofty performance for now, sooner rather
than later they will have to contend with a potential
liquidity crunch. Consequently, it’s to be expected
that as time goes on, even recent vintages will see
the spread of performance slide and tighten. It’s
worth remarking upon how low the bottom and
median quartiles actually slide in general, accounting
for a few outlier years. The higher risk of venture is
quite well illustrated by the width of the spread in
performance, even of recent vintages.
Source: PitchBook
*Data as of 9/30/2015
Vintage Year
2005 2006 2007 2008 2009 2010 2011 2012
Top Quartile IRR
12.4% 10.9% 14.0% 16.3% 17.2% 15.0% 17.3% 19.2%
Median 8.3% 7.5% 9.4% 10.8% 12.0% 9.5% 10.0% 10.7%
Bottom 3.0% 3.2% 4.9% 6.5% 7.6% 4.9% 3.8% 5.6%
Vintage Year
2005 2006 2007 2008 2009 2010 2011 2012
Top Quartile IRR
11.3% 11.2% 16.5% 18.5% 20.3% 33.5% 20.5% 23.0%
Median 4.6% 5.4% 6.7% 9.3% 12.9% 20.5% 13.9% 12.0%
Bottom -0.1% -4.8% 0.3% 0.5% 6.3% 10.0% 4.1% 3.1%
0%
5%
10%
15%
20%
25%
30%
35%
40%
2001 2002 2003 2004 2005 2006 2007 2008 2009 2010 2011 201225th Percentile Median 75th Percentile
-10%
-5%
0%
5%
10%
15%
20%
25%
30%
35%
40%
2001 2002 2003 2004 2005 2006 2007 2008 2009 2010 2011 201225th Percentile Median 75th Percentile
8 PITCHBOOK GLOBAL PE & VC BENCHMARKING & FUND PERFORMANCE REPORT
SPONSORED BY
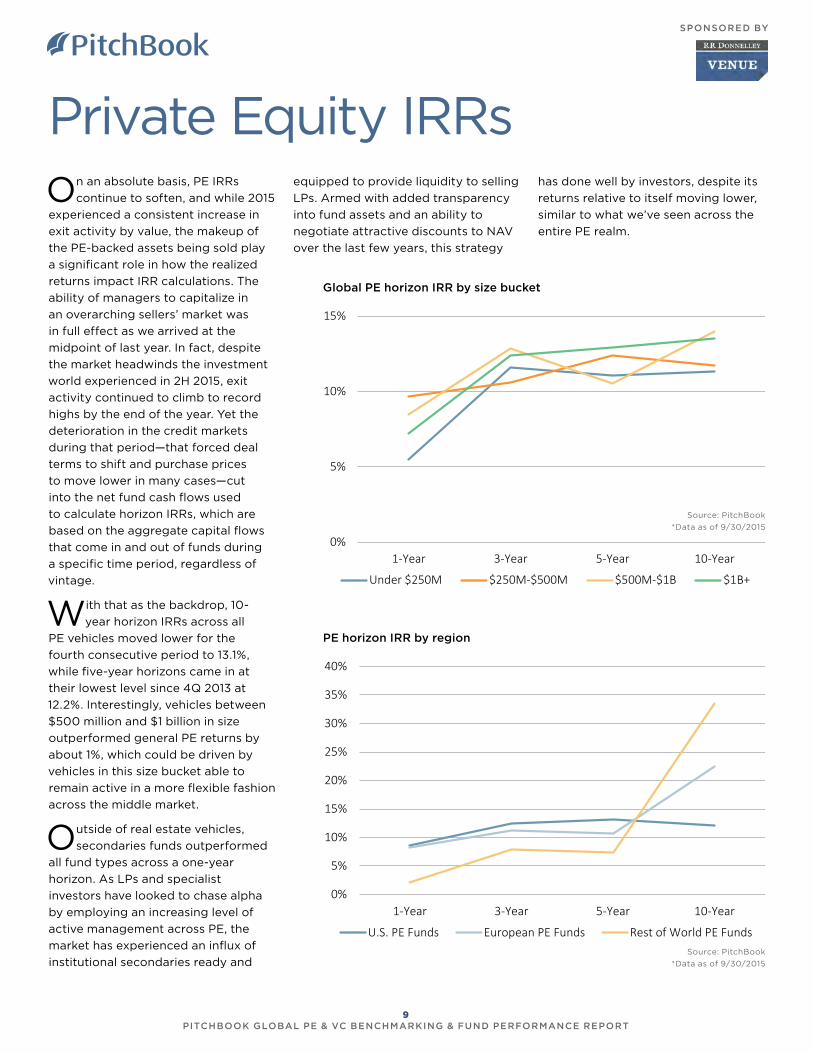
Private Equity IRRs
Global PE horizon IRR by size bucket
Source: PitchBook
*Data as of 9/30/2015
PE horizon IRR by region
Source: PitchBook
*Data as of 9/30/2015
On an absolute basis, PE IRRs
continue to soften, and while 2015
experienced a consistent increase in
exit activity by value, the makeup of
the PE-backed assets being sold play
a significant role in how the realized
returns impact IRR calculations. The
ability of managers to capitalize in
an overarching sellers’ market was
in full effect as we arrived at the
midpoint of last year. In fact, despite
the market headwinds the investment
world experienced in 2H 2015, exit
activity continued to climb to record
highs by the end of the year. Yet the
deterioration in the credit markets
during that period—that forced deal
terms to shift and purchase prices
to move lower in many cases—cut
into the net fund cash flows used
to calculate horizon IRRs, which are
based on the aggregate capital flows
that come in and out of funds during
a specific time period, regardless of
vintage.
With that as the backdrop, 10-
year horizon IRRs across all
PE vehicles moved lower for the
fourth consecutive period to 13.1%,
while five-year horizons came in at
their lowest level since 4Q 2013 at
12.2%. Interestingly, vehicles between
$500 million and $1 billion in size
outperformed general PE returns by
about 1%, which could be driven by
vehicles in this size bucket able to
remain active in a more flexible fashion
across the middle market.
Outside of real estate vehicles,
secondaries funds outperformed
all fund types across a one-year
horizon. As LPs and specialist
investors have looked to chase alpha
by employing an increasing level of
active management across PE, the
market has experienced an influx of
institutional secondaries ready and
equipped to provide liquidity to selling
LPs. Armed with added transparency
into fund assets and an ability to
negotiate attractive discounts to NAV
over the last few years, this strategy
has done well by investors, despite its
returns relative to itself moving lower,
similar to what we’ve seen across the
entire PE realm.
0%
5%
10%
15%
1-Year 3-Year 5-Year 10-Year
Under $250M $250M-$500M $500M-$1B $1B+
0%
5%
10%
15%
20%
25%
30%
35%
40%
1-Year 3-Year 5-Year 10-Year
U.S. PE Funds European PE Funds Rest of World PE Funds
9 PITCHBOOK GLOBAL PE & VC BENCHMARKING & FUND PERFORMANCE REPORT
SPONSORED BY
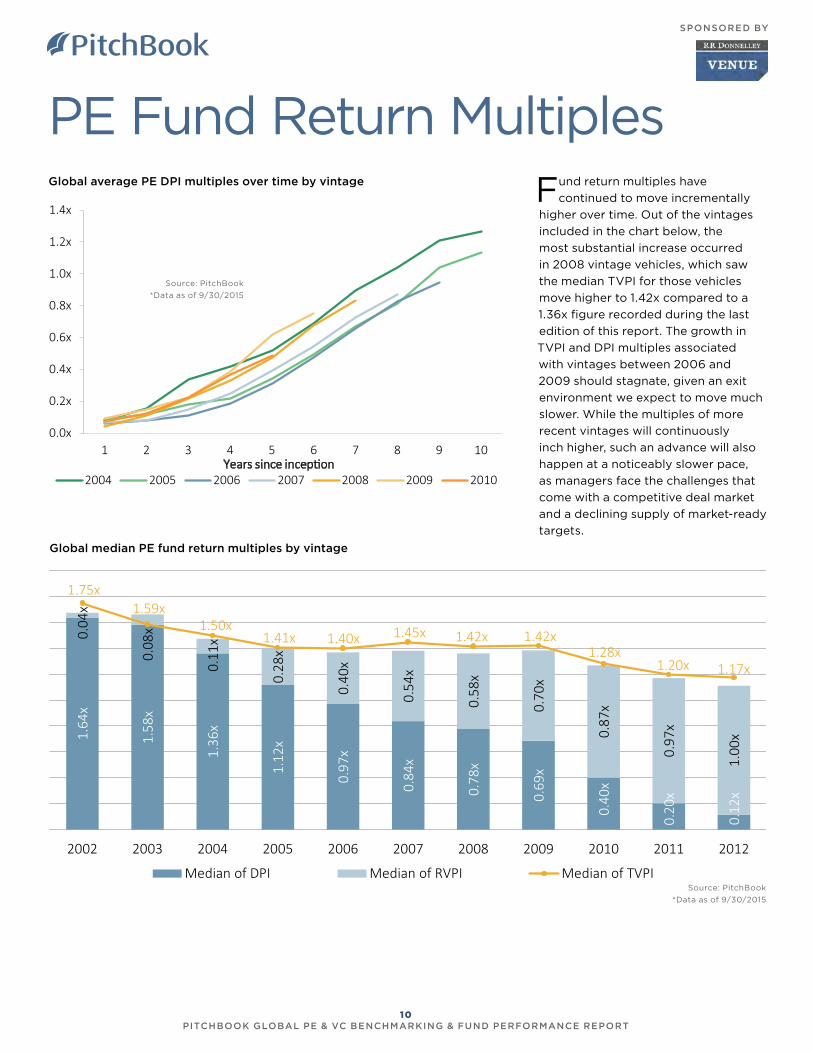
PE Fund Return MultiplesGlobal average PE DPI multiples over time by vintage
Global median PE fund return multiples by vintage
Source: PitchBook
*Data as of 9/30/2015
Source: PitchBook
*Data as of 9/30/2015
Fund return multiples have
continued to move incrementally
higher over time. Out of the vintages
included in the chart below, the
most substantial increase occurred
in 2008 vintage vehicles, which saw
the median TVPI for those vehicles
move higher to 1.42x compared to a
1.36x figure recorded during the last
edition of this report. The growth in
TVPI and DPI multiples associated
with vintages between 2006 and
2009 should stagnate, given an exit
environment we expect to move much
slower. While the multiples of more
recent vintages will continuously
inch higher, such an advance will also
happen at a noticeably slower pace,
as managers face the challenges that
come with a competitive deal market
and a declining supply of market-ready
targets.
0.0x
0.2x
0.4x
0.6x
0.8x
1.0x
1.2x
1.4x
1 2 3 4 5 6 7 8 9 10Years since inception
2004 2005 2006 2007 2008 2009 2010
1.64
x
1.58
x
1.36
x
1.12
x
0.97
x
0.84
x
0.78
x
0.69
x
0.40
x
0.20
x
0.12
x
0.04
x
0.08
x
0.11
x
0.28
x
0.40
x
0.54
x
0.58
x
0.70
x
0.87
x
0.97
x
1.00
x
1.75x1.59x
1.50x1.41x 1.40x 1.45x 1.42x 1.42x
1.28x1.20x 1.17x
2002 2003 2004 2005 2006 2007 2008 2009 2010 2011 2012
Median of DPI Median of RVPI Median of TVPI
10 PITCHBOOK GLOBAL PE & VC BENCHMARKING & FUND PERFORMANCE REPORT
SPONSORED BY
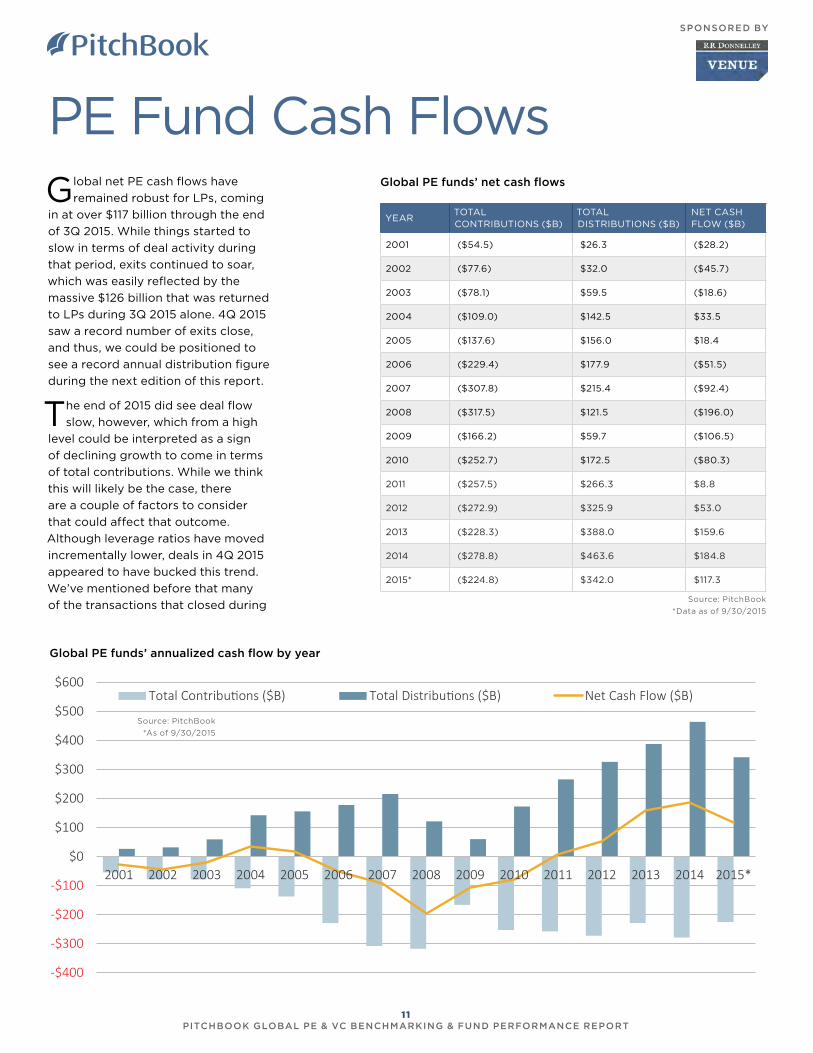
PE Fund Cash Flows
YEAR TOTAL CONTRIBUTIONS ($B)
TOTAL DISTRIBUTIONS ($B)
NET CASH FLOW ($B)
2001 ($54.5) $26.3 ($28.2)
2002 ($77.6) $32.0 ($45.7)
2003 ($78.1) $59.5 ($18.6)
2004 ($109.0) $142.5 $33.5
2005 ($137.6) $156.0 $18.4
2006 ($229.4) $177.9 ($51.5)
2007 ($307.8) $215.4 ($92.4)
2008 ($317.5) $121.5 ($196.0)
2009 ($166.2) $59.7 ($106.5)
2010 ($252.7) $172.5 ($80.3)
2011 ($257.5) $266.3 $8.8
2012 ($272.9) $325.9 $53.0
2013 ($228.3) $388.0 $159.6
2014 ($278.8) $463.6 $184.8
2015* ($224.8) $342.0 $117.3
Source: PitchBook
*Data as of 9/30/2015
Global PE funds’ annualized cash flow by year
Global net PE cash flows have
remained robust for LPs, coming
in at over $117 billion through the end
of 3Q 2015. While things started to
slow in terms of deal activity during
that period, exits continued to soar,
which was easily reflected by the
massive $126 billion that was returned
to LPs during 3Q 2015 alone. 4Q 2015
saw a record number of exits close,
and thus, we could be positioned to
see a record annual distribution figure
during the next edition of this report.
The end of 2015 did see deal flow
slow, however, which from a high
level could be interpreted as a sign
of declining growth to come in terms
of total contributions. While we think
this will likely be the case, there
are a couple of factors to consider
that could affect that outcome.
Although leverage ratios have moved
incrementally lower, deals in 4Q 2015
appeared to have bucked this trend.
We’ve mentioned before that many
of the transactions that closed during
-$400
-$300
-$200
-$100
$0
$100
$200
$300
$400
$500
$600
2001 2002 2003 2004 2005 2006 2007 2008 2009 2010 2011 2012 2013 2014 2015*
Total Contributions ($B) Total Distributions ($B) Net Cash Flow ($B)
Source: PitchBook
*As of 9/30/2015
Global PE funds’ net cash flows
11 PITCHBOOK GLOBAL PE & VC BENCHMARKING & FUND PERFORMANCE REPORT
SPONSORED BY
YEAR TOTAL CONTRIBUTIONS ($B)
TOTAL DISTRIBUTIONS ($B)
NET CASH FLOW ($B)
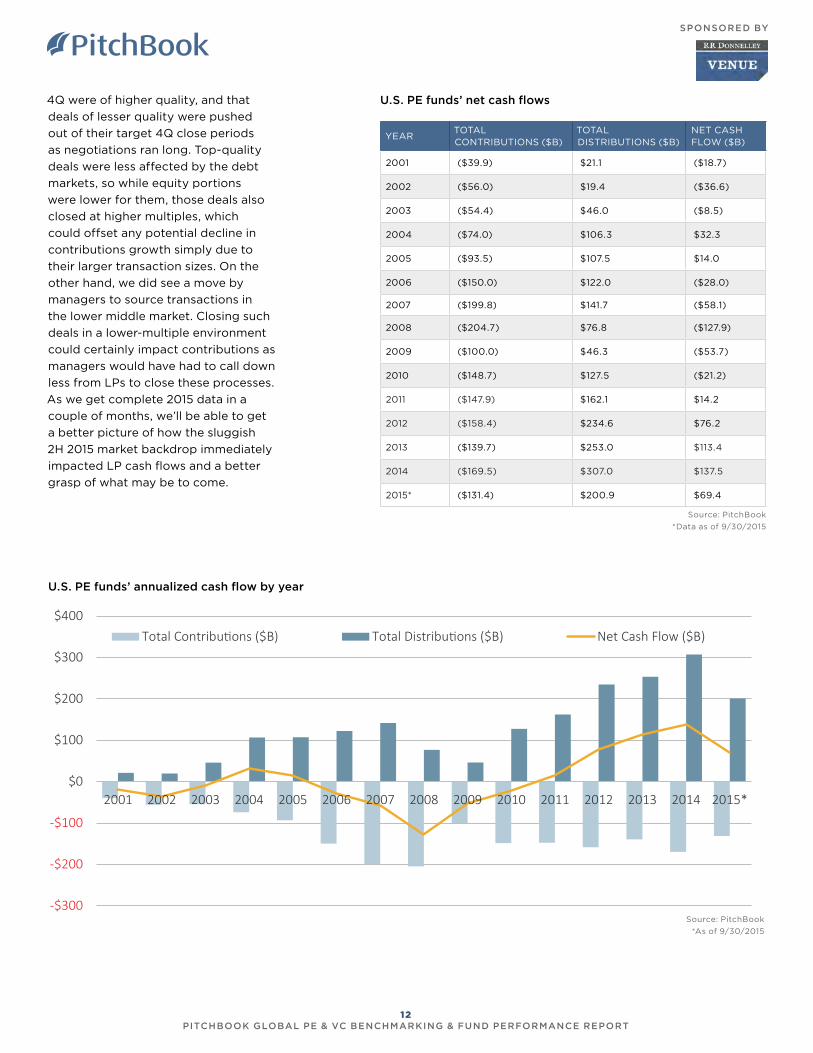
2001 ($39.9) $21.1 ($18.7)
2002 ($56.0) $19.4 ($36.6)
2003 ($54.4) $46.0 ($8.5)
2004 ($74.0) $106.3 $32.3
2005 ($93.5) $107.5 $14.0
2006 ($150.0) $122.0 ($28.0)
2007 ($199.8) $141.7 ($58.1)
2008 ($204.7) $76.8 ($127.9)
2009 ($100.0) $46.3 ($53.7)
2010 ($148.7) $127.5 ($21.2)
2011 ($147.9) $162.1 $14.2
2012 ($158.4) $234.6 $76.2
2013 ($139.7) $253.0 $113.4
2014 ($169.5) $307.0 $137.5
2015* ($131.4) $200.9 $69.4
Source: PitchBook
*Data as of 9/30/2015
U.S. PE funds’ annualized cash flow by year
4Q were of higher quality, and that
deals of lesser quality were pushed
out of their target 4Q close periods
as negotiations ran long. Top-quality
deals were less affected by the debt
markets, so while equity portions
were lower for them, those deals also
closed at higher multiples, which
could offset any potential decline in
contributions growth simply due to
their larger transaction sizes. On the
other hand, we did see a move by
managers to source transactions in
the lower middle market. Closing such
deals in a lower-multiple environment
could certainly impact contributions as
managers would have had to call down
less from LPs to close these processes.
As we get complete 2015 data in a
couple of months, we’ll be able to get
a better picture of how the sluggish
2H 2015 market backdrop immediately
impacted LP cash flows and a better
grasp of what may be to come.
Source: PitchBook
*As of 9/30/2015
U.S. PE funds’ net cash flows
-$300
-$200
-$100
$0
$100
$200
$300
$400
2001 2002 2003 2004 2005 2006 2007 2008 2009 2010 2011 2012 2013 2014 2015*
Total Contributions ($B) Total Distributions ($B) Net Cash Flow ($B)
12 PITCHBOOK GLOBAL PE & VC BENCHMARKING & FUND PERFORMANCE REPORT
SPONSORED BY
Venture Capital IRRs
Source: PitchBook
*As of 9/30/2015
Source: PitchBook
*As of 9/30/2015
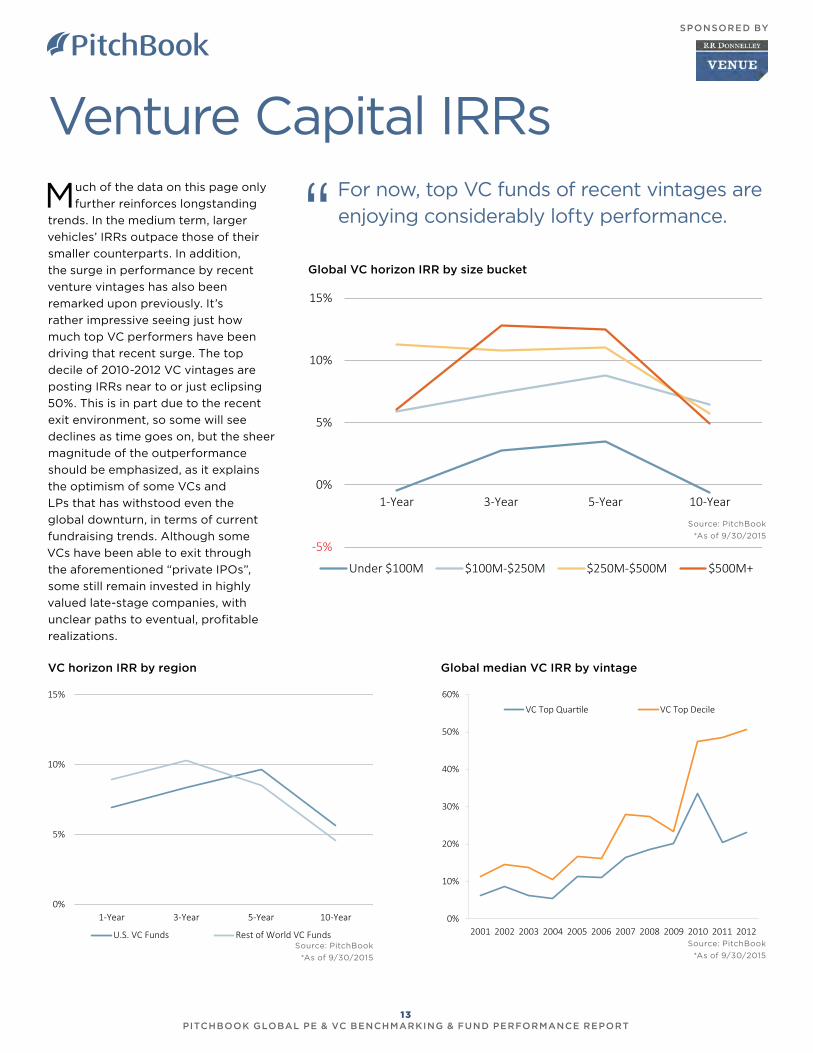
Global VC horizon IRR by size bucket
VC horizon IRR by region
Much of the data on this page only
further reinforces longstanding
trends. In the medium term, larger
vehicles’ IRRs outpace those of their
smaller counterparts. In addition,
the surge in performance by recent
venture vintages has also been
remarked upon previously. It’s
rather impressive seeing just how
much top VC performers have been
driving that recent surge. The top
decile of 2010-2012 VC vintages are
posting IRRs near to or just eclipsing
50%. This is in part due to the recent
exit environment, so some will see
declines as time goes on, but the sheer
magnitude of the outperformance
should be emphasized, as it explains
the optimism of some VCs and
LPs that has withstood even the
global downturn, in terms of current
fundraising trends. Although some
VCs have been able to exit through
the aforementioned “private IPOs”,
some still remain invested in highly
valued late-stage companies, with
unclear paths to eventual, profitable
realizations.
For now, top VC funds of recent vintages are enjoying considerably lofty performance.
-5%
0%
5%
10%
15%
1-Year 3-Year 5-Year 10-Year
Under $100M $100M-$250M $250M-$500M $500M+
0%
5%
10%
15%
1-Year 3-Year 5-Year 10-Year
U.S. VC Funds Rest of World VC Funds
Global median VC IRR by vintage
0%
10%
20%
30%
40%
50%
60%
2001 2002 2003 2004 2005 2006 2007 2008 2009 2010 2011 2012
VC Top Quartile VC Top Decile
Source: PitchBook
*As of 9/30/2015
13 PITCHBOOK GLOBAL PE & VC BENCHMARKING & FUND PERFORMANCE REPORT
SPONSORED BY
VC Fund Return Multiples
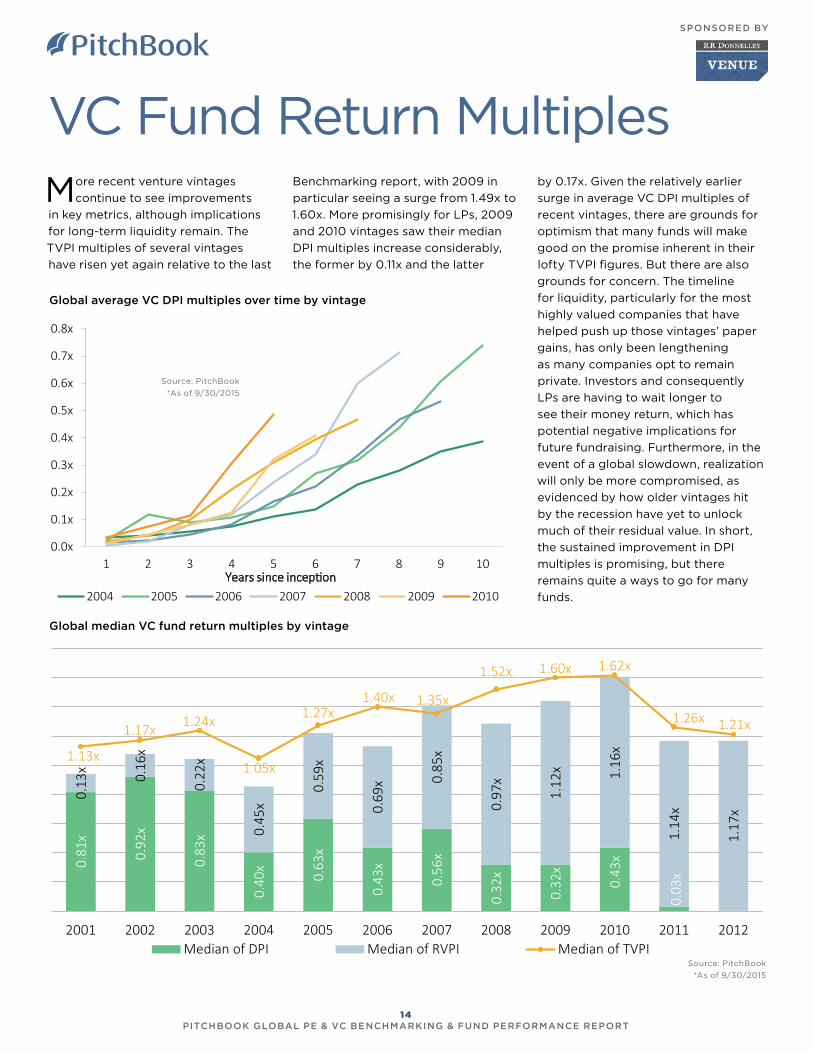
Global average VC DPI multiples over time by vintage
Source: PitchBook
*As of 9/30/2015
Global median VC fund return multiples by vintage
Source: PitchBook
*As of 9/30/2015
More recent venture vintages
continue to see improvements
in key metrics, although implications
for long-term liquidity remain. The
TVPI multiples of several vintages
have risen yet again relative to the last
Benchmarking report, with 2009 in
particular seeing a surge from 1.49x to
1.60x. More promisingly for LPs, 2009
and 2010 vintages saw their median
DPI multiples increase considerably,
the former by 0.11x and the latter
by 0.17x. Given the relatively earlier
surge in average VC DPI multiples of
recent vintages, there are grounds for
optimism that many funds will make
good on the promise inherent in their
lofty TVPI figures. But there are also
grounds for concern. The timeline
for liquidity, particularly for the most
highly valued companies that have
helped push up those vintages’ paper
gains, has only been lengthening
as many companies opt to remain
private. Investors and consequently
LPs are having to wait longer to
see their money return, which has
potential negative implications for
future fundraising. Furthermore, in the
event of a global slowdown, realization
will only be more compromised, as
evidenced by how older vintages hit
by the recession have yet to unlock
much of their residual value. In short,
the sustained improvement in DPI
multiples is promising, but there
remains quite a ways to go for many
funds.
0.0x
0.1x
0.2x
0.3x
0.4x
0.5x
0.6x
0.7x
0.8x
1 2 3 4 5 6 7 8 9 10Years since inception
2004 2005 2006 2007 2008 2009 2010
0.81
x
0.92
x
0.83
x
0.40
x
0.63
x
0.43
x
0.56
x
0.32
x
0.32
x
0.43
x
0.03
x
0.13
x 0.16
x
0.22
x
0.45
x
0.59
x
0.69
x 0.85
x
0.97
x
1.12
x 1.16
x
1.14
x
1.17
x1.13x
1.17x 1.24x
1.05x
1.27x1.40x 1.35x
1.52x 1.60x 1.62x
1.26x 1.21x
2001 2002 2003 2004 2005 2006 2007 2008 2009 2010 2011 2012Median of DPI Median of RVPI Median of TVPI
14 PITCHBOOK GLOBAL PE & VC BENCHMARKING & FUND PERFORMANCE REPORT
SPONSORED BY
VC Fund Cash Flows
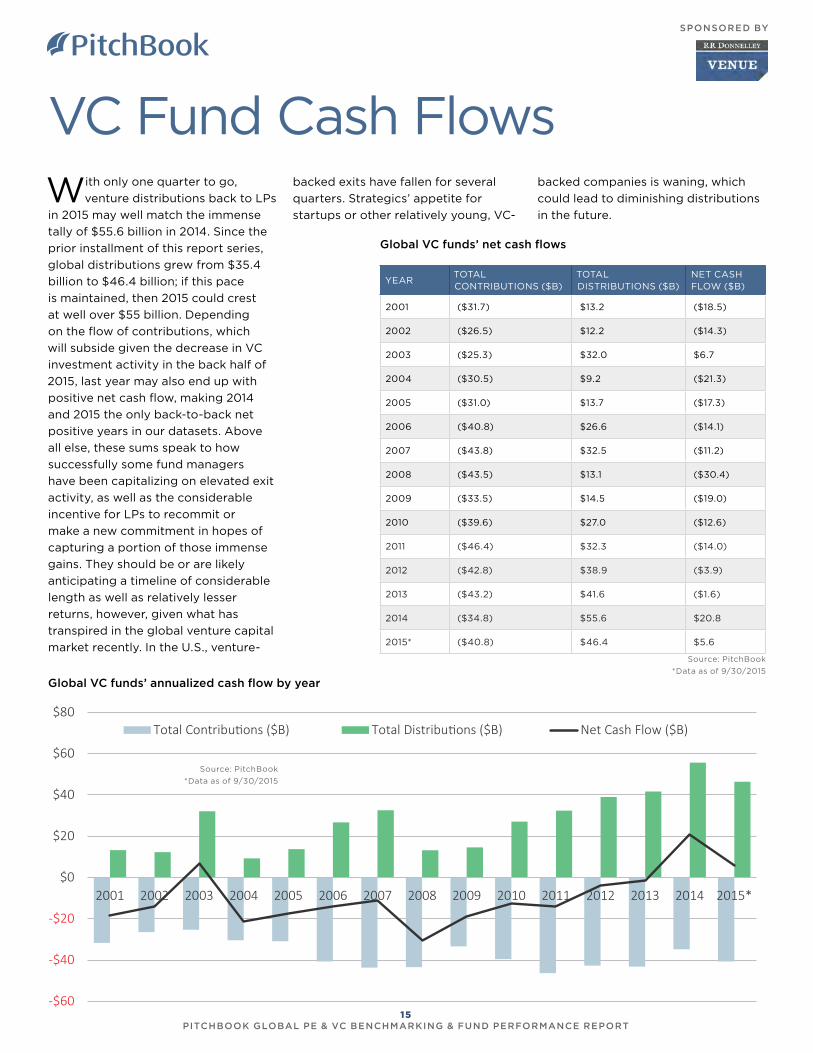
Global VC funds’ annualized cash flow by year
YEAR TOTAL CONTRIBUTIONS ($B)
TOTAL DISTRIBUTIONS ($B)
NET CASH FLOW ($B)
2001 ($31.7) $13.2 ($18.5)
2002 ($26.5) $12.2 ($14.3)
2003 ($25.3) $32.0 $6.7
2004 ($30.5) $9.2 ($21.3)
2005 ($31.0) $13.7 ($17.3)
2006 ($40.8) $26.6 ($14.1)
2007 ($43.8) $32.5 ($11.2)
2008 ($43.5) $13.1 ($30.4)
2009 ($33.5) $14.5 ($19.0)
2010 ($39.6) $27.0 ($12.6)
2011 ($46.4) $32.3 ($14.0)
2012 ($42.8) $38.9 ($3.9)
2013 ($43.2) $41.6 ($1.6)
2014 ($34.8) $55.6 $20.8
2015* ($40.8) $46.4 $5.6
Source: PitchBook
*Data as of 9/30/2015
With only one quarter to go,
venture distributions back to LPs
in 2015 may well match the immense
tally of $55.6 billion in 2014. Since the
prior installment of this report series,
global distributions grew from $35.4
billion to $46.4 billion; if this pace
is maintained, then 2015 could crest
at well over $55 billion. Depending
on the flow of contributions, which
will subside given the decrease in VC
investment activity in the back half of
2015, last year may also end up with
positive net cash flow, making 2014
and 2015 the only back-to-back net
positive years in our datasets. Above
all else, these sums speak to how
successfully some fund managers
have been capitalizing on elevated exit
activity, as well as the considerable
incentive for LPs to recommit or
make a new commitment in hopes of
capturing a portion of those immense
gains. They should be or are likely
anticipating a timeline of considerable
length as well as relatively lesser
returns, however, given what has
transpired in the global venture capital
market recently. In the U.S., venture-
backed exits have fallen for several
quarters. Strategics’ appetite for
startups or other relatively young, VC-
backed companies is waning, which
could lead to diminishing distributions
in the future.
-$60
-$40
-$20
$0
$20
$40
$60
$80
2001 2002 2003 2004 2005 2006 2007 2008 2009 2010 2011 2012 2013 2014 2015*
Total Contributions ($B) Total Distributions ($B) Net Cash Flow ($B)
Source: PitchBook
*Data as of 9/30/2015
Global VC funds’ net cash flows
15 PITCHBOOK GLOBAL PE & VC BENCHMARKING & FUND PERFORMANCE REPORT
SPONSORED BY
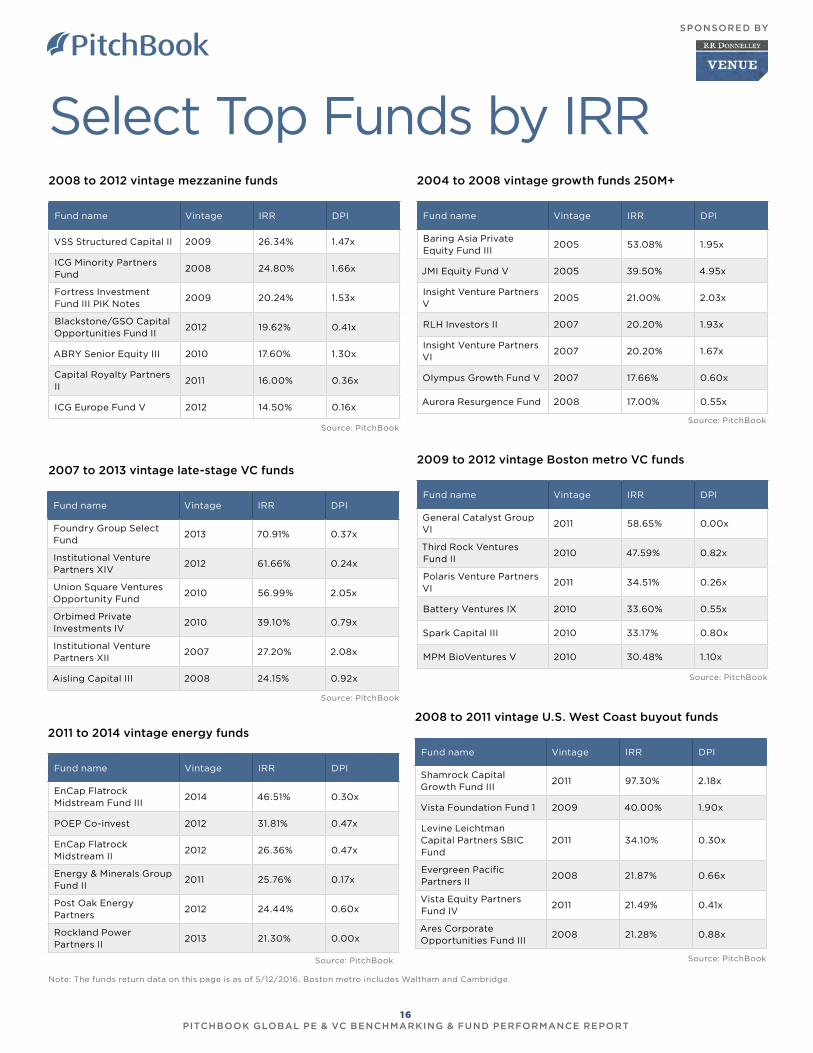
Fund name Vintage IRR DPI
VSS Structured Capital II 2009 26.34% 1.47x
ICG Minority Partners Fund
2008 24.80% 1.66x
Fortress Investment Fund III PIK Notes
2009 20.24% 1.53x
Blackstone/GSO Capital Opportunities Fund II
2012 19.62% 0.41x
ABRY Senior Equity III 2010 17.60% 1.30x
Capital Royalty Partners II
2011 16.00% 0.36x
ICG Europe Fund V 2012 14.50% 0.16x
Select Top Funds by IRR 2008 to 2012 vintage mezzanine funds
Fund name Vintage IRR DPI
Baring Asia Private Equity Fund III
2005 53.08% 1.95x
JMI Equity Fund V 2005 39.50% 4.95x
Insight Venture Partners V
2005 21.00% 2.03x
RLH Investors II 2007 20.20% 1.93x
Insight Venture Partners VI
2007 20.20% 1.67x
Olympus Growth Fund V 2007 17.66% 0.60x
Aurora Resurgence Fund 2008 17.00% 0.55x
2004 to 2008 vintage growth funds 250M+
Fund name Vintage IRR DPI
Foundry Group Select Fund
2013 70.91% 0.37x
Institutional Venture Partners XIV
2012 61.66% 0.24x
Union Square Ventures Opportunity Fund
2010 56.99% 2.05x
Orbimed Private Investments IV
2010 39.10% 0.79x
Institutional Venture Partners XII
2007 27.20% 2.08x
Aisling Capital III 2008 24.15% 0.92x
2007 to 2013 vintage late-stage VC funds
Fund name Vintage IRR DPI
General Catalyst Group VI
2011 58.65% 0.00x
Third Rock Ventures Fund II
2010 47.59% 0.82x
Polaris Venture Partners VI
2011 34.51% 0.26x
Battery Ventures IX 2010 33.60% 0.55x
Spark Capital III 2010 33.17% 0.80x
MPM BioVentures V 2010 30.48% 1.10x
2009 to 2012 vintage Boston metro VC funds
Fund name Vintage IRR DPI
EnCap Flatrock Midstream Fund III
2014 46.51% 0.30x
POEP Co-invest 2012 31.81% 0.47x
EnCap Flatrock Midstream II
2012 26.36% 0.47x
Energy & Minerals Group Fund II
2011 25.76% 0.17x
Post Oak Energy Partners
2012 24.44% 0.60x
Rockland Power Partners II
2013 21.30% 0.00x
2011 to 2014 vintage energy funds
Fund name Vintage IRR DPI
Shamrock Capital Growth Fund III
2011 97.30% 2.18x
Vista Foundation Fund 1 2009 40.00% 1.90x
Levine Leichtman Capital Partners SBIC Fund
2011 34.10% 0.30x
Evergreen Pacific Partners II
2008 21.87% 0.66x
Vista Equity Partners Fund IV
2011 21.49% 0.41x
Ares Corporate Opportunities Fund III
2008 21.28% 0.88x
2008 to 2011 vintage U.S. West Coast buyout funds
Source: PitchBook Source: PitchBook
Source: PitchBook
Source: PitchBook
Source: PitchBookSource: PitchBook
Note: The funds return data on this page is as of 5/12/2016. Boston metro includes Waltham and Cambridge.
16 PITCHBOOK GLOBAL PE & VC BENCHMARKING & FUND PERFORMANCE REPORT
SPONSORED BY

PitchBook currently tracks over 34,000 funds
around the world and has returns data on close
to 8,300 vehicles. In this edition of the quarterly
Benchmarking Reports, PitchBook examines
data from over 5,600 funds and 24,000
distinct LP commitments. We are constantly
adding historical performance data as it
becomes available; this explains many apparent
discrepancies that may appear between reports.
All returns data in this report is net of fees
through 3Q 2015, as reported by LPs.
DEFINITIONS
PE fund:
Unless otherwise noted, PE fund data includes
buyout, growth, co-investment, mezzanine,
restructuring and energy funds.
Debt fund:
For this report, the debt fund classification
includes general debt, mezzanine and distressed
debt.
Vintage year:
The vintage year as reported by the fund GP and
LPs, or the year in which a fund holds its final
close.
Internal rate of return (IRR):
IRR represents the rate at which a series of
positive and negative cash flows are discounted
so that the net present value of cash flows equals
zero.
Horizon IRR:
Horizon IRR shows the IRR from a certain point
in time. For example, the one-year horizon IRR
figures in this report show the IRR performance
for the one-year period from 3Q 2014 to 3Q
2015, while the three-year horizon IRR is for the
period from 3Q 2012 to 3Q 2015.
Distributions to paid-in (DPI):
A measurement of the capital that has been
distributed back to LPs as a proportion of the
total paid-in, or contributed, capital. DPI is
also known as the cash-on-cash multiple or the
realization multiple.
Remaining value to paid-in (RVPI):
A measurement of the unrealized return of a
fund as a proportion of the total paid-in, or
contributed, capital.
Total value to paid-in (TVPI):
A measurement of both the realized and
unrealized value of a fund as a proportion of
the total paid-in, or contributed, capital. Also
known as the investment multiple, TVPI can be
found by adding together the DPI and RVPI of
a fund. As the charts depict medians of fund
return multiples that are calculated based on
aggregated statistics, they may not necessarily
add up, whereas on an individual basis they
shall.
Methodology
17 PITCHBOOK GLOBAL PE & VC BENCHMARKING & FUND PERFORMANCE REPORT
SPONSORED BY

Contact PitchBook
pitchbook.com
RESEARCH [email protected]
EDITORIAL [email protected]
SALES [email protected]


