BENCHMARKING PASSENGER AIR
TRANSPORT MARKETING ACTIVITIES IN
VIETNAM
Case Company: Etihad Airways
LAHTI UNIVERSITY OF APPLIED
SCIENCES
Faculty of Business Studies
Degree programme in International Business
Bachelor Thesis
Spring 2015
Nga Nguyen
Lahti University of Applied Sciences
Degree programme in International Business
NGUYEN, NGA: Benchmarking passenger air transport marketing
activities in Vietnam
Case Company: Etihad Airways
Bachelor’s Thesis in International Business, 77 pages, 13 pages of appendices
Spring 2015
ABSTRACT
Marketing strategy is crucial for businesses operating in highly competitive
environments. Especially with the intense competition over international flights in
the Vietnamese air travel market, it is important for airlines to adopt superior
strategy, in order to incorporate brand presence in the market. Hence, performing
benchmarking on marketing strategy for Etihad Airways is timely and necessary.
The thesis adopts the combination of inductive and deductive approaches, with the
assistance of mixed-method research choice. The enquired theories and
information are from qualitative and quantitative data collection methods, as well
as various sources, such as interviews, survey, books, academic journals, and
scholar public domains to name a few. Altogether, they form a pivotal and logical
structure for the empirical research later on.
The main theoretical framework of the study is benchmarking philosophy and
SOSTAC® model. While benchmarking helps to find the superior performance in
the market regardless of geographical area, the SOSTAC® model supports
building a thorough marketing plan. The benchmarking type adopted in this study
is the competitive benchmarking, which seeks benchmarks from the direct
competitors of the company. Other tools supporting the research are SWOT,
PEST analysis, Porter’s Five Forces, STP, as well as the 4Ps marketing mix.
Emirates and Qatar Airways are Etihad’s main competitors in Vietnam. The
benchmarks for Etihad Airways consider the 4Ps marketing mix. In terms of
place, Hanoi is another potential market in Vietnam. In respect of pricing strategy,
it is advisable that the airline shift towards skimming strategy to maintain its
service quality in the long-term. Moreover, Etihad Airways should pay more
attention to the business group and improve its customer rewards program. In
terms of promotion, the airline should focus on the social media channel for the
holiday group, as well as reconsider its channels and approaches for the business
segment.
Keywords: benchmarking, marketing strategy, SOSTAC®, passenger air
transport, air travel, airlines, Etihad Airways, Emirates, Qatar Airways, Vietnam
CONTENTS
1 INTRODUCTION 1
1.1 Research Background 1
1.2 Thesis Objectives, Research Questions and Limitations 3
1.3 Theoretical Framework 4
1.4 Research Methodology and Data Collection 7
1.5 Thesis Structure 11
2 BENCHMARKING &SOSTAC® 14
2.1 Benchmarking 14
2.1.1 Definition 14
2.1.2 Benefits 15
2.1.3 Types 16
2.1.4 Process Steps 18
2.1.5 Tools 19
2.2 SOSTAC® 20
2.2.1 Situation Analysis 22
2.2.2 Objectives 25
2.2.3 Strategies 26
2.2.4 Tactics 29
2.2.5 Actions 30
2.2.6 Control 31
3 GLOBAL AVIATION INDUSTRY AND SITUATION IN VIETNAM
MARKET 34
3.1 Global Commercial Aviation Industry 35
3.1.1 Global Commercial Aviation History Overview 35
3.1.2 Air Travel’s Recent Trend and Outlook 38
3.2 Commercial Aviation Industry in Vietnam 40
3.2.1 Vietnam’s Air Travel Industry PEST Analysis 41
3.2.2 Vietnam’s Air Travel Industry Porter’s Five Forces Analysis 44
4 CASE STUDY: ETIHAD AIRWAYS 47
4.1 Company Overview 47
4.1.1 Company Management 48
4.1.2 Company Missions, Visions, Aims & Objectives 50

4.1.3 Company Services 51
4.1.4 Company Partner Network 52
4.2 Company Analysis 52
4.3 Direct Competitors Overview 54
4.3.1 Emirates 55
4.3.2 Qatar Airways 55
5 EMPIRICAL RESEARCH & ANALYSIS 56
5.1 Data Acquisition Process 56
5.2 Data Analysis 60
5.2.1 Desk Study 60
5.2.2 Interviews 61
5.2.3 Survey 63
6 RECOMMENDED BENCHMARKS FOR ETIHAD AIRWAYS 69
6.1 Place 69
6.2 Product 70
6.3 Price 70
6.4 Promotion 71
7 CONCLUSION & SUGGESTIONS 72
7.1 Answers to the Research Questions 72
7.2 Reliability and Validity 74
7.3 Suggestions for Further Research 75
8 SUMMARY 76
REFERENCES 78
APPENDICES 89
LIST OF FIGURES
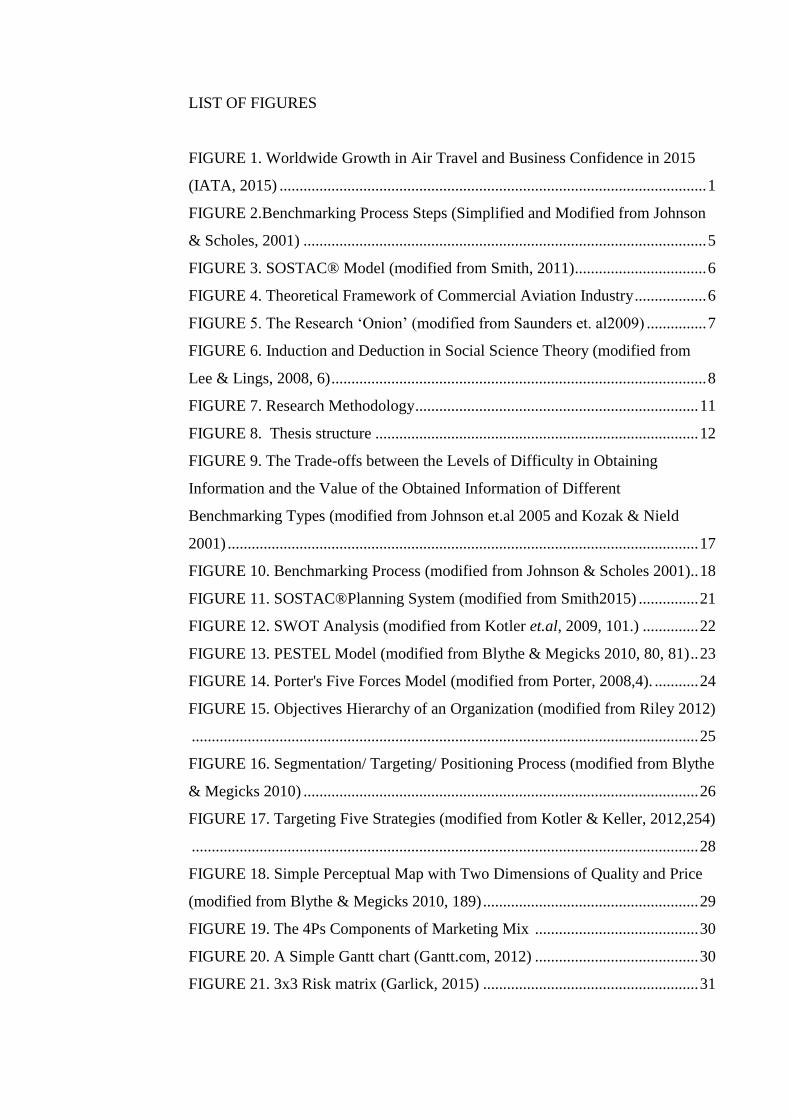
FIGURE 1. Worldwide Growth in Air Travel and Business Confidence in 2015
(IATA, 2015) ........................................................................................................... 1
FIGURE 2.Benchmarking Process Steps (Simplified and Modified from Johnson
& Scholes, 2001) ..................................................................................................... 5
FIGURE 3. SOSTAC® Model (modified from Smith, 2011) ................................. 6
FIGURE 4. Theoretical Framework of Commercial Aviation Industry .................. 6
FIGURE 5. The Research ‘Onion’ (modified from Saunders et. al2009) ............... 7
FIGURE 6. Induction and Deduction in Social Science Theory (modified from
Lee & Lings, 2008, 6) .............................................................................................. 8
FIGURE 7. Research Methodology ....................................................................... 11
FIGURE 8. Thesis structure ................................................................................. 12
FIGURE 9. The Trade-offs between the Levels of Difficulty in Obtaining
Information and the Value of the Obtained Information of Different
Benchmarking Types (modified from Johnson et.al 2005 and Kozak & Nield
2001) ...................................................................................................................... 17
FIGURE 10. Benchmarking Process (modified from Johnson & Scholes 2001).. 18
FIGURE 11. SOSTAC®Planning System (modified from Smith2015) ............... 21
FIGURE 12. SWOT Analysis (modified from Kotler et.al, 2009, 101.) .............. 22
FIGURE 13. PESTEL Model (modified from Blythe & Megicks 2010, 80, 81) .. 23
FIGURE 14. Porter's Five Forces Model (modified from Porter, 2008,4). ........... 24
FIGURE 15. Objectives Hierarchy of an Organization (modified from Riley 2012)
............................................................................................................................... 25
FIGURE 16. Segmentation/ Targeting/ Positioning Process (modified from Blythe
& Megicks 2010) ................................................................................................... 26
FIGURE 17. Targeting Five Strategies (modified from Kotler & Keller, 2012,254)
............................................................................................................................... 28
FIGURE 18. Simple Perceptual Map with Two Dimensions of Quality and Price
(modified from Blythe & Megicks 2010, 189) ...................................................... 29
FIGURE 19. The 4Ps Components of Marketing Mix ......................................... 30
FIGURE 20. A Simple Gantt chart (Gantt.com, 2012) ......................................... 30
FIGURE 21. 3x3 Risk matrix (Garlick, 2015) ...................................................... 31
FIGURE 22. The Air Transport Industry (simplified and modified from ILO,
2013) ...................................................................................................................... 34
FIGURE23. Air Transport Hubs before and after Deregulation(Rodrigue, 2015) 38
FIGURE 24. Airports across Vietnam (Vietnam Airlines-b, 2013) ...................... 43
FIGURE 25. Porter's Five Forces of commercial air transport in HCMC, Vietnam
............................................................................................................................... 44
FIGURE 26. Etihad Airways' Organizational Chart ............................................. 48
FIGURE 27. Organizational chart of Etihad Airways' Representative Office in
Vietnam.................................................................................................................. 49
FIGURE 28. Hierarchy of Objectives of Etihad Airways (Etihad, 2015) ............. 50
FIGURE 29. Etihad Airways Sales Targets in 2015 (Dao, 2015) ......................... 51
FIGURE 30. Etihad's Service Portfolio ................................................................. 52
FIGURE 31. Preliminary MEB3’s Positioning Perceptual Map ........................... 61
FIGURE 32. Monthly Income according to Age Group ....................................... 64
FIGURE 33. Brand Familiar vs Marketing Channels ........................................... 65
FIGURE 34. Answers on the outbound destinations ............................................ 66
FIGURE 35. Answers on travel purposes.............................................................. 67
FIGURE 36. Purchase Channels............................................................................ 67
FIGURE 37. Answers on Willingness to Become Future Customers by Airlines 68
LIST OF TABLES
TABLE 1. Summary of key findings of Benchmarking and SOSTAC® model ... 32
TABLE 2. Number of Takeoff/ Landing Flights (Flight/ Time) of Vietnam
Airlines at Tan Son Nhat International Airport, Vietnam from 2010 – 2014
(CAAV, 2015) ....................................................................................................... 41
TABLE 3. Vietnam Economic Data (modified from FocusEconomics, 2015) ..... 42
TABLE 4. Etihad Airways' SWOT Analysis ........................................................ 54
TABLE 5. Gantt chart of Data Acquisition Process .............................................. 56
TABLE 6. Comparison of Customer's Satisfaction Average Grades .................... 66
ABBREVIATIONS
6-D 6 Dimensions Model of Geert Hofstede
ABEF Australian Business Excellence Framework
ACV Airports Corporation of Vietnam
ASEAN Association of Southeast Asian Nations
B.C before Christ
BM Business Model
BOAC British Overseas Airways Coporation
CPI Consumer Price Index
EFQM European Foundation for Quality Management
FAA Federal Aviation Agency/ Federal Aviation Administration
FDI Foreign Direct Investment
FTAs Free Trade Agreements
GDP Gross Domestic Product
IATA The International Air Transport Association
ILO International Labour Organisation
ICAO International Civil Aviation Organisation
LCC Low-cost Carriers
MEB3 Middle East Big 3 (Emirates, Etihad Airways & Qatar Airways)
PEST Political, Economy, Social & Technology
PESTEL Political, Economy, Social, Technology, Ecology & Legal
SAA Southern Airports Authority
SOSTAC® Situation Analysis, Objectives, Strategy, Tactics, Control
SMART Specific, Measurable, Achieavable, Relevant&Time Specific
STP Segmenting, Targeting, and Positioning
SWOT Strengths, Weaknesses, Opportunities, Threats
UAE the United Arab Emirates
The US the United States
USD United States Dollar (currency)
VND Vietnam Dong (currency)
WTO World Trade Organization
1 INTRODUCTION
1.1 Research Background
On January 1st 1914, the first scheduled flight with a paying passenger was
launched. Ever since then, the world witnessed a 100-year journey of aviation
becoming the dominant transport mode in long distance travel. Not only did
commercial aviation make the world smaller, but it also brought new
opportunities and possibilities for economic growth, social change, as well as
technological innovation. Today, there are more than 2000 airlines providing
services to over 3 billion passengers, supporting over 57 million jobs and
contributing 2.2 trillion US dollars (USD) in economic activities worldwide.
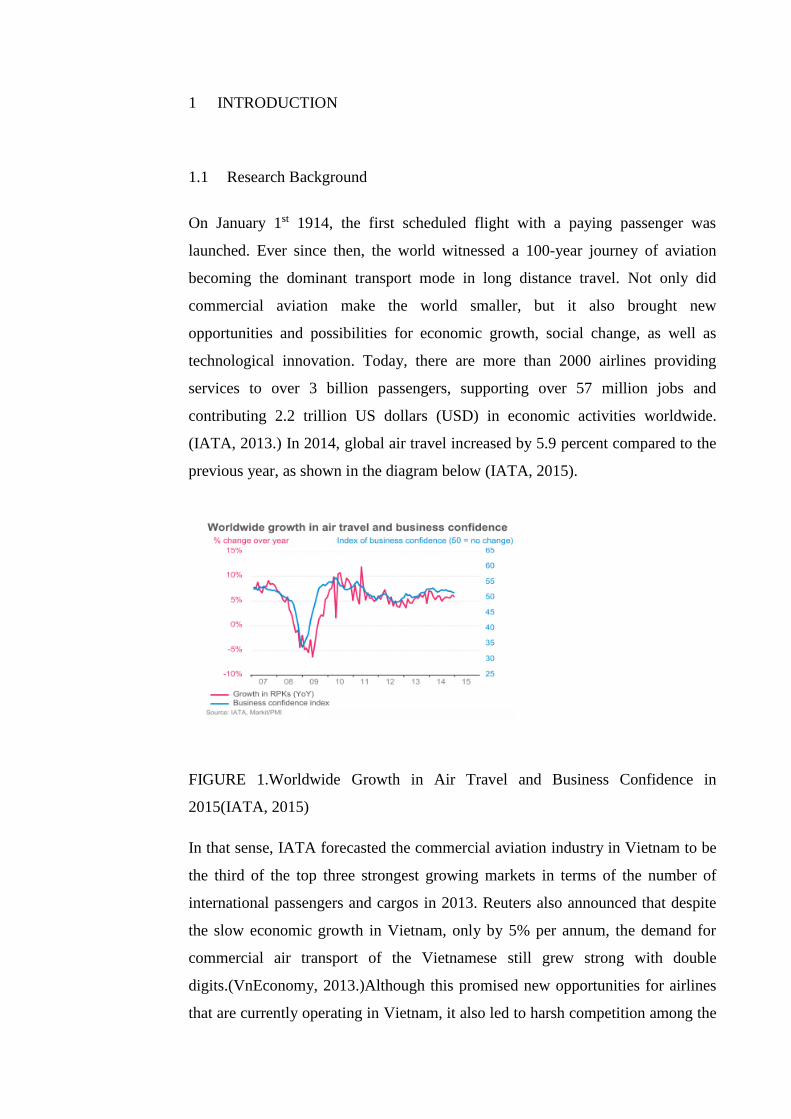
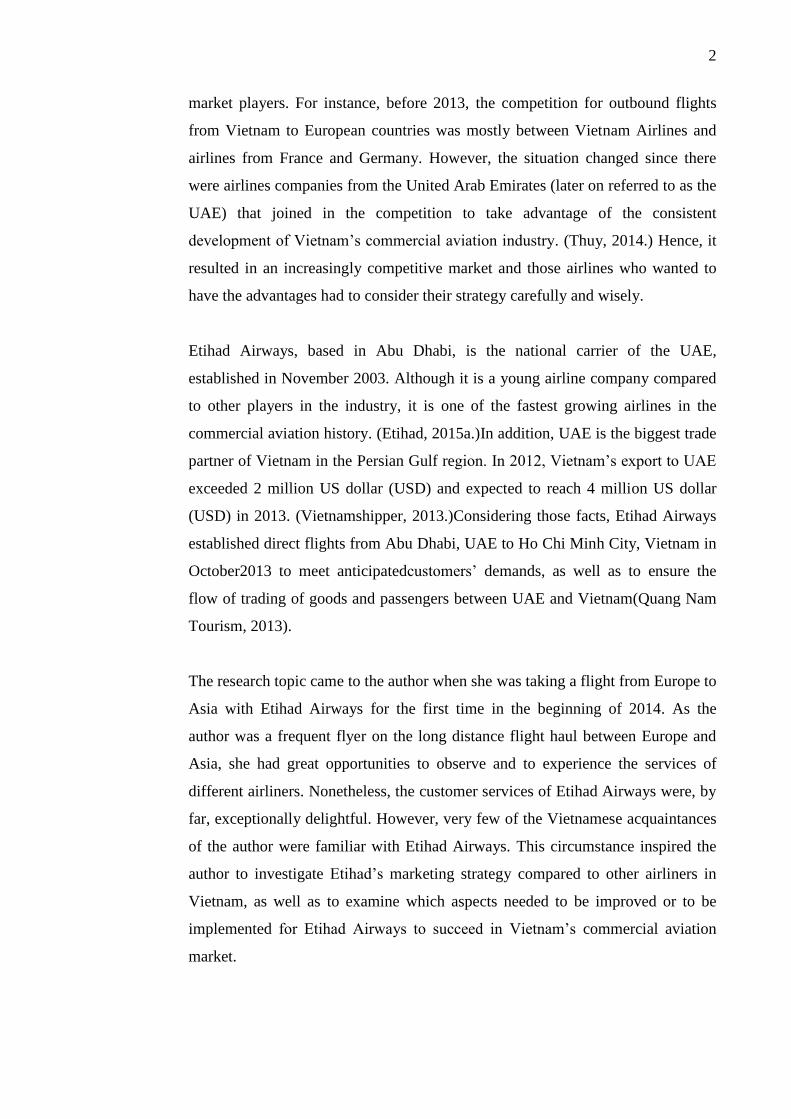
(IATA, 2013.) In 2014, global air travel increased by 5.9 percent compared to the
previous year, as shown in the diagram below (IATA, 2015).
FIGURE 1.Worldwide Growth in Air Travel and Business Confidence in
2015(IATA, 2015)
In that sense, IATA forecasted the commercial aviation industry in Vietnam to be
the third of the top three strongest growing markets in terms of the number of
international passengers and cargos in 2013. Reuters also announced that despite
the slow economic growth in Vietnam, only by 5% per annum, the demand for
commercial air transport of the Vietnamese still grew strong with double
digits.(VnEconomy, 2013.)Although this promised new opportunities for airlines
that are currently operating in Vietnam, it also led to harsh competition among the
2
market players. For instance, before 2013, the competition for outbound flights
from Vietnam to European countries was mostly between Vietnam Airlines and
airlines from France and Germany. However, the situation changed since there
were airlines companies from the United Arab Emirates (later on referred to as the
UAE) that joined in the competition to take advantage of the consistent
development of Vietnam’s commercial aviation industry. (Thuy, 2014.) Hence, it
resulted in an increasingly competitive market and those airlines who wanted to
have the advantages had to consider their strategy carefully and wisely.
Etihad Airways, based in Abu Dhabi, is the national carrier of the UAE,
established in November 2003. Although it is a young airline company compared
to other players in the industry, it is one of the fastest growing airlines in the
commercial aviation history. (Etihad, 2015a.)In addition, UAE is the biggest trade
partner of Vietnam in the Persian Gulf region. In 2012, Vietnam’s export to UAE
exceeded 2 million US dollar (USD) and expected to reach 4 million US dollar
(USD) in 2013. (Vietnamshipper, 2013.)Considering those facts, Etihad Airways
established direct flights from Abu Dhabi, UAE to Ho Chi Minh City, Vietnam in
October2013 to meet anticipatedcustomers’ demands, as well as to ensure the
flow of trading of goods and passengers between UAE and Vietnam(Quang Nam
Tourism, 2013).
The research topic came to the author when she was taking a flight from Europe to
Asia with Etihad Airways for the first time in the beginning of 2014. As the
author was a frequent flyer on the long distance flight haul between Europe and
Asia, she had great opportunities to observe and to experience the services of
different airliners. Nonetheless, the customer services of Etihad Airways were, by
far, exceptionally delightful. However, very few of the Vietnamese acquaintances
of the author were familiar with Etihad Airways. This circumstance inspired the
author to investigate Etihad’s marketing strategy compared to other airliners in
Vietnam, as well as to examine which aspects needed to be improved or to be
implemented for Etihad Airways to succeed in Vietnam’s commercial aviation
market.
3
1.2 Thesis Objectives, Research Questions and Limitations
This study aims at providing insight investigation into the current situation of
Vietnam’s air travel industry and its potential development, as well as to
benchmark the marketing strategy of Etihad withits direct competitors in Vietnam.
Marketing strategy is the critical key coordinating the strategic planning process
of a company. It embraces customers’ needs as its core focus. Therefore, the
ultimate goal, which this study sets to achieve, is to eventually explaining to the
readers the following question:
“What can Etihad Airways learn from the marketing strategies of its direct
competitors to refine its own and reach its objectives in Vietnam?”
In order to find out the conclusion for the above research question, this thesis is
going to solve the following five sub-questions consecutively:
i. What is the current situation of Vietnam’s commercial air transport?
ii. Who are Etihad’s main competitors?
iii. What is the marketing strategy of Etihad Airways in Vietnam?
iv. Where is Etihad’s position in the market compared to its competitors?
v. What can Etihad learn from its competitors’ marketing strategies?
Firstly, the thesis is going to illustrate the current situation of Vietnam’s
commercial air transport, which aims at providing the holistic approach to the
topic for the readers. This question intends for the readers to grasp the
understanding regarding the customer demands, government policies and the
nature of competitions of the market. In other words, the purpose of this sub-
question is to address the crucial necessity of benchmarking in Vietnam air travel
market. Then, the thesis introduces to the readers Etihad’s main competitors. The
intention of this sub-question is to form a list of subjects for latter benchmarking.
Additionally, the research aims at studying the current marketing strategy of
Etihad Airways in Vietnam. Next, the thesis moves onto defining Etihad’s current
situation in the market, which examines Etihad’s performance comparing to other
company. This sub-question means to identify the advantages, disadvantages,
4
strengths and weaknesses of Etihad Airways. It also serves as noteworthy diagram
for the readers to picture the position of Etihad and its main competitors in the
market. Lastly, the thesis combines all the above aspects in order to achieve the
final quest of the benchmarks that Etihad Airways can learn from its competitors
to improve and succeed in Vietnam’s commercial aviation industry. This sub-
question tackled the set of criteria needed for Etihad’s benchmarking.
In respect to the research limitations, the thesis only focuses on the first two steps
of benchmarking process: planning and analysing. Because Etihad Airways is not
commissioning company of the author, she can only give implementation plan
suggestions. Furthermore, both methods of retrieving the primary data, interviews
and questionnaire, were performed indirectly through e-mails, Skype and web
portals, such as Facebook and Google doc. Therefore, the author could not 100
percent verify the objectiveness of the opinions of the interviewees, as well as
those of the respondents. In addition, due to the scope and scale of this thesis, the
number of questionnaire samples and interviewees is very limited. This leaves
opportunities for further in-depth investigations for Etihad Airways. Another
notable limitation is the research ethic, as the study enquires strategic information
from the competitors of Etihad Airways in Vietnam. Although the research serves
study purpose only and Etihad is not a commissioning company of the author, the
true intention of the interviews was not completely transparent to the
interviewees.
1.3 Theoretical Framework
The core theoretical framework of this thesis is benchmarking. Benchmarking is a
continuous process of measuring, comparing and pinpointing the performance
gaps, in order to identifying improvements and upgrading performance, as well as
increasing competitiveness. That is to say, benchmarking is the quest for the best
practices that establish the superior performance of a company. According to
Camp (1989), benchmarking helps company realizing more realistic and feasible
goals, as well as objectives. Sun Tzu (500 B.C), a Chinese general, once taught,
“If you know your enemy and know yourself, you need not fear the result of a
5
hundred battles.” Sun Tzu’s teaching is the basis of benchmarking: evaluating
yourself and your competitors, then, learn from not just their success but their
mistakes, as well. The benefits of benchmarking are that businesses attain the best
practices externally to incorporate those into their corporation internally. (Camp,
1989.)Moreover, as briefly introduced in the 1.1 background of the study part,
benchmarking is crucial to airline companies that desire to have their advantage in
the competitive Vietnam’s commercial air transport industry.
Yet, benchmarking is a vast perspective as it raises the question of which aspects
businesses should benchmark. Therefore, the study utilizes a planning system
named SOSTAC® as the guideline to approach the first and foremost step of
benchmarking: planning.
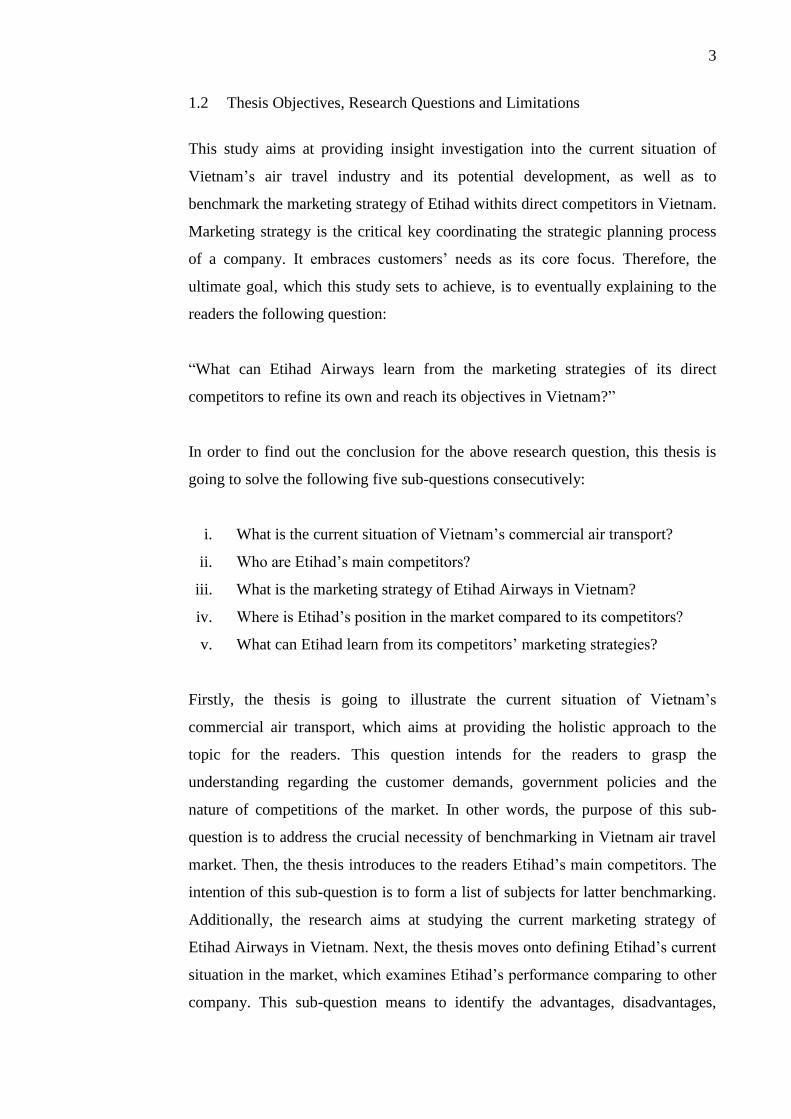
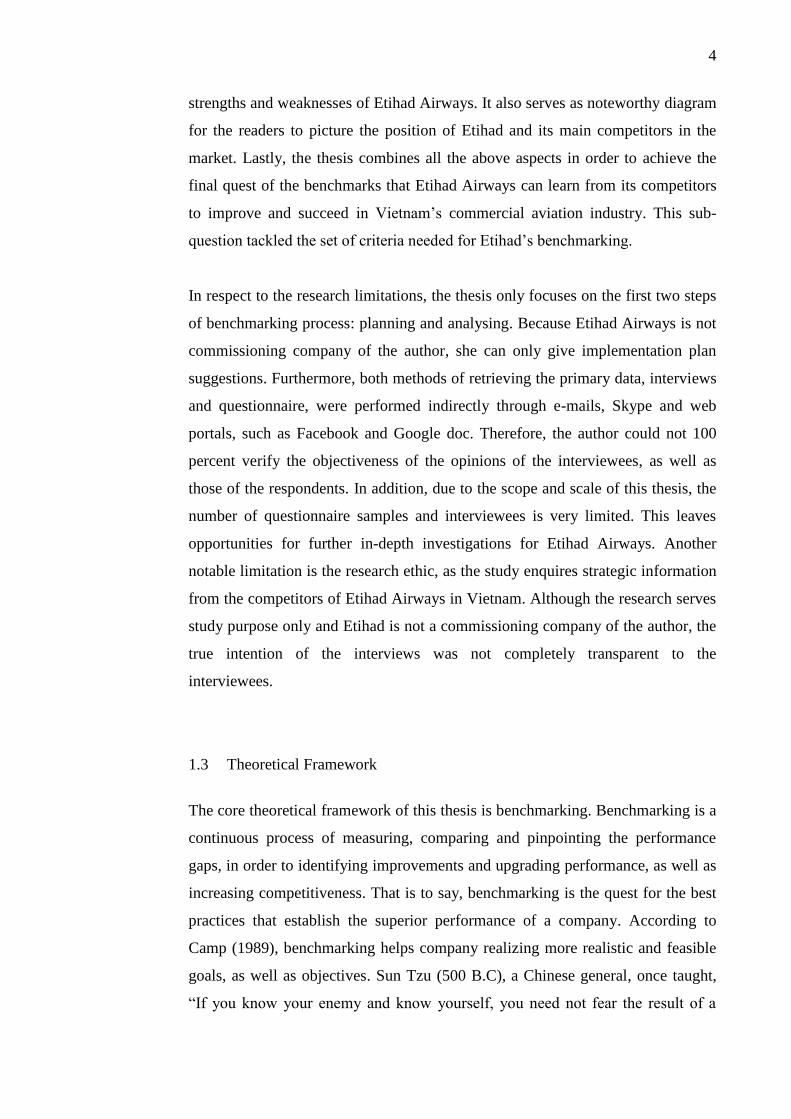
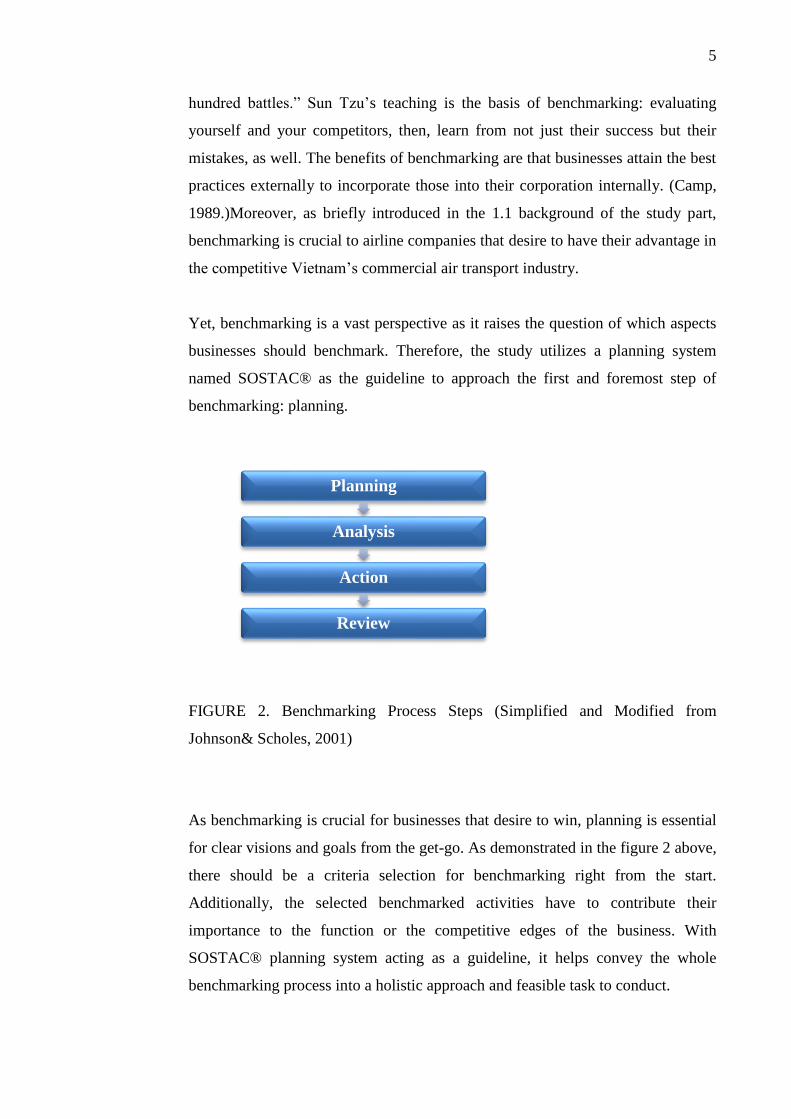
FIGURE 2. Benchmarking Process Steps (Simplified and Modified from
Johnson& Scholes, 2001)
As benchmarking is crucial for businesses that desire to win, planning is essential
for clear visions and goals from the get-go. As demonstrated in the figure 2 above,
there should be a criteria selection for benchmarking right from the start.
Additionally, the selected benchmarked activities have to contribute their
importance to the function or the competitive edges of the business. With
SOSTAC® planning system acting as a guideline, it helps convey the whole
benchmarking process into a holistic approach and feasible task to conduct.
Planning
Analysis
Action
Review
6
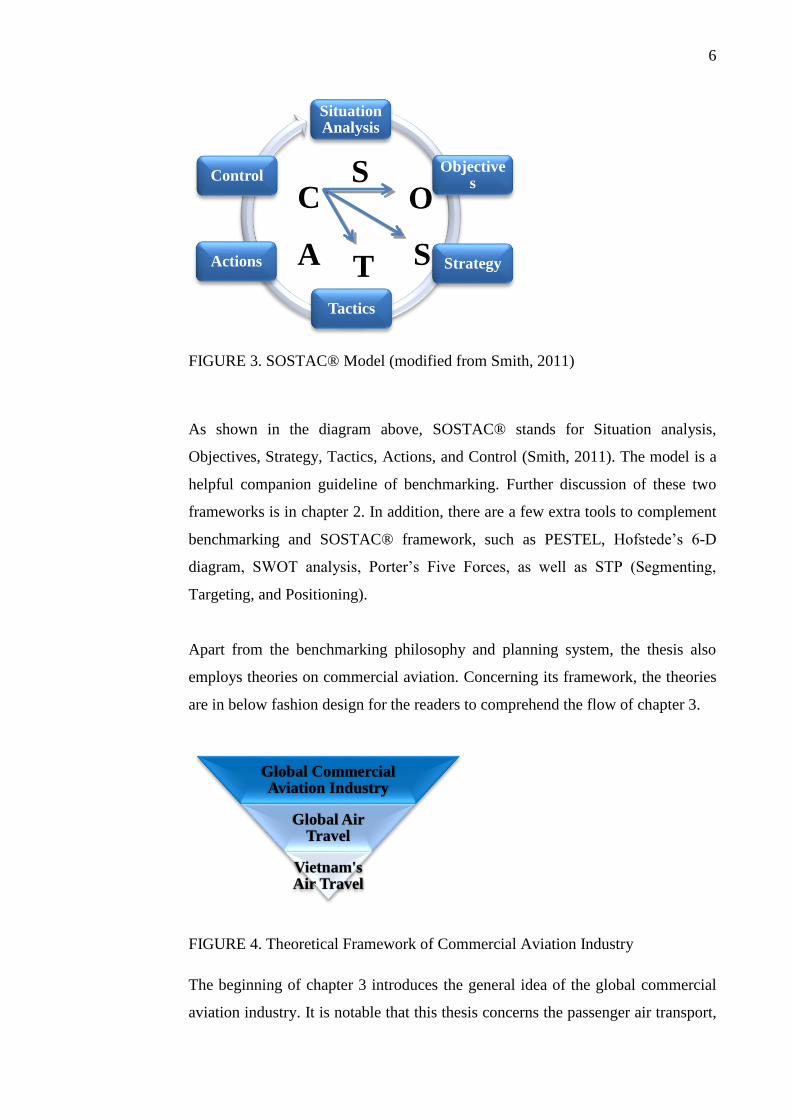
FIGURE 3. SOSTAC® Model (modified from Smith, 2011)
As shown in the diagram above, SOSTAC® stands for Situation analysis,
Objectives, Strategy, Tactics, Actions, and Control (Smith, 2011). The model is a
helpful companion guideline of benchmarking. Further discussion of these two
frameworks is in chapter 2. In addition, there are a few extra tools to complement
benchmarking and SOSTAC® framework, such as PESTEL, Hofstede’s 6-D
diagram, SWOT analysis, Porter’s Five Forces, as well as STP (Segmenting,
Targeting, and Positioning).
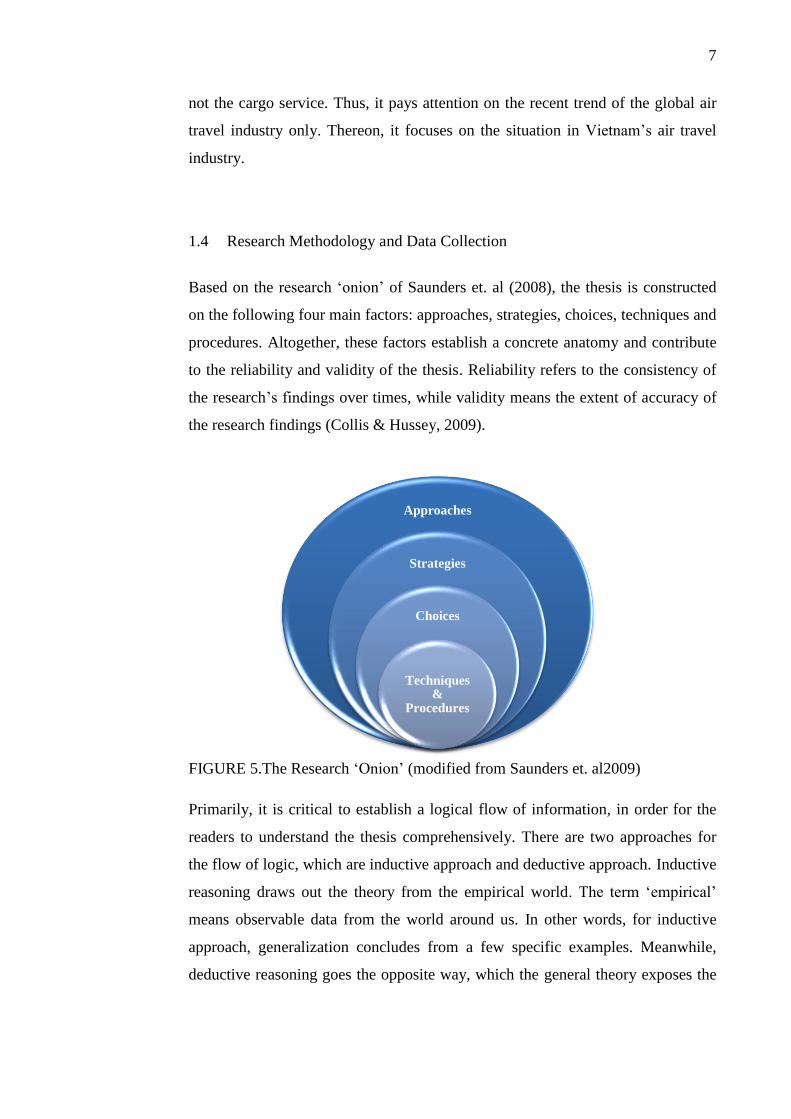
Apart from the benchmarking philosophy and planning system, the thesis also
employs theories on commercial aviation. Concerning its framework, the theories
are in below fashion design for the readers to comprehend the flow of chapter 3.
FIGURE 4. Theoretical Framework of Commercial Aviation Industry
The beginning of chapter 3 introduces the general idea of the global commercial
aviation industry. It is notable that this thesis concerns the passenger air transport,
Situation Analysis
Objectives
Strategy
Tactics
Actions
Control
Global Commercial Aviation Industry
Global Air Travel
Vietnam's Air Travel
S C O
S A T
7
not the cargo service. Thus, it pays attention on the recent trend of the global air
travel industry only. Thereon, it focuses on the situation in Vietnam’s air travel
industry.
1.4 Research Methodology and Data Collection
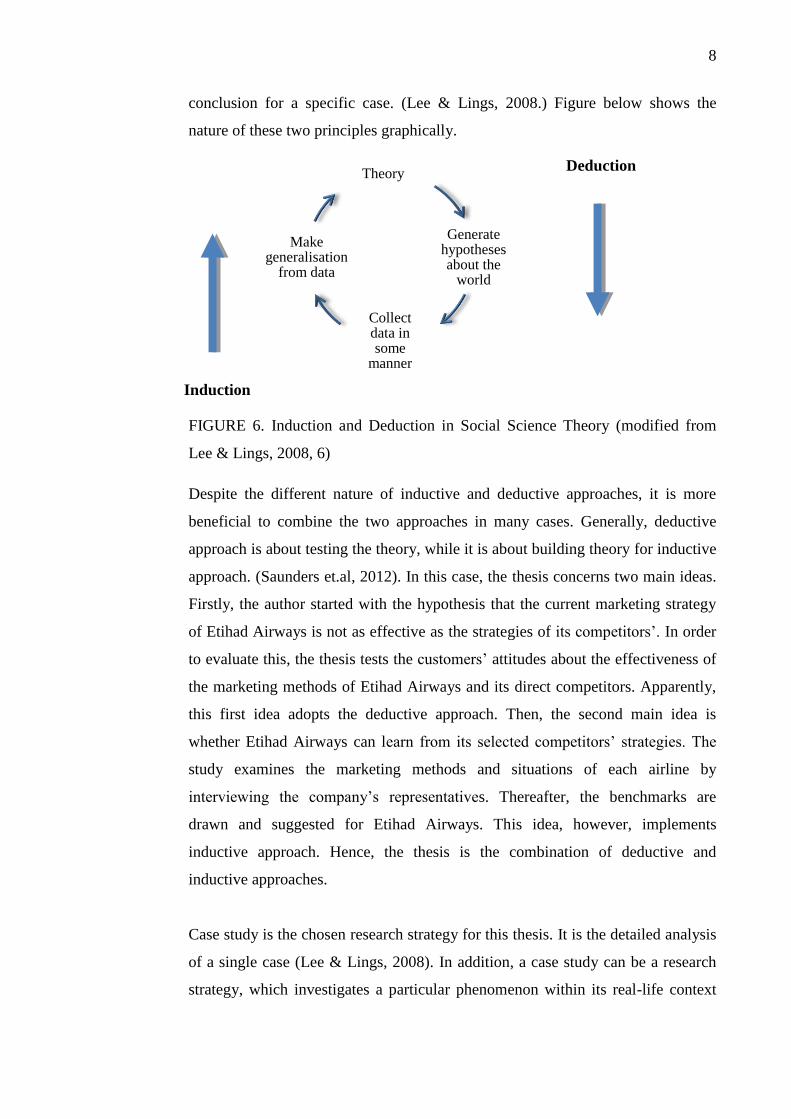
Based on the research ‘onion’ of Saunders et. al (2008), the thesis is constructed
on the following four main factors: approaches, strategies, choices, techniques and
procedures. Altogether, these factors establish a concrete anatomy and contribute
to the reliability and validity of the thesis. Reliability refers to the consistency of
the research’s findings over times, while validity means the extent of accuracy of
the research findings (Collis & Hussey, 2009).
FIGURE 5.The Research ‘Onion’ (modified from Saunders et. al2009)
Primarily, it is critical to establish a logical flow of information, in order for the
readers to understand the thesis comprehensively. There are two approaches for
the flow of logic, which are inductive approach and deductive approach. Inductive
reasoning draws out the theory from the empirical world. The term ‘empirical’
means observable data from the world around us. In other words, for inductive
approach, generalization concludes from a few specific examples. Meanwhile,
deductive reasoning goes the opposite way, which the general theory exposes the
Approaches
Strategies
Choices
Techniques &
Procedures
8
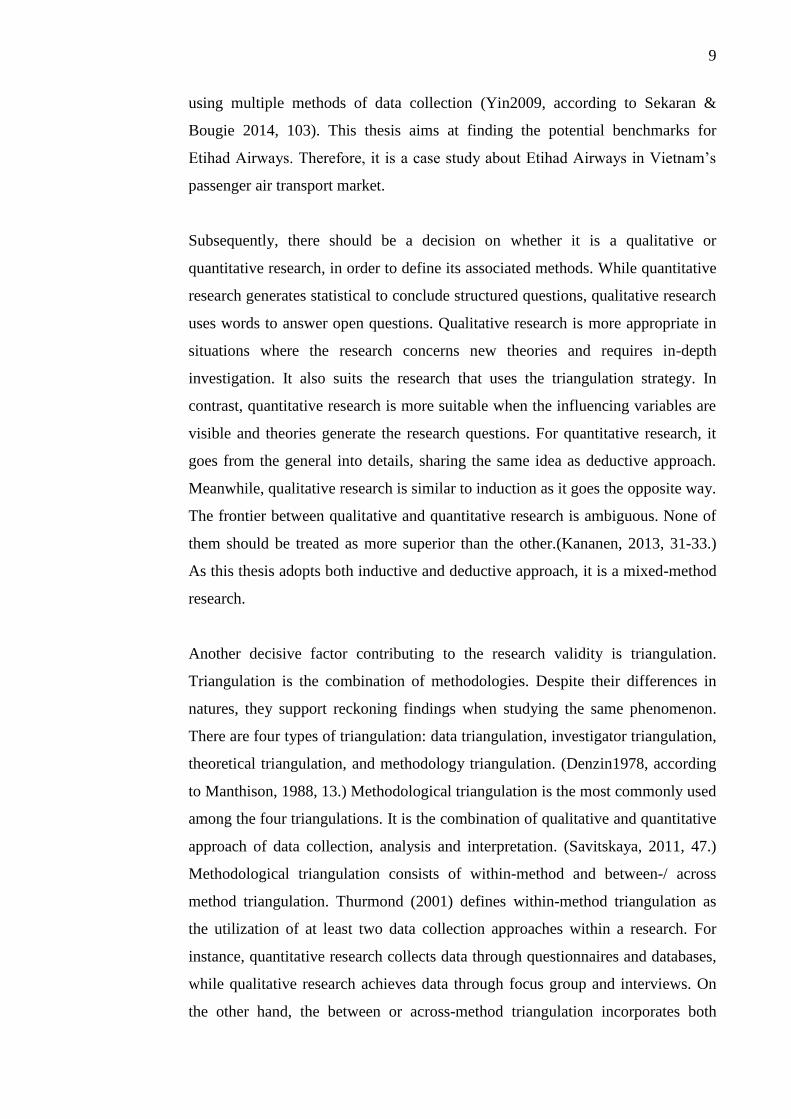
conclusion for a specific case. (Lee & Lings, 2008.) Figure below shows the
nature of these two principles graphically.
FIGURE 6. Induction and Deduction in Social Science Theory (modified from
Lee & Lings, 2008, 6)
Despite the different nature of inductive and deductive approaches, it is more
beneficial to combine the two approaches in many cases. Generally, deductive
approach is about testing the theory, while it is about building theory for inductive
approach. (Saunders et.al, 2012). In this case, the thesis concerns two main ideas.
Firstly, the author started with the hypothesis that the current marketing strategy
of Etihad Airways is not as effective as the strategies of its competitors’. In order
to evaluate this, the thesis tests the customers’ attitudes about the effectiveness of
the marketing methods of Etihad Airways and its direct competitors. Apparently,
this first idea adopts the deductive approach. Then, the second main idea is
whether Etihad Airways can learn from its selected competitors’ strategies. The
study examines the marketing methods and situations of each airline by
interviewing the company’s representatives. Thereafter, the benchmarks are
drawn and suggested for Etihad Airways. This idea, however, implements
inductive approach. Hence, the thesis is the combination of deductive and
inductive approaches.
Case study is the chosen research strategy for this thesis. It is the detailed analysis
of a single case (Lee & Lings, 2008). In addition, a case study can be a research
strategy, which investigates a particular phenomenon within its real-life context
Theory
Generate hypotheses about the
world
Collect data in some
manner
Make generalisation
from data
Deduction
Induction
9
using multiple methods of data collection (Yin2009, according to Sekaran &
Bougie 2014, 103). This thesis aims at finding the potential benchmarks for
Etihad Airways. Therefore, it is a case study about Etihad Airways in Vietnam’s
passenger air transport market.
Subsequently, there should be a decision on whether it is a qualitative or
quantitative research, in order to define its associated methods. While quantitative
research generates statistical to conclude structured questions, qualitative research
uses words to answer open questions. Qualitative research is more appropriate in
situations where the research concerns new theories and requires in-depth
investigation. It also suits the research that uses the triangulation strategy. In
contrast, quantitative research is more suitable when the influencing variables are
visible and theories generate the research questions. For quantitative research, it
goes from the general into details, sharing the same idea as deductive approach.
Meanwhile, qualitative research is similar to induction as it goes the opposite way.
The frontier between qualitative and quantitative research is ambiguous. None of
them should be treated as more superior than the other.(Kananen, 2013, 31-33.)
As this thesis adopts both inductive and deductive approach, it is a mixed-method
research.
Another decisive factor contributing to the research validity is triangulation.
Triangulation is the combination of methodologies. Despite their differences in
natures, they support reckoning findings when studying the same phenomenon.
There are four types of triangulation: data triangulation, investigator triangulation,
theoretical triangulation, and methodology triangulation. (Denzin1978, according
to Manthison, 1988, 13.) Methodological triangulation is the most commonly used
among the four triangulations. It is the combination of qualitative and quantitative
approach of data collection, analysis and interpretation. (Savitskaya, 2011, 47.)
Methodological triangulation consists of within-method and between-/ across
method triangulation. Thurmond (2001) defines within-method triangulation as
the utilization of at least two data collection approaches within a research. For
instance, quantitative research collects data through questionnaires and databases,
while qualitative research achieves data through focus group and interviews. On
the other hand, the between or across-method triangulation incorporates both
10
qualitative and quantitative data collection methods in the same study, such as
using both interviews and questionnaires. (Manthison1988, according to
Savitskaya, 2011, 47.) Due to the nature of benchmarking and strengthening the
credibility, as well as the validity of the thesis, the across- method triangulation
was applied.
Lastly, the final layer formatting the research is the applied techniques and
procedures. Specifically, this final aspect regards the techniques to collect data
and the process of analysing them. There are two types of data sources: the
primary sources and the secondary sources. Primary data are simply new data,
collected specifically by the researcher, to meet the objectives of the current
research. In contrast, secondary data are data collected by other researchers or
organisations for some other purposes. Secondary data include both raw data and
published summaries, which can either provide useful sources or partially answer
the research questions. (Saunders et. al, 2012.)
Regarding the data collection methods, the primary data are mainly from
interviews and questionnaires. Chapter 5- The Empirical Research & Analysis
explains them in details. When enquiry a theme interview, the interviewer can pry
on the core issue or reveal the truth to seek understanding. Additionally, a theme
interview is a strong tool to define a problem, evaluating effectiveness and
results.(Kananen, 2013, 109.)
Meanwhile, questionnaire is a general term including all techniques of data
collection, in which each respondent answers the same set of questions in a
predetermined order, without an interviewer being present (deVaus2002,
according to Saunderset. al, 2012). Questionnaires are favorable for descriptive or
explanatory research, which enable the researcher to identify and to describe the
variability in different phenomena (Saunderset. al, 2012). In this thesis, the
questionnaire intends to evaluate the awareness and attitude of the customers
towards selected airlines in Vietnam, in order to determine the effectiveness of
their marketing strategies.
11
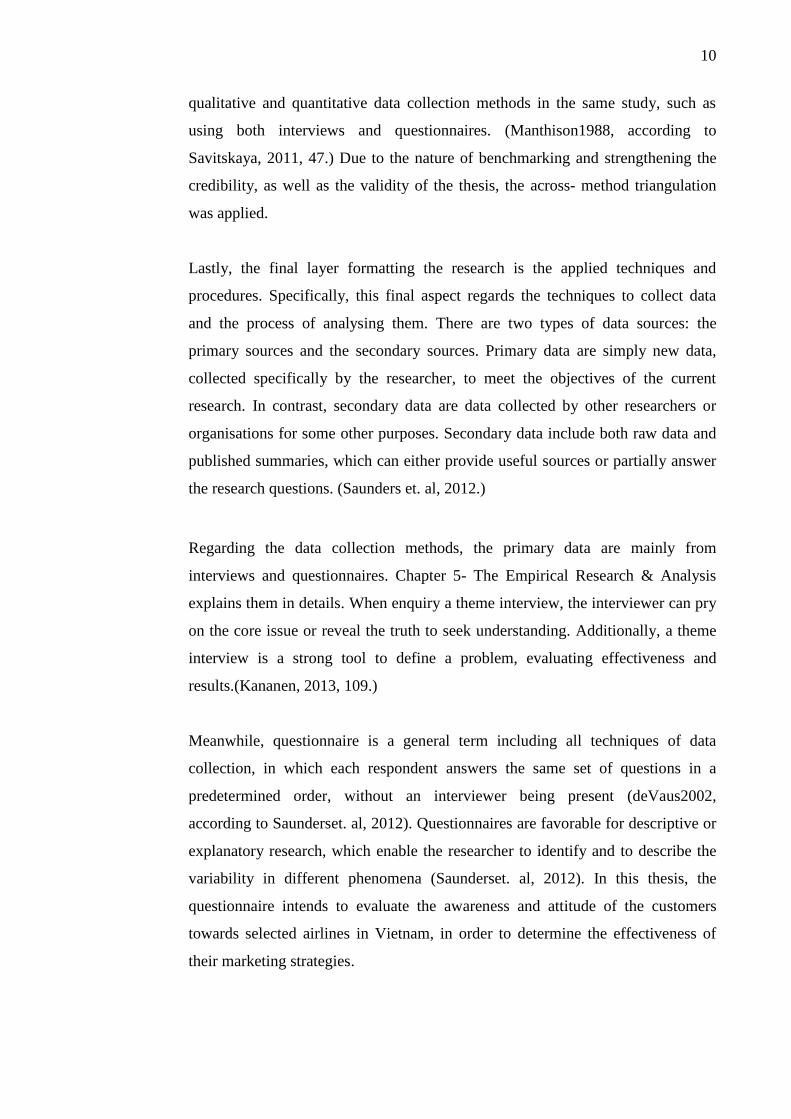
In respect of the secondary data of this study, they are from desk study, including
books, journals and electronic sources.
FIGURE 7. Research Methodology
To sum up this sub-chapter, the research methodology figure recaps the six factors
constructing the thesis. The research adopts deductive approach. Moreover, case
study is the research strategy selected for this thesis. The method choice is mixed-
methods of triangulation: quantitative and qualitative. Finally, the data are from
both primary and secondary sources such as interviews, questionnaires, books,
journals and e-resources.
1.5 Thesis Structure
In order to attain the ultimate goal of finding the marketing strategy benchmarks
for Etihad Airways from its main competitors in Vietnam, the thesis is divided
into eight chapters.
Approach
Deductive
& Inductive
Strategy
Case study
Choice
Mixed methods
Techniques & Procedures
Primary : interviews,
questionnaires
Secondary
books, journals,
e-resources
12
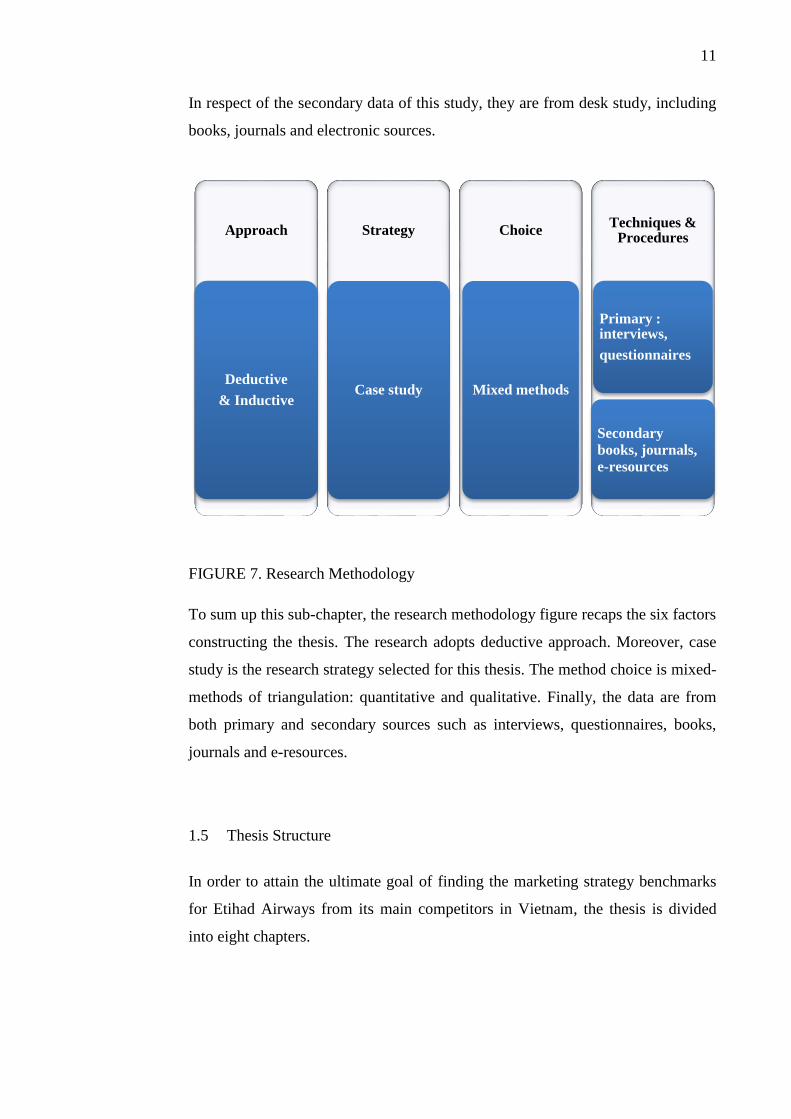
The figure below illustrates the overall flow of this thesis, follows by detailed
explanations of each chapter.
FIGURE 8. Thesis structure
This first chapter describes the research background, in which a brief introduction
of the market situation and Etihad Airways is given; the research objectives of
identifying Etihad Airways’ performance compared to other selected airline
company in Vietnam; the theoretical framework: benchmarking and SOSTAC®
models, as well as the research methodology and data collection are also
mentioned.
Chapter 2 describes in details the theoretical framework: benchmarking and
SOSTAC® models. The beginning of this chapter explains the definition,
conducting steps, as well as the criteria of benchmarking. It also introduces the
essential tools that complemented benchmarking. The latter half of this chapter
presents the SOSTAC® model with full-length explanations.
Thereafter, chapter 3 illustrates the holistic picture of global commercial aviation
industry. It explains why the research topic is timely. Forecasted data of the global
commercial aviation industry are given and explained further about its liaison as
well as its impact on the customer demand and the competition among the airline
operators in Vietnam. At the end of this chapter, the readers are reminded the
Introduction
Benchmarking & SOSTAC
Global Commercial Aviation Industry & Vietnamese Market
Case Company: Etihad Airways
Empirical Research & Analysis
Benchmarks
Conclusions & Suggestions
Summary
13
reasons why benchmarking is necessary for Etihad Airways in Vietnam.
Chapter 4 presents Etihad Airways with a brief introduction regarding the
organization of the corporation, its goals, and objectives. Then, this chapter moves
onto analyze the Etihad Airways and introduces its direct competitors as
preparation for the benchmarking conduct in the chapter that follows.
Chapter 5 represents the findings of the study. It is the empirical research, which
analyzes the data retrieved from both the primary and secondary sources, such as
interviews, questionnaires, and desk study. Additionally, it includes a holistic
timeline of the process in form of a Gantt chart. Chapter 6 contains the
benchmarks from the previous results of chapter 5, in term of the 4Ps marketing
mix.
Chapter 7 draws the general conclusion for the thesis as it answers the research
questions, as well as gives suggestion for further study. It also appraises the
reliability and the validity of the research. Finally, chapter 8 provides a brief but
thorough summary to recap the main ideas, and findings.
14
2 BENCHMARKING &SOSTAC®
This chapter concerns the theoretical framework, on which the thesis was
constructed. The concept that the study adopts to identify the best practices among
Etihad Airways and its selected competitors is benchmarking and complemented
by SOSTAC® model. In this chapter, we discuss about the definition of
benchmarking, its benefits, types, as well as its process steps. Additionally, the
guideline for carrying out benchmarking, SOSTAC® model is also introduced in
details.
2.1 Benchmarking
Benchmarking is the core concept employed by this thesis to identify the best
practices among Etihad and its main competitors. “Dantotsu”, a Japanese word,
expresses fully the essence of benchmarking, which is striving to become the
“best of the best” (Camp, 1989). Indeed, considering the harsh competitive nature
of air travel market in Vietnam, performing benchmarking on the marketing
strategy of Etihad Airways is timely and necessary. Prior to that, it is important to
understand the theories of benchmarking through the following concepts:
benchmarking definition, benefits, types, process steps, and tools.
2.1.1 Definition
There are many definitions of benchmarking by a number of authors and
organizations. According to Kozak & Nield (2001,8), benchmarking stems from
Deming’s theory of quality management, which aims at improving the quality and
sustaining the results. Another profound definition of benchmarking from Camp
(1989,10) is that it is a consistent self- improvement and management process
which compares and measures the results of industry leaders.
Benchmarking uses particular terms: benchmarker, benchmarkee and benchmarks.
Benchmarker refers to the company that conduct the benchmarking procedure,
while benchmarkee regards the business that being studied in the process. (Kozak
15
& Nield, 2001, 11.) In addition, benchmark refers to a standard reference that
changes over time for the comparison process of benchmarking, reflecting the real
situations of the industry. (Camp, 1989.) Apparently, benchmark and
benchmarking are two different terms.
It is also noteworthy to avoid these following misconceptions about
benchmarking. Watson (1993) emphasizes that the benchmarking notion should
be regarded as adaptation, not adoption. The idea is not about copying but
learning. It is due to the fact that every business has its own different traits in
different aspects, such as business models, objectives, cultures, or
resources.(Kozak & Nield, 2001,8.) Another common misconception of
benchmarking is associating benchmarking theory with competitive analysis and
comparison research. The latter two employ product or service comparisons.
Meanwhile, benchmarking surpasses plain comparison to appraise the skills of
management and operation in order to capture the best practice in the industry
regardless of geographic location. Moreover, Campbell (1999) suggests that
companies should focus on discovering their own suitable planning and
implementing procedures, rather than spending excessive amount of time on just
benchmarking. (Kozak & Nield, 2001,8-9.)
2.1.2 Benefits
Reflected on different selection of literature (e.g, Camp 1989, Zairi 1992, Rogers
et. al1995), Kozak & Nield (2001,9) point out that the purposes of benchmarking
are also its benefits. Benchmarking helps businesses realize their current position,
their strengths and weaknesses upon the conditions of the industry. Thereon,
companies can meet the customers’s expectations better by setting new standards
and goals through the benchmarking process. It also raises motivation on the
employees to meet new objectives. Furthermore, benchmarking assists businesses
to comprehend the degrees of improvement on performances by adapting other
methods or practices. Then, the reasons for the performance gap can be
documented for future review. Thanks to benchmarking, businesses are able to
maintain sustainable progressesand competitive performances. Benchmarking also
16
helps put forth ideas from the best examples within the industry, which benefits
both cost and time wise. (Kozak & Nield, 2001,9.)
2.1.3 Types
Generally, there are many records of different types of benchmarking. While
Camp (1989) and Zairi (1992) list the following four main classifications of
benchmarking as internal, competitive, functional, and generic benchmarking,
Kozak & Nield (2001, 10) group them into only two groups of internal and
external benchmarking. (Kozak & Nield, 2001.)
Internal benchmarking is about the comparison of the same activities of
departments within the same company but in different countries (Cross &
Leonard1994; Breiter&Kliner1995). Meanwhile, competitive benchmarking
regards the comparison to the main competitors in the industry. According to
Cook (1995), this type of benchmarking is more suitable and rational for large
businesses than smaller ones. Karlof and Ostblom (1993) define functional
benchmarking as a comparative study regarding both direct competitors and other
players that have the same activities in the same market. Then, Breiter and Kliner
(1995) explain that generic benchmarking involves examples for the comparison
regardless of geography, not only among those in the same industry but also in
other fields that performing the same activities, or facing the same issues.
Relationship benchmarking is another type that belongs to the external group.
Andersen (1995) describes relationship benchmarking ascomparative research
towards another company, which the benchmarker already established a
relationship with, prior to the benchmarking agreement. It also called
collaborative benchmarking by Cox et. al (1997). (Kozak &Nield, 2001, 11.)
Johnson et.al (2005, 145) categorized benchmarking types rather differently than
Camp (1989) and Kozak & Nield (2001) as they are divided into three groups:
industry/sector benchmarking, best-in-class benchmarking, and historical
benchmarking. The first two types share similar traits and ideas as functional
benchmarking and generic benchmarking types of Camp (1989). However, the
17
last one, historical benchmarking suggests businesses to search examples
internally from previous years to spot changes.(Johnsonet.al, 2005,145.)
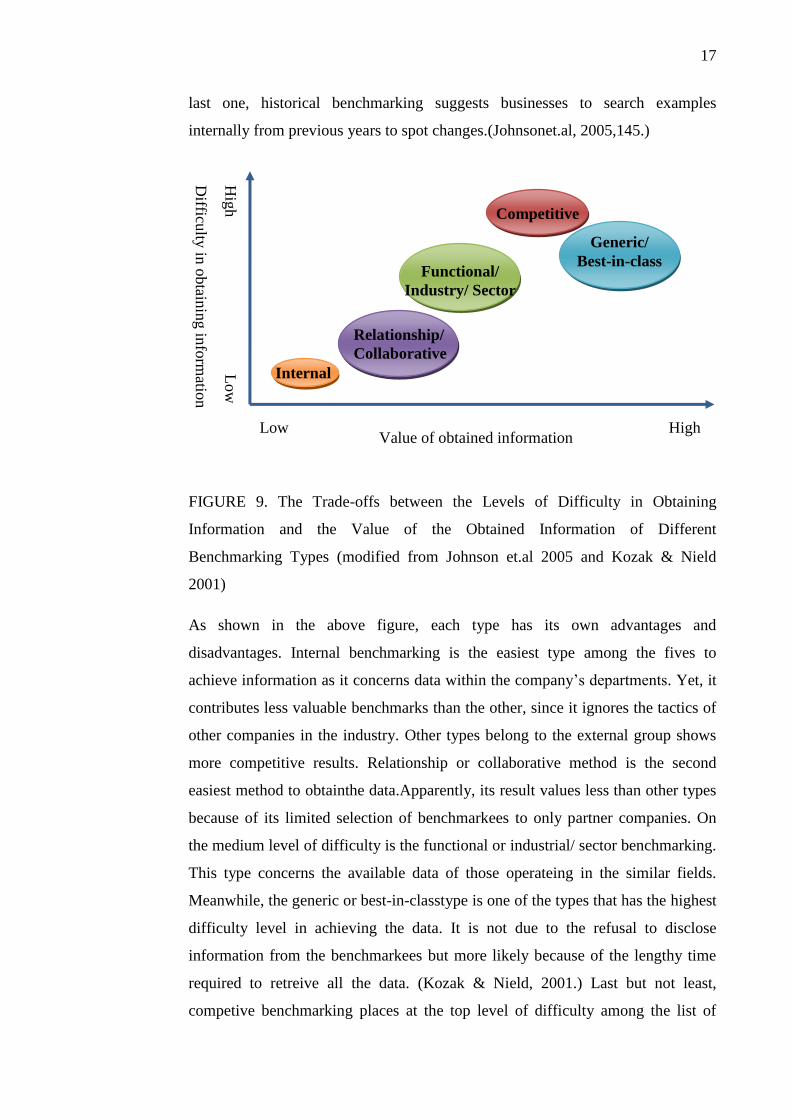
FIGURE 9. The Trade-offs between the Levels of Difficulty in Obtaining
Information and the Value of the Obtained Information of Different
Benchmarking Types (modified from Johnson et.al 2005 and Kozak & Nield
2001)
As shown in the above figure, each type has its own advantages and
disadvantages. Internal benchmarking is the easiest type among the fives to
achieve information as it concerns data within the company’s departments. Yet, it
contributes less valuable benchmarks than the other, since it ignores the tactics of
other companies in the industry. Other types belong to the external group shows
more competitive results. Relationship or collaborative method is the second
easiest method to obtainthe data.Apparently, its result values less than other types
because of its limited selection of benchmarkees to only partner companies. On
the medium level of difficulty is the functional or industrial/ sector benchmarking.
This type concerns the available data of those operateing in the similar fields.
Meanwhile, the generic or best-in-classtype is one of the types that has the highest
difficulty level in achieving the data. It is not due to the refusal to disclose
information from the benchmarkees but more likely because of the lengthy time
required to retreive all the data. (Kozak & Nield, 2001.) Last but not least,
competive benchmarking places at the top level of difficulty among the list of
Internal
Functional/
Industry/ Sector
Relationship/
Collaborative
Competitive
Generic/
Best-in-class
Hig
h
Low
Low High
Difficu
lty in
obtain
ing in
form
ation
Value of obtained information
18
benchmarking types because it concerns the information from the company’s
direct competitors. It requires more efforts to retreive the primary data than any
other types. Thus, the values it gives are more practical. As mentioned before, this
method is more recommended to larger businesses than smaller ones (Cook1995,
according to Kozak & Nield, 2001,10).
As mentioned in the sub-chapter definition of benchmarking, companies should
choose the benchmarking type that suits their objectives, scale and resources, as
well as contribute the most values to them. Considering Etihad Airways scales
and the objectives of this thesis, competitive benchmarking is the chosen one for
this study.
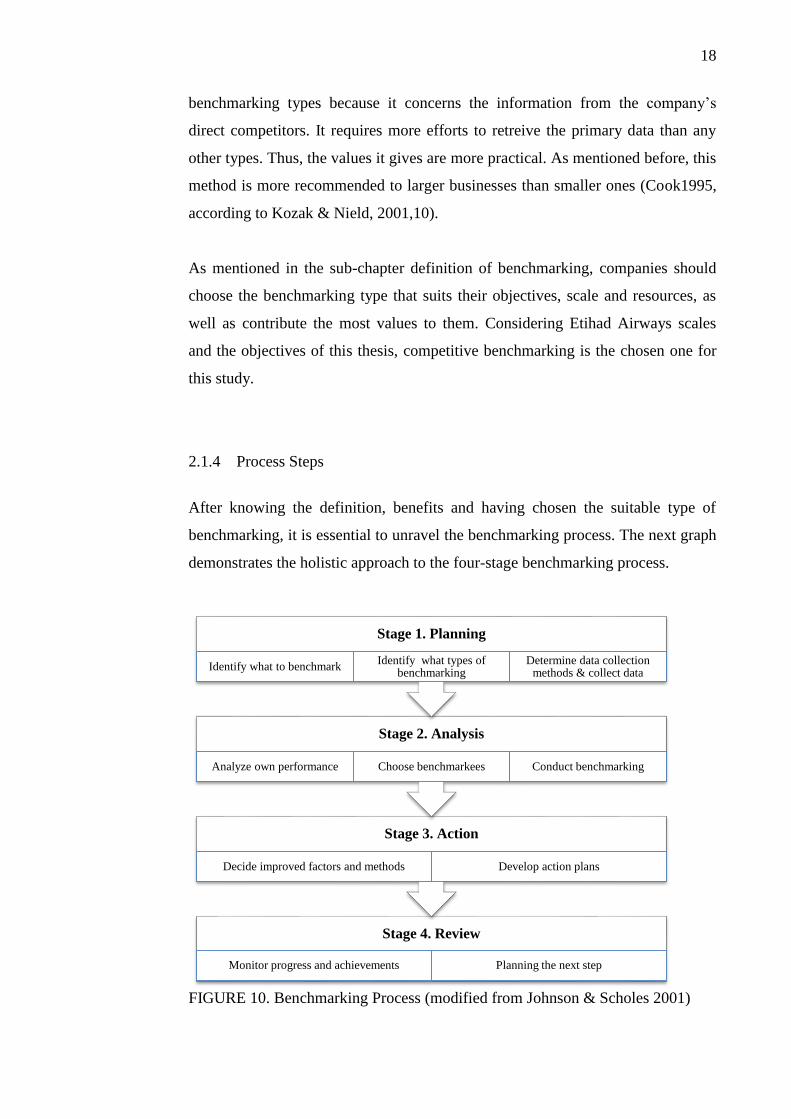
2.1.4 Process Steps
After knowing the definition, benefits and having chosen the suitable type of
benchmarking, it is essential to unravel the benchmarking process. The next graph
demonstrates the holistic approach to the four-stage benchmarking process.
FIGURE 10. Benchmarking Process (modified from Johnson & Scholes 2001)
Stage 4. Review
Monitor progress and achievements Planning the next step
Stage 3. Action
Decide improved factors and methods Develop action plans
Stage 2. Analysis
Analyze own performance Choose benchmarkees Conduct benchmarking
Stage 1. Planning
Identify what to benchmarkIdentify what types of
benchmarkingDetermine data collection
methods & collect data
19
The process starts with the first stage of taking into consideration which area
required benchmarking and the reasons for its benchmarking enquiry.
Benchmarking type that suits the company’s objectives should be selected
carefully. Additionally, this stage decides the methods for data collection to
collect necessary information for the next stage. The second step is analysis. The
most important activity of this stage is that the company learns its own strengths
and shortcomings. Regarding the benchmarking partners, a list of criteria should
be set, depending on the decided benchmarking type from the previous stage.
After finishing stage two, the company proceeds to modifying the benchmarks
integration, as well as making them into a detailed implementation plan in stage
three. Stage four concerns monitoring the progress and the achievement of having
implemented the benchmarks into practice. Since the external practices evolve
constantly, it is essential to plan for provision in advance. (Johnson & Scholes,
2001.) After all, benchmarking is a consistent process until reaching superior
performance (Camp, 1989).
2.1.5 Tools
One of the Sun Tzu’s rules in his book Art of War is “If you know the enemy and
know yourself, you need not fear the result of a hundred battles.” By far,
benchmarking has proved to capture the morale of Sun Tzu’s teaching. In that
essence, Johnson et.al (2005) points out SWOT analysis to be the key indicator
for analyzing company’s own performance in stage two of benchmarking process.
SWOT can recap the strategic capability of the company as well as main issues
within the business context, which is the second condition of Sun Tzu’s rule of
“knowing yourself”. SWOT stands for Strengths, Weaknesses, Opportunities, and
Threats. It is one of the key components of the marketing planning process.
SWOT analysis looks at the internal and external evaluation of the firm’s situation
using the collected information (either primary or secondary data). (Kotler et. al,
2009, 102.) Besides the purpose of grasping the current situation, company tries
to match its internal strengths with its external opportunities. Additionally,
weaknesses should transform to strengths and threats to opportunities (Blythe &
20
Megicks, 2010,131.)Aside from SWOT analysis, there a few other methods and
software tools that support different types of benchmarking, such as
Price/Performance Ratio, Potential Analysis, Life cycle Analysis, Spider web
Diagram, Combo Benchmark, and GOBENCH, etc. (Kairies, 2001).
There are seven methods of collecting data especially for benchmarking. They are
public domain, one-to-one, review benchmarking, database benchmarking, survey
benchmarking, and Business Excellence Models benchmarking. Public domain
includes secondary published data in newspapers or magazines, while one-to-one
method accounts for primary data concluded from visiting a certain company.
Meanwhile, review benchmarking refers to both primary and secondary data
regarding the relative strengths, weaknesses, best practices and even
recommendations as well as implementation plan, withdrawn by a team visiting
each benchmarkee. Then, database benchmarking concerns the comparison of the
data of the benchmarkees to a database of performance levels. Trial benchmarking
regards those primary data collected by testing the products/services of the
benchmarkees. Next, survey benchmarking relates to those primary data from
surveying the customer opinions towards the relative advantages and
disadvantages compared to the competitors. Lastly, Business Excellence Models
benchmarking indicates an assessor score framework including in the Business
Excellence Models, such as European Foundation for Quality Management
(EFQM) or Australian Business Excellence Framework (ABEF). (Stapenhurst,
2009.) Public domain and survey benchmarking remain the two data collection
methods of benchmarking that the thesis adopts for the desk study and the survey
in the empirical part of this research.
2.2 SOSTAC®
As already discussed briefly in the introduction chapter, despite its great benefits,
benchmarking is a vast idea. It is to say that wandering about the benchmarking
realm without the aid of any other decision making model is like entering a new
territory without any map. On top of that, selecting the right aspects to benchmark
is another challenge to the benchmarker. In the benchmarking process, planning is
21
the first and foremost task. It is the milestone structuring later stages. Therefore, it
is important to select the right planning paradigm from the beginning. There are
many planning model, such as Integrated Planning Model (IPM), Monte Carlo
Planners, to name a few. Each model has its own strengths and shortcomings. In
the author viewpoint, SOSTAC® model is the suitable complement for
benchmarking, since it focuses on conducting in detailed development plan. It
helps clarify any certainties manifesting in benchmarking process. (Smith, 2015.)
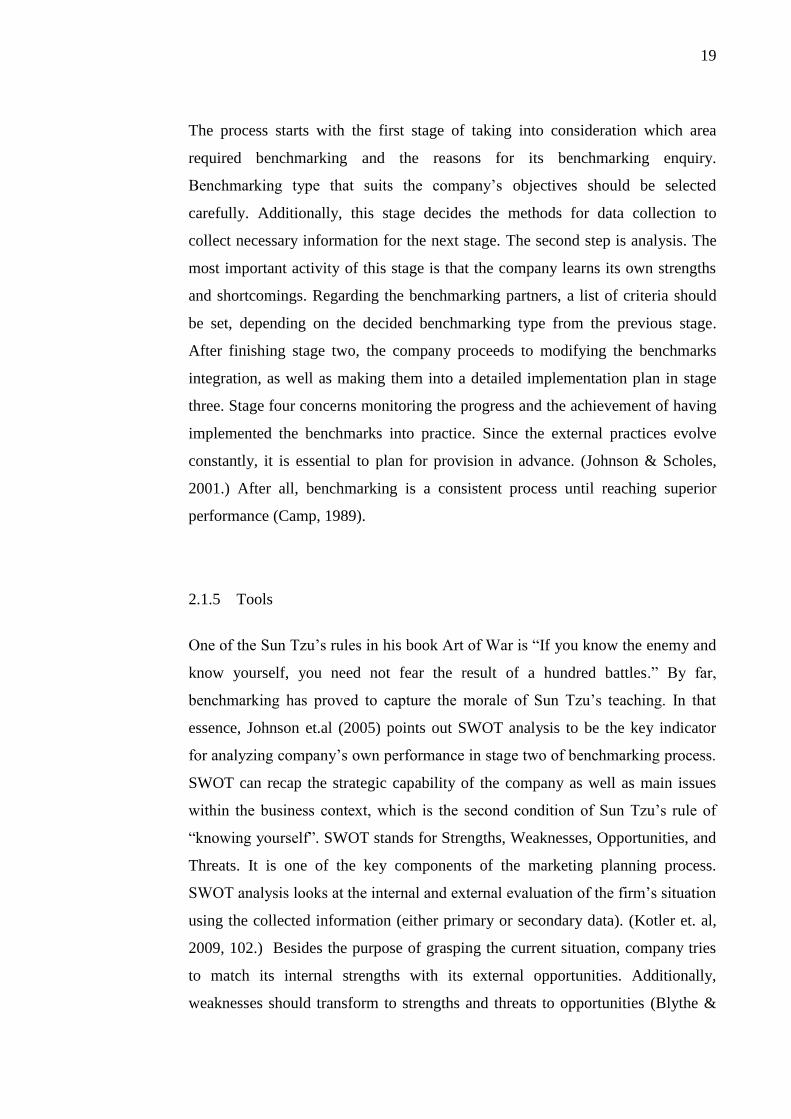
Developed in the 1990s, SOSTAC® model is a registered trademark of Paul R
Smith. It is a logical planning system, which is famous for those who are involved
with planning marketing strategies or campaigns. On top of that, the Chartered
Institute of Marketing centenary poll voted SOSTAC® in the top three Business
Models worldwide. As mentioned in the theoretical framework of the introduction
chapter, SOSTAC® is the abbreviation for the following six critical components
molding a triumphant plan: Situation Analysis, Objectives, Strategy, Tactics,
Action, and Control, as shown in figure below. (Smith, 2015.)
FIGURE 11. SOSTAC® Planning System (modified from Smith 2015)
The chart illustrates the flow of SOSTAC®. In a way, it embraces the idea of
benchmarking, as there are similarities between the processes of SOSTAC®
model and benchmarking (see figure benchmarking process steps in sub-chapter
ControlMeasurements and metric
ActionWho does what? When?
TacticsDetails of stategy
StategyHow do we get there?
ObjectivesWhere do we want to go?
Situation AnalysisWhere we are now?
22
2.1.4 for details). The next six sub-sections of this chapter discuss in depth each
component of SOSTAC®.
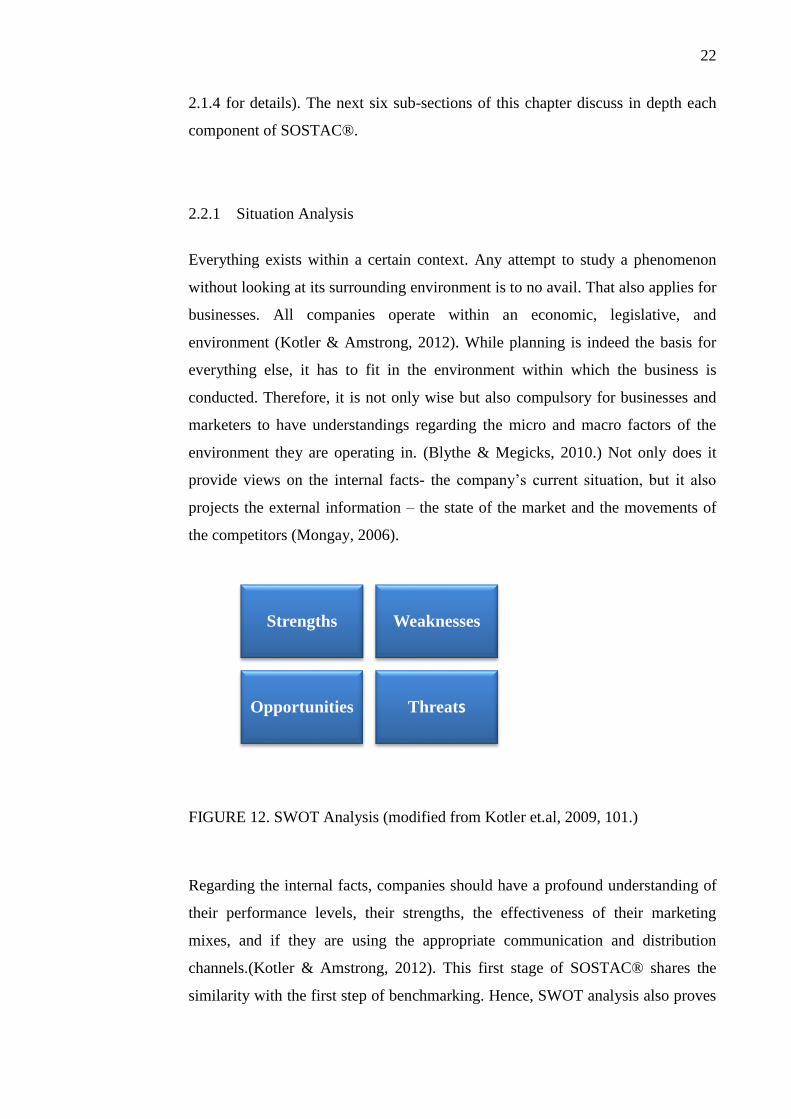
2.2.1 Situation Analysis
Everything exists within a certain context. Any attempt to study a phenomenon
without looking at its surrounding environment is to no avail. That also applies for
businesses. All companies operate within an economic, legislative, and
environment (Kotler & Amstrong, 2012). While planning is indeed the basis for
everything else, it has to fit in the environment within which the business is
conducted. Therefore, it is not only wise but also compulsory for businesses and
marketers to have understandings regarding the micro and macro factors of the
environment they are operating in. (Blythe & Megicks, 2010.) Not only does it
provide views on the internal facts- the company’s current situation, but it also
projects the external information – the state of the market and the movements of
the competitors (Mongay, 2006).
FIGURE 12. SWOT Analysis (modified from Kotler et.al, 2009, 101.)
Regarding the internal facts, companies should have a profound understanding of
their performance levels, their strengths, the effectiveness of their marketing
mixes, and if they are using the appropriate communication and distribution
channels.(Kotler & Amstrong, 2012). This first stage of SOSTAC® shares the
similarity with the first step of benchmarking. Hence, SWOT analysis also proves
Strengths Weaknesses
Opportunities Threats
23
to be useful for the assessment here (see sub-chapter Tool & Data Collection and
previous figure for idea about SWOT).
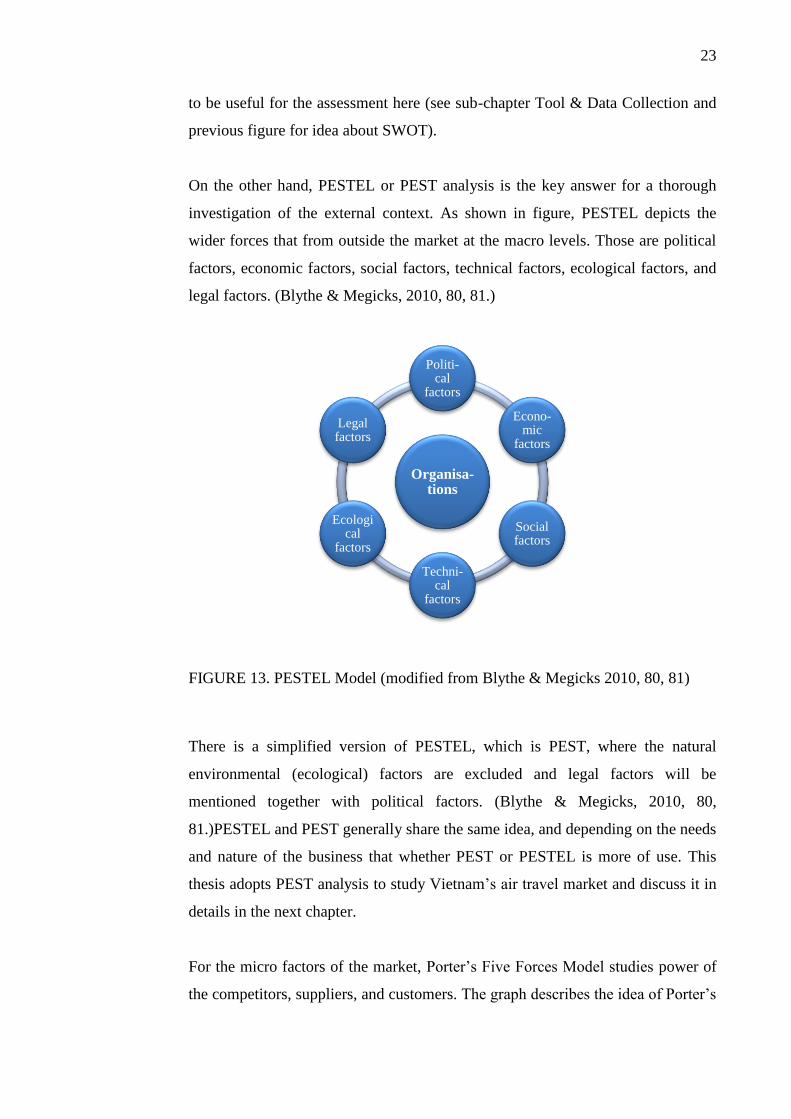
On the other hand, PESTEL or PEST analysis is the key answer for a thorough
investigation of the external context. As shown in figure, PESTEL depicts the
wider forces that from outside the market at the macro levels. Those are political
factors, economic factors, social factors, technical factors, ecological factors, and
legal factors. (Blythe & Megicks, 2010, 80, 81.)
FIGURE 13. PESTEL Model (modified from Blythe & Megicks 2010, 80, 81)
There is a simplified version of PESTEL, which is PEST, where the natural
environmental (ecological) factors are excluded and legal factors will be
mentioned together with political factors. (Blythe & Megicks, 2010, 80,
81.)PESTEL and PEST generally share the same idea, and depending on the needs
and nature of the business that whether PEST or PESTEL is more of use. This
thesis adopts PEST analysis to study Vietnam’s air travel market and discuss it in
details in the next chapter.
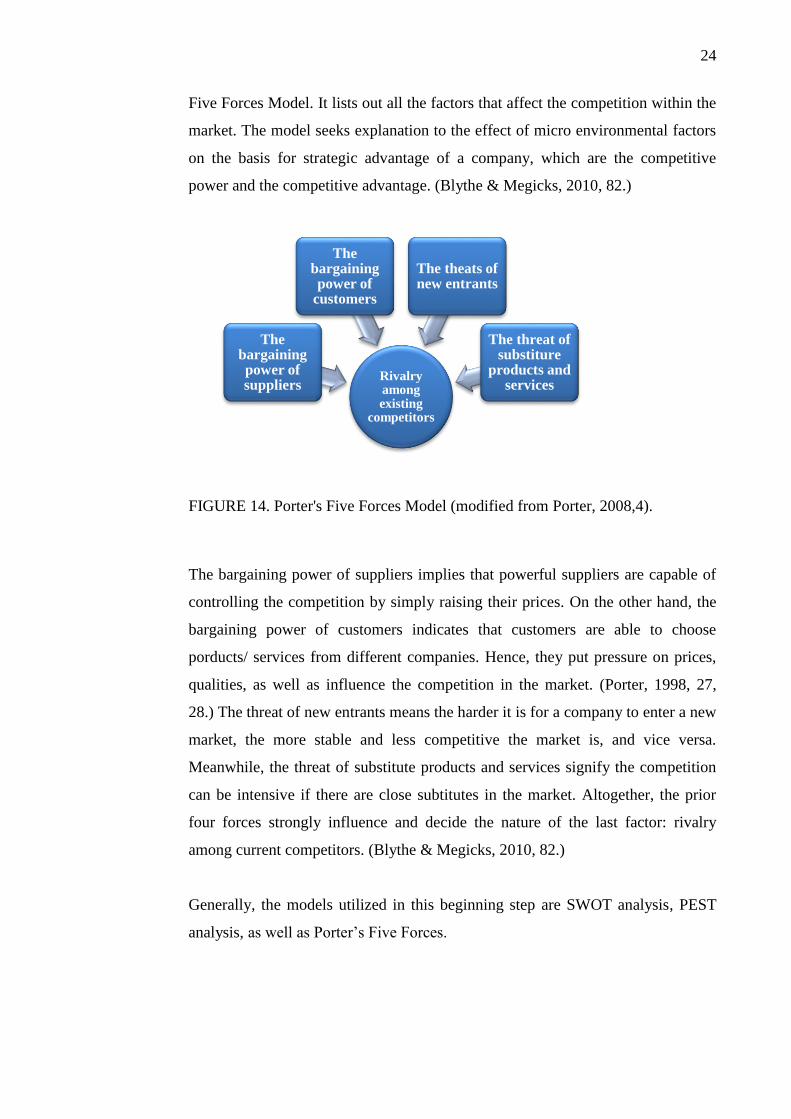
For the micro factors of the market, Porter’s Five Forces Model studies power of
the competitors, suppliers, and customers. The graph describes the idea of Porter’s
Organisa-tions
Politi-cal
factors
Econo-mic
factors
Social factors
Techni-cal
factors
Ecological
factors
Legal factors
24
Five Forces Model. It lists out all the factors that affect the competition within the
market. The model seeks explanation to the effect of micro environmental factors
on the basis for strategic advantage of a company, which are the competitive
power and the competitive advantage. (Blythe & Megicks, 2010, 82.)
FIGURE 14. Porter's Five Forces Model (modified from Porter, 2008,4).
The bargaining power of suppliers implies that powerful suppliers are capable of
controlling the competition by simply raising their prices. On the other hand, the
bargaining power of customers indicates that customers are able to choose
porducts/ services from different companies. Hence, they put pressure on prices,
qualities, as well as influence the competition in the market. (Porter, 1998, 27,
28.) The threat of new entrants means the harder it is for a company to enter a new
market, the more stable and less competitive the market is, and vice versa.
Meanwhile, the threat of substitute products and services signify the competition
can be intensive if there are close subtitutes in the market. Altogether, the prior
four forces strongly influence and decide the nature of the last factor: rivalry
among current competitors. (Blythe & Megicks, 2010, 82.)
Generally, the models utilized in this beginning step are SWOT analysis, PEST
analysis, as well as Porter’s Five Forces.
Rivalry among existing
competitors
The bargaining power of suppliers
The bargaining power of
customers
The theats of new entrants
The threat of substiture
products and services
25
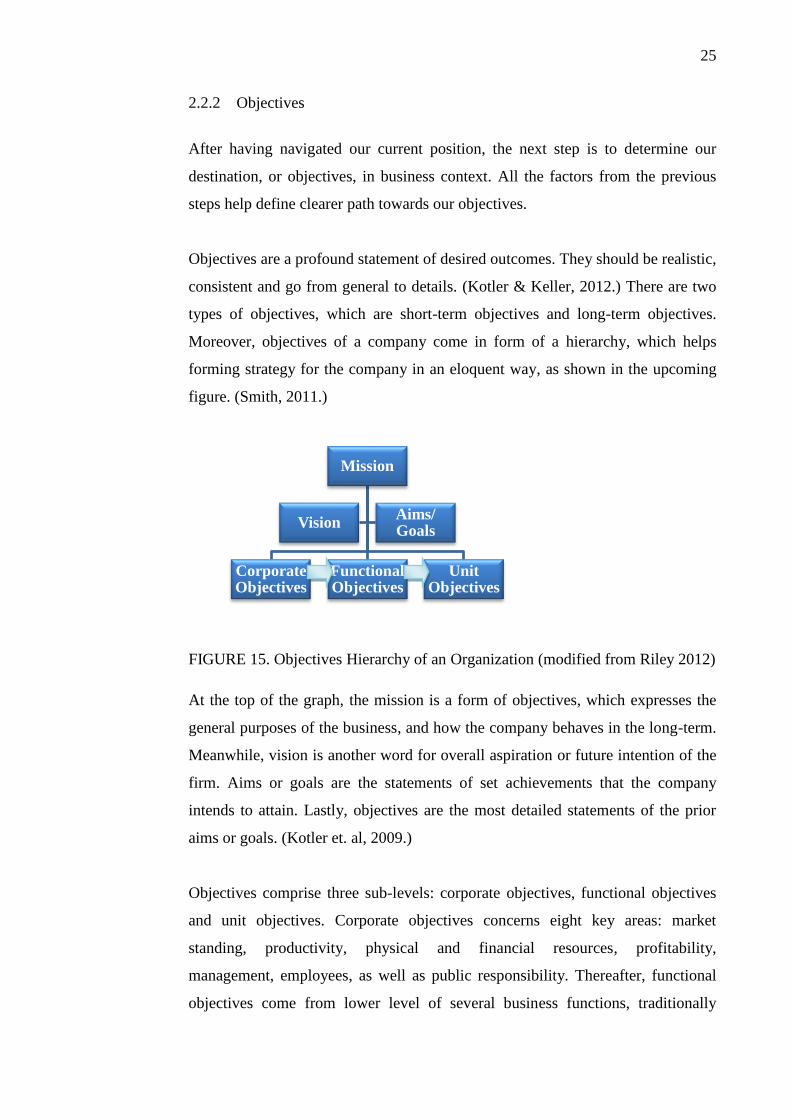
2.2.2 Objectives
After having navigated our current position, the next step is to determine our
destination, or objectives, in business context. All the factors from the previous
steps help define clearer path towards our objectives.
Objectives are a profound statement of desired outcomes. They should be realistic,
consistent and go from general to details. (Kotler & Keller, 2012.) There are two
types of objectives, which are short-term objectives and long-term objectives.
Moreover, objectives of a company come in form of a hierarchy, which helps
forming strategy for the company in an eloquent way, as shown in the upcoming
figure. (Smith, 2011.)
FIGURE 15. Objectives Hierarchy of an Organization (modified from Riley 2012)
At the top of the graph, the mission is a form of objectives, which expresses the
general purposes of the business, and how the company behaves in the long-term.
Meanwhile, vision is another word for overall aspiration or future intention of the
firm. Aims or goals are the statements of set achievements that the company
intends to attain. Lastly, objectives are the most detailed statements of the prior
aims or goals. (Kotler et. al, 2009.)
Objectives comprise three sub-levels: corporate objectives, functional objectives
and unit objectives. Corporate objectives concerns eight key areas: market
standing, productivity, physical and financial resources, profitability,
management, employees, as well as public responsibility. Thereafter, functional
objectives come from lower level of several business functions, traditionally
Mission
Corporate Objectives
Functional Objectives
Unit Objectives
VisionAims/ Goals
26
including: production & operation, finance & administration, marketing & sales,
and human resource (HR) management. Although each functional area has its own
distinctive objectives, the functional objectives have to be consistent with those
from corporate level. Finally, unit level objectives delve even deeper, for instance
sales goals for shops, retails or agents. (Riley, 2012).
Despite many forms of objectives, there is a general criteria for setting objectives,
which is SMART. It stands for Specific, Measurable, Achieavable, Relevant, and
Time specific (Smith, 2011). The objectives of Etihad Airways will be discussed
full length later in chapter 4.
2.2.3 Strategies
Generally, strategy is about the direction the company is heading in the long-term,
towards a certain target market, in order to gain specific advantages, upon its
current resources and within a competitive environment (Riley, 2012). Marketing
strategies also embraces the same idea. However, in this stage, the company
cannot be vague about necessary method to achieve their objectives. The method
has to be in exact terminology, in order to establish a daily implementation plan
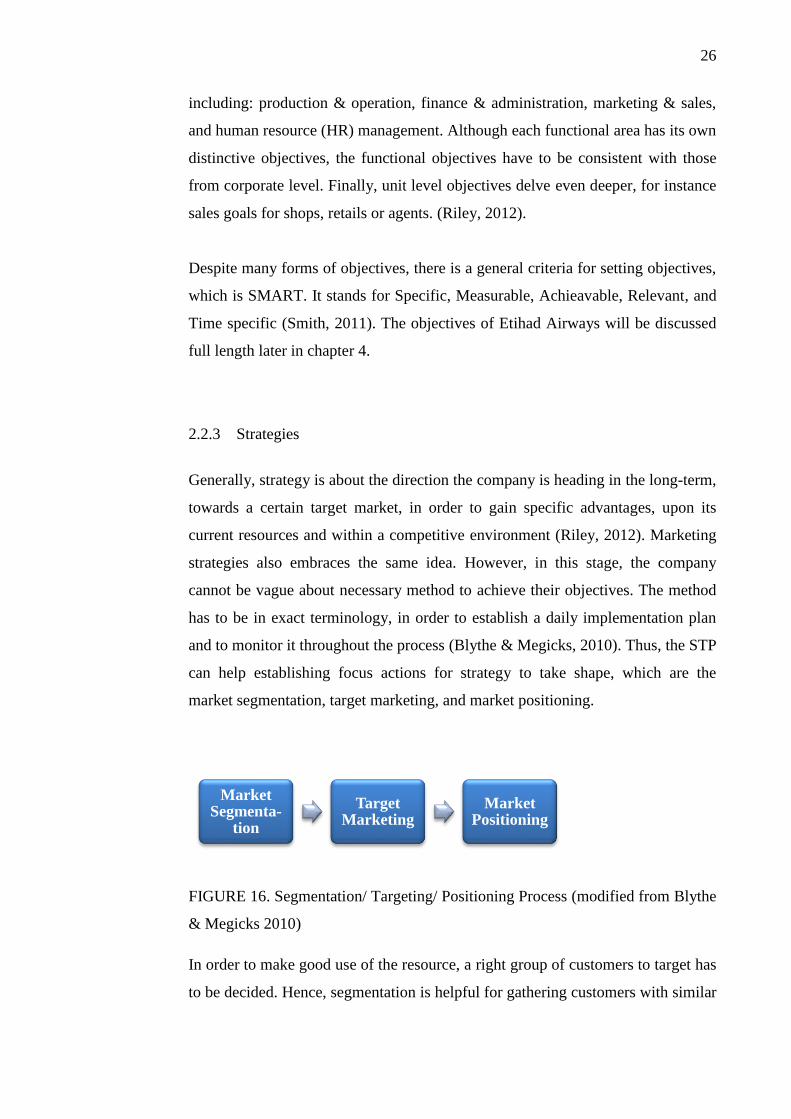
and to monitor it throughout the process (Blythe & Megicks, 2010). Thus, the STP
can help establishing focus actions for strategy to take shape, which are the
market segmentation, target marketing, and market positioning.
FIGURE 16. Segmentation/ Targeting/ Positioning Process (modified from Blythe
& Megicks 2010)
In order to make good use of the resource, a right group of customers to target has
to be decided. Hence, segmentation is helpful for gathering customers with similar
Market Segmenta-
tion
Target Marketing
Market Positioning
27
needs and characteristics into a group, namely a market segment. Certainly, there
are many types of segmentation for B2C market including behavioral
segmentation, geographic segmentation, demographic segmentation, age
segmentation, and so on. Behavioral segmentation is the chosen one for the thesis,
since it looks at the six following psychographic variables: benefit sought,
purchase occasion, purchase behavior, usage, buyer readiness stage, and attitude
towards the product. (Kotler & Amstrong, 2012,191-192.)
The benefit sought refers to the desired practical benefits of customers. In some
cases, people seek the prestige or the pleasure of owning a product or
experiencing a service. Sampson (1992) calls them functionally seekers, image
seekers and pleasurable seekers, respectively. Then, purchase occasion indicates
whether the product purchased as gift or for personal use. Sometimes, it also
means buying different version of the products at different times. Purchase
behavior attempts at explaining the reasons for decision to buy a product or use a
service or payment methods of the customers. Next, usage describes the patterns
of the customers, if they are new customers, frequent customers or wind-back
customers. The purpose of this one is to find tactics to encourage light customers
to medium customers while re-recruiting old customers. Buyer readiness stage
affects the type of communication the company needs to use to offer the needed
information for the customers to make their purchasing decisions. Attitude
towards the product gives the general view on how the customers percept the
product or service. (Blythe & Megicks, 2010, 158- 159.)
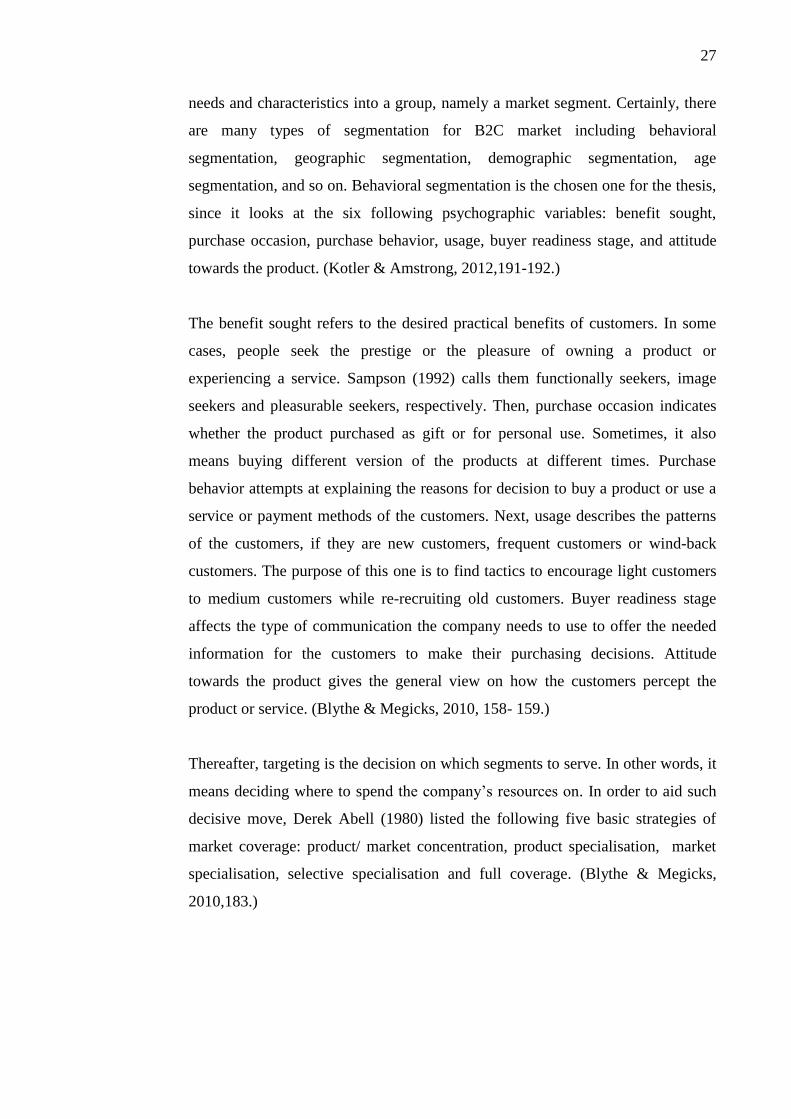
Thereafter, targeting is the decision on which segments to serve. In other words, it
means deciding where to spend the company’s resources on. In order to aid such
decisive move, Derek Abell (1980) listed the following five basic strategies of
market coverage: product/ market concentration, product specialisation, market
specialisation, selective specialisation and full coverage. (Blythe & Megicks,
2010,183.)
28
FIGURE 17. Targeting Five Strategies (modified from Kotler & Keller, 2012,254)
The figure above provides the general picture regarding the five strategies for
targeting. Each and every of them has its own orientation towards certain
objectives in the market. For instance, full coverage strategy indicates firm’s
attempts to enters every possible segments in its market. Then, a closer range of
the market is multiple segment specialisation, including: product specialisation
and market specialisation. Product specialisation shows that firm pays full
attention on its production of a special product type and offer it to several
segments. On the contrary, for market specialisation strategy, company provides a
specific group of customers every types of product that fit their needs. Then the
single-segment concentration or product/ market concentration strategy focuses on
the niche segment, which means the company perform the marketing activities on
one small special part of the market. As for selective specialisation, business
select individuals as segments to do one-to-one marketing. (Kotler & Keller,
2012, 255-256.)
Targeting
Product/ Market
Concen-tration
Product Speciali-
sation
Market Speciali-
sation
Selective Speciali-
sation
Full
Coverage
29
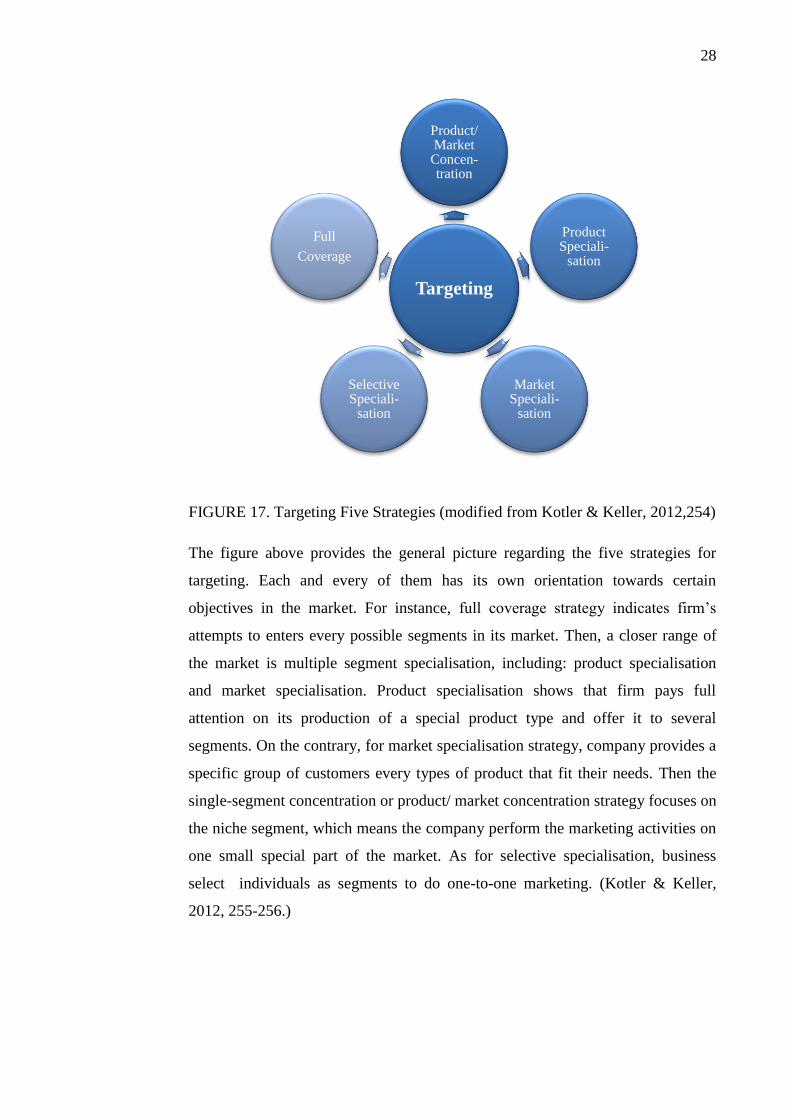
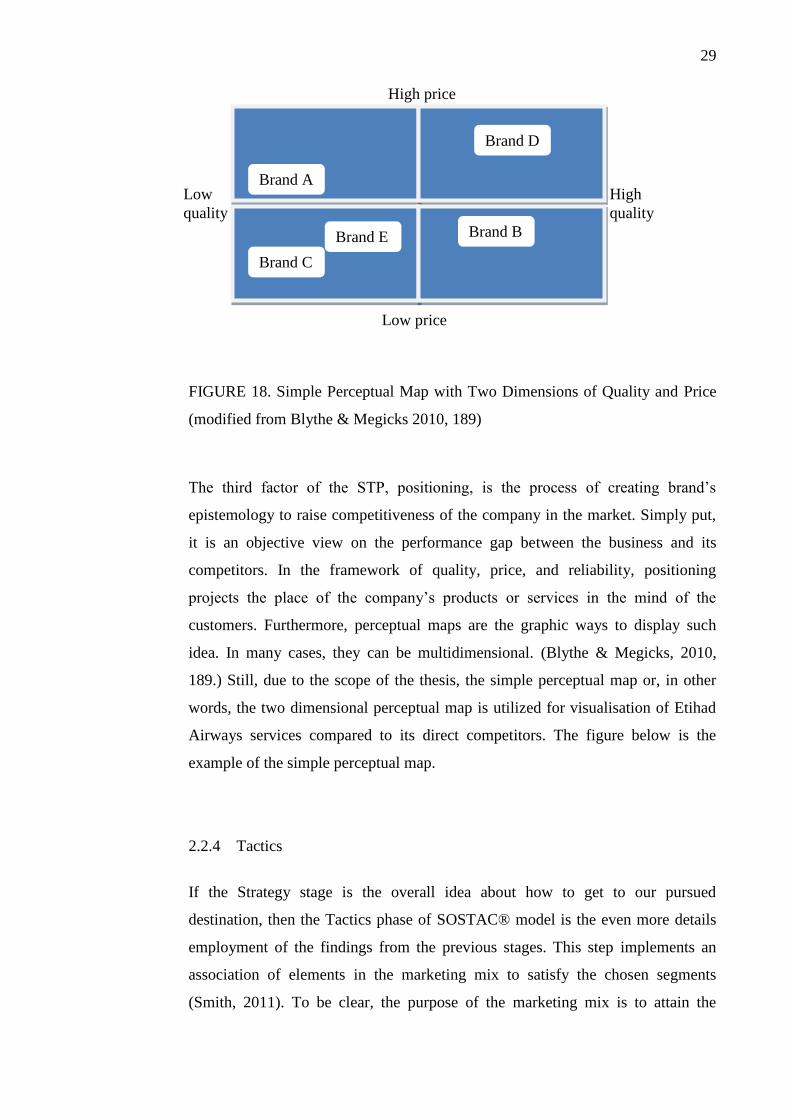
FIGURE 18. Simple Perceptual Map with Two Dimensions of Quality and Price
(modified from Blythe & Megicks 2010, 189)
The third factor of the STP, positioning, is the process of creating brand’s
epistemology to raise competitiveness of the company in the market. Simply put,
it is an objective view on the performance gap between the business and its
competitors. In the framework of quality, price, and reliability, positioning
projects the place of the company’s products or services in the mind of the
customers. Furthermore, perceptual maps are the graphic ways to display such
idea. In many cases, they can be multidimensional. (Blythe & Megicks, 2010,
189.) Still, due to the scope of the thesis, the simple perceptual map or, in other
words, the two dimensional perceptual map is utilized for visualisation of Etihad
Airways services compared to its direct competitors. The figure below is the
example of the simple perceptual map.
2.2.4 Tactics
If the Strategy stage is the overall idea about how to get to our pursued
destination, then the Tactics phase of SOSTAC® model is the even more details
employment of the findings from the previous stages. This step implements an
association of elements in the marketing mix to satisfy the chosen segments
(Smith, 2011). To be clear, the purpose of the marketing mix is to attain the
High price
Low price
Low
quality
High
quality
Brand A
Brand D
Brand C
Brand E Brand B
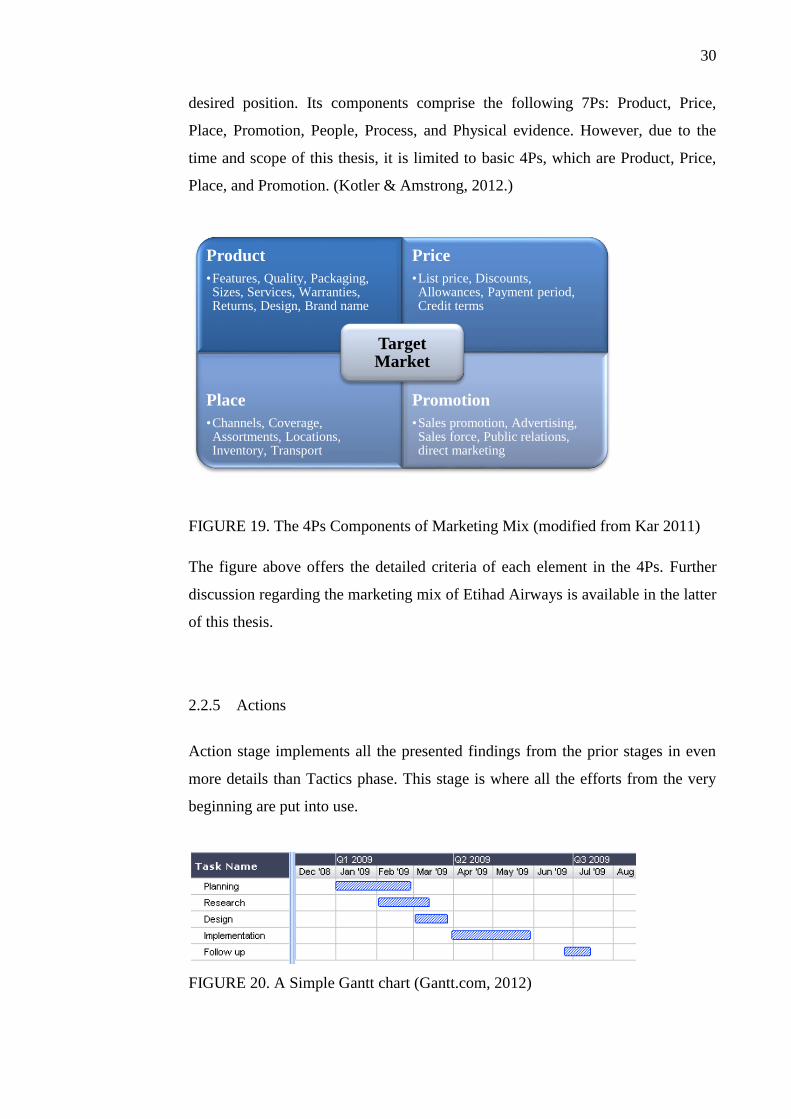
30
desired position. Its components comprise the following 7Ps: Product, Price,
Place, Promotion, People, Process, and Physical evidence. However, due to the
time and scope of this thesis, it is limited to basic 4Ps, which are Product, Price,
Place, and Promotion. (Kotler & Amstrong, 2012.)
FIGURE 19. The 4Ps Components of Marketing Mix (modified from Kar 2011)
The figure above offers the detailed criteria of each element in the 4Ps. Further
discussion regarding the marketing mix of Etihad Airways is available in the latter
of this thesis.
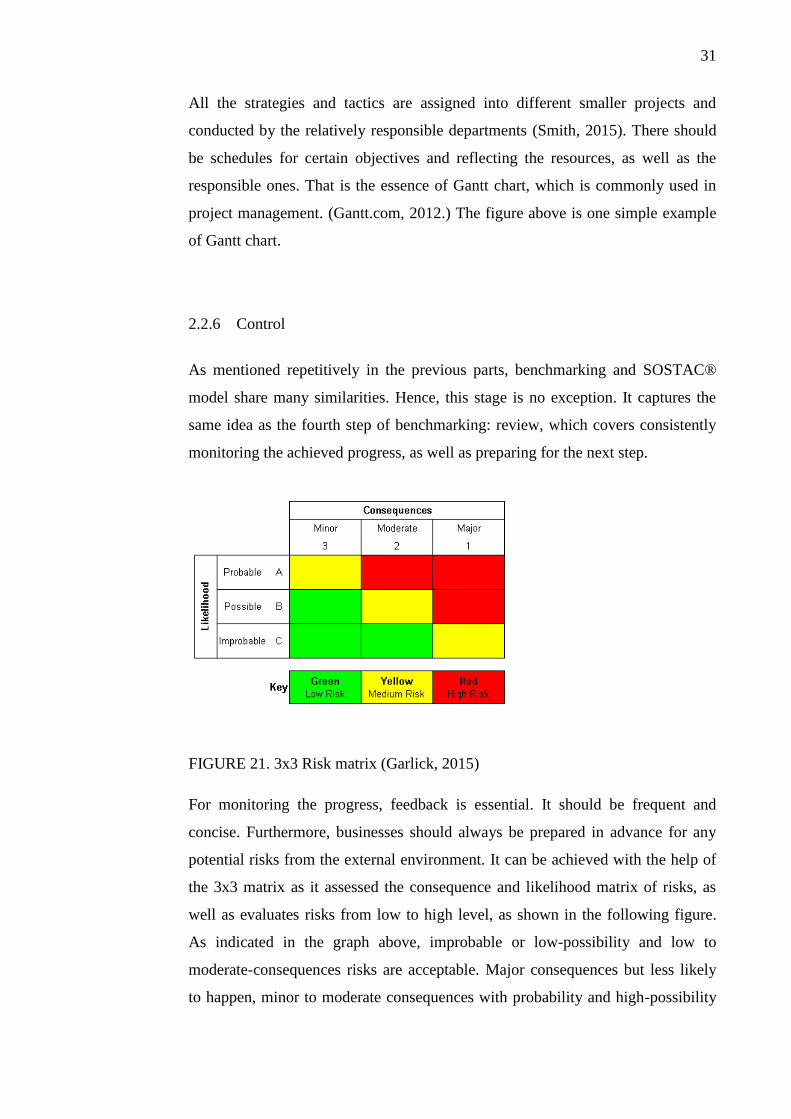
2.2.5 Actions
Action stage implements all the presented findings from the prior stages in even
more details than Tactics phase. This stage is where all the efforts from the very
beginning are put into use.
FIGURE 20. A Simple Gantt chart (Gantt.com, 2012)
Product
•Features, Quality, Packaging, Sizes, Services, Warranties, Returns, Design, Brand name
Price
•List price, Discounts, Allowances, Payment period, Credit terms
Place
•Channels, Coverage, Assortments, Locations, Inventory, Transport
Promotion
•Sales promotion, Advertising, Sales force, Public relations, direct marketing
Target Market
31
All the strategies and tactics are assigned into different smaller projects and
conducted by the relatively responsible departments (Smith, 2015). There should
be schedules for certain objectives and reflecting the resources, as well as the
responsible ones. That is the essence of Gantt chart, which is commonly used in
project management. (Gantt.com, 2012.) The figure above is one simple example
of Gantt chart.
2.2.6 Control
As mentioned repetitively in the previous parts, benchmarking and SOSTAC®
model share many similarities. Hence, this stage is no exception. It captures the
same idea as the fourth step of benchmarking: review, which covers consistently
monitoring the achieved progress, as well as preparing for the next step.
FIGURE 21. 3x3 Risk matrix (Garlick, 2015)
For monitoring the progress, feedback is essential. It should be frequent and
concise. Furthermore, businesses should always be prepared in advance for any
potential risks from the external environment. It can be achieved with the help of
the 3x3 matrix as it assessed the consequence and likelihood matrix of risks, as
well as evaluates risks from low to high level, as shown in the following figure.
As indicated in the graph above, improbable or low-possibility and low to
moderate-consequences risks are acceptable. Major consequences but less likely
to happen, minor to moderate consequences with probability and high-possibility
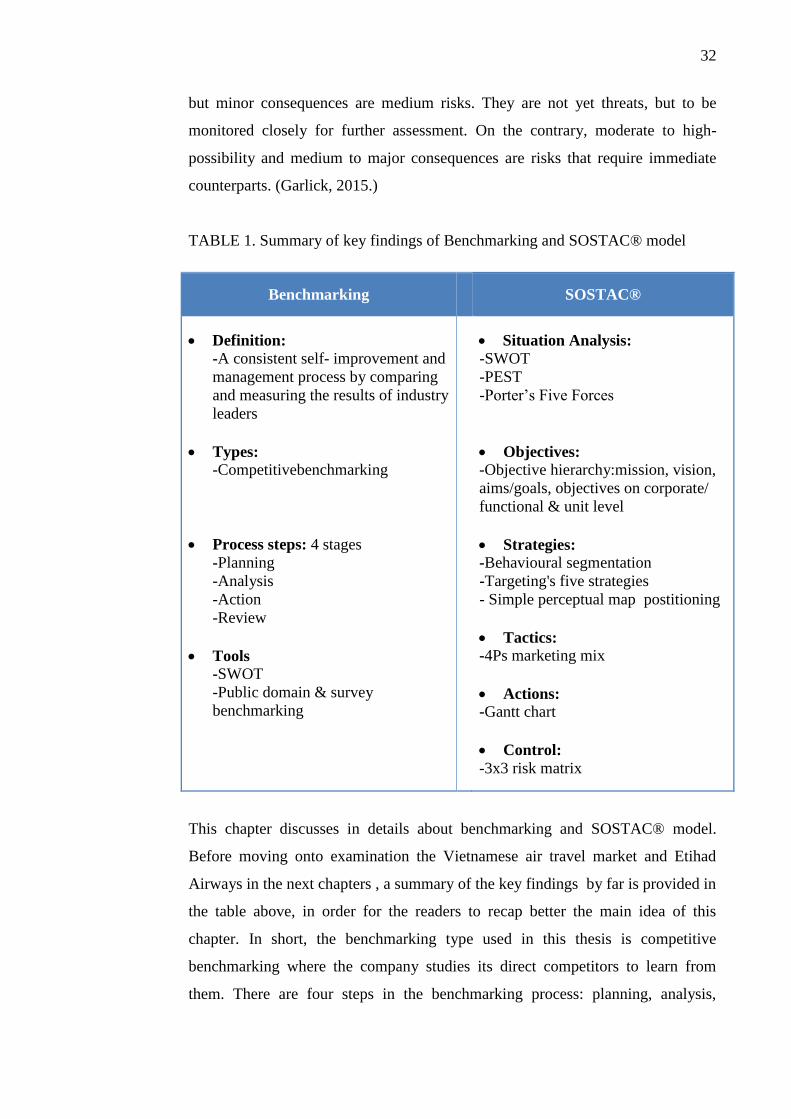
32
but minor consequences are medium risks. They are not yet threats, but to be
monitored closely for further assessment. On the contrary, moderate to high-
possibility and medium to major consequences are risks that require immediate
counterparts. (Garlick, 2015.)
TABLE 1. Summary of key findings of Benchmarking and SOSTAC® model
Benchmarking SOSTAC®
Definition:
-A consistent self- improvement and
management process by comparing
and measuring the results of industry
leaders
Types:
-Competitivebenchmarking
Process steps: 4 stages
-Planning
-Analysis
-Action
-Review
Tools
-SWOT
-Public domain & survey
benchmarking
Situation Analysis: -SWOT
-PEST
-Porter’s Five Forces
Objectives: -Objective hierarchy:mission, vision,
aims/goals, objectives on corporate/
functional & unit level
Strategies: -Behavioural segmentation
-Targeting's five strategies
- Simple perceptual map postitioning
Tactics: -4Ps marketing mix
Actions: -Gantt chart
Control:
-3x3 risk matrix
This chapter discusses in details about benchmarking and SOSTAC® model.
Before moving onto examination the Vietnamese air travel market and Etihad
Airways in the next chapters , a summary of the key findings by far is provided in
the table above, in order for the readers to recap better the main idea of this
chapter. In short, the benchmarking type used in this thesis is competitive
benchmarking where the company studies its direct competitors to learn from
them. There are four steps in the benchmarking process: planning, analysis,
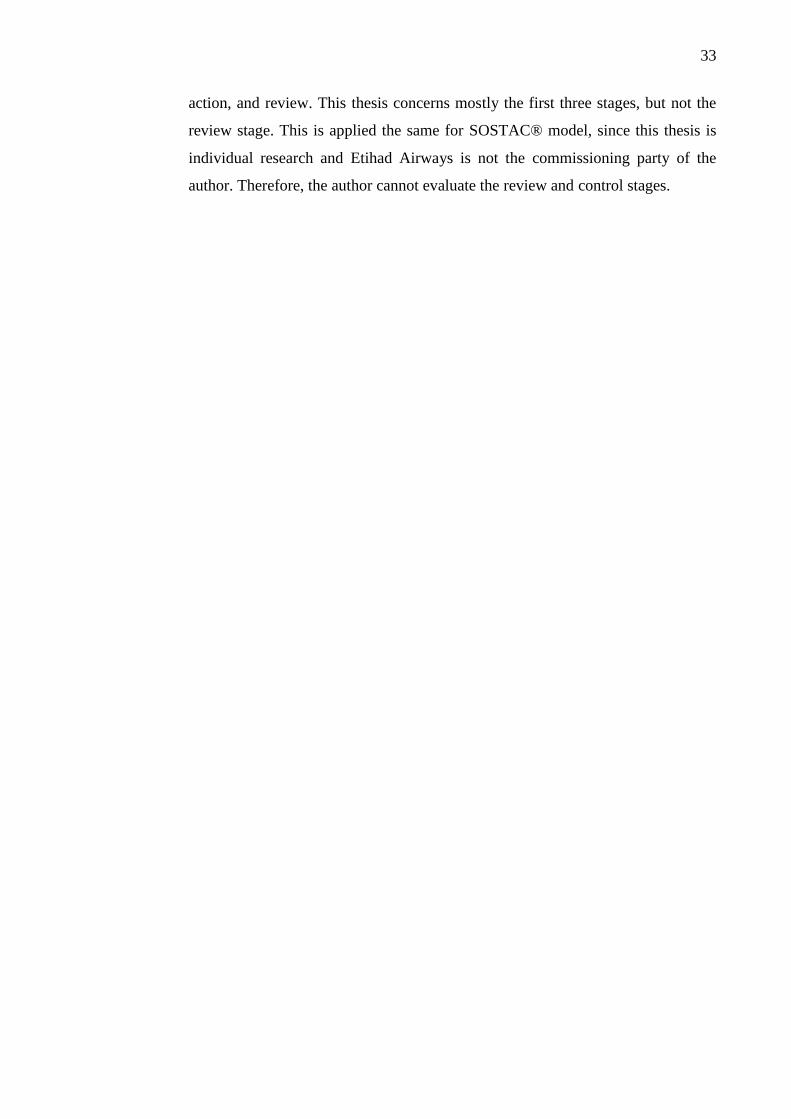
33
action, and review. This thesis concerns mostly the first three stages, but not the
review stage. This is applied the same for SOSTAC® model, since this thesis is
individual research and Etihad Airways is not the commissioning party of the
author. Therefore, the author cannot evaluate the review and control stages.
34
3 GLOBAL AVIATION INDUSTRY AND SITUATION IN VIETNAM
MARKET
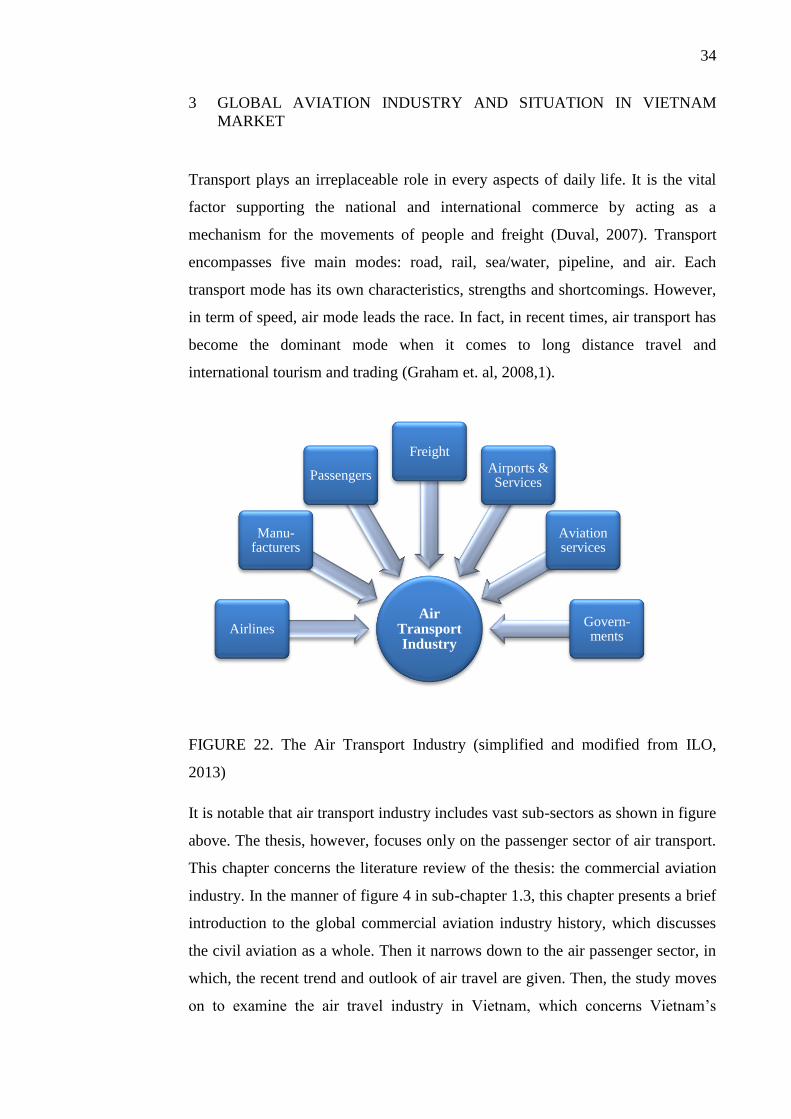
Transport plays an irreplaceable role in every aspects of daily life. It is the vital
factor supporting the national and international commerce by acting as a
mechanism for the movements of people and freight (Duval, 2007). Transport
encompasses five main modes: road, rail, sea/water, pipeline, and air. Each
transport mode has its own characteristics, strengths and shortcomings. However,
in term of speed, air mode leads the race. In fact, in recent times, air transport has
become the dominant mode when it comes to long distance travel and
international tourism and trading (Graham et. al, 2008,1).
FIGURE 22. The Air Transport Industry (simplified and modified from ILO,
2013)
It is notable that air transport industry includes vast sub-sectors as shown in figure
above. The thesis, however, focuses only on the passenger sector of air transport.
This chapter concerns the literature review of the thesis: the commercial aviation
industry. In the manner of figure 4 in sub-chapter 1.3, this chapter presents a brief
introduction to the global commercial aviation industry history, which discusses
the civil aviation as a whole. Then it narrows down to the air passenger sector, in
which, the recent trend and outlook of air travel are given. Then, the study moves
on to examine the air travel industry in Vietnam, which concerns Vietnam’s
Air Transport Industry
Airlines
Manu-facturers
Passengers
Freight
Airports & Services
Aviation services
Govern-ments
35
economy outlook for the 5 year period from 2011 - 2016, and PEST analysis, as
well as Porter’s Five Forces analysis of Vietnam market.
3.1 Global Commercial Aviation Industry
Initially, aviation is the terminology first used in 1866. It was originally a French
word, derived from the Latin word “avis”, which means bird. Aviation involves
every practical aspects of aeronautics, including the design, development,
production, operation, and use of aircraft or heavier- than- air aircraft (i.e.
airplane, helicopter, etc.). (Merriam- Webster, 2015.)
Then, aviation has two sub-categories regarding its purposes: military aviation and
non-military aviation, or in other words, civil aviation. Commercial aviation,
which includes both general aviation and scheduled flight services, is a part of
civil aviation. It involves operating aircraft for lease to transport passengers, mails
or cargos. (ICAO, 2009.)
January 1, 2014 celebrated 100 year since the birth of commercial aviation
(IATA, 2014a). Over time, aviation has been an increasingly critical mode, and
proactively connecting every parts of the world. It facilitates tourism, world trade,
economy growth and enables globalization in other industries worldwide (Kroo &
Alonso, 2005).
3.1.1 Global Commercial Aviation History Overview
One of the remarkable time points of aviation was a 120- foot (36,6 meters), 12-
second flight made by Orville and Wilbur Wright, in North Carolina, on
December 17, 1903. It was the first powered flight in a heavier-than-air machine
in history. Then, the year 1908 marked the first flight with a passenger from a
meadow outside Paris. The St. Petersburg - Tampa Airboat Line provided the first
scheduled flight with only a passenger across Tampa Bay, Florida, on January 1,
1914. It made the 18- mile (29 kilometres) in only 23 minutes, considerably faster
than a two-hour trip by boat. The company operated two flights a day for four
months, then folded with the end of the winter tourist season. (Avjobs, 2015.)
36
Still, aviation was not yet made into an industry, since people at that time were
still skeptical about travelling with flying machines. Improvements in aircarft
design were also scarce. The situation changed during the Word Ward I. Aviation
was, by then, regconised as an indutry. However, it dealt mostly with military
demands. Then, during Word War II, the importance of aviation became more
apparent. Although the war halted almost all airline activities worldwide, as
carriers donated their aircraft for military uses, air transport generally proved its
great importance over supporting the flows of freights and passengers for war
supplies. It provided the desired airlift to keep the moving of troops and supplies.
As a result, 50 000 planes were manufactured a year and new routes were
established, by the end of the war. (Avjobs, 2015.)
Following the end of World War II, regular commercial service was restored. Air
travel boomed around the world. (Avjobs, 2015.) Together with the beginning of
new nations in Asia, more airliners were also founded. However, in United States,
the tremendous growth of commercial aviation industry raised new problems. In
1956, two aircraft collided over the Grand Canyon, resulted in 128 deaths. This
led to the pass of Federal Aviation Act of 1958 and the establishment of Federal
Aviation Agency (later called the Federal Aviation Administration – FAA). FAA
was, back then, a new safety regulatory agency with the objective of maintaining
the safe separation of all commercial aircraft through all phases of flight. (Avjobs,
2015.) This period also was the era of tremendously development in aviation
technology, especially the jet airliner appearance. The first commercial jet was the
De Havilland Comet, operated by BOAC (British Overseas Airways Coporation).
It was used for the flight connected London and Johannesburg in 1952. This
aircraft helped reduce the fatique from metal noise of passengers during the flight.
However, Boeing 707 (1958) and the first jumbo jet Boeing 747 (1970) proved
even more outstanding performances. Thanks to the jumbo jet’s accomodating up
to 500 passengers, they led to rapid reduction in seat cost per passenger kilometre,
which is a common measure of revenue yield. (Holloway & Humphreys, 2012.)
Thereafter, commercial air transport slowly shifted away from being one of the
most regulated industries, thanks to the introduction of more liberalised transport
37
regimes around the world(Duval, 2007). Prior to that, in 1944, there was already a
establishment of the five freedoms of air at Chicago Convention on Civil Aviation
with agreements from 80 presented governments. The five freedoms of air were
priviledges to fly across a country without landing; landing in a country for
puposes, such as refueling, other than the purposes of carriage of passengers or
freight; offloading passengers, mail or freight from an airline of the originated
country; load passengers, mail or freight on an airliner to destined country; lastly,
load passengers, mail or freight on an airline not belonging to the destined country
and offload passengers, mail, freight from an airline not of the originated country.
These priviledges, however, were the framework for only bilateral agreements
between countries at the time. Since then, there were many more commercial
aviation liberalisation movements. The US passed the 1978 Airline Deregulation
Act, partialy shifted control over commercial aviation from the political to the
market sphere (Smith Jr & Cox, 2008). In Europe, people witnessed the fruit of
many years of argument and slow evolution, as the Single Aviation Market of the
European Union was introduced on April 1, 1997. This formation welcomed a
new era for European airlines to operate in a market characterized by almost
freedom from constraints in the areas of market entry, capacity and pricing
(Graham et.al, 2008, 36.)
The deregulation in commercial aviation changed the overall air travel picture.
Charter airlines was freed to sell openly on a “seat - only basis”, instead of the
prior “inclusive tour” charters. It also created the opportunities for new airlines to
develop and old-established ones to adopt new business strategies. A new kind of
airlines, that offer much reduced fares for a more basic air product, appeared. New
markets for short hauls, such as weekend breaks also taken shape. It was all
thanks to the steady growth in global economy of the 1990s and rises in real
income, which altogether contributed to the high demand on air travel at the time.
This situation brought forth a mixture of both opportunities and challenges for
airlines, especially charter carriers since they had to compete agaisnt the rising
low cost carriers (later will be refered to as LCC). Decisions regarding cost
control and pricing structured were strictly reckoned. (Grahamet. al, 2008, 36, 37.)
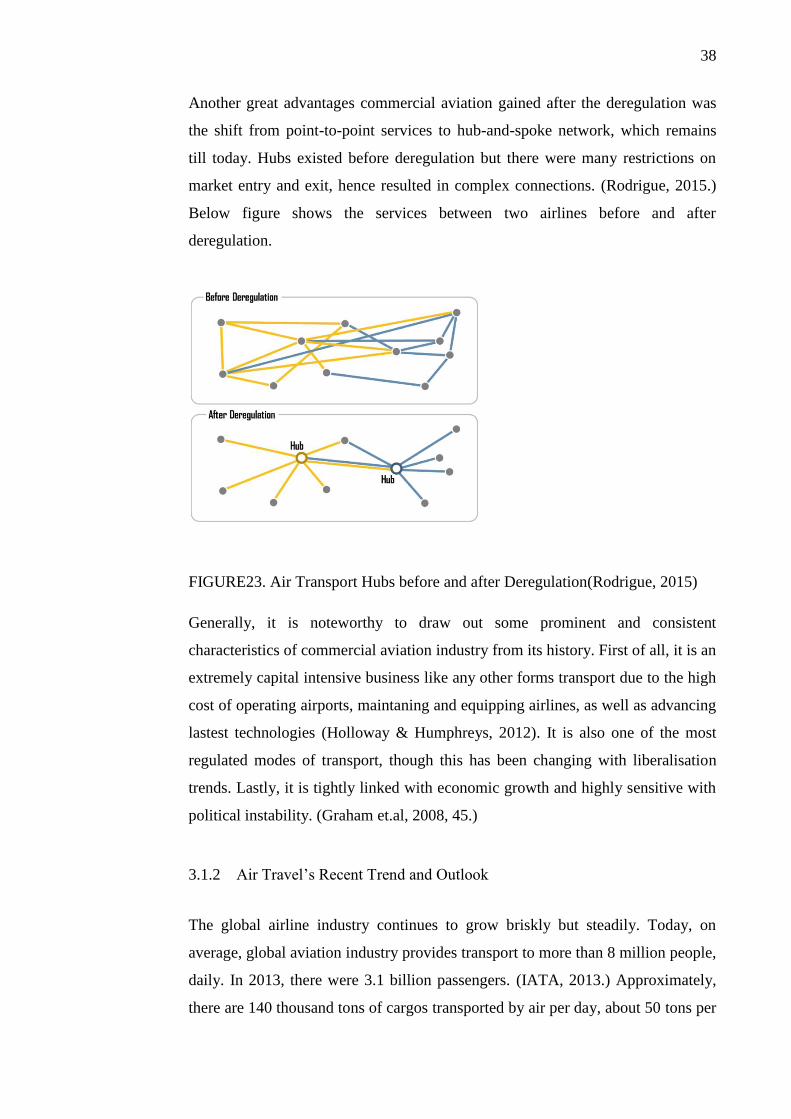
38
Another great advantages commercial aviation gained after the deregulation was
the shift from point-to-point services to hub-and-spoke network, which remains
till today. Hubs existed before deregulation but there were many restrictions on
market entry and exit, hence resulted in complex connections. (Rodrigue, 2015.)
Below figure shows the services between two airlines before and after
deregulation.
FIGURE23. Air Transport Hubs before and after Deregulation(Rodrigue, 2015)
Generally, it is noteworthy to draw out some prominent and consistent
characteristics of commercial aviation industry from its history. First of all, it is an
extremely capital intensive business like any other forms transport due to the high
cost of operating airports, maintaning and equipping airlines, as well as advancing
lastest technologies (Holloway & Humphreys, 2012). It is also one of the most
regulated modes of transport, though this has been changing with liberalisation
trends. Lastly, it is tightly linked with economic growth and highly sensitive with
political instability. (Graham et.al, 2008, 45.)
3.1.2 Air Travel’s Recent Trend and Outlook
The global airline industry continues to grow briskly but steadily. Today, on
average, global aviation industry provides transport to more than 8 million people,
daily. In 2013, there were 3.1 billion passengers. (IATA, 2013.) Approximately,
there are 140 thousand tons of cargos transported by air per day, about 50 tons per
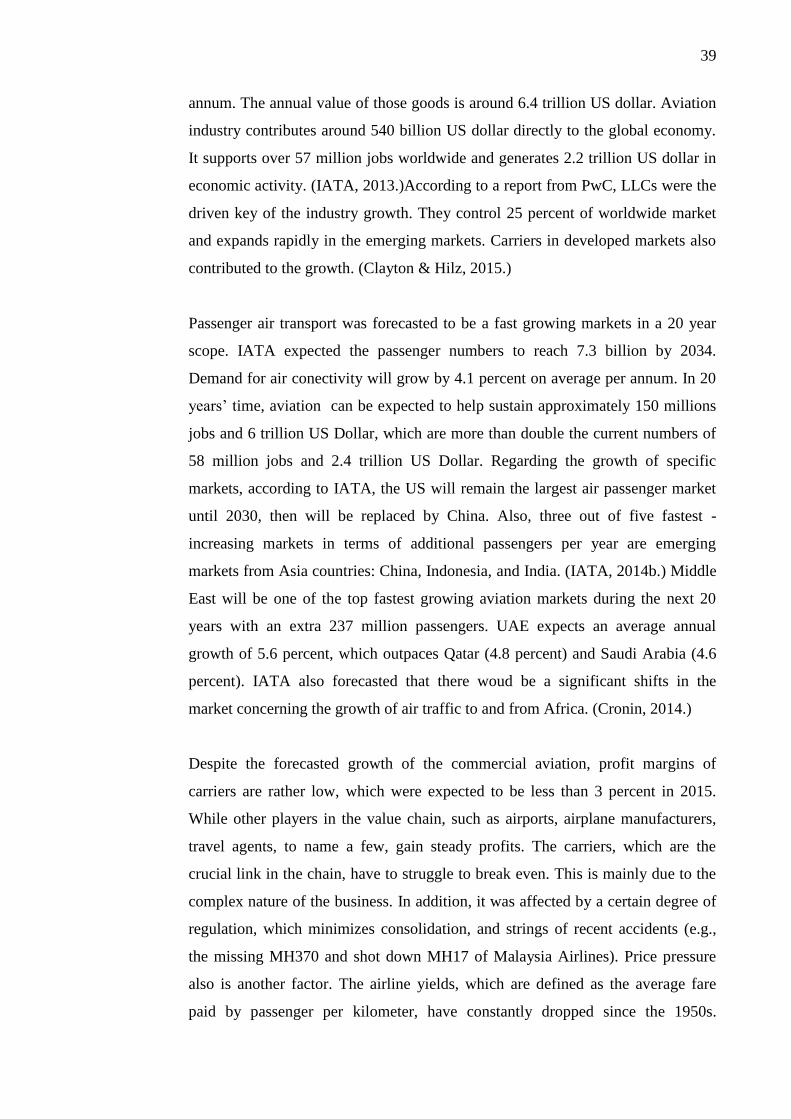
39
annum. The annual value of those goods is around 6.4 trillion US dollar. Aviation
industry contributes around 540 billion US dollar directly to the global economy.
It supports over 57 million jobs worldwide and generates 2.2 trillion US dollar in
economic activity. (IATA, 2013.)According to a report from PwC, LLCs were the
driven key of the industry growth. They control 25 percent of worldwide market
and expands rapidly in the emerging markets. Carriers in developed markets also
contributed to the growth. (Clayton & Hilz, 2015.)
Passenger air transport was forecasted to be a fast growing markets in a 20 year
scope. IATA expected the passenger numbers to reach 7.3 billion by 2034.
Demand for air conectivity will grow by 4.1 percent on average per annum. In 20
years’ time, aviation can be expected to help sustain approximately 150 millions
jobs and 6 trillion US Dollar, which are more than double the current numbers of
58 million jobs and 2.4 trillion US Dollar. Regarding the growth of specific
markets, according to IATA, the US will remain the largest air passenger market
until 2030, then will be replaced by China. Also, three out of five fastest -
increasing markets in terms of additional passengers per year are emerging
markets from Asia countries: China, Indonesia, and India. (IATA, 2014b.) Middle
East will be one of the top fastest growing aviation markets during the next 20
years with an extra 237 million passengers. UAE expects an average annual
growth of 5.6 percent, which outpaces Qatar (4.8 percent) and Saudi Arabia (4.6
percent). IATA also forecasted that there woud be a significant shifts in the
market concerning the growth of air traffic to and from Africa. (Cronin, 2014.)
Despite the forecasted growth of the commercial aviation, profit margins of
carriers are rather low, which were expected to be less than 3 percent in 2015.
While other players in the value chain, such as airports, airplane manufacturers,
travel agents, to name a few, gain steady profits. The carriers, which are the
crucial link in the chain, have to struggle to break even. This is mainly due to the
complex nature of the business. In addition, it was affected by a certain degree of
regulation, which minimizes consolidation, and strings of recent accidents (e.g.,
the missing MH370 and shot down MH17 of Malaysia Airlines). Price pressure
also is another factor. The airline yields, which are defined as the average fare
paid by passenger per kilometer, have constantly dropped since the 1950s.
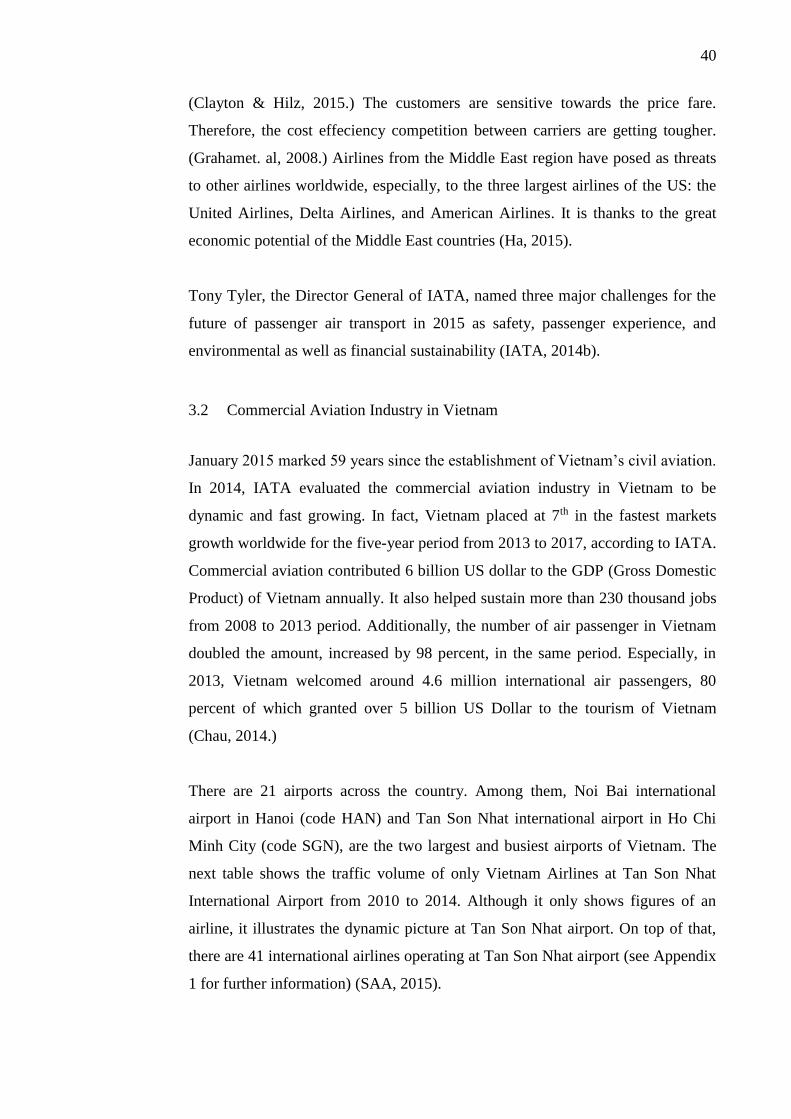
40
(Clayton & Hilz, 2015.) The customers are sensitive towards the price fare.
Therefore, the cost effeciency competition between carriers are getting tougher.
(Grahamet. al, 2008.) Airlines from the Middle East region have posed as threats
to other airlines worldwide, especially, to the three largest airlines of the US: the
United Airlines, Delta Airlines, and American Airlines. It is thanks to the great
economic potential of the Middle East countries (Ha, 2015).
Tony Tyler, the Director General of IATA, named three major challenges for the
future of passenger air transport in 2015 as safety, passenger experience, and
environmental as well as financial sustainability (IATA, 2014b).
3.2 Commercial Aviation Industry in Vietnam
January 2015 marked 59 years since the establishment of Vietnam’s civil aviation.
In 2014, IATA evaluated the commercial aviation industry in Vietnam to be
dynamic and fast growing. In fact, Vietnam placed at 7th in the fastest markets
growth worldwide for the five-year period from 2013 to 2017, according to IATA.
Commercial aviation contributed 6 billion US dollar to the GDP (Gross Domestic
Product) of Vietnam annually. It also helped sustain more than 230 thousand jobs
from 2008 to 2013 period. Additionally, the number of air passenger in Vietnam
doubled the amount, increased by 98 percent, in the same period. Especially, in
2013, Vietnam welcomed around 4.6 million international air passengers, 80
percent of which granted over 5 billion US Dollar to the tourism of Vietnam
(Chau, 2014.)
There are 21 airports across the country. Among them, Noi Bai international
airport in Hanoi (code HAN) and Tan Son Nhat international airport in Ho Chi
Minh City (code SGN), are the two largest and busiest airports of Vietnam. The
next table shows the traffic volume of only Vietnam Airlines at Tan Son Nhat
International Airport from 2010 to 2014. Although it only shows figures of an
airline, it illustrates the dynamic picture at Tan Son Nhat airport. On top of that,
there are 41 international airlines operating at Tan Son Nhat airport (see Appendix
1 for further information) (SAA, 2015).
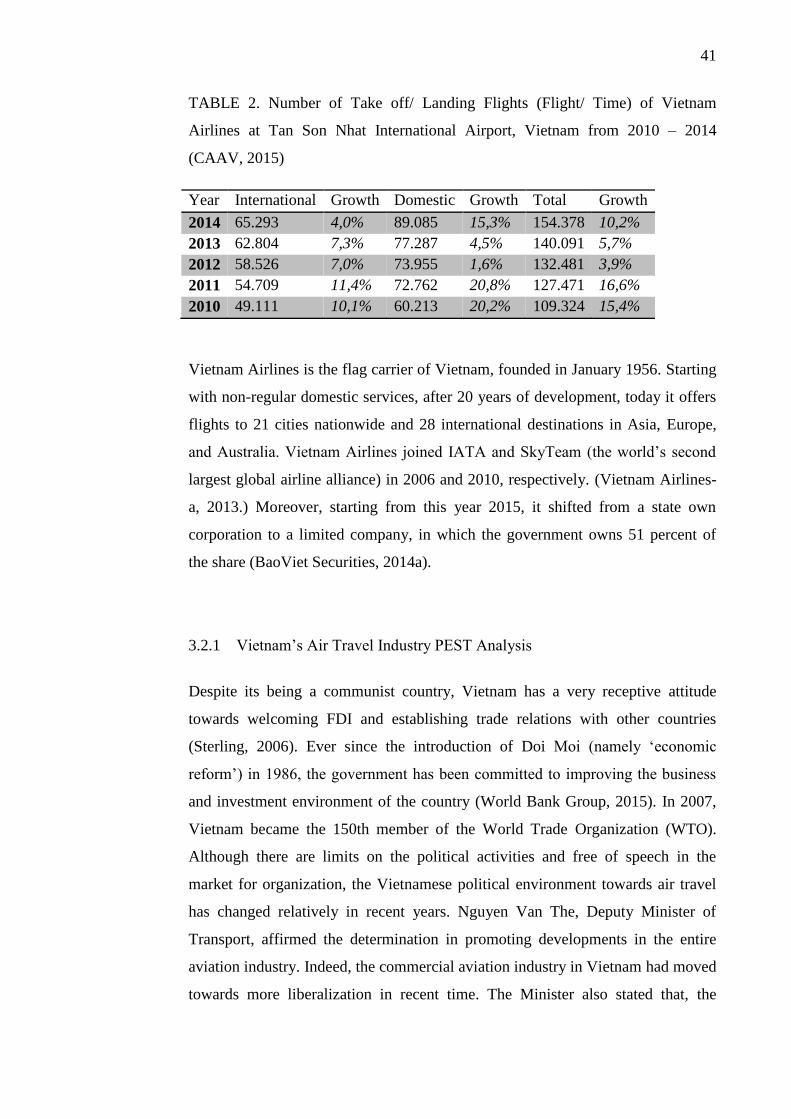
41
TABLE 2. Number of Take off/ Landing Flights (Flight/ Time) of Vietnam
Airlines at Tan Son Nhat International Airport, Vietnam from 2010 – 2014
(CAAV, 2015)
Year International Growth Domestic Growth Total Growth
2014 65.293 4,0% 89.085 15,3% 154.378 10,2%
2013 62.804 7,3% 77.287 4,5% 140.091 5,7%
2012 58.526 7,0% 73.955 1,6% 132.481 3,9%
2011 54.709 11,4% 72.762 20,8% 127.471 16,6%
2010 49.111 10,1% 60.213 20,2% 109.324 15,4%
Vietnam Airlines is the flag carrier of Vietnam, founded in January 1956. Starting
with non-regular domestic services, after 20 years of development, today it offers
flights to 21 cities nationwide and 28 international destinations in Asia, Europe,
and Australia. Vietnam Airlines joined IATA and SkyTeam (the world’s second
largest global airline alliance) in 2006 and 2010, respectively. (Vietnam Airlines-
a, 2013.) Moreover, starting from this year 2015, it shifted from a state own
corporation to a limited company, in which the government owns 51 percent of
the share (BaoViet Securities, 2014a).
3.2.1 Vietnam’s Air Travel Industry PEST Analysis
Despite its being a communist country, Vietnam has a very receptive attitude
towards welcoming FDI and establishing trade relations with other countries
(Sterling, 2006). Ever since the introduction of Doi Moi (namely ‘economic
reform’) in 1986, the government has been committed to improving the business
and investment environment of the country (World Bank Group, 2015). In 2007,
Vietnam became the 150th member of the World Trade Organization (WTO).
Although there are limits on the political activities and free of speech in the
market for organization, the Vietnamese political environment towards air travel
has changed relatively in recent years. Nguyen Van The, Deputy Minister of
Transport, affirmed the determination in promoting developments in the entire
aviation industry. Indeed, the commercial aviation industry in Vietnam had moved
towards more liberalization in recent time. The Minister also stated that, the
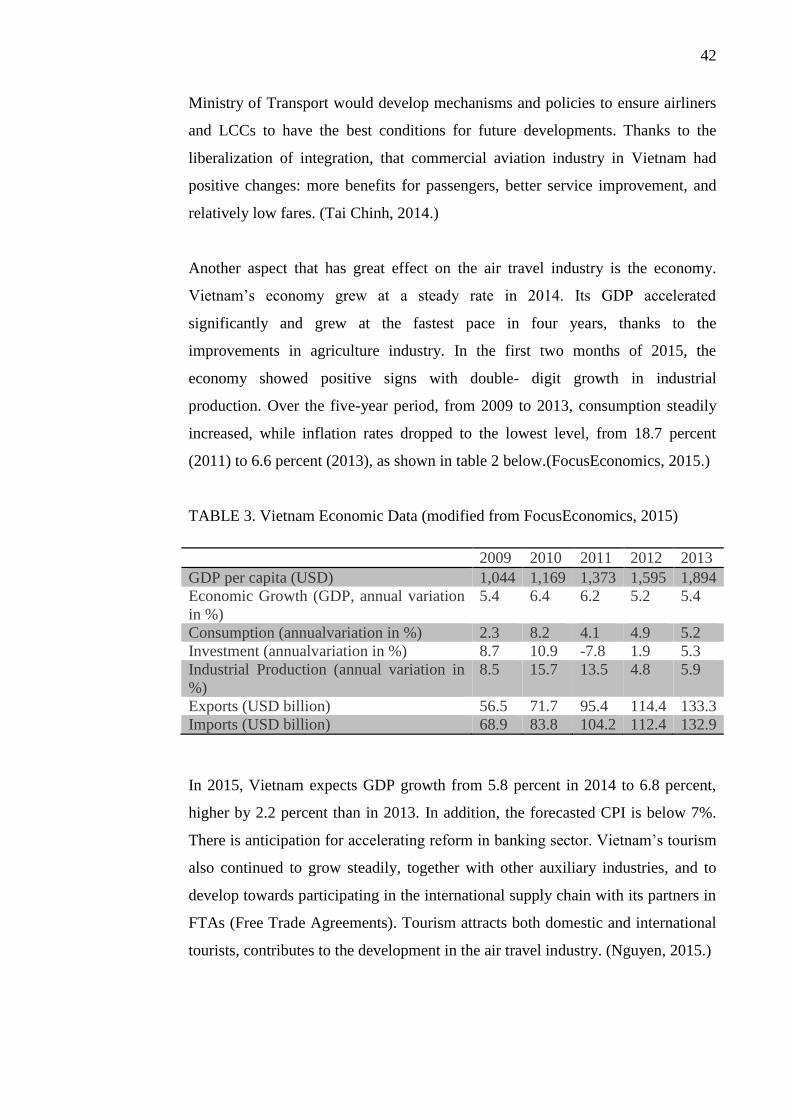
42
Ministry of Transport would develop mechanisms and policies to ensure airliners
and LCCs to have the best conditions for future developments. Thanks to the
liberalization of integration, that commercial aviation industry in Vietnam had
positive changes: more benefits for passengers, better service improvement, and
relatively low fares. (Tai Chinh, 2014.)
Another aspect that has great effect on the air travel industry is the economy.
Vietnam’s economy grew at a steady rate in 2014. Its GDP accelerated
significantly and grew at the fastest pace in four years, thanks to the
improvements in agriculture industry. In the first two months of 2015, the
economy showed positive signs with double- digit growth in industrial
production. Over the five-year period, from 2009 to 2013, consumption steadily
increased, while inflation rates dropped to the lowest level, from 18.7 percent
(2011) to 6.6 percent (2013), as shown in table 2 below.(FocusEconomics, 2015.)
TABLE 3. Vietnam Economic Data (modified from FocusEconomics, 2015)
2009 2010 2011 2012 2013
GDP per capita (USD) 1,044 1,169 1,373 1,595 1,894
Economic Growth (GDP, annual variation
in %)
5.4 6.4 6.2 5.2 5.4
Consumption (annualvariation in %) 2.3 8.2 4.1 4.9 5.2
Investment (annualvariation in %) 8.7 10.9 -7.8 1.9 5.3
Industrial Production (annual variation in
%)
8.5 15.7 13.5 4.8 5.9
Exports (USD billion) 56.5 71.7 95.4 114.4 133.3
Imports (USD billion) 68.9 83.8 104.2 112.4 132.9
In 2015, Vietnam expects GDP growth from 5.8 percent in 2014 to 6.8 percent,
higher by 2.2 percent than in 2013. In addition, the forecasted CPI is below 7%.
There is anticipation for accelerating reform in banking sector. Vietnam’s tourism
also continued to grow steadily, together with other auxiliary industries, and to
develop towards participating in the international supply chain with its partners in
FTAs (Free Trade Agreements). Tourism attracts both domestic and international
tourists, contributes to the development in the air travel industry. (Nguyen, 2015.)
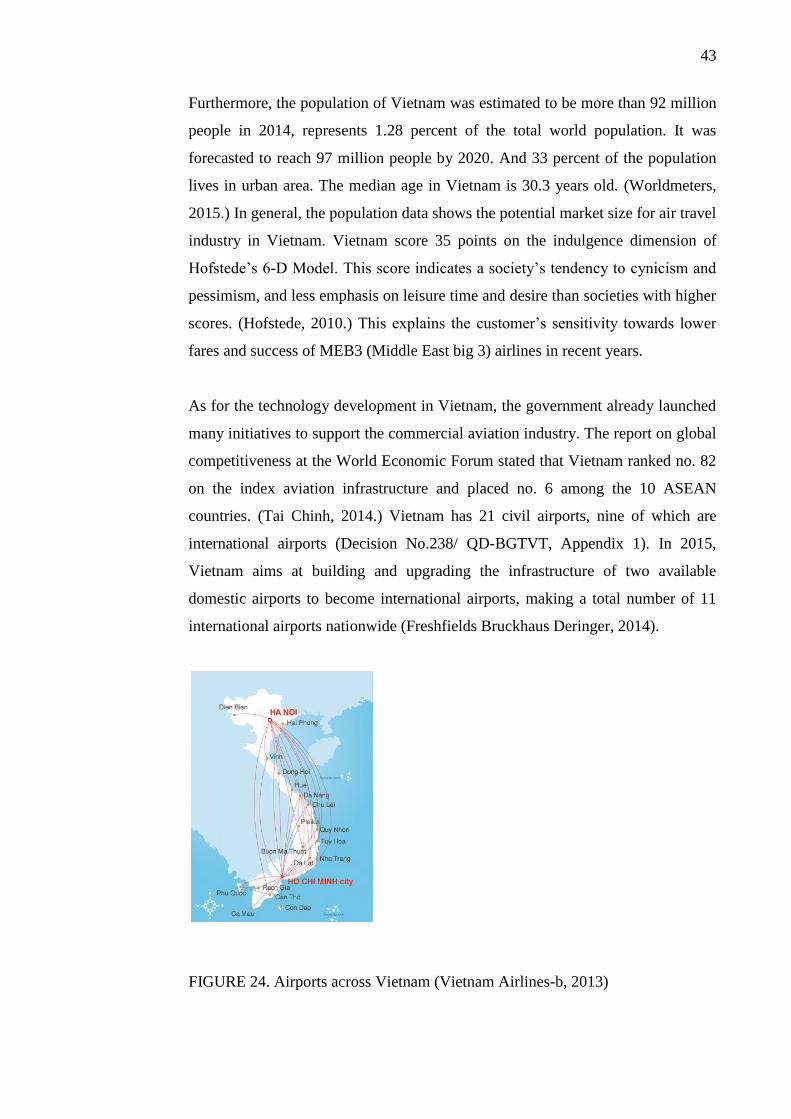
43
Furthermore, the population of Vietnam was estimated to be more than 92 million
people in 2014, represents 1.28 percent of the total world population. It was
forecasted to reach 97 million people by 2020. And 33 percent of the population
lives in urban area. The median age in Vietnam is 30.3 years old. (Worldmeters,
2015.) In general, the population data shows the potential market size for air travel
industry in Vietnam. Vietnam score 35 points on the indulgence dimension of
Hofstede’s 6-D Model. This score indicates a society’s tendency to cynicism and
pessimism, and less emphasis on leisure time and desire than societies with higher
scores. (Hofstede, 2010.) This explains the customer’s sensitivity towards lower
fares and success of MEB3 (Middle East big 3) airlines in recent years.
As for the technology development in Vietnam, the government already launched
many initiatives to support the commercial aviation industry. The report on global
competitiveness at the World Economic Forum stated that Vietnam ranked no. 82
on the index aviation infrastructure and placed no. 6 among the 10 ASEAN
countries. (Tai Chinh, 2014.) Vietnam has 21 civil airports, nine of which are
international airports (Decision No.238/ QD-BGTVT, Appendix 1). In 2015,
Vietnam aims at building and upgrading the infrastructure of two available
domestic airports to become international airports, making a total number of 11
international airports nationwide (Freshfields Bruckhaus Deringer, 2014).
FIGURE 24. Airports across Vietnam (Vietnam Airlines-b, 2013)
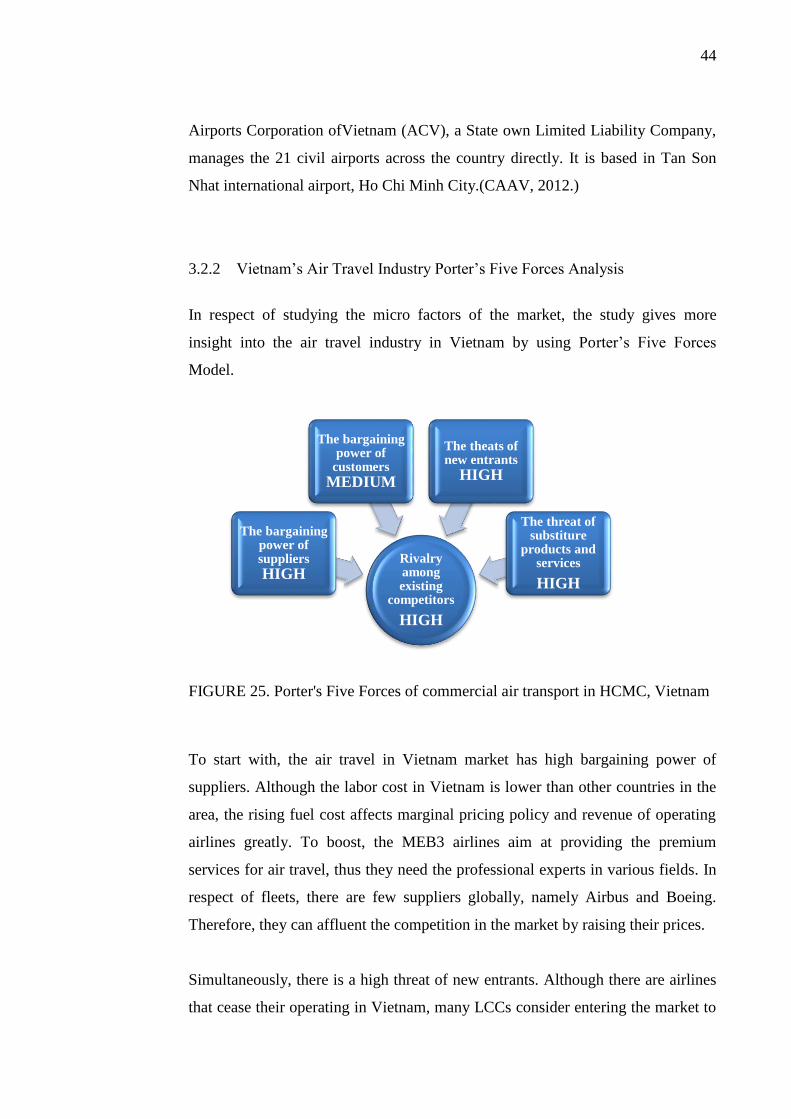
44
Airports Corporation ofVietnam (ACV), a State own Limited Liability Company,
manages the 21 civil airports across the country directly. It is based in Tan Son
Nhat international airport, Ho Chi Minh City.(CAAV, 2012.)
3.2.2 Vietnam’s Air Travel Industry Porter’s Five Forces Analysis
In respect of studying the micro factors of the market, the study gives more
insight into the air travel industry in Vietnam by using Porter’s Five Forces
Model.
FIGURE 25. Porter's Five Forces of commercial air transport in HCMC, Vietnam
To start with, the air travel in Vietnam market has high bargaining power of
suppliers. Although the labor cost in Vietnam is lower than other countries in the
area, the rising fuel cost affects marginal pricing policy and revenue of operating
airlines greatly. To boost, the MEB3 airlines aim at providing the premium
services for air travel, thus they need the professional experts in various fields. In
respect of fleets, there are few suppliers globally, namely Airbus and Boeing.
Therefore, they can affluent the competition in the market by raising their prices.
Simultaneously, there is a high threat of new entrants. Although there are airlines
that cease their operating in Vietnam, many LCCs consider entering the market to
Rivalry among existing
competitors
HIGH
The bargaining power of suppliers
HIGH
The bargaining power of
customers
MEDIUM
The theats of new entrants
HIGH
The threat of substiture
products and services
HIGH
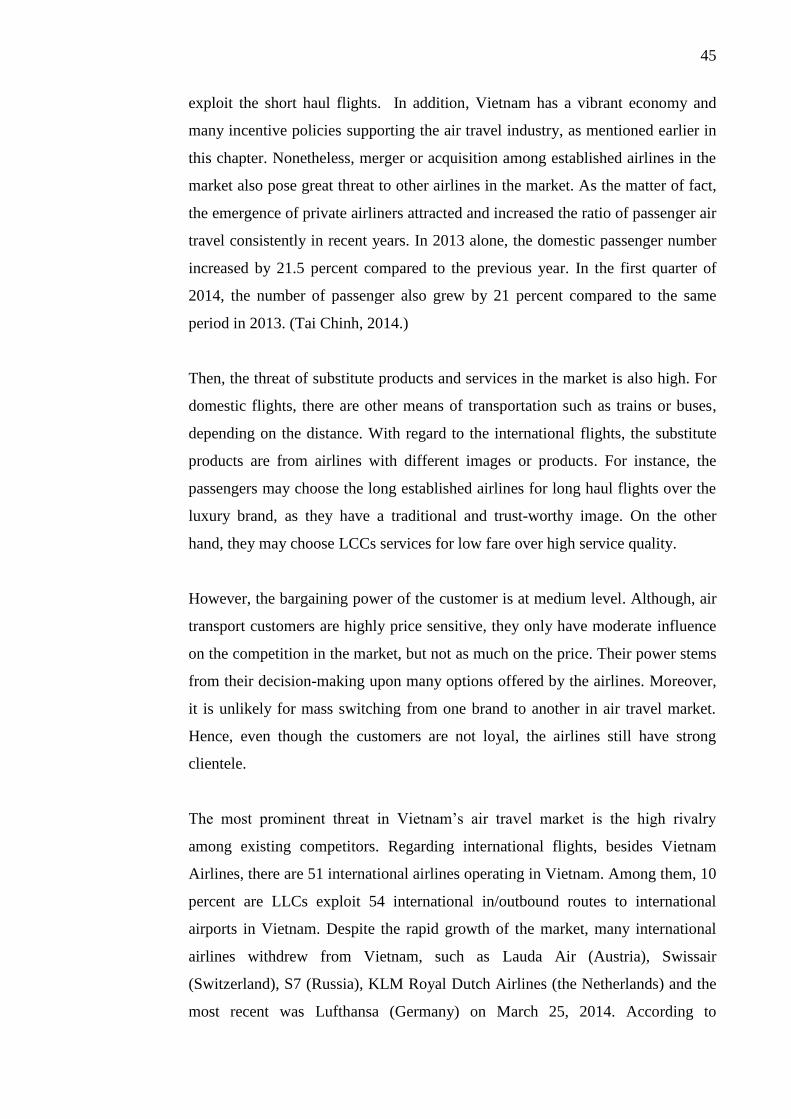
45
exploit the short haul flights. In addition, Vietnam has a vibrant economy and
many incentive policies supporting the air travel industry, as mentioned earlier in
this chapter. Nonetheless, merger or acquisition among established airlines in the
market also pose great threat to other airlines in the market. As the matter of fact,
the emergence of private airliners attracted and increased the ratio of passenger air
travel consistently in recent years. In 2013 alone, the domestic passenger number
increased by 21.5 percent compared to the previous year. In the first quarter of
2014, the number of passenger also grew by 21 percent compared to the same
period in 2013. (Tai Chinh, 2014.)
Then, the threat of substitute products and services in the market is also high. For
domestic flights, there are other means of transportation such as trains or buses,
depending on the distance. With regard to the international flights, the substitute
products are from airlines with different images or products. For instance, the
passengers may choose the long established airlines for long haul flights over the
luxury brand, as they have a traditional and trust-worthy image. On the other
hand, they may choose LCCs services for low fare over high service quality.
However, the bargaining power of the customer is at medium level. Although, air
transport customers are highly price sensitive, they only have moderate influence
on the competition in the market, but not as much on the price. Their power stems
from their decision-making upon many options offered by the airlines. Moreover,
it is unlikely for mass switching from one brand to another in air travel market.
Hence, even though the customers are not loyal, the airlines still have strong
clientele.
The most prominent threat in Vietnam’s air travel market is the high rivalry
among existing competitors. Regarding international flights, besides Vietnam
Airlines, there are 51 international airlines operating in Vietnam. Among them, 10
percent are LLCs exploit 54 international in/outbound routes to international
airports in Vietnam. Despite the rapid growth of the market, many international
airlines withdrew from Vietnam, such as Lauda Air (Austria), Swissair
(Switzerland), S7 (Russia), KLM Royal Dutch Airlines (the Netherlands) and the
most recent was Lufthansa (Germany) on March 25, 2014. According to
46
Lufthansa’s representative, the main reason was the relatively low fare offers on
the same routes of airlines from the Middle East. Prior to that, KML Airlines
ceased its activities in Vietnam after 5 year operating but inefficiently, leaving its
strategic alliances Air France as the sole representative in Vietnam. On the
contrary, airlines from the Middle East, such as Emirates, Etihad Airways, and
Qatar Airways certainly have the upper hands in the market. Industry specialists
call them MEB3, which means Middle East Big 3. They have put more pressure
on other airlines in 2014, by establishing 21 new fly routes, including seven routes
to European countries, six routes to North America, three to Asian destinations,
three to Middle East countries, and two to Africa. However, the three said airlines
also compete fiercely among themselves. (BaoViet Securities, 2014b.)
This chapter discusses the history of global commercial aviation industry, which
ultimately draws out these following characteristics: it is an extremely capital
intensive business, and one of the most regulated modes of transport that
gradually move forward to liberalisation, as well as it is tightly linked with
economic growth and highly sensitive with political instability. Then, the forecast
of being high growth and dynamic industry of air travel is also stated. The
concerns for its future outlook involve the big three challenges of safety,
passenger experience and sustainable development both financially and
enviromentally. Next, the thesis narrows down to air travel in Vietnam, in which a
detailed PEST and Porter’s Five Forces analysis of the industry are examined.The
next chapter gives detailed analysis regarding Eithad Airways, as well as
introduction of its direct competitors.
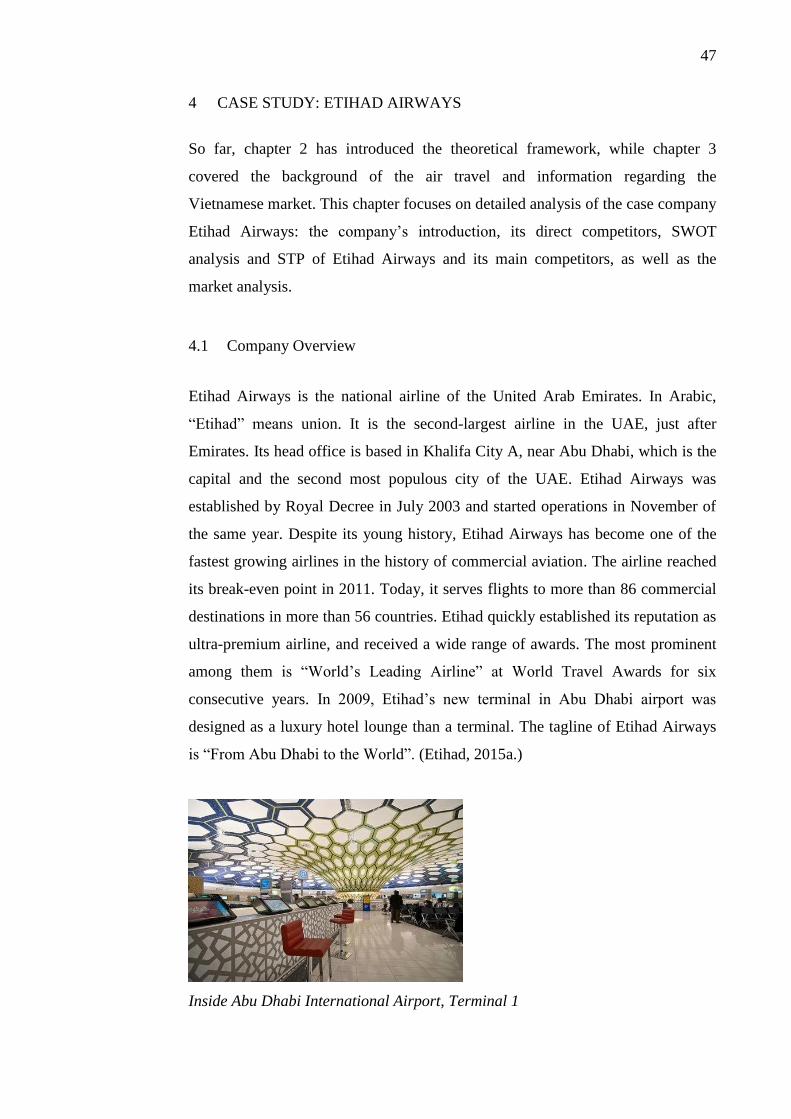
47
4 CASE STUDY: ETIHAD AIRWAYS
So far, chapter 2 has introduced the theoretical framework, while chapter 3
covered the background of the air travel and information regarding the
Vietnamese market. This chapter focuses on detailed analysis of the case company
Etihad Airways: the company’s introduction, its direct competitors, SWOT
analysis and STP of Etihad Airways and its main competitors, as well as the
market analysis.
4.1 Company Overview
Etihad Airways is the national airline of the United Arab Emirates. In Arabic,
“Etihad” means union. It is the second-largest airline in the UAE, just after
Emirates. Its head office is based in Khalifa City A, near Abu Dhabi, which is the
capital and the second most populous city of the UAE. Etihad Airways was
established by Royal Decree in July 2003 and started operations in November of
the same year. Despite its young history, Etihad Airways has become one of the
fastest growing airlines in the history of commercial aviation. The airline reached
its break-even point in 2011. Today, it serves flights to more than 86 commercial
destinations in more than 56 countries. Etihad quickly established its reputation as
ultra-premium airline, and received a wide range of awards. The most prominent
among them is “World’s Leading Airline” at World Travel Awards for six
consecutive years. In 2009, Etihad’s new terminal in Abu Dhabi airport was
designed as a luxury hotel lounge than a terminal. The tagline of Etihad Airways
is “From Abu Dhabi to the World”. (Etihad, 2015a.)
Inside Abu Dhabi International Airport, Terminal 1
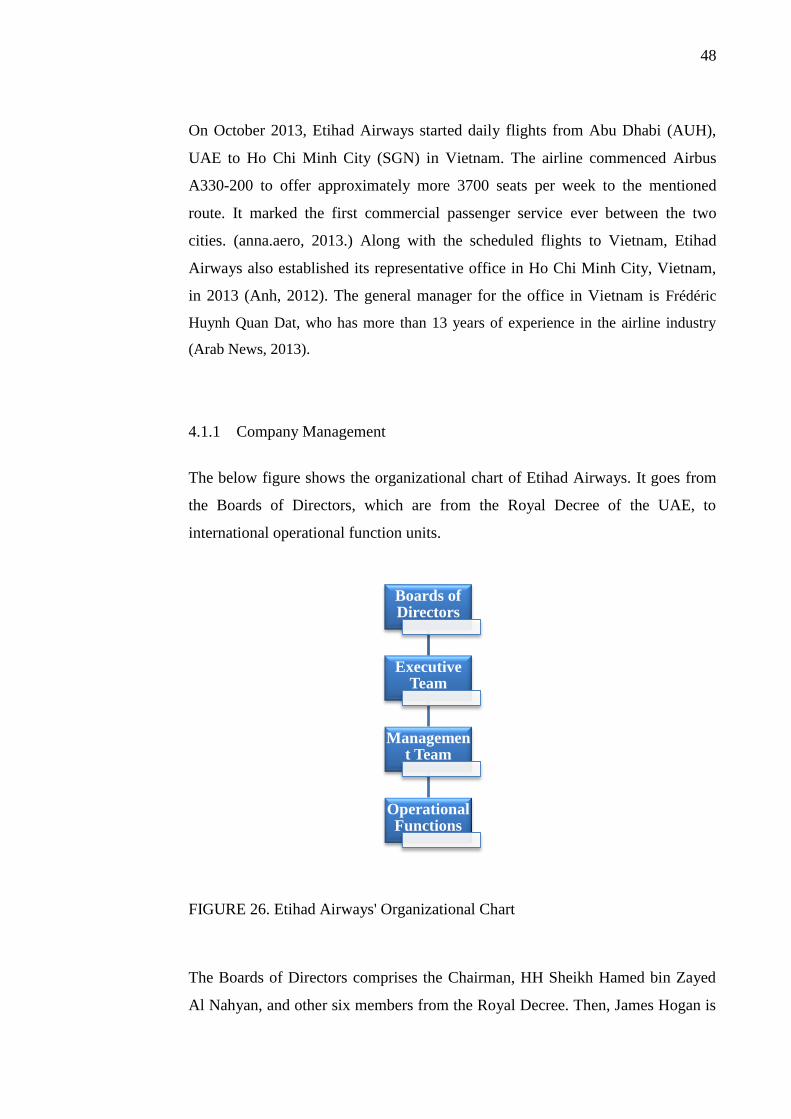
48
On October 2013, Etihad Airways started daily flights from Abu Dhabi (AUH),
UAE to Ho Chi Minh City (SGN) in Vietnam. The airline commenced Airbus
A330-200 to offer approximately more 3700 seats per week to the mentioned
route. It marked the first commercial passenger service ever between the two
cities. (anna.aero, 2013.) Along with the scheduled flights to Vietnam, Etihad
Airways also established its representative office in Ho Chi Minh City, Vietnam,
in 2013 (Anh, 2012). The general manager for the office in Vietnam is Frédéric
Huynh Quan Dat, who has more than 13 years of experience in the airline industry
(Arab News, 2013).
4.1.1 Company Management
The below figure shows the organizational chart of Etihad Airways. It goes from
the Boards of Directors, which are from the Royal Decree of the UAE, to
international operational function units.
FIGURE 26. Etihad Airways' Organizational Chart
The Boards of Directors comprises the Chairman, HH Sheikh Hamed bin Zayed
Al Nahyan, and other six members from the Royal Decree. Then, James Hogan is
Boards of Directors
Executive Team
Management Team
Operational Functions
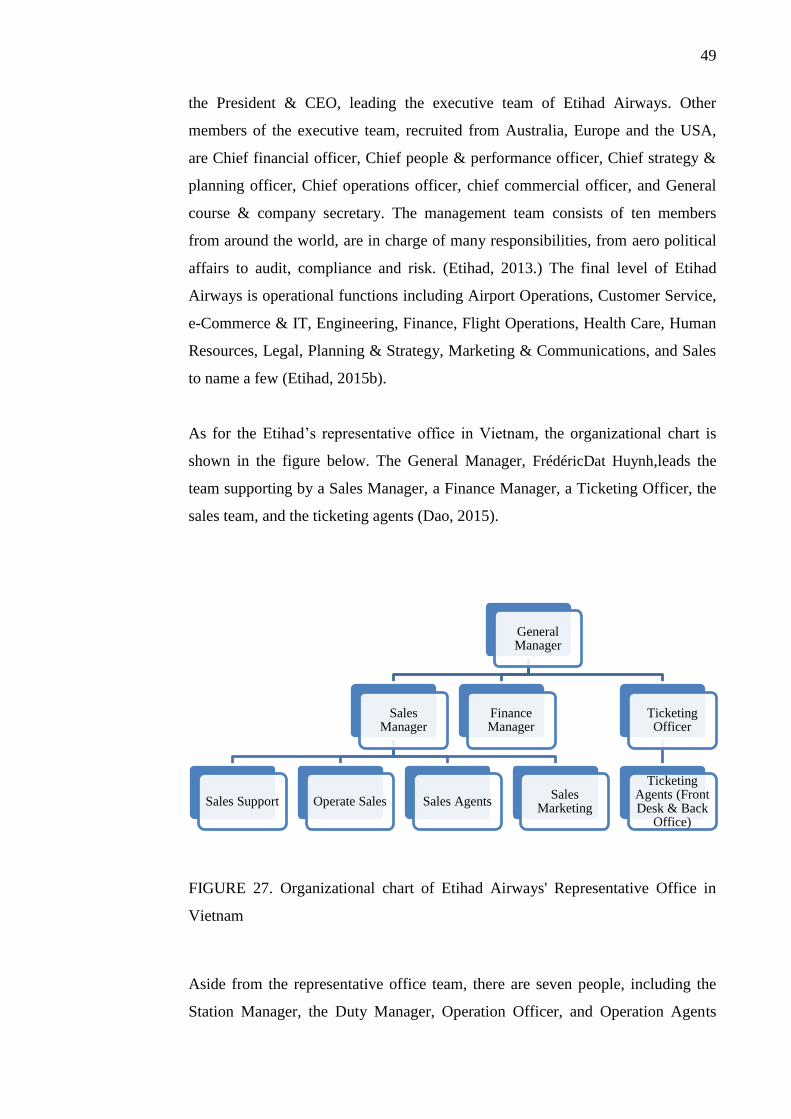
49
the President & CEO, leading the executive team of Etihad Airways. Other
members of the executive team, recruited from Australia, Europe and the USA,
are Chief financial officer, Chief people & performance officer, Chief strategy &
planning officer, Chief operations officer, chief commercial officer, and General
course & company secretary. The management team consists of ten members
from around the world, are in charge of many responsibilities, from aero political
affairs to audit, compliance and risk. (Etihad, 2013.) The final level of Etihad
Airways is operational functions including Airport Operations, Customer Service,
e-Commerce & IT, Engineering, Finance, Flight Operations, Health Care, Human
Resources, Legal, Planning & Strategy, Marketing & Communications, and Sales
to name a few (Etihad, 2015b).
As for the Etihad’s representative office in Vietnam, the organizational chart is
shown in the figure below. The General Manager, FrédéricDat Huynh,leads the
team supporting by a Sales Manager, a Finance Manager, a Ticketing Officer, the
sales team, and the ticketing agents (Dao, 2015).
FIGURE 27. Organizational chart of Etihad Airways' Representative Office in
Vietnam
Aside from the representative office team, there are seven people, including the
Station Manager, the Duty Manager, Operation Officer, and Operation Agents
General Manager
Sales Manager
Sales Support Operate Sales Sales AgentsSales
Marketing
Finance Manager
Ticketing Officer
Ticketing Agents (Front Desk & Back
Office)
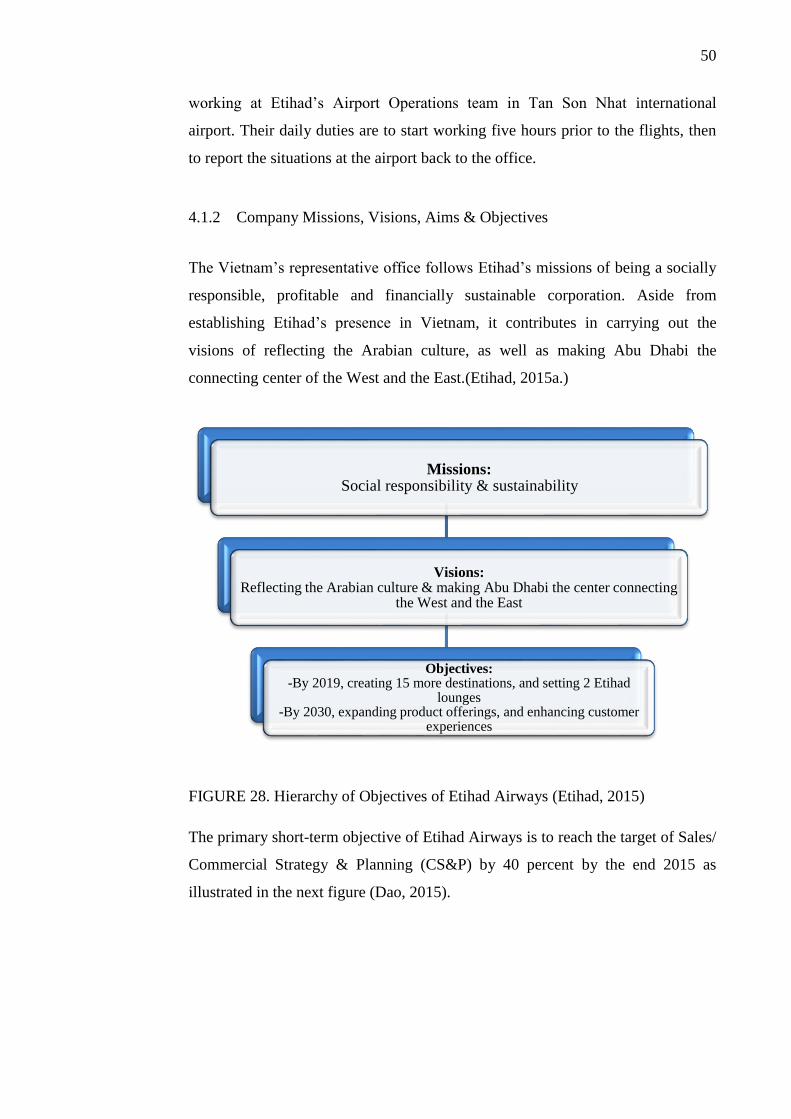
50
working at Etihad’s Airport Operations team in Tan Son Nhat international
airport. Their daily duties are to start working five hours prior to the flights, then
to report the situations at the airport back to the office.
4.1.2 Company Missions, Visions, Aims & Objectives
The Vietnam’s representative office follows Etihad’s missions of being a socially
responsible, profitable and financially sustainable corporation. Aside from
establishing Etihad’s presence in Vietnam, it contributes in carrying out the
visions of reflecting the Arabian culture, as well as making Abu Dhabi the
connecting center of the West and the East.(Etihad, 2015a.)
FIGURE 28. Hierarchy of Objectives of Etihad Airways (Etihad, 2015)
The primary short-term objective of Etihad Airways is to reach the target of Sales/
Commercial Strategy & Planning (CS&P) by 40 percent by the end 2015 as
illustrated in the next figure (Dao, 2015).
Missions:Social responsibility & sustainability
Visions: Reflecting the Arabian culture & making Abu Dhabi the center connecting
the West and the East
Objectives: -By 2019, creating 15 more destinations, and setting 2 Etihad
lounges-By 2030, expanding product offerings, and enhancing customer
experiences
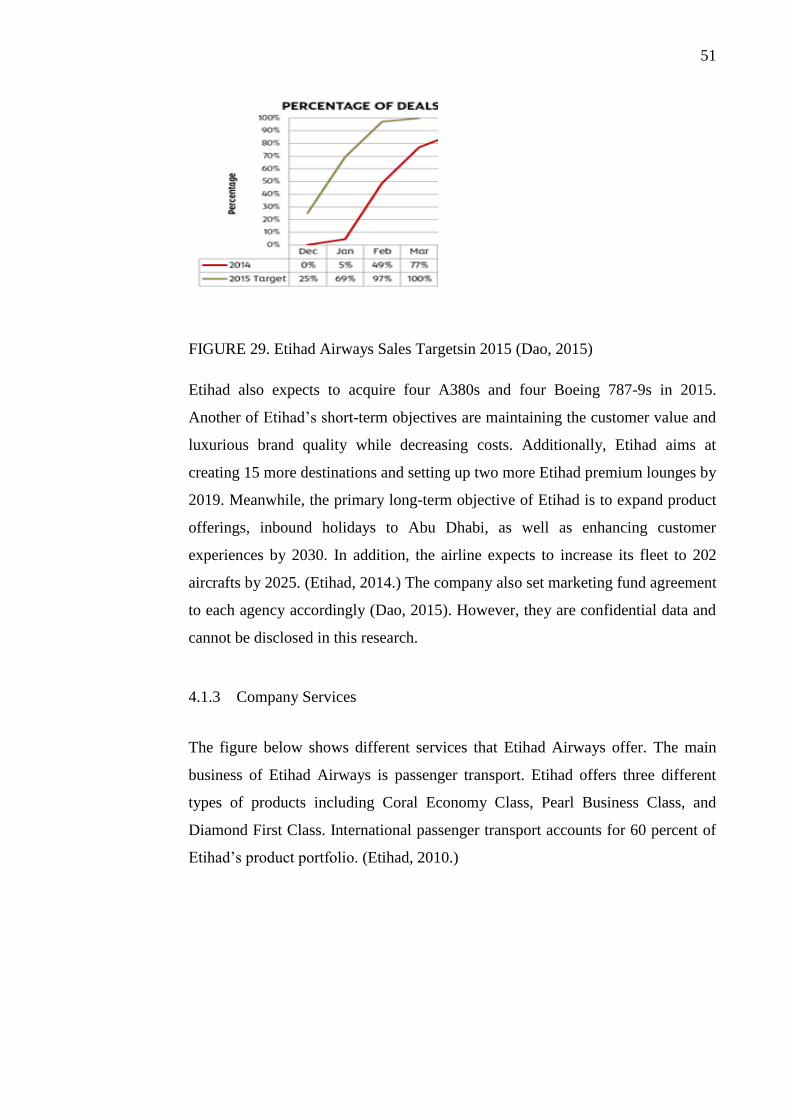
51
FIGURE 29. Etihad Airways Sales Targetsin 2015 (Dao, 2015)
Etihad also expects to acquire four A380s and four Boeing 787-9s in 2015.
Another of Etihad’s short-term objectives are maintaining the customer value and
luxurious brand quality while decreasing costs. Additionally, Etihad aims at
creating 15 more destinations and setting up two more Etihad premium lounges by
2019. Meanwhile, the primary long-term objective of Etihad is to expand product
offerings, inbound holidays to Abu Dhabi, as well as enhancing customer
experiences by 2030. In addition, the airline expects to increase its fleet to 202
aircrafts by 2025. (Etihad, 2014.) The company also set marketing fund agreement
to each agency accordingly (Dao, 2015). However, they are confidential data and
cannot be disclosed in this research.
4.1.3 Company Services
The figure below shows different services that Etihad Airways offer. The main
business of Etihad Airways is passenger transport. Etihad offers three different
types of products including Coral Economy Class, Pearl Business Class, and
Diamond First Class. International passenger transport accounts for 60 percent of
Etihad’s product portfolio. (Etihad, 2010.)
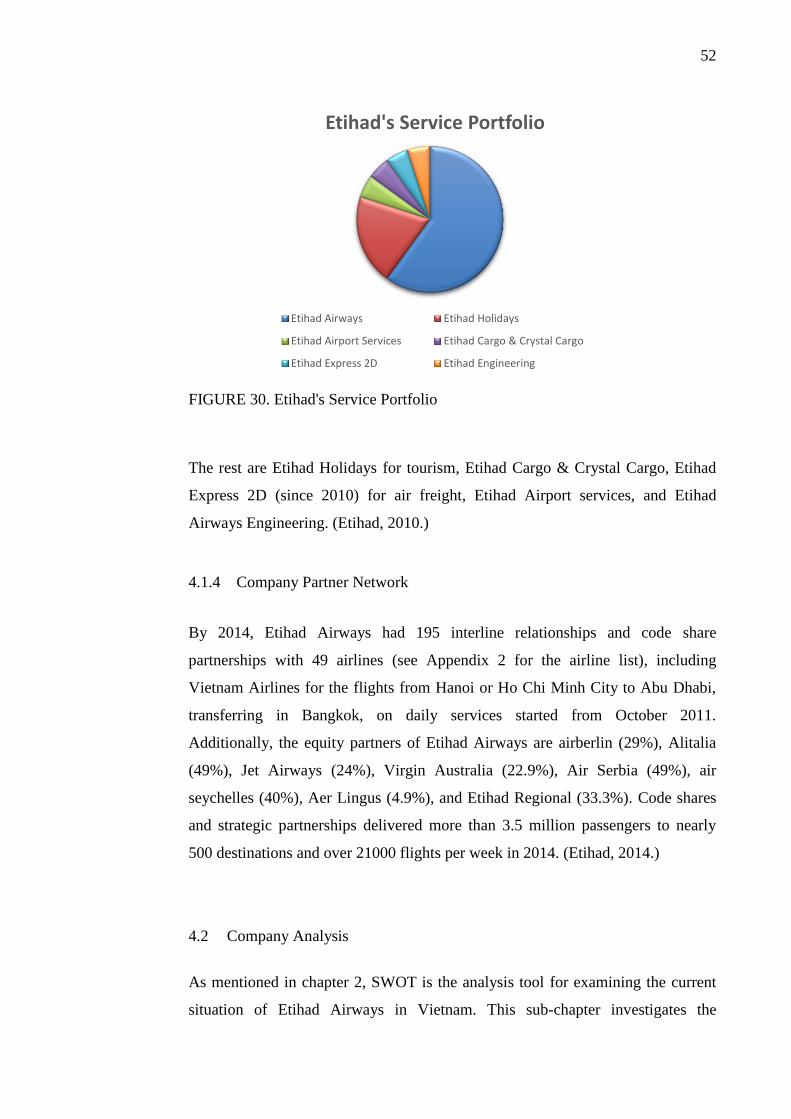
52
FIGURE 30. Etihad's Service Portfolio
The rest are Etihad Holidays for tourism, Etihad Cargo & Crystal Cargo, Etihad
Express 2D (since 2010) for air freight, Etihad Airport services, and Etihad
Airways Engineering. (Etihad, 2010.)
4.1.4 Company Partner Network
By 2014, Etihad Airways had 195 interline relationships and code share
partnerships with 49 airlines (see Appendix 2 for the airline list), including
Vietnam Airlines for the flights from Hanoi or Ho Chi Minh City to Abu Dhabi,
transferring in Bangkok, on daily services started from October 2011.
Additionally, the equity partners of Etihad Airways are airberlin (29%), Alitalia
(49%), Jet Airways (24%), Virgin Australia (22.9%), Air Serbia (49%), air
seychelles (40%), Aer Lingus (4.9%), and Etihad Regional (33.3%). Code shares
and strategic partnerships delivered more than 3.5 million passengers to nearly
500 destinations and over 21000 flights per week in 2014. (Etihad, 2014.)
4.2 Company Analysis
As mentioned in chapter 2, SWOT is the analysis tool for examining the current
situation of Etihad Airways in Vietnam. This sub-chapter investigates the
Etihad's Service Portfolio
Etihad Airways Etihad Holidays
Etihad Airport Services Etihad Cargo & Crystal Cargo
Etihad Express 2D Etihad Engineering
53
strengths, weaknesses, opportunities, as well as threats exposed to Etihad Airways
generally, and specifically in Vietnam.
The greatest advantage of Etihad is that the company has strong support from the
Abu Dhabi Government. The UAE has its own benefit of being one of the oil rich
countries. Also, Etihad Airways has over 5000 flights per week over 56 countries
worldwide. It also has good branding and visibility on the international market as
it actively sponsors many prominent events, such as F1 Etihad Airways Abu
Dhabi Grand Prix, Manchester City Footbal Club, and 2013 Events Washington
DC’s Nation’s Triathlonand Tri Yas to name a few. In Vietnam, it established a
strong codeshare parnership with Vietnam Airlines. (Etihad, 2015.)
However, there are critical weaknesses that Etihad Airways should take into
account. Although Etihad offers lower fares than its competitors Emirates and
Qatar Airways, it still is perceived as an expensive brand by the Vietnamese
customers due to its luxury airline image. In addition, the brand awareness in
Vietnam is weak, not many Vietnameses can recognize the airline when
mentioned. Another weakness is the long connectivity between New York (JFK)
and Washington D.C (IAD) as it affects the key corporate traffic. (Dao, 2015.)
There many opportunites for Etihad Airways. Thanks to its being a young airline,
Etihad Airways has new aircrafts to offer. Also, Etihad plans to capitalize new
destinations on EY network worldwide. Moreover, the airline intents to establish
tight relationships with airports to offer premium facilities to its passengers to
improve premium share, as well as gainning customers’ confidence in the brand.
(Dao,2015.)
Still, the airline should keep watch for the intense and increasing competition in
the Middle Eastern market.Especially the entrants of the LCCs would pressure
Etihad Airways to come up with counter plans. Additionally, there were an
increasing cost of fuel, changes in international aviation regulations and local
government policies in 2014. (Dao, 2015.)
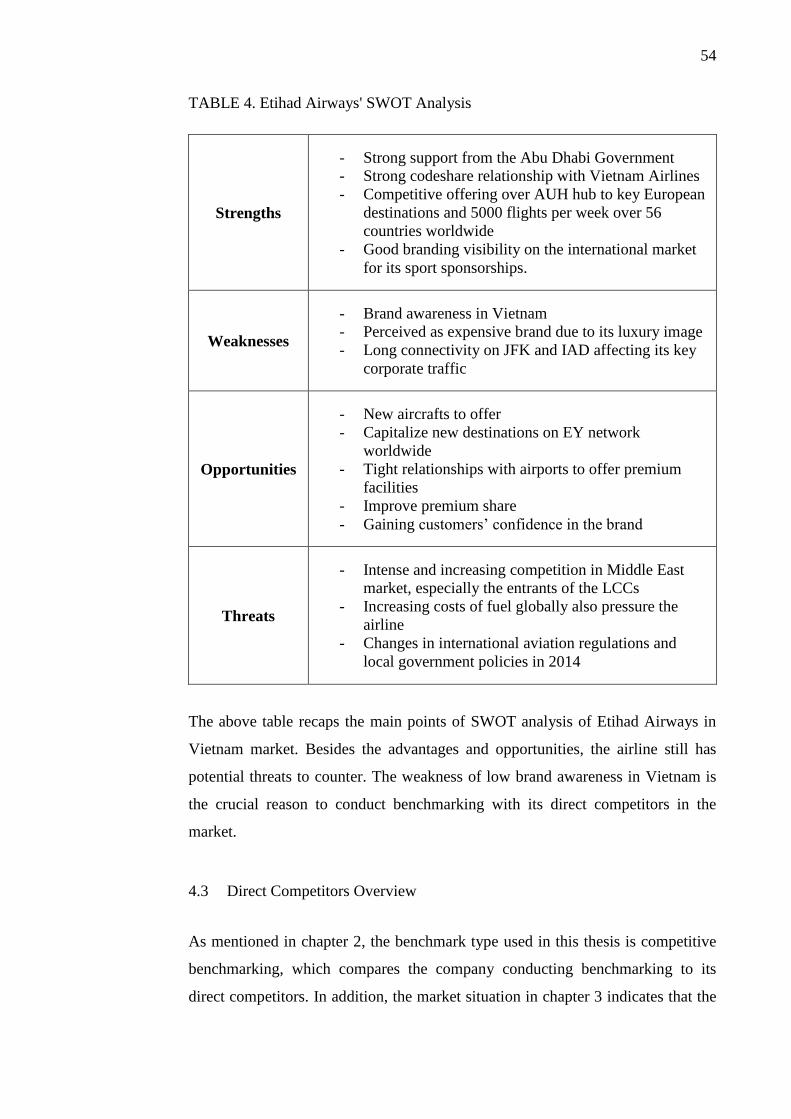
54
TABLE 4. Etihad Airways' SWOT Analysis
Strengths
- Strong support from the Abu Dhabi Government
- Strong codeshare relationship with Vietnam Airlines
- Competitive offering over AUH hub to key European
destinations and 5000 flights per week over 56
countries worldwide
- Good branding visibility on the international market
for its sport sponsorships.
Weaknesses
- Brand awareness in Vietnam
- Perceived as expensive brand due to its luxury image
- Long connectivity on JFK and IAD affecting its key
corporate traffic
Opportunities
- New aircrafts to offer
- Capitalize new destinations on EY network
worldwide
- Tight relationships with airports to offer premium
facilities
- Improve premium share
- Gaining customers’ confidence in the brand
Threats
- Intense and increasing competition in Middle East
market, especially the entrants of the LCCs
- Increasing costs of fuel globally also pressure the
airline
- Changes in international aviation regulations and
local government policies in 2014
The above table recaps the main points of SWOT analysis of Etihad Airways in
Vietnam market. Besides the advantages and opportunities, the airline still has
potential threats to counter. The weakness of low brand awareness in Vietnam is
the crucial reason to conduct benchmarking with its direct competitors in the
market.
4.3 Direct Competitors Overview
As mentioned in chapter 2, the benchmark type used in this thesis is competitive
benchmarking, which compares the company conducting benchmarking to its
direct competitors. In addition, the market situation in chapter 3 indicates that the
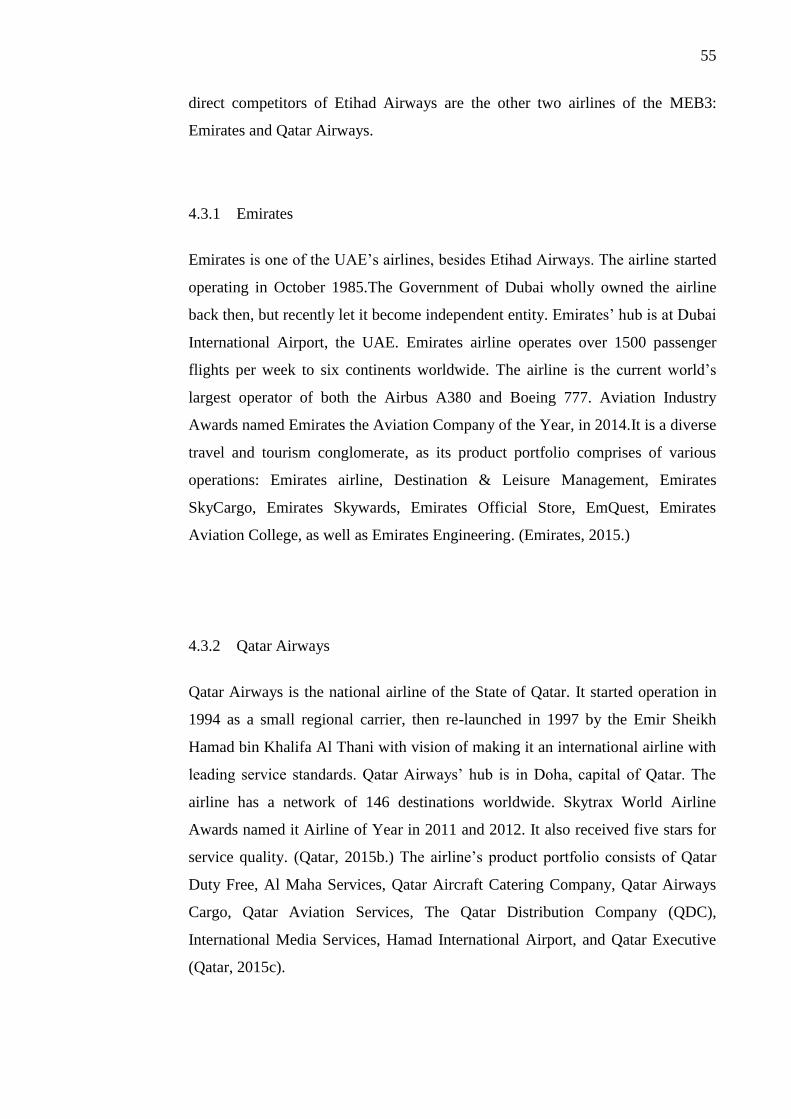
55
direct competitors of Etihad Airways are the other two airlines of the MEB3:
Emirates and Qatar Airways.
4.3.1 Emirates
Emirates is one of the UAE’s airlines, besides Etihad Airways. The airline started
operating in October 1985.The Government of Dubai wholly owned the airline
back then, but recently let it become independent entity. Emirates’ hub is at Dubai
International Airport, the UAE. Emirates airline operates over 1500 passenger
flights per week to six continents worldwide. The airline is the current world’s
largest operator of both the Airbus A380 and Boeing 777. Aviation Industry
Awards named Emirates the Aviation Company of the Year, in 2014.It is a diverse
travel and tourism conglomerate, as its product portfolio comprises of various
operations: Emirates airline, Destination & Leisure Management, Emirates
SkyCargo, Emirates Skywards, Emirates Official Store, EmQuest, Emirates
Aviation College, as well as Emirates Engineering. (Emirates, 2015.)
4.3.2 Qatar Airways
Qatar Airways is the national airline of the State of Qatar. It started operation in
1994 as a small regional carrier, then re-launched in 1997 by the Emir Sheikh
Hamad bin Khalifa Al Thani with vision of making it an international airline with
leading service standards. Qatar Airways’ hub is in Doha, capital of Qatar. The
airline has a network of 146 destinations worldwide. Skytrax World Airline
Awards named it Airline of Year in 2011 and 2012. It also received five stars for
service quality. (Qatar, 2015b.) The airline’s product portfolio consists of Qatar
Duty Free, Al Maha Services, Qatar Aircraft Catering Company, Qatar Airways
Cargo, Qatar Aviation Services, The Qatar Distribution Company (QDC),
International Media Services, Hamad International Airport, and Qatar Executive
(Qatar, 2015c).
56
5 EMPIRICAL RESEARCH & ANALYSIS
This chapter covers the empirical research process of this thesis. The first sub-
chapter describes the purposes and the process of collecting both primary and
secondary data through different methods including desk study, survey, and
interviews. Subsequently, the latter sub-chapter focuses on analyzing the collected
data.
5.1 Data Acquisition Process
The following Gantt chart of data acquisition process is the holistic view for the
whole process of collecting both primary and secondary source of this thesis.
TABLE 5. Gantt chart of Data Acquisition Process
Task name Q1 2015
Dec 2014
Jan 2015
Feb 2015
March 2015
April 2015
Desk research X X X
Design interview questions &modify
questionnaire
X X
Launch survey & conduct
interviews X X
Data analysis & results
X
Generally, the process consists of three main phases: desk study, interview, and
survey. Then, they break into smaller tasks: desk research, designing the question
layout for the interviews & the survey questionnaire, launching the survey &
conduct the interviews, as well as analyzing the data & finalizing the results. The
next three sub-chapters explain the objectives and fashion of each phase.
57
The desk study part is the start of the analysis stage of benchmarking. The goal of
this thesis is to find the benchmarks for marketing activities of Etihad Airways to
improve its brand awareness in Vietnam. Thus, this process concerns finding the
data from public domains regarding the marketing strategies of Etihad Airways,
Emirates, and Qatar Airways, in order to make comparisons between them. The
aim is to confirm whether Emirates and Qatar Airways are indeed the direct
competitors of Etihad Airways in Vietnam, by comparing their STPs
(Segmenting, Targeting, and Positioning) as introduced in chapter 2, sub-chapter
Strategies. The factors for segmenting concern benefit sought, purchase occasion,
purchase behavior, usage, buyer readiness stage, and attitude towards the product.
Those factors are to compare how the three companies define their market
segments and if they have the same target groups. Then, this phase also defines
the targeting strategies of each company. In addition, a positioning map of Etihad
Airways, Emirates, and Qatar Airways in Vietnam market is included for
preliminary assessment of their positions in the competition among them.
This phase started in early December 2014 and lasted until the end of February
2015. The data came from public domains, such as press releases on the websites
of the airlines, other electronic sources, as well as internal sources from the airline
representatives. As the thesis concerns the marketing strategies in Vietnam
market, the author had to contact the MEB3’s representatives in Vietnam for more
specific strategic information.
After confirming that Emirates and Qatar Airways are the right benchmarkees for
Etihad Airways, the interview phase is to affirm the findings on their marketing
strategies from the desk study. As the information regarding the marketing
activities of the MEB3 in Vietnam market are scarce or from non-academic
sources, this step is essential for the study. Generally, there are three types of
interviews, which are structured interviews, semi-structured interviews, as well as
unstructured or in-depth interviews. Structured interviews used standardized and
identical questions for all the interviewees, while semi-structured interviews
covers a list of themes and the interviewer can omit or add more questions
depending on the case. Meanwhile, unstructured interviews are for general topics,
where there is no set list of questions and the interviewee has the opportunity to
58
talk freely. Depending on either the purpose of the research, significance of
establishing personal contact or the nature of the questions, the interviewer
decides the suitable type for the interviews. (Saunders et. al, 2012, 320-321.)
The interviews in this study are semi-structured interviews, which benefit for
open-ended questions (Easterby-Smith et. al2008, according to Saunders et. al,
2012, 324). This type of question allows the participants to describe the situation
and provide extensive answers (Saunders et. al, 2012, 337). Once again, this study
focuses on marketing strategy benchmarks for Vietnam market, thus the interview
questions concentrate on such topic. The framework for the interviews is the 4Ps
of marketing mix: Place, Product, Price, and Promotion. The following is the
frame for the interviews with the representatives from Etihad Airways, Emirates,
and Qatar Airways in Vietnam. The actual questions slightly vary for different
interviewees according to their position in the company (back office or cabin
crew).
What are the main target groups of the company in Vietnam?
What are the methods of the company to approach the target groups and
raise brand awareness among them?
What are the competitive advantages of the company in the Vietnamese
market?
In total, there are six interviews with the representatives from the back office, as
well as the cabin crew of Etihad Airways, Qatar Airways, and Emirates in
Vietnam. As mentioned earlier, the author was not in Vietnam; therefore, she had
to conduct the interviews online via Skype, Facebook messages, and e-mails. The
interviews design and launching happened at the same time with the survey from
week 8 in February 2015 until week 16, April 2015.All of the interviewees
requested to remain anonymous. Thus, they are interviewee EA1, interviewee
EA2 for Etihad Airways; interviewee QA1, interviewee QA2 for Qatar Airways;
interviewee E1 and interviewee E2 for Emirates. Moreover, the oral references do
not includes their identities.
59
Subsequently, survey is the most advantageous system to collect data on such
topics as consumer decision making, customer satisfaction, and management
information system to name a few. Questionnaire is a predetermined set of
questions formulated for the respondents to record their answers either on papers
or via electronic means. It is to say that questionnaires are less time consuming
than interviews but they pose a low return rate if conducted via e-mails and
electronic platforms. Hence, the design of the questionnaire should be succinct,
concise and topic focuses. (Sekaran & Bougie, 2014, 102, 147-153.)
As mentioned in the beginning, the thesis covers two ideas of whether the
marketing strategy of Etihad Airways in Vietnam is as effective as the strategies
of Emirates and Qatar Airways, as well as what Etihad can learn from these
airlines. Hence, after defining the strategies, and confirming them with the
representatives through interviews, this stage evaluates the attitude of the
customers towards the three airlines. Appendix 6 includes the survey for this
study. Firstly, it studies the customer’s background, ages, and income. This is to
confirm if the airlines reach their target group. The survey also aims at
investigating the respondent’s awareness about the MEB3 airline, if the
respondent knows about the MEB3, and through which channels. In addition, the
questionnaire enquires feedback if the respondent has traveled with any airlines
from the MEB3 before. In case the respondent is not familiar withMEB3’s
services, the survey aims at checking their willingness to become future customer,
as well as of which airline from the MEB3. In total, the survey contains 15 closed
questions, which offer a fixed set of answers for the respondents.
The questionnaire design was at the same time as the interview questions and
modified many times from week 8 in February 2015 to week 12 in March 2015, as
shown in the Gantt chart. Then, the survey launch took place in week 14 at the
end of March 2015 via Google doc and Facebook. It was not mass distributed but
only to those that fit the target group description of the MEB3. The author aimed
at reaching 30 respondents for more credible and reliable results. Moreover, due
to the small scale of the survey, there was no need for statistics software.

60
5.2 Data Analysis
This sub-chapter provides the findings from the three phases introduced in the
beginning of this chapter: desk study, interview, and survey. It starts with
comparing the STPs of the MEB3 airlines and sum up with figures from the
customers’ responses for the survey. The data are in the form of tables, graphs,
and explained in details. The assessment of desk study data occurred in early stage
of the thesis, from December 2014 to February 2015.The analysis data from
interviews and questionnaire took place from week 16 to week 18 in April 2015.
5.2.1 Desk Study
This first stage provides confirmation on Emirates and Qatar Airways as the right
benchmarkees by comparing the STP of Etihad Airways to theirs. According tothe
customer profiles, it is apparent that they are the direct competitors of Etihad
Airways in Vietnam (see Appendix 3 for detailed information). To be precise, all
of the MEB3 airlines divide the segments based on the travel purposes of the
passengers. Due to the scale of this thesis, they remain as two main groups:
holiday and business. Based on behavioral segmentation, target customers of the
MEB3 airlines share many similar traits. For the holiday group, the three airlines
all aim at urban middle-class to high-class people who are from 25 to 60 years old
and seek safe, comfortable, and reliable services. (Etihad 2015; Emirates 2015;
Qatar Airways 2015.)
On the other hand, the business target group concerns high-ranking elites and
executives from the 30 - 60 year old age group, who prefer luxury and comfort
travel experiences over price. Additionally, the MEB3 airlines all adopt market
specialization as strategy for targeting as they offer different services that fit the
needs of the segments, from the fleet, in-flight entertainment & catering to airport
services (refer to Appendix 4 – the MEB3’s Product Strategies). (Etihad 2015;
Emirates 2015; Qatar Airways 2015.)
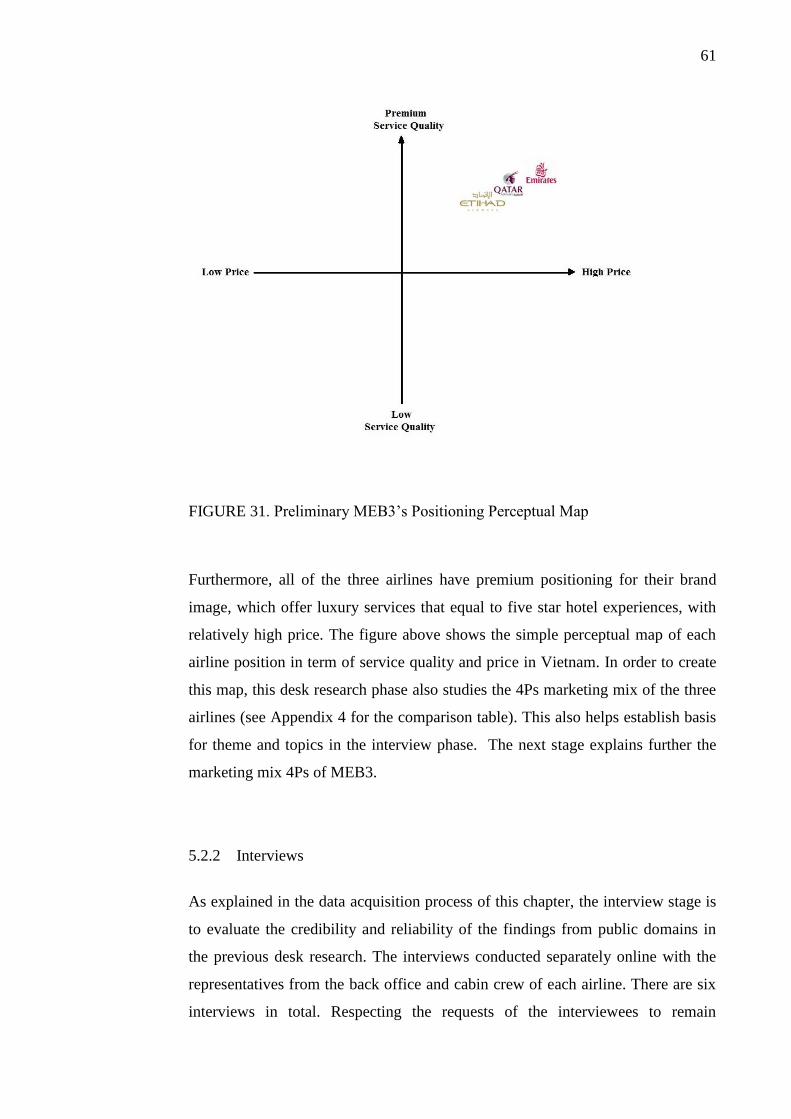
61
FIGURE 31. Preliminary MEB3’s Positioning Perceptual Map
Furthermore, all of the three airlines have premium positioning for their brand
image, which offer luxury services that equal to five star hotel experiences, with
relatively high price. The figure above shows the simple perceptual map of each
airline position in term of service quality and price in Vietnam. In order to create
this map, this desk research phase also studies the 4Ps marketing mix of the three
airlines (see Appendix 4 for the comparison table). This also helps establish basis
for theme and topics in the interview phase. The next stage explains further the
marketing mix 4Ps of MEB3.
5.2.2 Interviews
As explained in the data acquisition process of this chapter, the interview stage is
to evaluate the credibility and reliability of the findings from public domains in
the previous desk research. The interviews conducted separately online with the
representatives from the back office and cabin crew of each airline. There are six
interviews in total. Respecting the requests of the interviewees to remain
62
anonymous, they appear as interviewee EA1, interviewee EA2 for Etihad
Airways; interviewee QA1, interviewee QA2 for Qatar Airways; interviewee E1
and interviewee E2 for Emirates.
In all of the six interviews, the author discussed with the representatives briefly
about the current competition in Vietnam’s air travel market. The interviewees all
agreed that effective marketing strategy is crucial for airlines operating in the
market in this period. Subsequently, as the discussion involves the target
segments, and pricing policy, the answers from the interviewees were consistent
with the findings from the desk research about the STPs. Especially all of the
cabin crew interviewees confirmed that the actual passengers of the airlines fit the
target group profiles.
According to the interviewee EA1, Etihad Airways seeks benchmarks from
outside the airline industry. They benchmark their products and services to five
star hotels, and top restaurants. The airline does not aim at being the biggest, but
the best airline in the world, thus, its top concern is the customer service. The
representative office of Etihad in Vietnam also realizes the weak brand awareness
in the market. Hence, even though they follow accordingly such practice of the
company, they try putting more effort in designing better local marketing strategy.
As for its main target group in Vietnam, Etihad focuses on the holiday group. The
airline has younger passengers profile than other two airlines as it includes those
belong to 25 – 30 year old age group. In order to attract the target group, Etihad
offers lower price than the other two airlines but the same premium services,
making that become its main advantage in the market. The airline pays attention
to online travel sites and its strategic partners such as Jet Airways, airberlin, and
Virgin Australia to name a few. Additionally, both interviewee EA1 and EA2
agree that Emirates is the main competitor of Etihad Airways in Vietnam.
Meanwhile, Emirates focuses more on the business group as businesspersons are
their frequent flyers. The airline also aims at expanding more flying routes to gain
more market share. For branding, it practices strategic cooperation with other
airlines. The interviewee E1 mentioned that Emirates published its own business
magazines and sent to companies to attract their attention. Regarding the in-flight
63
services, aside from improving and expanding the fleet, entertainment programs
and catering, the interviewee E2 stated that Emirates' strategy in scheduling roster
creates diversity in the cabin crew to serve the cultural diversity experience for the
customers. Both interviewees agree that the advantages of Emirates in Vietnam is
its large-scale and good brand awareness from its international sport sponsorships
for AC Milan, Arsenal, as well as Real Madrid to name a few.
Considering Qatar Airways in Vietnam, the interviewee Q1 mentioned that it is
the fourth largest carrier for the international flights in the Vietnamese market. Its
market share in 2013 was 3 percent. The airline advantage is that it has
representative offices in both Ho Chi Minh City and Hanoi, Vietnam, unlike the
other two airlines that have only offices in Ho Chi Minh City. Thus, it has greater
market shares and passenger volumes. Interviewee Q2 affirmed that the main
target group of the airline is the business group, which aims at corporation and
elites with high salaries. Qatar Airways is confident over the other two airlines
because Skytrax evaluates it as a five-star airline, while the other two are four-star
airlines. In addition, the airline has good relationships with travel agencies in both
Ho Chi Minh City and Hanoi. It also makes good use of online social media such
as Facebook and e-magazines.
In general, the findings on customer profiles match the information from the
representatives. The preliminary positioning perceptual map also fits the
responses in this stage. Appendix 4 shows a detailed comparison of the 4Ps
withdrawn from the answers of the interviewees.
5.2.3 Survey
In total, there are 30 respondents to the survey, which meets the set objectives in
the data acquisition sub-chapter. The first part of the survey provides the
background information of the respondents. As mentioned earlier, the target
customer groups of the MEB3 are those from 25 – 60 years old, in middle class
and upper-middle class, hence, the respondents are those in Vietnam who meet the
conditions
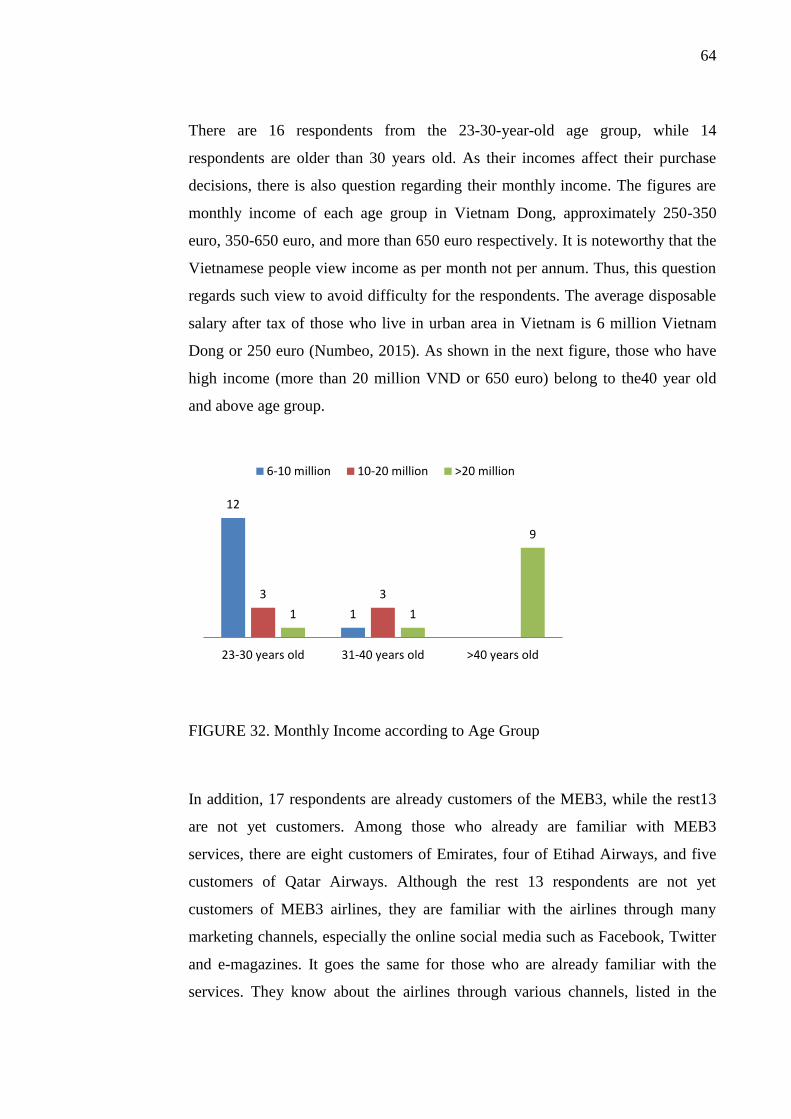
64
There are 16 respondents from the 23-30-year-old age group, while 14
respondents are older than 30 years old. As their incomes affect their purchase
decisions, there is also question regarding their monthly income. The figures are
monthly income of each age group in Vietnam Dong, approximately 250-350
euro, 350-650 euro, and more than 650 euro respectively. It is noteworthy that the
Vietnamese people view income as per month not per annum. Thus, this question
regards such view to avoid difficulty for the respondents. The average disposable
salary after tax of those who live in urban area in Vietnam is 6 million Vietnam
Dong or 250 euro (Numbeo, 2015). As shown in the next figure, those who have
high income (more than 20 million VND or 650 euro) belong to the40 year old
and above age group.
FIGURE 32. Monthly Income according to Age Group
In addition, 17 respondents are already customers of the MEB3, while the rest13
are not yet customers. Among those who already are familiar with MEB3
services, there are eight customers of Emirates, four of Etihad Airways, and five
customers of Qatar Airways. Although the rest 13 respondents are not yet
customers of MEB3 airlines, they are familiar with the airlines through many
marketing channels, especially the online social media such as Facebook, Twitter
and e-magazines. It goes the same for those who are already familiar with the
services. They know about the airlines through various channels, listed in the
12
1
3 3
1 1
9
23-30 years old 31-40 years old >40 years old
6-10 million 10-20 million >20 million
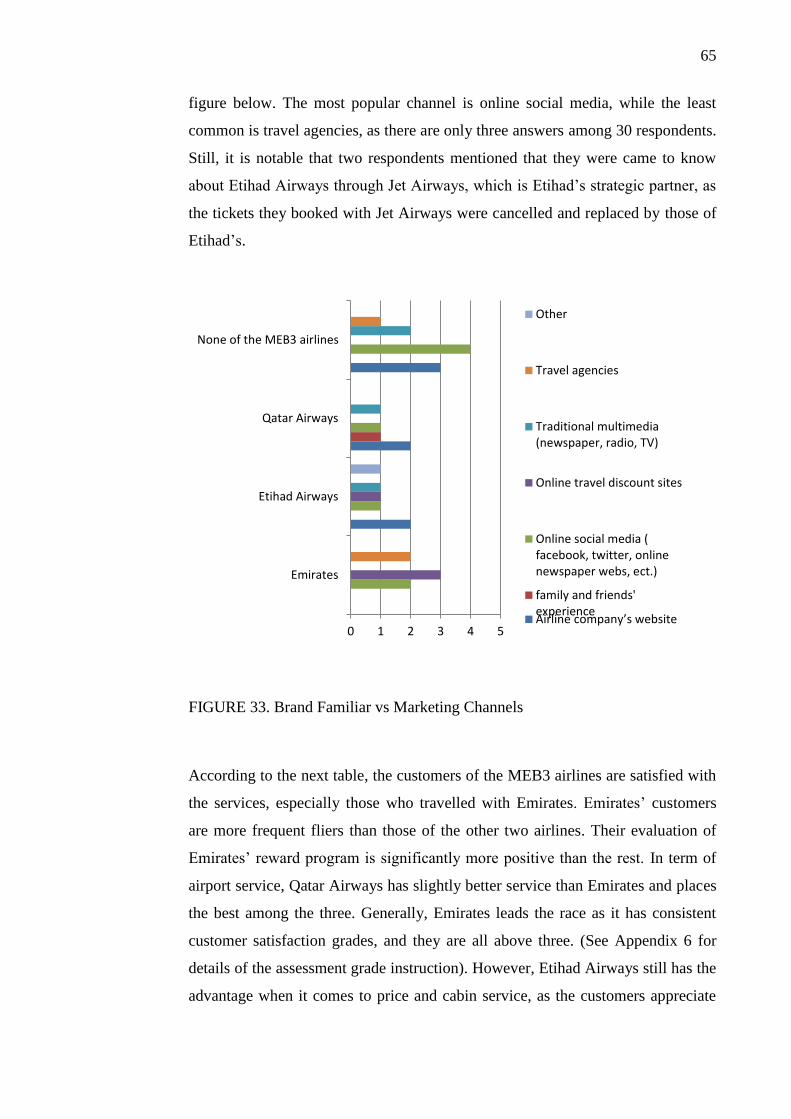
65
figure below. The most popular channel is online social media, while the least
common is travel agencies, as there are only three answers among 30 respondents.
Still, it is notable that two respondents mentioned that they were came to know
about Etihad Airways through Jet Airways, which is Etihad’s strategic partner, as
the tickets they booked with Jet Airways were cancelled and replaced by those of
Etihad’s.
FIGURE 33. Brand Familiar vs Marketing Channels
According to the next table, the customers of the MEB3 airlines are satisfied with
the services, especially those who travelled with Emirates. Emirates’ customers
are more frequent fliers than those of the other two airlines. Their evaluation of
Emirates’ reward program is significantly more positive than the rest. In term of
airport service, Qatar Airways has slightly better service than Emirates and places
the best among the three. Generally, Emirates leads the race as it has consistent
customer satisfaction grades, and they are all above three. (See Appendix 6 for
details of the assessment grade instruction). However, Etihad Airways still has the
advantage when it comes to price and cabin service, as the customers appreciate
0 1 2 3 4 5
Emirates
Etihad Airways
Qatar Airways
None of the MEB3 airlines
Other
Travel agencies
Traditional multimedia(newspaper, radio, TV)
Online travel discount sites
Online social media (facebook, twitter, onlinenewspaper webs, ect.)
family and friends'experienceAirline company’s website
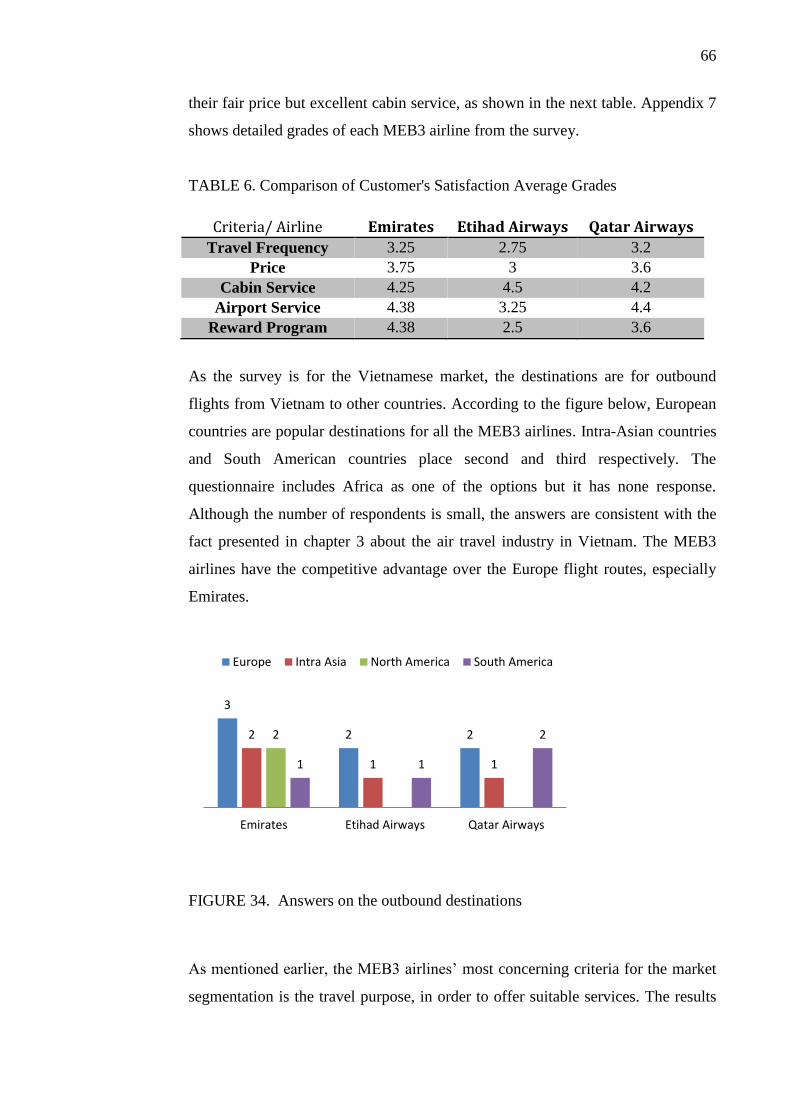
66
their fair price but excellent cabin service, as shown in the next table. Appendix 7
shows detailed grades of each MEB3 airline from the survey.
TABLE 6. Comparison of Customer's Satisfaction Average Grades
Criteria/ Airline Emirates Etihad Airways Qatar Airways
Travel Frequency 3.25 2.75 3.2
Price 3.75 3 3.6
Cabin Service 4.25 4.5 4.2
Airport Service 4.38 3.25 4.4
Reward Program 4.38 2.5 3.6
As the survey is for the Vietnamese market, the destinations are for outbound
flights from Vietnam to other countries. According to the figure below, European
countries are popular destinations for all the MEB3 airlines. Intra-Asian countries
and South American countries place second and third respectively. The
questionnaire includes Africa as one of the options but it has none response.
Although the number of respondents is small, the answers are consistent with the
fact presented in chapter 3 about the air travel industry in Vietnam. The MEB3
airlines have the competitive advantage over the Europe flight routes, especially
Emirates.
FIGURE 34. Answers on the outbound destinations
As mentioned earlier, the MEB3 airlines’ most concerning criteria for the market
segmentation is the travel purpose, in order to offer suitable services. The results
3
2 22
1 1
2
1 1
2
Emirates Etihad Airways Qatar Airways
Europe Intra Asia North America South America

67
show that the common travel purpose is holiday occasions (11 answers out of 17
respondents). Meanwhile, business travel remains low, as there are only five
answers from 17 respondents. The age groups of the respondents affect this
section greatly as people from 23 – 30 group tend to travel for leisure purpose
more than on business. Nonetheless, this result indicates that Etihad Airways
currently focuses on the right segment in Vietnam.
FIGURE 35. Answers on travel purposes
Regarding the purchase channels, the majority of the responses are purchasing
through online travel sites such as Skyscanner or Supersaver. Meanwhile, only
one customer of Qatar Airways bought the ticket through travel agency. This
result projects that the MEB3 prefer the new channel to the traditional ones. The
following chart shows the channels where the customers of each airline purchased
their tickets.
FIGURE 36. Purchase Channels
21
2
5
3 3
1
Emirates Etihad Airways Qatar Airways
Business Holiday Personal reasons
2 1 2
63 2 1
Emirates Etihad Airways Qatar Airways
Directly from the airline (their agents/ airline's website)
Through an online travel site (e.g., Skyscanner,Supersaver, BudJet, etc.)
Travel agency
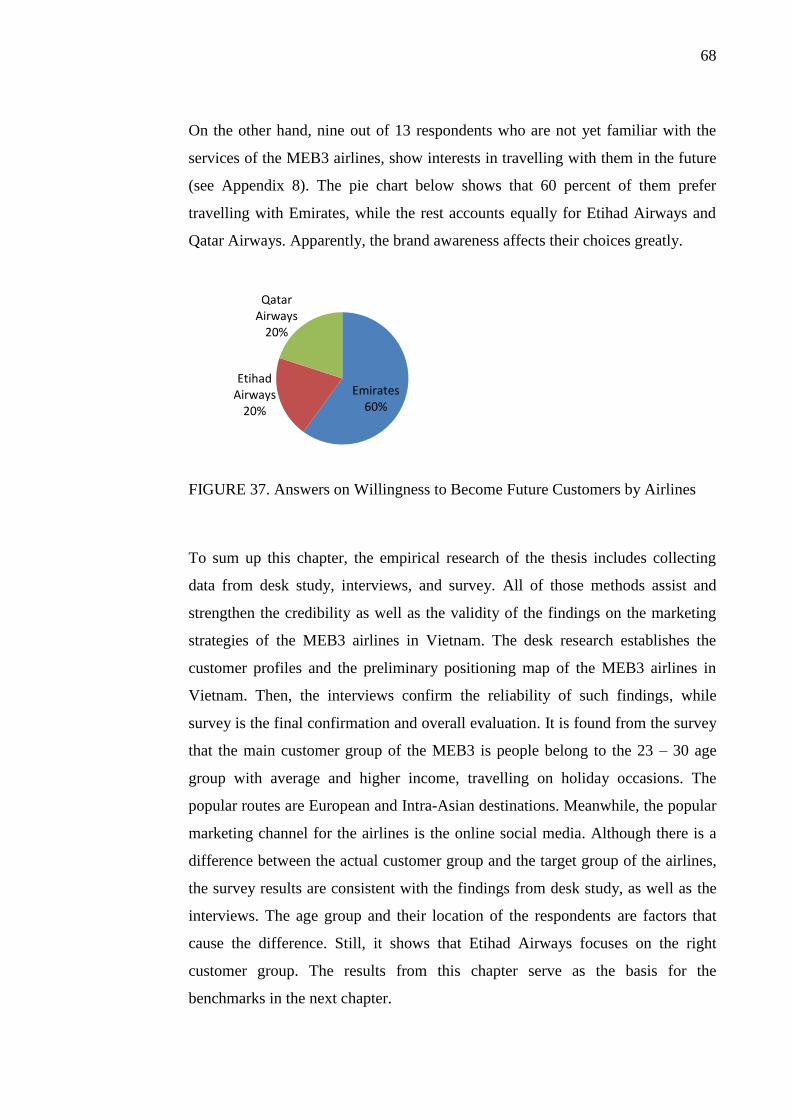
68
On the other hand, nine out of 13 respondents who are not yet familiar with the
services of the MEB3 airlines, show interests in travelling with them in the future
(see Appendix 8). The pie chart below shows that 60 percent of them prefer
travelling with Emirates, while the rest accounts equally for Etihad Airways and
Qatar Airways. Apparently, the brand awareness affects their choices greatly.
FIGURE 37. Answers on Willingness to Become Future Customers by Airlines
To sum up this chapter, the empirical research of the thesis includes collecting
data from desk study, interviews, and survey. All of those methods assist and
strengthen the credibility as well as the validity of the findings on the marketing
strategies of the MEB3 airlines in Vietnam. The desk research establishes the
customer profiles and the preliminary positioning map of the MEB3 airlines in
Vietnam. Then, the interviews confirm the reliability of such findings, while
survey is the final confirmation and overall evaluation. It is found from the survey
that the main customer group of the MEB3 is people belong to the 23 – 30 age
group with average and higher income, travelling on holiday occasions. The
popular routes are European and Intra-Asian destinations. Meanwhile, the popular
marketing channel for the airlines is the online social media. Although there is a
difference between the actual customer group and the target group of the airlines,
the survey results are consistent with the findings from desk study, as well as the
interviews. The age group and their location of the respondents are factors that
cause the difference. Still, it shows that Etihad Airways focuses on the right
customer group. The results from this chapter serve as the basis for the
benchmarks in the next chapter.
Emirates60%
Etihad Airways
20%
Qatar Airways
20%
69
6 RECOMMENDED BENCHMARKS FOR ETIHAD AIRWAYS
So far, the thesis introduces the benchmarking approach and SOSTAC model as
the theoretical framework in chapter 2. It also mentions the nature and the outlook
of air travel market globally, as well as the analysis of the Vietnamese market
through PEST & Porter’s Five Forces, in chapter 3. Chapter 4 concerns the
introduction of Etihad Airways and its direct competitors. The previous chapter
5is the empirical research, which studies and compares the marketing strategy of
the case company to its competitors by various data collecting methods. It
establishes the basis for this chapter 6. In this chapter, the study presents the
benchmarks for the marketing mix of Etihad Airways in Vietnam market. They
are benchmarks concerning the place, product, price, and promotion strategy.
6.1 Place
All the MEB3 airlines have its representative offices in Ho Chi Minh City,
Vietnam. Apparently, it is because HCMC is a metropolitan area and one of the
important economic hubs of Vietnam. Only Qatar Airways has another office in
Hanoi, the capital of Vietnam. In 2014, Hanoi had the population of almost 7
million people, which made it the second largest city in Vietnam, just after
HCMC (General Statistics Office of Vietnam, 2014). There are 26000 Vietnamese
employees currently working in the Middle East and many of them come from
Hanoi (Ministry of Foreign Affairs, 2013). Considering the potential market size,
it is advisable for Etihad Airways to follow suit.
Additionally, Etihad Airways should also consider revising its hub strategy for the
flights from Amsterdam to Vietnam. One-hour transit time in Abu Dhabi is not
enough as the arrival time in Abu Dhabi is the peak traffic time of the airport.
Thus, it is really crowded and difficult to get from the arrival terminal to the
departure terminal in such a short time. Meanwhile, there is only one flight from
Abu Dhabi to Vietnam daily so the passengers have to stay a day inside the airport
until the next flight. In respect of this matter, Emirates and Qatar Airways assign
the departure gate close to the arrival terminal for short transit time flights.
70
6.2 Product
The product strategy of all MEB3 airlines is differentiated premium air travel.
Still, Emirates and Qatar Airways focus more on the business segment, which
earn them customers that are more loyal, and generate more profits than the
holiday segment. Etihad should pay more attention on this segment and consider
offering them more product selection. Concerning the actual product for business
segment, Emirates offers them high-end urban lifestyle onboard, which is a
different approach to Etihad’s ‘simplicity and functionality’ cabin design. For
instance, besides the flatbed seat and premium entertainment, there is also
personal mini-bar for business passengers of Emirates. In addition, the airline
offers them the A380 Onboard Lounge, which serves premium spirits and
exclusive wines. As there are many nouveaux riches in Vietnam, the luxury urban
lifestyle approach of Emirates is more appealing than the minimalistic approach of
Etihad.
Not only do Emirates and Qatar Airways focus on individual elite, but they also
pay attention to company as a whole. As for the augmented product of this
segment, Emirates has the Business Rewards for the small and medium size
businesses. The membership applies for the entire company to earn rewards
together. Moreover, the company can register up to 80 members under its name.
On the other hand, Qatar Airways has Qbiz sharing the same idea as the Business
Rewards of Emirates. However, its policy appears to be stricter than Emirates’ as
it requires the travelling employees to be members of Qatar Airways Privilege
Club. Etihad Airways should improve this aspect, as the airline only has Etihad
Guest Miles for individual passengers.
6.3 Price
The pricing strategy of Etihad Airways is market penetration for gaining more
market share. Simply put, the common strategy is price adjustments or lowering
price to increase sales volume. In contrast, the other two airlines adopt skimming
strategy, which the price is high at first, then lower over time. This explains the
71
lower price of Etihad comparing to the prices of Emirates and Qatar Airways. As
the customers for the holiday group in Vietnam are price sensitive, this strategy of
Etihad is suitable. However, in the long-term, it affects the premium image, and
objectives of serving the best services of Etihad. Although Emirates has the
reputation as the most expensive airline from the Persian Gulf, it maintains the
premium brand image consistently, and has enough resources to improve its
services quality continuously. Therefore, once Etihad achieves a certain level of
brand familiarity in Vietnam, it should increase the price to make up for the
increasing fuel costs, as well as improve its brand value to catch up with Emirates.
6.4 Promotion
Promotion is the most important strategy that Etihad Airways has to concentrate
on and improve. From the previous empirical research, the customers in Vietnam
prefer direct online contact via social network such as Facebook. Among the
MEB3 airlines, only Qatar Airways has Facebook page for its representative
offices in Vietnam, while Emirates and Etihad only have international pages. The
contents are about price lists, offers, and campaigns of the airline, which it is
customer friendly, and sales supporting. Considering that holiday group is Etihad
main segment, it is highly advisable that the airline learns from Qatar Airways.
Regarding the business segments, besides the similar marketing channels like the
other two (see Appendix 4), Emirates also publishes its own business journals and
sends them to its target companies, as well as its customers. Etihad Airways
withdrew from Skytrax Awards to cut down the cost on Skytrax’s auditing, in
2014. The airline should review this move to attract more customers from the
business segment, as Emirates and Qatar Airways all hold solid evaluation from
Skytrax as four-star and five-star airline respectively.
72
7 CONCLUSION & SUGGESTIONS
This chapter summarizes all the findings and results throughout this thesis to
answer the research questions. In addition, it discusses the validity & reliability,
as well as recommendations for future research.
7.1 Answers to the Research Questions
In general, Vietnam air travel is a promising market thanks to the country’s
vibrant economy, favorable geographic area, as well as many government
incentive policies for the market.
i. What is the current situation of Vietnam’s commercial air transport?
Despite the bright outlook, the competition among airlines operating in the market
is intense as the market has high threats in rivalry among existing competitors,
bargaining power of suppliers, as well as substitute products & services.
ii. Who are Etihad’s main competitors?
Emirates and Qatar Airways are the other two airlines from the Middle East.
Together with Etihad Airways, specialists call them the Middle East Big 3.
Emirates and Qatar Airways have similar background to Etihad’s and strive for
luxury brand image as well. Results from desk study on their STPs, as well as
interviews confirm that they are the direct competitors of Etihad Airways in
Vietnam.
iii. What is the marketing strategy of Etihad Airways in Vietnam?
In terms of the STP, Etihad adopts behavioural segmenting as it profiles the
customers based on their benefit sought, travel purposes, etc. Its targeting strategy
is market specialisation since the airline concentrates on satisfying many needs of
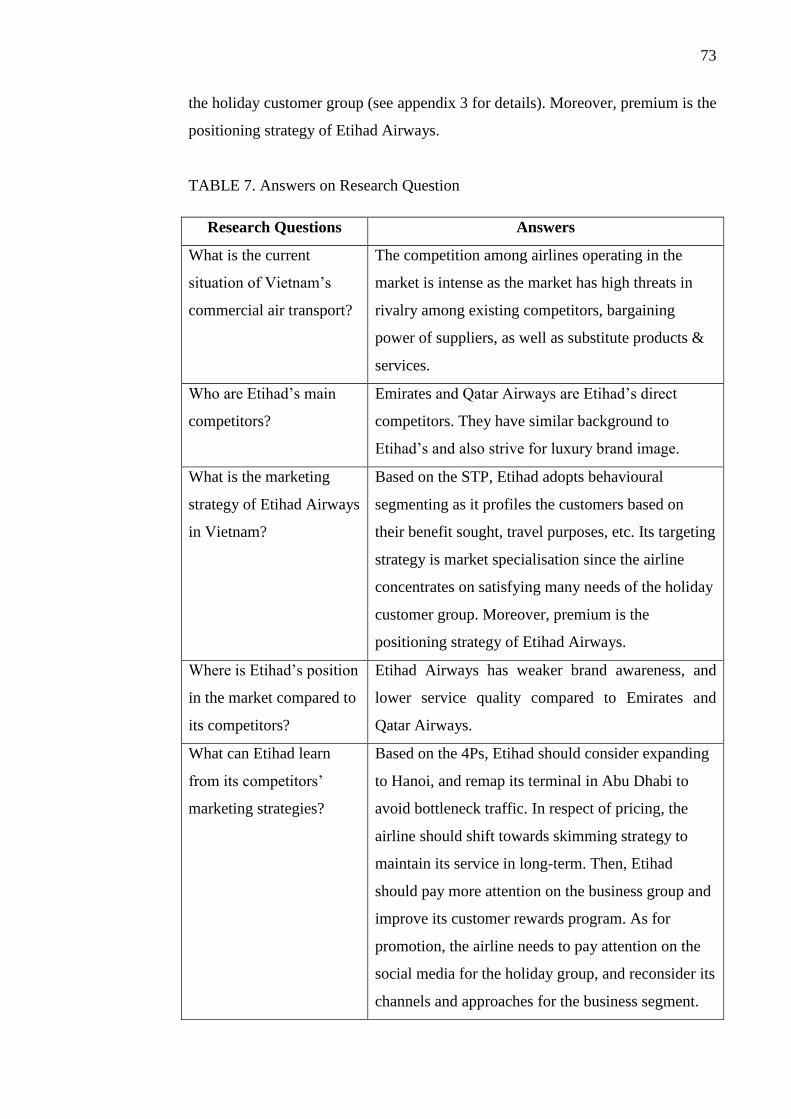
73
the holiday customer group (see appendix 3 for details). Moreover, premium is the
positioning strategy of Etihad Airways.
TABLE 7. Answers on Research Question
Research Questions Answers
What is the current
situation of Vietnam’s
commercial air transport?
The competition among airlines operating in the
market is intense as the market has high threats in
rivalry among existing competitors, bargaining
power of suppliers, as well as substitute products &
services.
Who are Etihad’s main
competitors?
Emirates and Qatar Airways are Etihad’s direct
competitors. They have similar background to
Etihad’s and also strive for luxury brand image.
What is the marketing
strategy of Etihad Airways
in Vietnam?
Based on the STP, Etihad adopts behavioural
segmenting as it profiles the customers based on
their benefit sought, travel purposes, etc. Its targeting
strategy is market specialisation since the airline
concentrates on satisfying many needs of the holiday
customer group. Moreover, premium is the
positioning strategy of Etihad Airways.
Where is Etihad’s position
in the market compared to
its competitors?
Etihad Airways has weaker brand awareness, and
lower service quality compared to Emirates and
Qatar Airways.
What can Etihad learn
from its competitors’
marketing strategies?
Based on the 4Ps, Etihad should consider expanding
to Hanoi, and remap its terminal in Abu Dhabi to
avoid bottleneck traffic. In respect of pricing, the
airline should shift towards skimming strategy to
maintain its service in long-term. Then, Etihad
should pay more attention on the business group and
improve its customer rewards program. As for
promotion, the airline needs to pay attention on the
social media for the holiday group, and reconsider its
channels and approaches for the business segment.
74
i. Where is Etihad’s position in the market compared to its competitors?
The findings from desk study, interviews, and survey show consistent results that
Etihad Airways has weaker brand awareness, and lower service quality compared
to Emirates and Qatar Airways (refer to the positioning perceptual map at the end
of sub-chapter 5.2.1).
ii. What can Etihad learn from its competitors’ marketing strategies?
The benchmarks are in the form of the 4Ps – Place, Price, Product, and Promotion.
Firstly, Etihad Airways should consider establishing its presence in Hanoi for the
potential market size there. It also should remap its Etihad terminal in Abu Dhabi
Airport to avoid bottleneck during peak traffic time. In respect of pricing strategy,
it is advisable that the airline shift towards skimming strategy to maintain its
service quality in the long-term. Then, Etihad Airways should pay more attention
on the business group and improve its customer rewards program. In term of
promotion, the airline needs to pay attention on the social media channel for the
holiday group, as well as reconsidering its channels and approaches for the
business segment.
7.2 Reliability and Validity
The three stages of data acquisition: desk study, interviews, and survey
crosschecked the findings for the empirical research of this study. The six
interviewees are representatives from both the offices and cabin crews of the
MEB3 airlines in Vietnam. Additionally, the criteria for respondent selection of
the survey followed the customer profiles of the MEB3. The results proved the
findings from all of the three steps to be consistent. In that essence, the author
believed that if there were other research on the marketing strategies of the MEB3
airlines for the Vietnamese market in the 2013-2015 periods, it would yield
similar results. Thus, the research is greatly reliable.
75
Meanwhile, the thesis attained its final goal as it adequately answered all the
research sub-questions. The theoretical knowledge structuring the research was
based on different academic sources such as published books, scholarly journals,
as well as trusted public domains. Most of the sources received peer reviews and
from ten years back. However, some of the theories on benchmarking came from
sources dated 20 years ago. To compensate, the author tried to find recent articles
and many different books on the topic. Furthermore, the information for the
analysis of Etihad Airways came from a personal and trust-worthy internal source.
In short, this thesis has high validity.
7.3 Suggestions for Further Research
The thesis is strictly the strategic analysis of finding the benchmarks for the
marketing strategy of Etihad Airways from its direct competitors in Vietnam. As
explained earlier, this research does not cover the Action and the Control stages,
as the research question concerns ‘what’ - the benchmarks, not ‘how’- the
implementation plan. Suggested models for the Action, and the Control stages are
Gantt chart, as well as 3x 3 risk matrix respectively. Actual adaptation of the said
models in this thesis requires more specific and confidential information from
Etihad Airways. Hence, further research for the benchmarks implementation plan
is highly recommended. In addition, it is advantageous to conduct a large-scale
survey with large amount of samples, as well as more demographic variables to
gain better insight of the customer segments and customer behaviors of Vietnam’s
air travel market.
76
8 SUMMARY
Thanks to Vietnam’s vibrant economy and government incentive policy, the air
travel market is booming and has a positive outlook. However, it is also resulting
in intense competition among the existing players in the market. On top of that,
the rivalry between the MEB3 airlines puts more pressure on the situation.
Therefore, it is crucial for airlines in Vietnam to have strong marketing strategy in
order to establish solid brand awareness. In accordance, the utmost goal of this
thesis is to find out the benchmarks from direct competitors for Etihad Airways to
refine its marketing strategy and improve its presence in the market.
The thesis employs a combination of inductive and deductive approaches,
complemented by mixed-methods research choice. In that sense, the primary data
is derived from both qualitative and quantitative data collection methods, namely
interviews and survey respectively. The secondary data stems from published
books, academic journals, and trust-worthy public domains. Altogether, they form
a strong and logical structure, as well as contribute to the validity and reliability of
the thesis.
The main idea generating this thesis is benchmarking philosophy. The purpose is
to find the best practice in the field regardless of geographical area. The
benchmarking type adopted in this study is competitive benchmarking, which
allows the benchmarker to seek benchmarks from its direct competitors. The
SOSTAC® model is the marketing planning tool complementing the
benchmarking process. It stands for Situation Analysis, Objectives, Strategy,
Tactics, Actions, and Control. The model supports building a thorough marketing
plan by establishing small tasks for each step.
The research started with an overview on the commercial aviation industry, its
components, history, and characteristics. Apparently, air travel has changed
towards more liberalization, which brought better benefits for both the airlines and
the passengers. In spite of the bright outlook globally and in Vietnam, the airlines
had to deal with low profits, increasing fuel surcharges, as well as safety issues.
The market had high threats of rivalry and substitute products/ services. This
77
demonstrated that performing benchmarking on marketing strategy for Etihad
Airways in Vietnam was timely and necessary.
Etihad’s main competitors in Vietnam are Emirates and Qatar Airways. Together,
specialists call them the MEB3.The desk study found that they profiled their
customers based on the travel purpose, and behavioral segmentation. They had
two customer segments, which were the holiday group and the business group.
Their targeting and positioning strategies were differentiation and premium,
respectively. The interviews with representatives from the offices and cabin crews
confirmed those findings. It was notable that Etihad Airways focused on the
holiday group, while the other two paid most attention to the business segment.
Additionally, the survey results show consistency with the previous findings.
Emirates was the most appreciated airlines among the MEB3 with high customer
satisfaction. However, Etihad Airways had good feedback on their prices and
cabin services.
The benchmarks regarded the marketing mix 4Ps: Place, Price, Product, and
Promotion. Firstly, Etihad Airways should consider establishing its presence in
Hanoi for the potential market size there. It also should remap its Etihad terminal
in Abu Dhabi Airport to avoid bottleneck during peak traffic time. In respect to
pricing strategy, it is advisable that the airline shift towards skimming strategy to
maintain its service quality in the long-term. Then, Etihad Airways should pay
more attention to the business group and improve its customer rewards program.
In terms of promotion, the airline needs to focus on social media for the holiday
group, as well as reconsidering its channels and approaches for the business
segment.
In conclusion, the study reached its objective of appropriately answering the main
research question and sub-questions. It also had high levels of validity and
reliability. The limitations concerning this thesis were the research ethic, the
absence of implementation plan, as well as the small-scale of the interviews and
survey. They are the suggestions for further study.
78
REFERENCES
Published References
Andersen, B. 1995. Benchmarking in Norwegian Industry and Relationship
Benchmarking. In Rolstadas, A. (ed) Benchmarking: Theory and and Practice.
London, UK: Chapman-Hall, 105-109.
Blythe, J., Megicks, P. 2010. Marketing Planning: Strategy, Environment and
Context. 1. Essex, UK: Pearson Education Ltd.
Breiter, D., Kliner, S. 1995. Benchmarking Quality Management in Hotels.FIU
Hospitality Review13(2), 44-45.
Camp, R. 1989.Benchmarking- The Search for Indutry Best Practices that Lead to
Superior Performance. Wisconsin, USA: ASQC Quality Press. New York, USA:
Quality Resources.
Cook, S. 1995. Practical Benchmarking: A Manager’s Guide to Creating a
Competitive Advantage. London, UK: Kogan Page.
Collis, J., Hussey, R. 2009. Business Research: A Practical Guide for
Undergraduate & Postgraduate Students. 3. Hampshire, UK: Palgrave Macmillan.
Cox, J., Mann, L., Samson, D, 1997. Benchmarking as a Mixed Metaphor:
Disentangling Assumptions of Competition and Collaboration. Journal of
Management Studies 34(2), 285-314.
Cross, R., Leonard, P. 1994. Benchmarking: A Strategic and Tactical Perspective.
In Dale, B. (ed.) Managing Quality. 2. Prentice Hall, 497-513.
Decision on the Establishment of Airports Corporation of Vietnam (ACV) based
on merging the Northern, Middle and Southern Airports Corporations
79
No.238/QD-BGTVT, Appendix 1. Available on
http://www.caa.mt.gov.vn/Default.aspx?Tabid=2&DocumentID=93
Duval, D. 2007. Tourism Transport: Modes, Networks and Flows. Clevedon, UK:
Channel View Publications.
Easterby-Smith, M., Thorpe, R., Lowe, A. 2002. Management Research: An
Introduction .2. London, UK: SAGE.
Graham, A., Papatheodorou, A., Forsyth, P. 2008. Aviation and Tourism:
Implication for Leisure Travel. Hampshire, UK: Ashgate Publishing Ltd.
Holloway, C., Humphreys, C. 2012. The Business of Tourism. 9. Essex, UK:
Pearson Education Ltd.
Johnson, G., Scholes, K. 2001. Exploring Public Sector Strategy .1. Essex, UK:
Pearson Education Ltd.
Johnson, G., Scholes, K., Whittington, R. 2005. Exploring Corporate Strategy:
Text and Cases. 7. Essex, UK: Pearson Education Ltd.
Kairies, P. 2001. So analysieren Sie Ihre Konkurrenz. Renningen: expert verlag.
Kananen, J. 2013. Design Research (Applied Action Research) as Thesis Research
- A Practical Guide For Thesis Research.Tampere: Jamk University Of Applied
Sciences.
Karlof, B., Ostblom, S. 1993. Benchmarking: A Signpost Excellence in Quality
and Productivity. West Sussex, UK: Wiley.
Kotler, P., Amstrong, G. 2012. Principles of Marketing.14. New Jersey, USA:
PearsonEducation Ltd.
80
Kotler, P., Keller, K., Brady, M., Goodman, M., Hansen, T. 2009. Marketing
Management. Essex, UK: Pearson Education Ltd.
Kotler, P., Keller, K. 2012. Marketing Management. 14. Essex, UK: Pearson
Education Ltd.
Kozak, M., & Nield, K. 2001. An Overview of Benchmarking Literature: Its
Strength and Weaknesses. In Pyo, S.(ed.)Benchmarks in Hospitality & Tourism, 2
(3/4,2001), 7-23.
Lee, N., Lings, I. 2008.Doing Business Research - A Guide to Theory and
Practice. London, UK: SAGE Publications.
Mathison, S. 1988. Why Triangulate?Educational Researcher 17 (2), 13-17.
Porter, M. 1998. Competitive Strategy: Techniques for Analyzing Industries and
Competitors. New York, USA: Free Press.
Saunders, M., Lewis, P., & Thornhill, A. (2012). Research methods for business
students. 6. Essex, UK:Pearson Education Ltd.
Savitskaya, I. 2011. Environmental Influences on The Adoption of Open
Innovation: Analysis of Structural, Institutional and Cultural Impacts.Thesis for
the degree of Doctor of Science Technology. Lappeenranta, Finland:
Lappeenranta University of Technology
Sekaran, U., Bougie, R. 2014. Research Methods for Business : a Skill-Building
Approach. 6.West Sussex, UK: Wiley.
Smith, P. 2011. The SOSTAC® Guide - to writing the perfect plan . V1.1. Kindle
ed. USA: PR SMith.
Stapenhurst, T. 2009. The Benchmarking Book: A how-to-guide to best practices
for managers and practitioners. Oxford, UK: Elsevier Ltd.
81
Sterling, E. 2006.Vietnam: A Natural History.New Haven, USA: Yale University.
Electronic References
AAPA. 2010. About AAPA: History [retrieved 03 February 2015]. Available on
Association of Asia Pacific Airlines website:
http://www.aapairlines.org/History.aspx
Anh, N. 2012. Business: Super Deluxe Brands Flock to Vietnam[retreived 29
April 2015]. Available on Vietnamnet wesbite:
http://m.english.vietnamnet.vn/fms/business/55062/super-deluxe-brands-flock-to-
vietnam.html
anna.aero. 2013. Latest Airline Route News: Comments Off: Etihad Airways last
of MEB3to serve Ho Chi Minh City[retrieved 04 January 2015]. Avalaible on
Anna.Aero- Airline Network News and Analysis website:
http://www.anna.aero/2013/10/17/etihad-airways-becomes-last-of-meb3-to-serve-
ho-chi-minh-city/
Arab News. 2013. Etihad names new GM for Vietnam[retreived 01 October
2014]. Available on Arab News website: http://www.arabnews.com/etihad-names-
new-gm-vietnam
ATAG. 2012. Our Activities:Social and Economic Benefits of Aviation [retrieved
14 January 2015]. Available on Air Transport Action Group website:
http://www.atag.org/our-activities/social-a-economic-benefits-of-aviation.html
Avjobs. 2015.History of Aviation [retrieved 19 February 2015]. Availableon
Avjobs.Inc website: http://www.avjobs.com/history/
BaoViet Securities. 2014a. Tin tức: Tin đấu giá: Vì sao cổ phần SAGS nóng
“bỏng tay”[retrieved 29 February 2015,] Available on Chứng Khoáng Bảo Việt -
82
BaoViet Securities website: http://www.bvsc.com.vn/News/2014128/322008/vi-
sao-co-phan-sags-nong-bong-tay.aspx
BaoViet Securities. 2014b. Markets: News: Fierce Competitions in Vietnam
Commercial Air Transport [retrieved25 January 2015]. Available on BaoViet
Securities- BaoViet Securities website:
http://www.bvsc.com.vn/News/2014520/289583/khoc-liet-thi-truong-hang-
khong-viet-nam-ky-ii.aspx
CAAV. 2012. Home: News & Events: Establishment of a new Airports
Corporation in Vietnam [retrieved 10 February 2015]. Available on CAAV - Civil
Aviation Authority of Vietnam website:
http://www.caa.gov.vn/eDefault.aspx?tabid=8&catid=506&articleid=8569
CAAV. 2015. Thông Cáo Báo Chí: Thông cáo báo chí vê sô liệu thông kê sản
lương thông qua Cảng Hang không Quôc tê Tân Sân Nhất giai đoan 2005-2014.
[retrieved 10 February 2015]. Available on Cục Hang Không Việt Nam - Civil
Aviation Authority of Vietnam website:
http://www.caa.mt.gov.vn/Default.aspx?tabid=0&catid=419.435&articleid=10812
Chau, Q. 2014. Socials [retrieved 23 February 2015]. Availableon Dan Tri- Dan
Tri Vietnam Forum: http://dantri.com.vn/xa-hoi/viet-nam-xep-thu-7-thi-truong-
hang-khong-phat-trien-nhanh-nhat-the-gioi-937519.htm
Clayton, E., & Hilz, A. 2015. Industry Perspective: 2015 Aviation
Trends[retrieved 15 February 2015]. Availableon Strateg& PwC website:
http://www.strategyand.pwc.com/perspectives/2015-aviation-trends
Cronin, S. 2014. Business: Aviation: Middle East forecast to lead global aviation
growth [retrieved 29 January 2015]. Availableon The National Abu Dhabi media
website: http://www.thenational.ae/business/aviation/middle-east-forecast-to-lead-
global-aviation-growth
83
Etihad. 2010. About us: Corporate Profile: Factsheets & Reports: 2010 Business
Review [retrieved 16 December 2014]. Available on Etihad Airways - Abu Dhabi
website:
https://www.etihad.com/Documents/PDFs/Corporate%20profile/Corporate%20re
ports%20and%20CSR/Business-review-2010-en.pdf
Etihad. 2013. About us: Corporate Profile: Latest Annual Report [retrieved 01
October 2014]. Available on Etihad Airways - Abu Dhabi website:
http://resources.etihadairways.com/etihadairways/images/E_Book/HTML/Annual
_Report_2013_English.html#60/z
Etihad. 2014. About us: Corporate profile: Fast Facts and Figures: Q4 2014 –
English [retreived 29 April 2015]. Available on Etihad Airways - Abu Dhabi
website:
http://www.etihad.com/Documents/PDFs/Corporate%20profile/Fast%20facts/Q4-
2014-Eng.pdf
Etihad. 2015a. About Us: Corporate Profile [retrieved 09 January 2015].
Availableon Etihad Airways - Abu Dhabi website: http://www.etihad.com/en-
fi/about-us/corporate-profile/
Etihad. 2015b. Careers: Corporate: The World’s Leading Industry Innovators
[retrieved 28 April 2015]. Available on Etihad Airways - Abu Dhabi website:
http://www.etihad.com/en-vn/careers/corporate/
FocusEconomics. 2015. Countries: Vietnam [retrieved 01 March 2015]. Available
on FocusEconomics: Economic Forecasts from the World's Leading Economists
website: http://www.focus-economics.com/countries/vietnam
Freshfields Bruckhaus Deringer. 2014. Air Traffic Infrastructure Current Status
and Impending Changes, Vietnam – 2014 [retrieved 09 March 2015]. Available
on FreshfieldsBruchausDeringer website:
http://www.freshfields.com/uploadedFiles/SiteWide/Knowledge/Indochina_notes/
84
Sector%20Update%20on%20Air%20Traffic%20Infrastructure%20-
%20Vietnam%202014.PDF
Gantt.com. 2012. What is a Gantt chart?[retrieved 07 March 2015]. Availableon
Gantt.com website: http://www.gantt.com/
Garlick, A. 2015. RiskBites: Qualitative Risk Analysis [retrieved 14 March 2015].
Availableon The Risk Agenda- shaping your business future website:
http://www.riskagenda.com/bite6.htm
General Statistics Office of Vietnam. 2014. Statistics: Population and
Employment [retrieved 01 May 2015]. Available on General Statistics Office of
Vietnam website: http://www.gso.gov.vn/default_en.aspx?tabid=774
Ha, B. 2015. Kinh tê: Kinh doanh: Mỹ "tô" các hãng bay vùng Vịnh canh tranh
không lanh manh [retrieved 13 March 2015]. Availableon Vietnam Plus, TTXVN
website: http://www.vietnamplus.vn/my-to-cac-hang-bay-vung-vinh-canh-tranh-
khong-lanh-manh/311289.vnp
Hofstede, G. 2010. Cultural Tools: Country Comparison: Vietnam [retrieved 26
February 2015]. Available on The Hofstede Center website: http://geert-
hofstede.com/vietnam.html
IATA. 2013. Press Releases: Facts and Figures: New Year’s Day 2014 marks 100
Years of Commercial Aviation[retrieved 09 February 2015]. Availableon IATA
website: http://www.iata.org/pressroom/pr/Pages/2013-12-30-01.aspx
IATA. 2014a. Press Release: New IATA Passenger Forecast Reveals Fast-
Growing Markets of the Future [retrieved 05 March 2015]. Available on IATA
website: http://www.iata.org/pressroom/pr/Pages/2014-10-16-01.aspx
IATA. 2014b. Pressroom: Speeches [retrieved 04 March 2015]. Available on
IATA website: http://www.iata.org/pressroom/speeches/Pages/2014-10-14-
01.aspx
85
IATA. 2015. Publications: Economics: Market Development: Air Passenger
Monthly Analysis: Feb2015 [retreived 25 February 2015]. Available on IATA
website: http://www.iata.org/whatwedo/Documents/economics/passenger-
analysis-feb-2015.pdf
ICAO. 2009. Meetings & Events : Tenth Session of the Statistics Devision
(STA/10): STA/10 Documentation: STA/10-WP/7: Review of the classification of
the definitions used for civil aviation activities (Presented by the ICAO
Secretariat: English[retrieved 27 February 2015] Available on ICAO website:
http://www.icao.int/Meetings/STA10/Documents/Sta10_Wp007_en.pdf
ILO. 2013. Home: About the ILO: How the ILO works: Departments and offices
Sectoral Policies Department (SECTOR): Resources: Publications: Civil Aviation
and its Changing World of Work (Geneva, 20-22 February 2013): Download:
English [retreived 27 February 2015]. Available on ILO website:
http://www.ilo.org/sector/Resources/publications/WCMS_201282/lang--
en/index.htm
Kar, A. 2011. Advertising & Branding, Marketing, Marketing Theory, Sales &
Distribution: The 4 P’s Of Marketing – The Marketing Mix Strategies [retrieved
07 March 2015]. Available on Business Fundas- An Educational Initiative
Offering Insights in Business & Management website: http://business-
fundas.com/2011/the-4-ps-of-marketing-the-marketing-mix-strategies/
Kroo, I., & Alonso, J. 2005. AA24 Course, Aircraft Design: Synthesis &
Analysis: Aircraft Aerodynamics and Design Group, 09: Desktop Aeronautics Inc
[retrieved 14 January 2015]. Availableon ADG Standford University website:
http://adg.stanford.edu/aa241/intro/airlineindustry.html
Merriam- Webster. 2015. Dictionary: Search: Aviation [retrieved 03 March
2015]. Available on Merriam-Webster: An Enclopaedia Britannica Company
website: http://www.merriam-webster.com/dictionary/aviation
86
Ministry of Foreign Affairs. 2013. Các nước va khu vực: Trung Đông: Diễn đan
hơp tác kinh tê Việt Nam-Trung Đông-Bắc Phi: Thông tin vê diễn đan [retreived
01 May 2015]. Available on Ministry of Foreign Affairs Vietnam website:
http://www.mofahcm.gov.vn/vi/mofa/cn_vakv/nr040830134623/copy3_of_nr120
518142443/nr120518142557/ns131101170410
Mongay, J. 2006. Strategic Marketing: A Literature Review on Definitions,
Concepts and Boundaries [retreived 17 March 2015].Available on MPRA-Munich
Personal RePEc Archive – database: http://mpra.ub.uni-
muenchen.de/41840/1/mpra_paper_41840.pdf
Nguyen, P. 2015. Business: Economy: Vietnam's economic outlook in 2015
[retrieved 25 February 2015]. Available on NhanDan Online - The Central Organ
of The Communist Party of Vietnam, The Voice of the Party, State and People of
Vietnam website: http://en.nhandan.org.vn/business/economy/item/3052002-
vietnam-s-economic-outlook-in-2015.html
Numbeo, 2015. Cost of Living: Vietnam [retrieved 29 April 2015]. Available on
Numbeo website: http://www.numbeo.com/cost-of-
living/country_result.jsp?country=Vietnam
Porter, M. 2008. Havard Business Review:The Five Forces That Shape Strategy
[retreived 17 March 2015]. Available on Havard Business Review –database:
http://www.exed.hbs.edu/assets/documents/hbr-shape-strategy.pdf
Qatar Airways. 2015. About Qatar Airways: Group Chief Executive’s
MESSAGE [retreived 14 April 2015]. Available on Qatar Airways website:
http://www.qatarairways.com/vn/en/ceo-message.page
Qatar Airways. 2015b. Resources: The Qatar Airways Story [retrieved 14 April
2015]. Available on Qatar Airways website:
http://www.qatarairways.com/iwov-resources/temp-docs/press-
kit/The%20Story%20of%20Qatar%20Airways%20-%20English.pdf
87
Qatar Airways. 2015c. Company: About Qatar Airways: Qatar Airways Group
[retreived 14 April 2015]. Available on Qatar Airways website:
http://www.qatarairways.com/global/en/group-companies.page
Quang Nam Tourism. 2013. Tin tức va Sự Kiện:Etihad Airways bay thẳng đên
TPHCM năm 2013[retreived 09 March 2015]. Available on Du Lịch Quảng Nam
website: http://www.quangnamtourism.com.vn/vn/tin5121.asp
Riley, J. (2012, 09 23). Business: Strategy: Objectives[retrieved 09 March 2015]
from tutor2u website: http://www.tutor2u.net/business/strategy/objectives.htm
Rodrigue, D. J.-P. (2015). Transport mode: Air Transport[retrieved 28 March
2015]. Available on The Geography of Transport Systems website:
https://people.hofstra.edu/geotrans/eng/ch3en/conc3en/hubspokederegulation.html
SAA. 2015. Tin Tức: Các Hãng Hang Không [retrieved 17 March 2015].
Available on Cảng Vụ Hang Không Miên Nam- Southern Airports Authority
website: http://saa.gov.vn/vn/modules.php?name=News&op=viewst&sid=5
Smith Jr, F., Cox, B. 2008. Encyclopedia: Search CEE: Airline Deregulation
[retrieved 12 March 2015]. Available on ECONLIB- Library of Economics and
Liberty -database: http://www.econlib.org/library/Enc/AirlineDeregulation.html
Smith, P. 2015. SOSTAC Planning [retrieved 05 January 2015]. Available on
PRSMith Marketing Success website: http://prsmith.org/sostac/
Tai Chinh. 2014. Nghien Cuu Trao Doi: Trao Doi - Binh Luan [retrieved 02
March 2015]. Available on Tai Chinh - Co Quan cua Bo Tai Chinh website:
http://www.tapchitaichinh.vn/Trao-doi-Binh-luan/Tiem-nang-phat-trien-thi-
truong-hang-khong-Viet-Nam/54382.tctc
Thuy, P. 2014. Bộ Tai Chính: Trang Thông Tin Quản Lý Nha Nước vê Giá va
Thẩm Định Giá:Canh Tranh Trên Thị Trường Hang Không Việt Nam [retreived
25 February 2015]. Available on Bộ Tai Chính website:
http://qlg.mof.gov.vn/portal/pls/portal/SHARED_APP.UTILS.print_preview?p_p
88
age_url=http%3A%2F%2Fqlg.mof.gov.vn%2Fportal%2Fpage%2Fportal%2Fqlg
%2F76328750&p_itemid=130599290&p_siteid=354&p_persid=76333440&p_la
nguage=vi
Vietnam Airlines-a. 2013. About Us: Our Background - History of Vietnam
Airlines [retrieved 01 March 2015]. Available on Vietnam Airlines website:
http://www.vietnamairlines.com/en/about-us/our-background
Vietnam Airlines-b. 2013. Flight Info: Route Maps[retrieved 01 March 2015].
Availableon Vietnam Airlines website: http://www.vietnamairlines.com/vi/lich-
bay/mang-duong-bay
Vietnamshipper. 2013. Tin tức: Etihad Airways Khai Trương Chuyên Bay Hằng
Ngay Đên Việt Nam [retrieved 26 January 2015]. Available on AVINA Customs
Ltd., website: http://avinacustoms.com/tin-tuc-xem/110/etihad-airways-khai-
truong-chuyen-bay-hang-ngay-den-viet-nam/danacus.html
Worldmeters. 2015. Population: Population by Country: Vietnam [retrieved 11
March 2015]. Availableon Worldmeters website:
http://www.worldometers.info/world-population/vietnam-population/
World Bank Group. 2015. Countries: Vietnam Overview [retrieved 10 March
2015]. Available on The World Bank: Working for a World Free of Poverty
website: http://www.worldbank.org/en/country/vietnam/overview
Interview References
Dao, T. 2015. Sales Agent. Etihad Airways Vietnam. Interview 25 March 2015.

89
APPENDICES
APPENDIX 1. List of operating airlines at Tan Son Nhat International
Airport(SAA, 2015)
1. AIR FRANCE (AF)
2. ASIANA AIRLINES (OZ)
3. AIR CHINA (CA)
4. ALL NIPPON AIRWAYS (NH)
5. CHINA AIRLINES (CI)
6. CATHAY PACIFIC AIRWAYS (CX)
7. CHINA SOUTHERN AIRLINES (CZ)
8. EVA AIRWAYS (BR)
9. GARUDA AIRLINES (GA)
10. JAPAN AIRLINES (JL)
11. JET STAR AIRWAYS (JQ)
12. KOREAN AIR (KE)
13. LUFTHANSA (LH)
14. MALAYSIA AIRLINES (MH)
15. MANDARIN AIRLINES (AE)
16. PHILIPINES AIRLINES (PR)
17. ROYAL BRUNEI (BI)
18. SINGAPORE AIRLINES (SQ)
19. SHENZHEN AIRLINES (ZH)
20. SHANGHAI AIRLINES (FM)
21. THAI AIRWAYS (TG)
22. TIGER AIRWAYS (TR)
23. UNITED AIRLINES (UA)
24. UNI AIR (B7)
25. BANGKOK AIRWAYS (PG)
26. QATAR AIRWAYS (QR)
27. JET STAR ASIA (3K)
90
28. HONG KONG AIRLINES (HX)
(To be continued, see next page)
29. VIVA MACAU (ZG)
30. THAI AIR ASIA(FD)
31. CEBU PACIFIC AIR (5J)
32. LION MENTARI AIRLINES (JT)
33. SHANGHAI AIRLINES CARGO (F4)
34. K-MILE AIR (8K)
35. FEDERAL EXPRESS (FX)
36. CARGOITALIA AIRLINES (2G)
37. CARGOLUX AIRLINES (CV)
38. TRANSAERO AIRLINES (UN)
39. UNIVERSAL WEATHER & AVIATION (TNT)
40. AIR ASIA BERHAD (AK)
41. QANTAS AIRWAYS (QR)
91
APPENDIX 2. List of Etihad Airways’ Codeshare Partnerships
Aegean Airlines
AerolineasArgentinas
Aer Lingus
Air Astana
airBaltic
airberlin
Air Canada
Air Europa
Air France
Air Malta
Air New Zealand
AirSERBIA
Air Seychelles
Alitalia
All Nippon Airways
American Airlines
Asiana Airlines
Bangkok Airways
Belavia (Belarusian Airlines)
SN Brussels Airlines
China Eastern Airlines
Cyprus Airways
Czech Airlines
Darwin Airline (Etihad Regional)
Flybe
Garuda Indonesia
GolLinhasAéreasInteligentes
Hainan Airlines
Hong Kong Airlines
Jet Airways
92
JetBlue Airways
Kenya Airways
KLM Royal Dutch Airlines
Korean Air Lines
Malaysia Airlines
Middle East Airlines
NAS Air (flynas)
Niki (flyniki)
Philippine Airlines
Royal Air Maroc
SAS
Siberia Airlines (S7 Airlines)
SNCF
South African Airways
SriLankan Airlines
TAP Portugal
Turkish Airlines
Vietnam Airlines
Virgin Australia
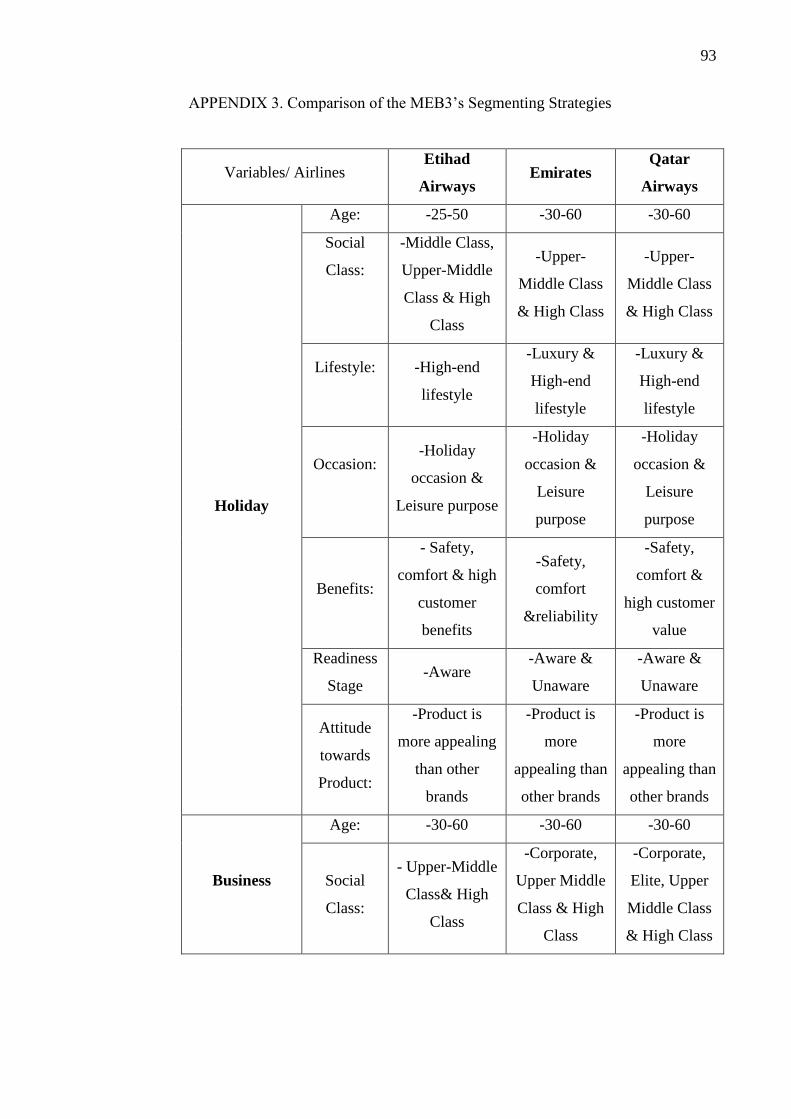
93
APPENDIX 3. Comparison of the MEB3’s Segmenting Strategies
Variables/ Airlines Etihad
Airways Emirates
Qatar
Airways
Holiday
Age: -25-50 -30-60 -30-60
Social
Class:
-Middle Class,
Upper-Middle
Class & High
Class
-Upper-
Middle Class
& High Class
-Upper-
Middle Class
& High Class
Lifestyle:
-High-end
lifestyle
-Luxury &
High-end
lifestyle
-Luxury &
High-end
lifestyle
Occasion:
-Holiday
occasion &
Leisure purpose
-Holiday
occasion &
Leisure
purpose
-Holiday
occasion &
Leisure
purpose
Benefits:
- Safety,
comfort & high
customer
benefits
-Safety,
comfort
&reliability
-Safety,
comfort &
high customer
value
Readiness
Stage -Aware
-Aware &
Unaware
-Aware &
Unaware
Attitude
towards
Product:
-Product is
more appealing
than other
brands
-Product is
more
appealing than
other brands
-Product is
more
appealing than
other brands
Business
Age: -30-60 -30-60 -30-60
Social
Class:
- Upper-Middle
Class& High
Class
-Corporate,
Upper Middle
Class & High
Class
-Corporate,
Elite, Upper
Middle Class
& High Class
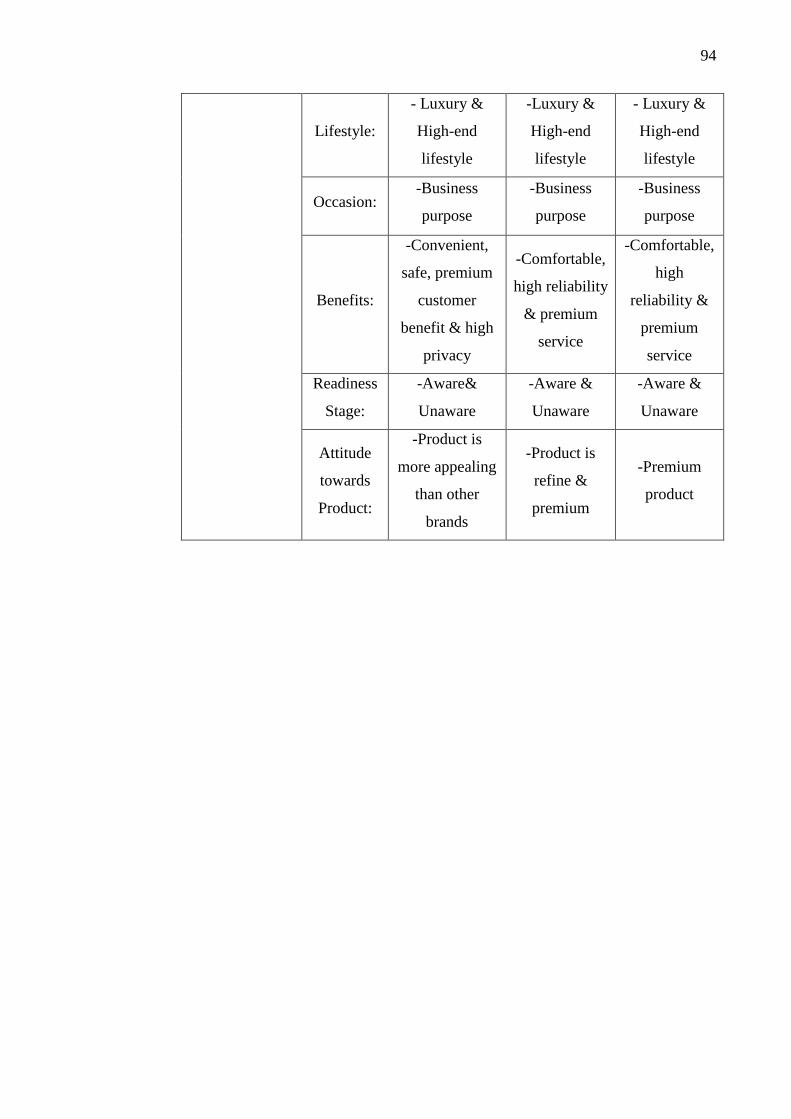
94
Lifestyle:
- Luxury &
High-end
lifestyle
-Luxury &
High-end
lifestyle
- Luxury &
High-end
lifestyle
Occasion: -Business
purpose
-Business
purpose
-Business
purpose
Benefits:
-Convenient,
safe, premium
customer
benefit & high
privacy
-Comfortable,
high reliability
& premium
service
-Comfortable,
high
reliability &
premium
service
Readiness
Stage:
-Aware&
Unaware
-Aware &
Unaware
-Aware &
Unaware
Attitude
towards
Product:
-Product is
more appealing
than other
brands
-Product is
refine &
premium
-Premium
product
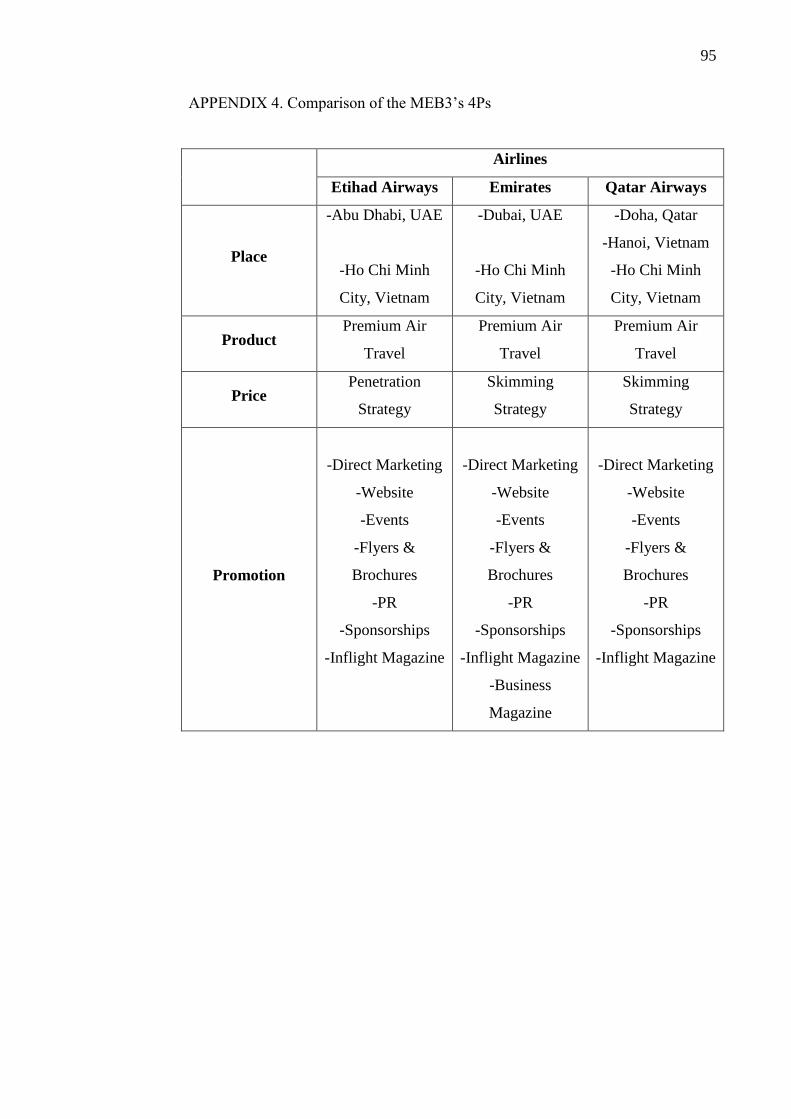
95
APPENDIX 4. Comparison of the MEB3’s 4Ps
Airlines
Etihad Airways Emirates Qatar Airways
Place
-Abu Dhabi, UAE
-Ho Chi Minh
City, Vietnam
-Dubai, UAE
-Ho Chi Minh
City, Vietnam
-Doha, Qatar
-Hanoi, Vietnam
-Ho Chi Minh
City, Vietnam
Product Premium Air
Travel
Premium Air
Travel
Premium Air
Travel
Price Penetration
Strategy
Skimming
Strategy
Skimming
Strategy
Promotion
-Direct Marketing
-Website
-Events
-Flyers &
Brochures
-PR
-Sponsorships
-Inflight Magazine
-Direct Marketing
-Website
-Events
-Flyers &
Brochures
-PR
-Sponsorships
-Inflight Magazine
-Business
Magazine
-Direct Marketing
-Website
-Events
-Flyers &
Brochures
-PR
-Sponsorships
-Inflight Magazine
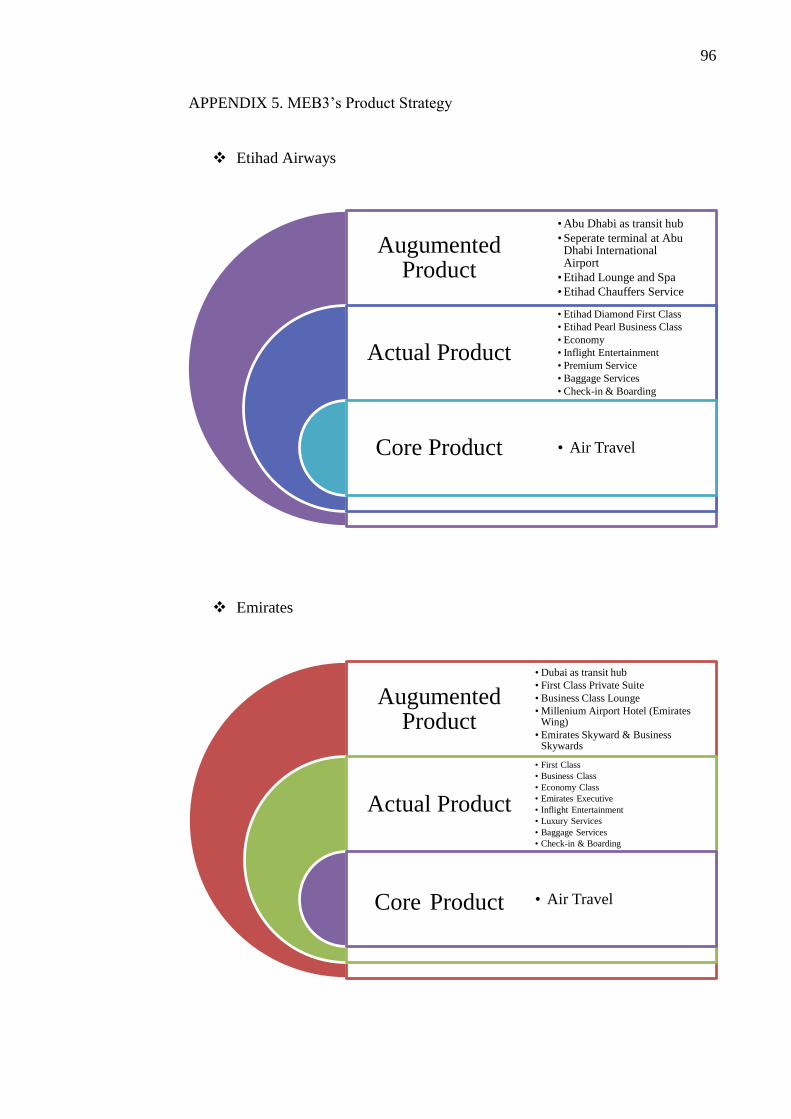
96
APPENDIX 5. MEB3’s Product Strategy
Etihad Airways
Emirates
Augumented Product
Actual Product
Core Product
• Abu Dhabi as transit hub
• Seperate terminal at Abu Dhabi International Airport
• Etihad Lounge and Spa
• Etihad Chauffers Service
• Etihad Diamond First Class
• Etihad Pearl Business Class
• Economy
• Inflight Entertainment
• Premium Service
• Baggage Services
• Check-in & Boarding
• Air Travel
Augumented Product
Actual Product
Core Product
• Dubai as transit hub
• First Class Private Suite
• Business Class Lounge
• Millenium Airport Hotel (Emirates Wing)
• Emirates Skyward & Business Skywards
• First Class
• Business Class
• Economy Class
• Emirates Executive
• Inflight Entertainment
• Luxury Services
• Baggage Services
• Check-in & Boarding
• Air Travel
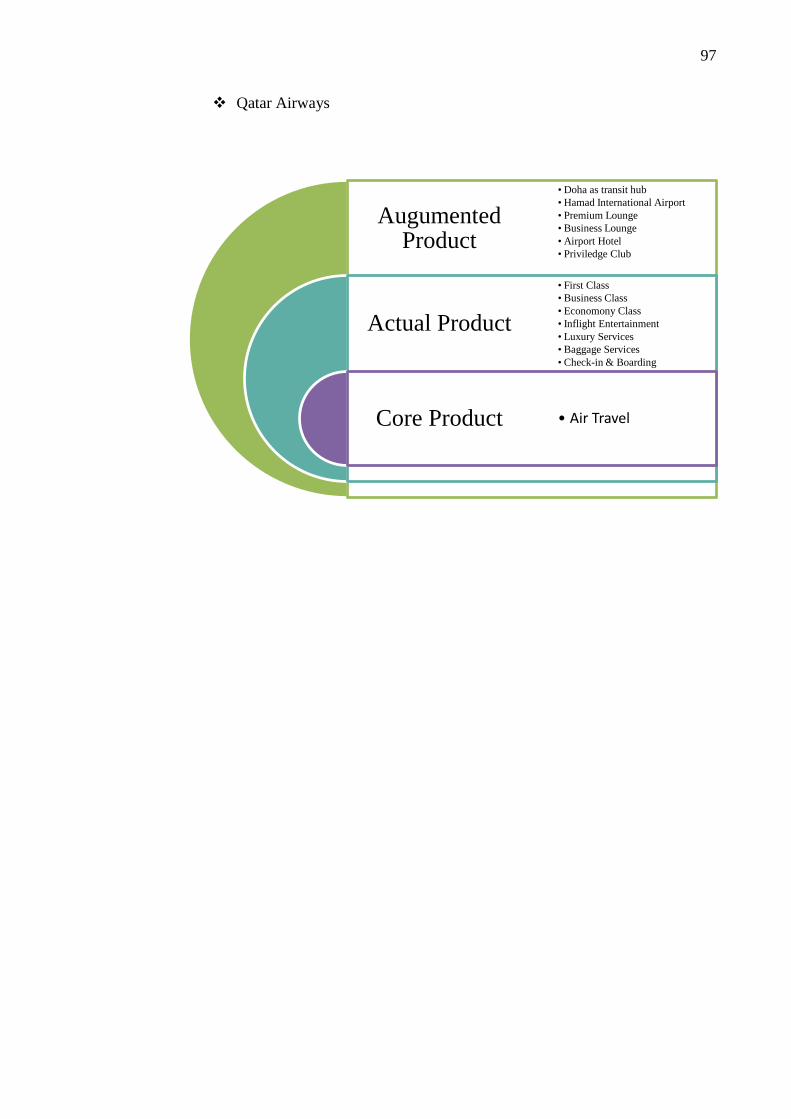
97
Qatar Airways
Augumented Product
Actual Product
Core Product
• Doha as transit hub
• Hamad International Airport
• Premium Lounge
• Business Lounge
• Airport Hotel
• Priviledge Club
• First Class
• Business Class
• Economony Class
• Inflight Entertainment
• Luxury Services
• Baggage Services
• Check-in & Boarding
• Air Travel
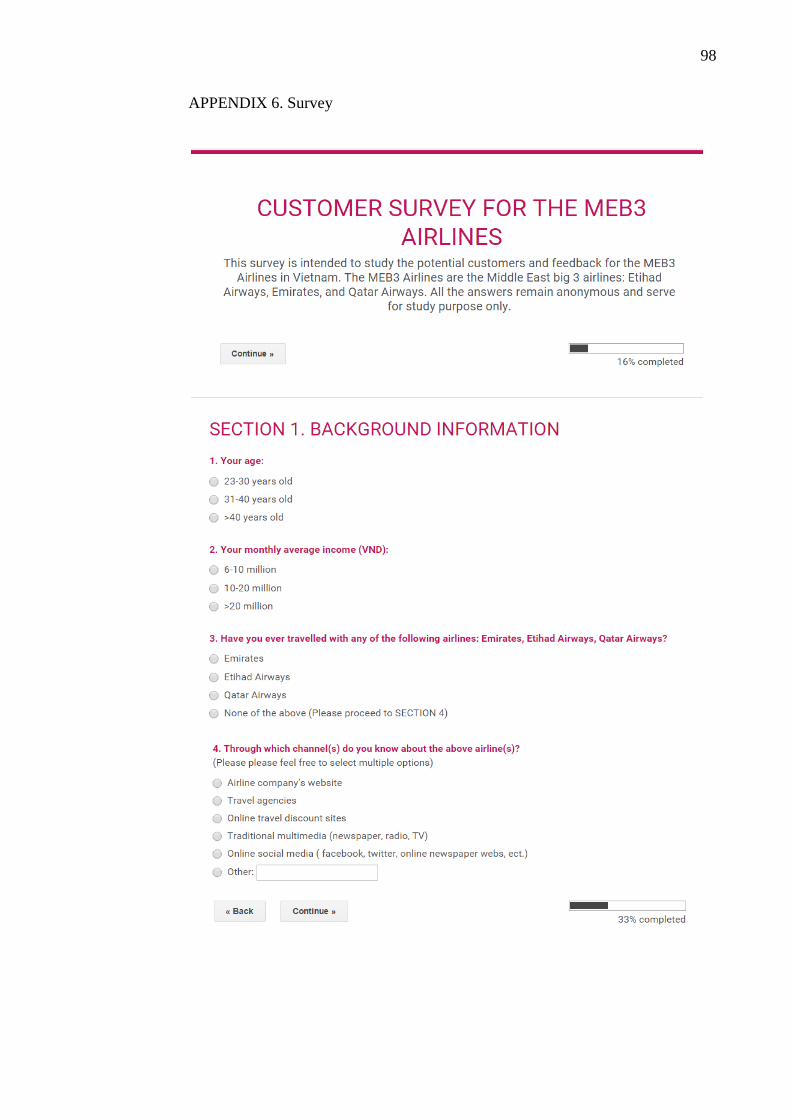
98
APPENDIX 6. Survey
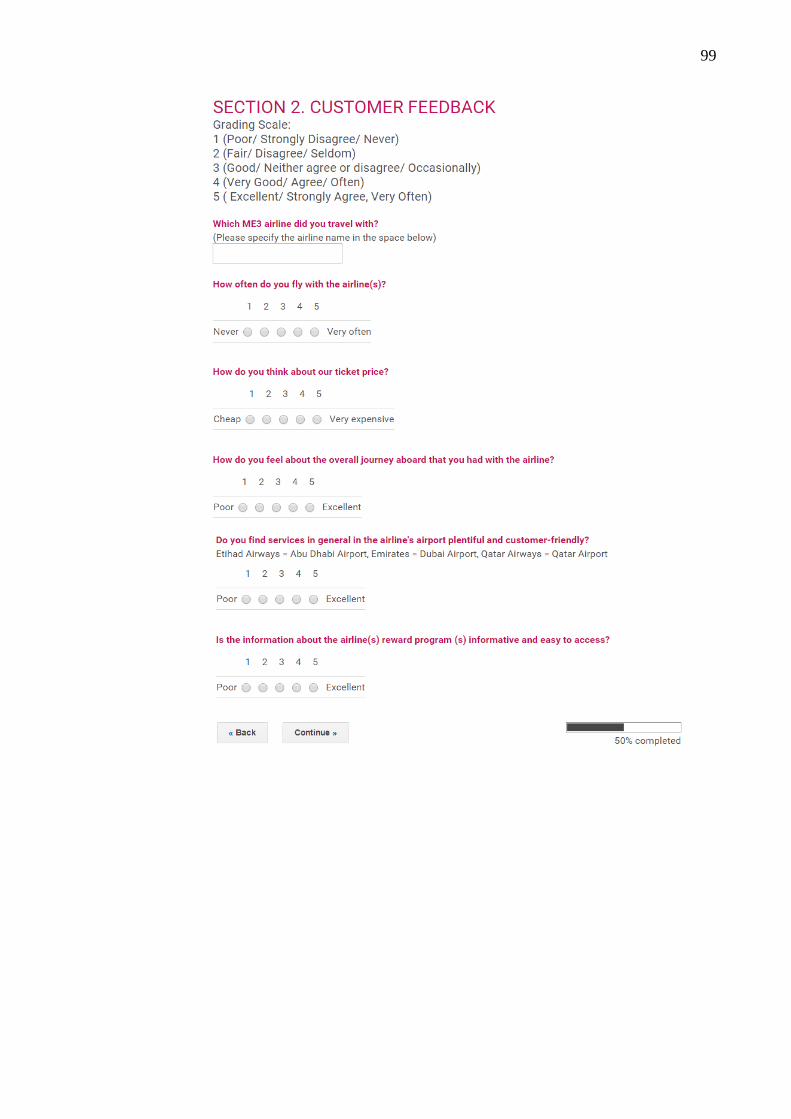
99

100
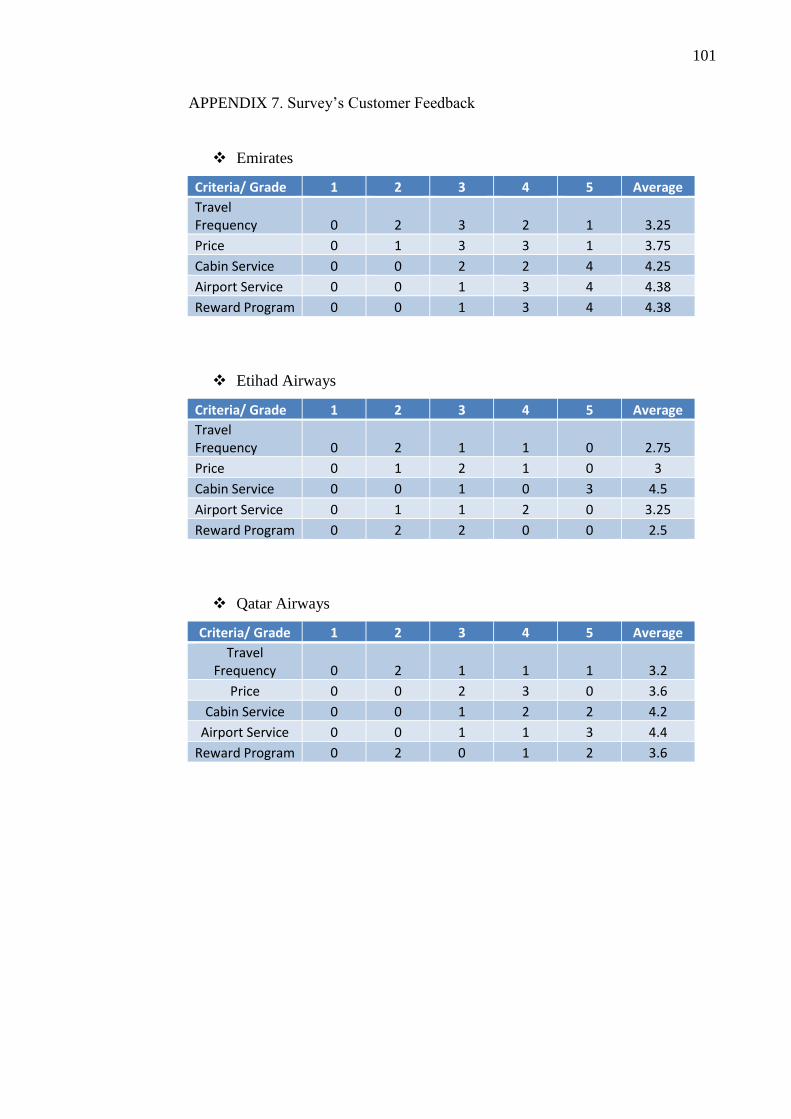
101
APPENDIX 7. Survey’s Customer Feedback
Emirates
Criteria/ Grade 1 2 3 4 5 Average
Travel Frequency 0 2 3 2 1 3.25
Price 0 1 3 3 1 3.75
Cabin Service 0 0 2 2 4 4.25
Airport Service 0 0 1 3 4 4.38
Reward Program 0 0 1 3 4 4.38
Etihad Airways
Criteria/ Grade 1 2 3 4 5 Average
Travel Frequency 0 2 1 1 0 2.75
Price 0 1 2 1 0 3
Cabin Service 0 0 1 0 3 4.5
Airport Service 0 1 1 2 0 3.25
Reward Program 0 2 2 0 0 2.5
Qatar Airways
Criteria/ Grade 1 2 3 4 5 Average
Travel Frequency 0 2 1 1 1 3.2
Price 0 0 2 3 0 3.6
Cabin Service 0 0 1 2 2 4.2
Airport Service 0 0 1 1 3 4.4
Reward Program 0 2 0 1 2 3.6
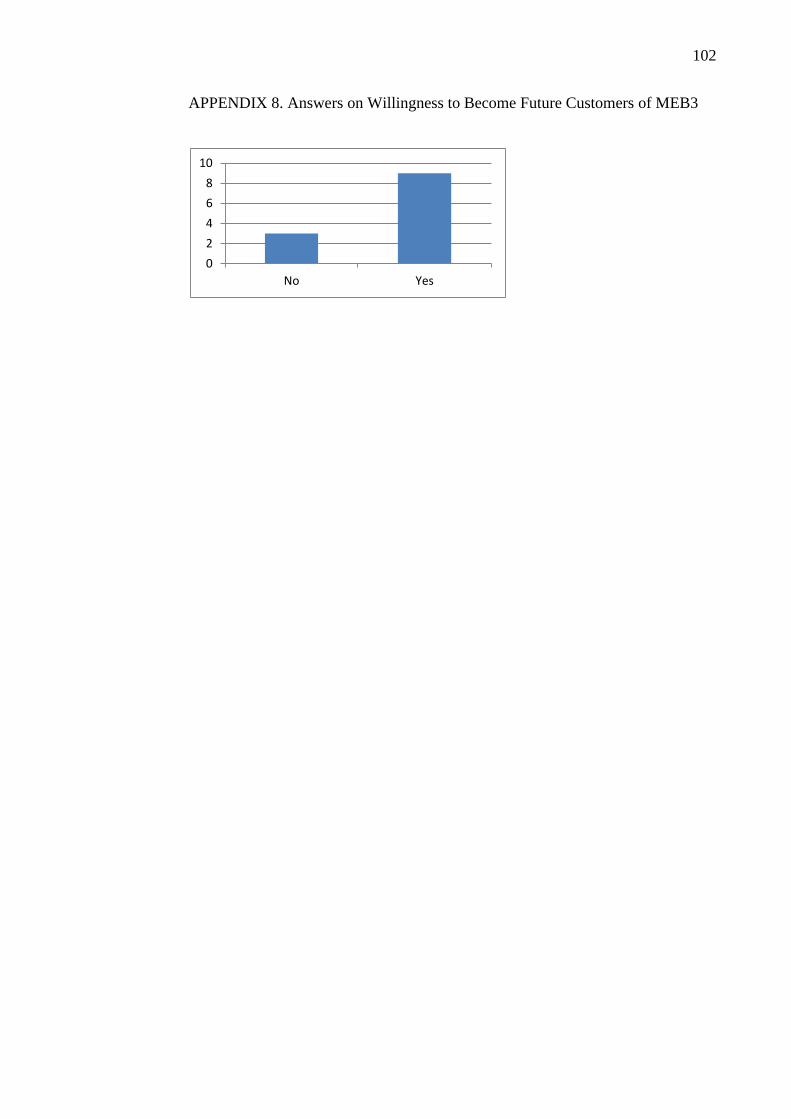
102
APPENDIX 8. Answers on Willingness to Become Future Customers of MEB3
0
2
4
6
8
10
No Yes


